

Abstract
Pancreatic ductal adenocarcinoma (PDAC) is characterized by KRAS-and autophagy-dependent tumorigenic growth, but the role of KRAS in supporting autophagy has not been established. We show that, to our surprise, suppression of KRAS increased autophagic flux, as did pharmacological inhibition of its effector ERK MAPK. Furthermore, we demonstrate that either KRAS suppression or ERK inhibition decreased both glycolytic and mitochondrial functions. We speculated that ERK inhibition might thus enhance PDAC dependence on autophagy, in part by impairing other KRAS-or ERK-driven metabolic processes. Accordingly, we found that the autophagy inhibitor chloroquine and genetic or pharmacologic inhibition of specific autophagy regulators synergistically enhanced the ability of ERK inhibitors to mediate antitumor activity in KRAS-driven PDAC. We conclude that combinations of pharmacologic inhibitors that concurrently block both ERK MAPK and autophagic processes that are upregulated in response to ERK inhibition may be effective treatments for PDAC.
Mutational activation of KRAS is the critical genetic driver of pancreatic ductal adenocarcinoma (PDAC) initiation and progression1 and is essential for maintenance of PDAC tumorigenic growth2,3. Given that 95% of PDAC harbor KRAS driver the mutations, the National Cancer Institute has identified the development of anti-KRAS therapies as one of four priorities for pancreatic cancer research4,5. There are at least five major directions of current anti-KRAS drug discovery6–8. One promising strategy aims to target mechanisms that mediate the KRAS-dependent metabolic functions that support the increased energy needs of PDAC9,10. One such function is macroautophagy (autophagy, or ‘self-eating’), a lysosome-mediated process whereby cells degrade organelles and macromolecules and recycle cellular waste11. The resulting breakdown products are used as bioenergetic intermediates to sustain metabolic requirements. Because autophagy both is upregulated in KRASmutant PDAC12 and is critical for tumorigenic growth13 the autophagy inhibitor hydroxychloroquine is under clinical evaluation for PDAC treatment (clinical trials NCT01273805, NCT01506973 and NCT03344172). Hydroxychloroquine has shown limited activity as a monotherapy14,15; but has shown promise in combination with preoperative gemcitabine plus nab-paclitaxel (NCT01978184)16. It has been assumed, albeit not demonstrated, that KRAS drives high basal levels of autophagy seen in KRAS-mutant PDAC. Therefore, to identify better therapeutic strategies, we first examined mechanisms whereby mutant KRAS contributes to autophagy in PDAC. We demonstrate that acute suppression of KRAS further elevated rather than decreased the already high basal levels of autophagy in a panel of human and mouse PDAC cell lines. BRAF inhibition in BRAF-mutant melanoma also increases autophagy17,18. Additionally, we recently showed that the rare subpopulation (<10%) of mouse PDAC cells that survive chronic ablation of Kras G12D become more dependent on autophagy and mitochondrial respiration19. In this study, we evaluated PDAC cells after acute ablation of mutant KRAS and determined that ERK inhibition phenocopied KRAS suppression and caused increased autophagy. We observed that autophagy was elevated at multiple levels, including increased autophagosome flux, phosphorylation and activation of AMPK and Beclin-1, downregulation of the mTOR pathway, and increased transcription of autophagy-related genes. Using several complementary experimental strategies, we determined that, in contrast to increasing autophagy, ERK inhibition impaired other metabolic processes such as glycolysis and mitochondrial function, which led to even greater dependence on autophagy. We then exploited this dependency, demonstrating that parallel inhibition of ERK synergistically enhanced chloroquine-mediated inhibition of PDAC growth. We conclude that inhibitor combinations that concurrently block multiple metabolic processes including autophagy may be an effective therapeutic approach for pancreatic cancer.
Results
KRAS suppression elevates autophagic flux.
Basal levels of autophagy are very high in KRAS-mutant human pancreatic cancer cell lines12,13,20. To determine whether continued function of mutant KRAS is essential to maintain those high levels of autophagy in PDAC, we used three techniques to investigate changes in autophagic flux21 upon acute suppression of KRAS (Extended Data Fig. 1a). First, we assessed autophagic flux in a panel of PDAC cell lines stably expressing the tandem fluorescence reporter mCherryEGFP-LC3B21. LC3B is an autophagy-related protein that undergoes post-translational modifications that lead to its lipidation and association with autophagic vesicles22. Acute KRAS suppression using a previously validated siRNA oligo23 increased autophagic flux by two-to ten-fold in six of seven KRAS-mutant human PDAC cell lines (Fig. 1a,b and Supplementary Fig. 1a). Recently, compounds with high selectivity and potency for KRAS G12C have been developed24. Treatment of KRAS G12C–mutant MIA PaCa-2 cells with the RAS inhibitor ARS-1620 led to a similar increase in autophagic flux (Fig. 1c and Supplementary Fig. 1b). Second, we examined autophagosome assembly by exogenously expressing EGFP-LC3B and monitoring autophagosome-associated punctae formation (Extended Data Fig. 1b,c). These results indicate that the increased punctae observed upon KRAS suppression were due to increased autophagic flux, not simply to changes in steady state. As a third complementary method, we performed immunoblotting to monitor conversion of endogenous LC3B-I to the lipidated, autophagosome-associated form, LC3B-II. Our results are in agreement with the fact that this method can be confounded in tumorderived cell lines with basally high levels of LC3B-II21. However, we observed that siRNA-induced KRAS suppression increased the ratio of LC3B-II to LC3B-I, and that this increased ratio was maintained when autophagosome degradation was inhibited with bafilomycin A1 (Fig. 1d). Thus, suppression of KRAS increased autophagic flux in KRAS-mutant PDAC cell lines, as demonstrated by increases in autophagosome formation, lysosomal fusion and autophagosomeassociated LC3B-II.
Fig. 1. KRAS suppression increases autophagic flux in KRAS-mutant PDAC cell lines.
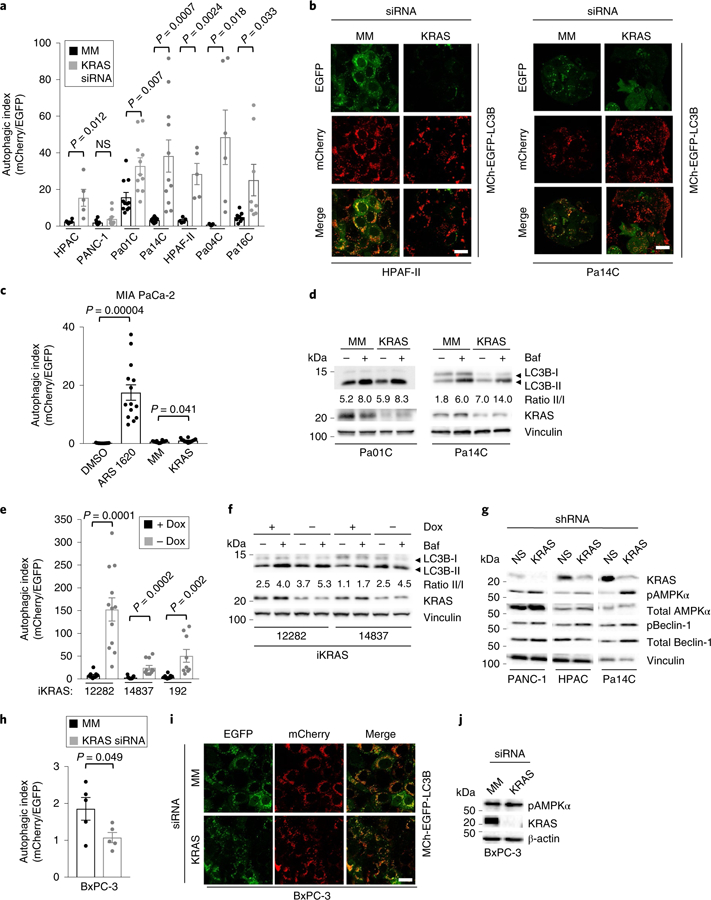
a, PDAC cell lines were stably infected with a lentiviral vector encoding mCherry-EGFP-LC3B and then transiently transfected with siRNA targeting KRAS (KRAS) or a mismatch control oligo (MM) (72 h). To quantify autophagic flux, the area ratios of mCherry+ punctae to EGFP+ punctae (autophagic index) were determined. Mean autophagic index is plotted, with each individual data point representing one field containing at least ten analyzed cells. Data for HPAC, PANC-1, Pa01C and Pa14C represent two independent experiments; data for HPAF-II, Pa04C and Pa16C cells represent one independent experiment. b, Representative images of cells described and quantified in a, which visualize autophagosomes (EGFP+ and mCherry+) and autophagolysosomes (mCherry+ only). Scale bar, 20 μm. c, MIA PaCa-2 cells expressing mCherry-EGFP-LC3B were transfected with siRNA targeting KRAS as described in a or treated with ARS-1620 (10 μM, 24 h), and the mean autophagic index was determined. Data are representative of three independent experiments. d, PDAC cell lines were transiently transfected with siRNA as described in a and treated with bafilomycin A1 (Baf, 200 nM, 2 h) to assess flux. Immunoblot analyses of cell lysates were done to determine the levels of LC3B, KRAS and vinculin (control for total protein) and are representative of three independent experiments. e, Three cell lines derived from the iKRAS doxycycline-inducible PDAC mouse model were stably infected with a lentiviral vector encoding mCherry-EGFP-LC3B. Doxycycline was removed (–Dox) from the medium for 24 h, and mean autophagic flux was assessed as described in a. Data are representative of two independent experiments. f, iKRAS cells were deprived of doxycycline for 24 h to silence Kras G12D expression and treated with Baf (200 nM, 2 h) to assess autophagic flux. Immunoblots were performed as in d and are representative of three independent experiments. g, PDAC cell lines were stably infected with lentiviral vectors encoding shRNA targeting KRAS or a nonspecific control (96 h). Immunoblots were done to determine the levels of phosphorylated AMPKα (pAMPKα), total AMPKα, phosphorylated Beclin-1 (pBeclin-1), total Beclin-1, KRAS and vinculin and are representative of three independent experiments. h, BxPC-3 cells were processed and imaged as described in a. Mean autophagic index of five independent experiments is plotted. i, Representative images of BxPC-3 cells as described in h (scale bar, 20 μm), representative of five independent experiments. j, BxPC-3 cells were transiently transfected with siRNA as in a and immunoblotted to determine the levels of pAMPKα, KRAS and β-actin (control for total cellular protein); immunoblots are representative of three independent experiments. All P values shown are from unpaired, two-sided t-test. Error bars represent s.e.m.
We next extended these results to a well-characterized doxycycline-inducible Kras G12D–driven mouse model of PDAC (iKRAS) that has been used to implicate KRAS as a critical driver of metabolic signaling in PDAC3. In three tumor cell lines established from this model, we observed both a 7-to 20-fold increase in the autophagic index upon acute (24 h) suppression of Kras G12D by doxycycline withdrawal (–Dox, Fig. 1e; Supplementary Fig. 1c) and an increase in the ratio of LC3B-II to LC3B-I as visualized by immunoblotting (Fig. 1f). Thus, in both human and mouse PDAC, suppression of mutant KRAS led to increased, rather than decreased, autophagy.
AMPK and Beclin-1 are key drivers of early-stage autophagy initiation and phagophore assembly25. Having established that KRAS silencing induces autophagic flux, we next tested whether upstream autophagic signaling could be influenced by perturbations in KRAS levels. Consistent with increased rather than decreased autophagy, we found that shRNA-mediated KRAS suppression increased the activating phosphorylation of AMPK and either activated or increased the level of total Beclin-1 in a panel of KRAS-mutant PDAC cell lines (Fig. 1g) and iKRAS cells (Supplementary Fig. 1d). Additionally, gene set variation analysis (GSVA)26 of RNA sequencing (RNA-seq) data from a panel of ten KRAS-mutant PDAC cell lines revealed that transient shRNA suppression of KRAS in nine of ten lines was associated with increased transcription of genes encoding proteins that drive autophagy (Supplementary Table 1 and Supplementary Fig. 1e). In contrast to the increased autophagic flux and AMPK activation observed in KRAS-mutant PDAC lines, KRAS suppression led to neither of these in the KRAS wild-type PDAC cell line BxPC-3, which harbors mutationally activated BRAF rather than mutant KRAS (Fig. 1h,j). Furthermore, KRAS G12V transformation of immortalized HPNE human pancreatic duct– derived cells27 decreased autophagic flux (Supplementary Fig. 1f,h). Similarly, KRAS G12V transformation of rat intestinal epithelial cells (RIE-1) decreased autophagic flux (Supplementary Fig. 1i,k). Thus, upon using multiple assays to monitor autophagy under different conditions in two different pancreatic cell models, we conclude that KRAS ablation leads to a further upregulation of autophagy, supporting its role as a key survival mechanism in PDAC.
ERK inhibition elevates autophagic flux.
We recently determined that the ERK1/ERK2 mitogen-activated protein kinases have a critical role in the in vitro and in vivo growth of KRAS-mutant PDAC23. To determine whether loss of this key KRAS effector pathway is likewise important for KRAS suppression–induced autophagy, we treated PDAC cell lines with the ERK1/ERK2-selective inhibitor SCH772984 (ERKi)28 (Extended Data Fig. 1a), an analog of the clinical candidate MK-8353/SCH900353 (ref. 29). We found that shortterm (24 h) ERKi treatment stimulated a 3-to 30-fold increase in autophagy in eight of eight human PDAC cell lines stably expressing the mCherry-EGFP-LC3B autophagy reporter (Fig. 2a,b). In a complementary approach, we also observed a 2-to 12-fold increase in EGFP+ autophagosomes upon ERKi treatment of human PDAC cells stably expressing EGFP-LC3B (Extended Data Fig. 2a,b). Confirming increased autophagic flux, we observed an increased ratio of LC3B-II to LC3B-I in ERKi-treated cells compared to vehicle-treated controls both basally and in the presence of bafilomycin A1 to inhibit flux (Fig. 2c). Extending these results to the iKRAS model, we observed that ERK inhibition also phenocopied Kras G12D silencing in three of three mouse iKRAS PDAC lines, causing extensive 10-to 30-fold increases in autophagic flux (Fig. 2d,e).
Fig. 2. Pharmacological inhibition of ERK1/ERK2 increases autophagic flux in KRAS-mutant PDAC cell lines.
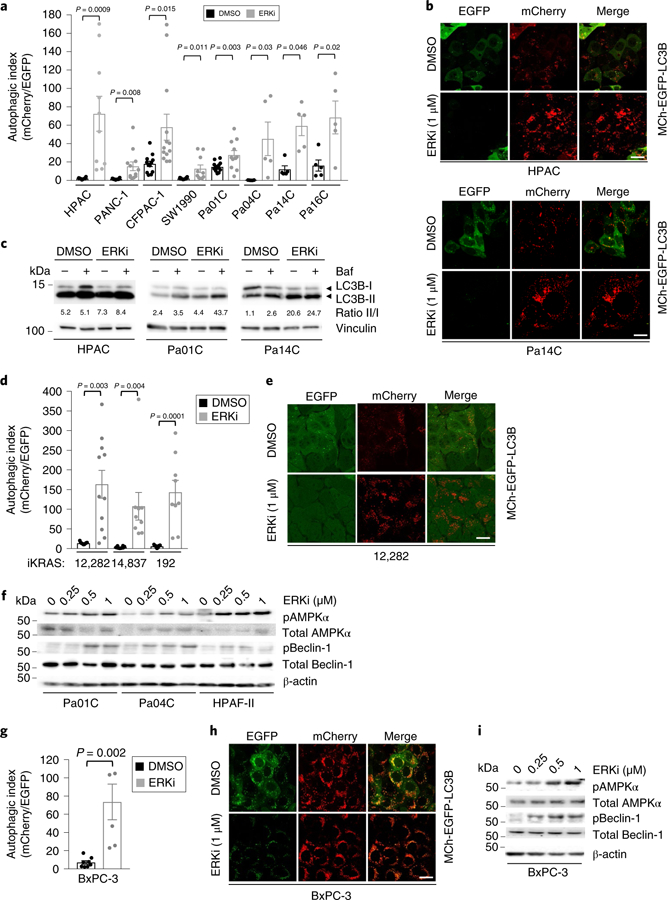
a, PDAC cell lines were transduced to stably express mCherry-EGFP-LC3B and then treated with the ERK1/ERK2 inhibitor, SCH772984 (ERKi, 1 μM) or DMSO for 24 h. Autophagic index indicates the ratio of the areas of mCherry+ punctae to EGFP+ punctae. Mean autophagic index is plotted, with each individual data point representing one field containing at least ten analyzed cells. Data for HPAC, PANC-1 and Pa14C cells are representative of three independent experiments; two independent experiments were performed for Pa01C and Pa16C cells; and one was performed for CFPAC-1, SW1990 and Pa04C cells. b, Representative images of cells described and quantified in a; scale bar, 20 μm. c, PDAC cell lines were treated with DMSO or SCH772984 (ERKi, 1 μM, 24 h); Baf was added (200 nM, 2 h) to assess flux. Immunoblot analyses of cell lysates were done to determine the levels of LC3B and vinculin, and are representative of three independent experiments. d, Three cell lines derived from the iKRAS doxycycline-inducible PDAC mouse model were stably infected with a retroviral vector encoding mCherry-EGFP-LC3B. Cells were treated with SCH772984 (ERKi, 1 μM, 24 h) and mean autophagic flux was assessed as described in a. Data are representative of two independent experiments. e, Representative images of cells described and quantified in d; scale bar, 20 μm. f, PDAC cell lines were treated with DMSO or SCH772984 (ERKi, 250 nM, 500 nM or 1 μM) for 24 h. Immunoblot analyses of cell lysates were done to determine the levels of pAMPKα, total AMPKα, pBeclin-1, total Beclin-1 and β-actin, and are representative of three independent experiments. g, BxPC-3 cells were prepared as described in a. Mean autophagic index of five independent experiments is plotted. h, Representative images of cells quantified in g; scale bar, 20 μm. i, BxPC-3 cells treated as described in g. Immunoblot analyses of cell lysates were done to determine the levels of pAMPKα, total AMPKα, pBeclin-1, total Beclin-1 and β-actin, and are representative of three independent experiments. All P values shown are from unpaired, two-sided t-test. Error bars represent s.e.m.
To confirm the ability of ERK inhibition to phenocopy KRAS suppression and to induce increased autophagic signaling before autophagosome formation, we also examined activation of AMPK and Beclin-1 upon ERKi treatment. As we observed upon genetic suppression of KRAS, ERK inhibition also stimulated increased AMPK and Beclin-1 phosphorylation in human PDAC cells (Fig. 2f). Although PRKAA2 and BECN1 transcription was elevated in some cell lines (Extended Data Fig. 2c), increased levels of phosphorylated Beclin-1 were observed within 1 h of ERKi treatment (Extended Data Fig. 2d), supporting the idea that KRAS regulates autophagy in PDAC through the ERK MAPK cascade. Finally, BxPC-3 cells exhibited elevated autophagy12 despite lacking mutant KRAS, owing to upregulated ERK signaling and ERK-dependent growth30,31 downstream of mutant BRAF. Again, consistent with the critical role of ERK signaling in regulating autophagy, we found that ERKi treatment of BxPC-3 cells also increased autophagic flux (Fig. 2g,i).
ERK inhibition deregulates metabolic activities.
We next addressed the mechanistic basis of the ERKi-induced increase in autophagic flux. First, we performed reverse-phase protein microarray (RPPA) analyses32 on a panel of 12 human PDAC cell lines treated with ERKi or vehicle (DMSO) for 1 or 24 h (Fig. 3a, Supplementary Fig. 2a and Supplementary Tables 2–4). Comparison of the mean values of all proteins assayed revealed decreases in wellvalidated markers of ERK inhibition including reductions in phosphorylated and activated ERK1/ERK2, in phosphorylation of the ERK substrate RSK, and in total MYC protein, an ERK-regulated substrate (Extended Data Fig. 3a). We have previously reported that acute ERK inhibition can lead to a limited degree of apoptosis23, and indeed we observed upregulation of apoptotic mediators including BIM, PUMA and cleaved PARP and caspase 7 after 24 h of ERKi treatment (Extended Data Fig. 3b). Notably, we further validated that ERK inhibition stimulated AMPK activation, and additionally observed decreased mTORC1 signaling (Fig. 3a,b and Supplementary Fig. 2b). Both signaling changes are prominent mechanisms that can promote autophagy (Extended Data Fig. 1a) upon ERKi treatment33. Correlation analysis of the RPPA data confirmed that levels of phosphorylated AMPK were negatively correlated with markers of ERK inhibition, whereas the decreases in mTOR pathway components were positively correlated with those same markers (Extended Data Fig. 3c).
Fig. 3. Pharmacological inhibition of ERK1/ERK2 increases autophagic flux via multiple mechanisms.
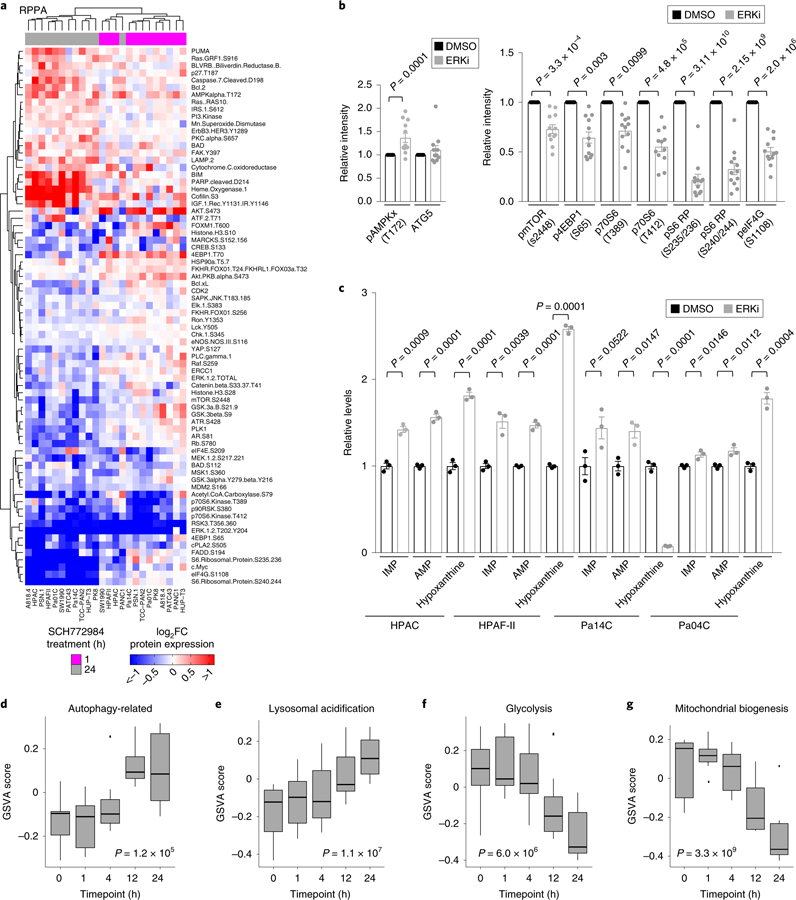
a, PDAC cell lines were treated with vehicle (DMSO) or SCH772984 (ERKi, 1 μM) for 1 or 24 h. Three independent experiments were prepared, and RPPA analysis was performed. RPPA expression data for 1 h of SCH772984 treatment were standardized to no-treatment samples, and 24 h SCH772984-treatment samples were standardized to 24 h DMSO-treated samples. Data were log2 transformed, and medians of three independent experiments are represented in the heatmap. Only proteins with statistically significant (P < 0.05, FDR corrected, Wilcoxon test) changes at 1 or 24 h are shown. Samples and proteins were arranged via hierarchical clustering. b, Mean comparisons of autophagy-and mTOR pathway-related proteins from RPPA data in which all 12 cell lines (shown in a) are averaged based on treatment condition and treated as biological replicates. P values are from unpaired, two-sided, t-test (phosphorylated mTOR (s2448)) or Wilcoxon test (all other proteins) comparing the mean of cells treated with SCH772984 (ERKi, 1 μM, 24 h) to vehicle control (DMSO) are shown; error bars denote s.e.m. c, Normalized mean-peak intensities for IMP, AMP and hypoxanthine identified from triplicate LC–MS/MS experiments. The average metabolite concentrations from SCH772984-treated (ERKi, 1 μM) samples are normalized to DMSO controls; P values are from two-sided, unpaired t-test; error bars denote s.e.m. Mean of three independent experiments is plotted. d, A panel of seven PDAC cell lines (HPAC, PANC-1, HPAF-II, SW1990, Pa01C, Pa04C and Pa14C) were treated with SCH772984 (1 µM) for 1, 4, 12 or 24 h. Cells were collected, and RNA-seq analysis was performed. GSVA was completed to estimate the variation of different metabolic pathway activities over time in a nonsupervised manner. Each of the seven cell lines was treated as a biological replicate. Shown are the GSVA scores for a gene set composed of autophagy-related genes. Significance was determined based on a repeated measures ANOVA. Box plot components include minimum, 25th percentile, median, 75th percentile and maximum. e, Samples were prepared and analyzed as described in d. Shown are the GSVA scores for a gene set composed of lysosomal membrane proteins and hydrolases. Significance was determined as in d. f, Samples were prepared and analyzed as described in d. Shown are the GSVA scores for a gene set composed of glycolysis-related genes. Significance was determined as in d. g, Samples were prepared and analyzed as described in d. Shown are the GSVA scores for a gene set composed on mitochondrial biogenesis-related genes. Significance was determined as in d.
We next analyzed polar metabolite levels using liquid chromatography–tandem mass spectrometry (LC–MS/MS)-based differential metabolomics on a panel of ERKi-treated PDAC cell lines. Consistent with the increased AMPK activation identified by RPPA, our metabolomics analyses demonstrated that a subset of PDAC cell lines also had increased levels of AMP, as well as increased levels of the AMP precursor, IMP, and/or the AMP degradation product, hypoxanthine, upon ERKi treatment (Fig. 3c; Extended Data Fig. 3d), suggesting that ERKi induces increased autophagic flux in part by altering nucleotide metabolism. Furthermore, we performed RNA-seq analysis on a panel of seven human PDAC cell lines treated with ERK inhibitor over 24 h. Implementing GSVA to determine the variation of different metabolic pathway activities over time in a nonsupervised manner, we identified ERKi-mediated increased expression of autophagy-related and lysosomal genes (Fig. 3d,e, Supplementary Fig. 2c and Supplementary Table 1). Finally, we used quantitative PCR to verify dose-dependent increases in transcripts of autophagy-related genes, in particular those that encode autophagy cargo receptors, upon ERKi treatment (Extended Data Fig. 3e). Thus, ERK inhibition increases autophagy at the levels of autophagic signaling, nucleotide metabolism and gene transcription.
In contrast to upregulation of gene transcription supporting autophagy, our RNA-seq analyses also identified ERK inhibition–induced reductions in transcripts of genes supporting glycolysis (Fig. 3f, Supplementary Fig. 3a and Supplementary Table 1). These transcriptomic changes were phenocopied by KRAS knockdown (Supplementary Fig. 3b). To verify that these changes led to reduced glycolytic activity, we performed metabolic flux analyses by [13C]glucose LC-MS and NMR. We genetically silenced KRAS using a validated siRNA construct or treated cells with ERKi before incubating cells with [1,6-13C2]glucose. We found that KRAS suppression and ERK inhibition decreased both glucose uptake and accumulation of cellular and secreted lactate (Supplementary Fig. 3c,f). Accordingly, we observed a marked decrease in key glycolytic intermediates in a panel of seven KRAS-mutant PDAC cell lines upon ERKi treatment (Extended Data Fig. 4a). Our previous analyses in the iKRAS PDAC mouse model demonstrated that mutationally activated KRAS drives glycolytic activity and that suppression of Kras G12D decreases it3. Consistent with those results, we conclude that mutationally activated KRAS regulates glycolytic activity that is effectively suppressed after ERK inhibition in human PDAC lines. We hypothesized that this ERK inhibition–induced reduction in glycolytic activity contributes to the ERK inhibitor–mediated increase in autophagic flux that we observed. Accordingly, we found that when glucose was withdrawn from the growth medium of PDAC cells, autophagic flux increased, albeit to a lesser degree than we observed with ERK inhibition (Extended Data Fig. 4b). Hence, we conclude that ERK inhibitor treatment increases autophagic flux through both direct signaling mechanisms and an indirect reduction in glycolysis.
ERK inhibition impairs mitochondrial activity.
Our RNA-seq data showed that ERKi treatment led to decreased transcription of mitochondrial biogenesis–related genes (Fig. 3g, Supplementary Fig. 3g and Supplementary Table 1), and this was phenocopied by KRAS suppression (Supplementary Fig. 3h). Our previous studies have demonstrated that the rare subpopulation (<10%) of mouse PDAC cells that can survive long-term Kras G12D ablation becomes more dependent on mitochondrial respiration19. Therefore, our finding that acute KRAS suppression or ERK inhibition decreased the transcription of mitochondria-associated genes in the bulk populations subjected to these acute treatments was somewhat unexpected to us. We first assessed the functional consequences of short-term KRAS suppression and ERK inhibition on mitochondrial morphology and activity in KRAS-mutant PDAC cell lines. We found that ERKi treatment reduced mitochondrial mass (Fig. 4a and Supplementary Fig. 3i). Accordingly, we observed an increase in mitophagic flux upon ERK inhibition, as well as increased levels of total PINK1 (Extended Data Fig. 5a,c). Thus, together with decreased transcription of mitochondrial components, increased mitophagy contributes to the decrease in mitochondrial mass. RAS-transformed rodent and human cells, as well as KRAS-or BRAF-mutant cancer cells, have a fragmented mitochondrial network that becomes more fused upon ERK MAPK pathway inhibition34,35. Notably, we found that ERK inhibitor treatment induced mitochondrial fusion in PDAC cell lines within 1 h (Fig. 4b,c). This was associated with decreased phosphorylation of DRP1 (Fig. 4d), a mediator of mitochondrial fission and a validated ERK substrate34. Mitochondrial fusion and decreased DRP1 phosphorylation were maintained after 24 h of ERKi treatment (Fig. 4e,f). At this time point, we also began to observe a decrease in total DRP1 protein (Fig. 4g), consistent with our observation that mitochondria-related gene transcription decreases after 24 h. The increased mitochondrial fusion upon ERK inhibition was phenocopied by short-term KRAS suppression in human PDAC lines (Extended Data Fig. 5d,e) and by Kras G12D suppression (–Dox) in iKRAS mouse PDAC lines (Fig. 4h). Overall, both ERK inhibition and KRAS suppression led to a marked rearrangement of the mitochondrial network, favoring robust fusion over the fragmented nature typically observed in PDAC.
Fig. 4. ERK inhibition and KRAS silencing impairs mitochondrial function in PDAC cells.
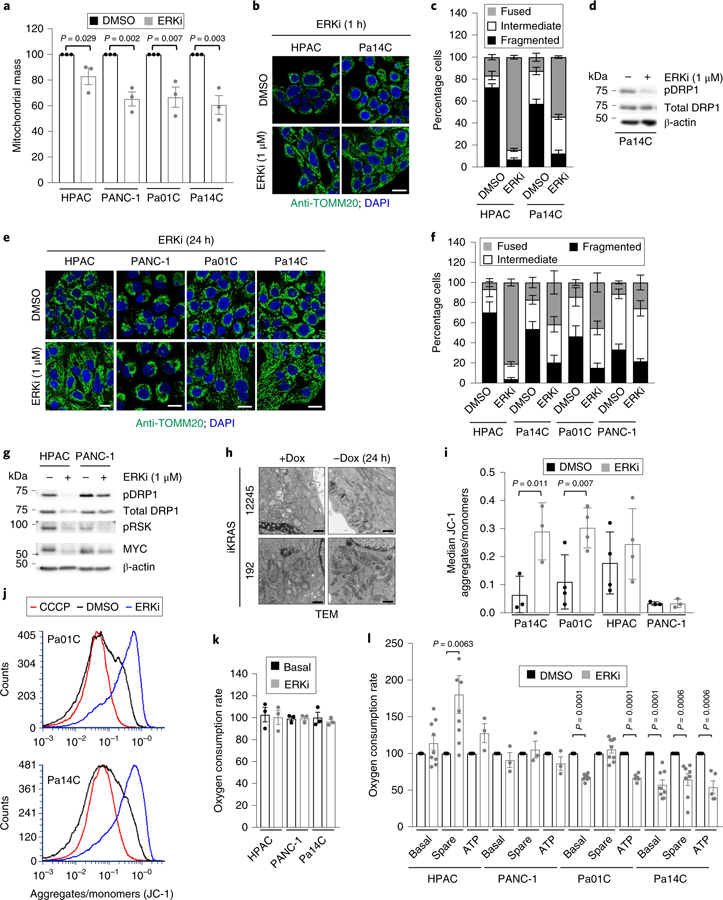
a, Cells were treated with vehicle (DMSO) or SCH772984 (ERKi, 1 μM) for 24 h. Shown is quantification of mean fluorescence of MitoTracker green staining, normalized to DMSO for each cell line across three independent experiments. P values are from two-sided, unpaired t-test; error bars denote s.e.m. b, Mitochondrial morphologies of PDAC cells treated with SCH772984 (ERKi, 1 µM) for 24 h. Green, anti-TOMM20; blue, DAPI. Scale bar, 20 μm. c, Quantitation of mitochondrial morphologies observed in cells shown in b. Some 50 cells per condition per repetition were blindly scored and data are averages of four independent experiments; error bars denote s.e.m. d, Pa14C cells were treated with SCH772984 (ERKi, 1 µM) for 1 h. Immunoblot of phosphorylated DRP1 (S616) (pDRP1), total DRP1 and β-actin is representative of three independent experiments. e, Mitochondrial morphologies of PDAC cells treated with SCH772984 (ERKi, 1 µM) for 24 h. Green, Anti-TOMM20; blue, DAPI; scale bar, 20 μm. f, Quantitation of mitochondrial morphologies observed in cells shown in e. Some 50 cells per condition per repetition were blindly scored; data are means of four independent experiments; error bars denote s.e.m. g, PDAC cells were treated with SCH772984 (ERKi, 1 μM) for 24 h. Immunoblot of pDRP1, total DRP1, MYC, phosphorylated RSK (pRSK) and β-actin is representative of three independent experiments. h, Cell lines derived from the iKRAS PDAC mouse model were deprived of doxycycline (Dox) to turn off Kras G12D for 24 h. Representative transmission electron microscopy (TEM) micrographs displaying mitochondrial morphologies in the presence and absence of doxycycline; images are representative of six independent experiments; scale bar, 500 nm. i, Cells were treated as described in a. Quantification of relative mitochondrial potential via labeling with the JC-1 mitochondrial dye. Data are the mean of three independent experiments; P values are from two-sided, unpaired t-test; error bars denote s.d. of median ratios of JC-1 aggregate fluorescence to JC-1 monomer fluorescence. j, Representative histograms from Pa01C and Pa14C cells quantified in i; as a control, the uncoupler CCCP was added to acquired DMSO samples to establish minimum potential. k, OCR response of PDAC cells treated with DMSO or SCH772984 (ERKi, 1 μM) for 1.5 h; shown is mean OCR of three independent experiments; error bars denote s.e.m. of mean OCR across replicates. l, OCR response of PDAC cells treated with DMSO or SCH772984 (ERKi, 1 μM) for 24 h. Data for HPAC and Pa01C lines are the mean of nine independent experiments; data for Pa14C are the mean of eight independent experiments, and data for PANC-1 are the mean of three independent experiments. P values are from two-sided, unpaired t-test, comparing treatment conditions to DMSO, which was normalized to 100 for each measurement; error bars denote s.e.m.
Mitochondrial fusion has been associated with increased mitochondrial activity35. Indeed, the increased fusion we observed was accompanied by increased mitochondrial potential both in human PDAC cell lines (Fig. 4i,j and Supplementary Fig. 3j,k) and in the iKRAS model (Extended Data Fig. 6a and Supplementary Fig. 3l). However, we observed no change in oxygen consumption rate in cells treated with ERKi for 1.5 h (Fig. 4k), a timescale at which we observed robust mitochondrial fusion. Furthermore, when human PDAC cell lines were treated with ERKi for 24 h, the basal oxygen consumption rate, as well as ATP production, was either decreased or unchanged (Fig. 4l). A similar lack of effect on oxygen consumption was observed after KRAS suppression in human PDAC cells, as well upon turning off Kras G12D expression in iKRAS mouse PDAC lines (Extended Data Fig. 6b,c). In agreement with the increase in mitochondrial potential, a small increase in spare mitochondrial capacity was observed upon Kras suppression in the iKRAS model (Extended Data Fig. 6b), as well as upon ERKi treatment in a subset of human PDAC cell lines (Fig. 4l). However, because we did not observe concomitant increases in oxygen consumption or ATP production, we conclude that this increased potential was not used for energy production.
Finally, we applied [13C]glucose LC-MS metabolic flux analysis to monitor the formation of 13C-labeled glutamate, a measure of flow through the tricarboxylic acid (TCA) cycle36,37, which sustains mitochondrial metabolism. Incorporation of different numbers of 13C atoms from [1,6-13C]glucose into glutamate reflects in part the number of turns that the TCA cycle has undergone. Incorporation of one labeled 13C carbon within glutamate indicates the first half turn after glycolysis, as shown by the increase from the monoisotopic isotopologue (M+0) to the M+1 isotopologue. The incorporation of two labeled 13C carbons (M+2 isotopologue) indicates another consecutive turn. Upon fitting isotopologue distributions of labeled glutamate to a one-phase exponential model, we observed decreases in the rate of formation (K) of M+1 and M+2 glutamate upon KRAS suppression by siRNA (Supplementary Fig. 3m). ERKi treatment had similar effects (Supplementary Fig. 3n). These results further support the notion that glucose-derived carbon incorporation into the TCA cycle is unchanged or reduced, rather than increased, after perturbation of the KRAS-ERK pathway.
ERK inhibition enhances dependence on autophagy.
We speculated that the increase in autophagy that we observed upon inhibiting ERK may produce a greater dependence on the autophagic process in ERKi-treated PDAC cells. If so, concurrent inhibition of ERK and autophagy should be more effective than either alone. Although there are no specific inhibitors of autophagy in the clinic, hydroxychloroquine, a general inhibitor of lysosomal acidification and thus an indirect inhibitor of autophagy, is routinely used. Accordingly, we found that concurrent treatment with SCH772984, the chemically and mechanistically distinct clinical candidate ERK (ulixertinib/BVD-523)38, or the MEK inhibitor binimetinib (MEKi) synergistically enhanced chloroquine-mediated growth inhibition on plastic (Fig. 5a,b, Extended Data Fig. 7a,b and Supplementary Fig. 4a). Synergy was observed over a broad range of ERKi or MEKi concentrations, indicated by combination index values of <1 using the Chou-Talalay or BLISS method (Fig. 5c and Extended Data Fig. 7b,d). Notably, synergy was observed irrespective of the method used to quantify cellular proliferation, including both metabolism-dependent processing of 3-(4,5-dimethylthiazol-2-yl)-2,5-diphenyltetrazolium bromide (MTT) (Fig. 5a,b and Extended Data Fig. 7a,c) or live cell counting (Extended Data Fig. 7b,d). Additionally, ERKi treatment alone caused a limited degree of apoptosis that was significantly increased by the combination treatment (Fig. 5d and Supplementary Fig. 4b,c). Synergy was also observed when cells were grown as matrix-embedded spheroid cultures, as indicated by BLISS scores and combination index values <1 (Supplementary Fig. 4d,e). Furthermore, when the combination was assessed on matrix-embedded human pancreatic subject–derived organoid cultures, synergy between ERKi and chloroquine was maintained (Fig. 5e,f and Extended Data Fig. 8a,f).
Fig. 5. Dual inhibition of ERK signaling and autophagy synergistically impairs PDAC proliferation.
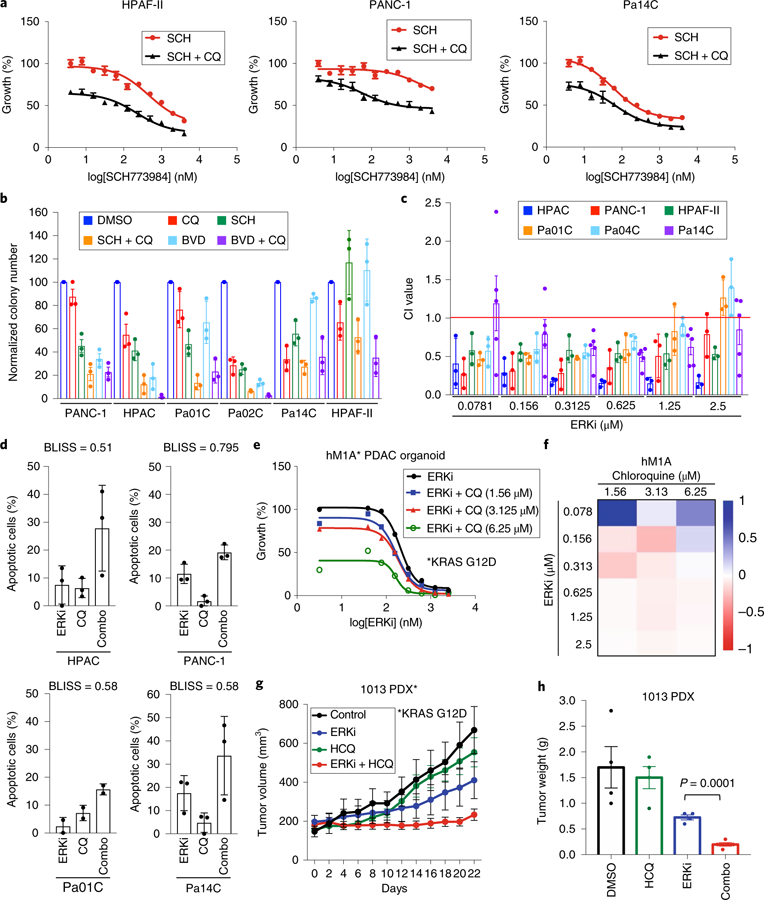
a, PDAC cell lines (indicated lines shown as representative) were treated with a range of SCH772984 concentrations (SCH, 0.0195–10 µM) and a constant concentration of chloroquine (CQ, 6.25 μM) for 72 h, and proliferation was monitored by the addition of MTT for 3 h at end of experiment. Normalized absorbance at 590 nm, comparing treatment conditions to DMSO control, which was normalized to 100, is plotted, and error bars denote s.d. of three technical replicates. Curves are representative of four independent experiments. b, A panel of PDAC cell lines was treated with ERK inhibitors SCH772984 (SCH), BVD-523 (BVD) or chloroquine (CQ), alone or in combination. Cells were stained with crystal violet to visualize colonies of proliferating cells 14 d after plating. Average colony number, normalized to the DMSO control, of three technical replicates is shown; error bars represent s.d. Data are representative of two independent experiments. c, Combination indices (CI values) were calculated using Compusyn. Average CI values for a panel of indicated PDAC cell lines treated as described in a are shown; values are mean of four independent experiments; error bars denote s.e.m. of CI value across replicates. d, A panel of indicated human PDAC cell lines treated with SCH772984 (ERKi) or CQ alone or in combination for 5 d. Apoptosis was monitored using FACS analysis of Annexin-V and propidium iodide–labeled cells. Percentage apoptotic cells (normalized to vehicle (DMSO) control) is plotted. Data are the mean of four independent experiments for each cell line and condition; error bars denote s.e.m. of mean percentage apoptotic cells. BLISS scores were calculated to determine whether combination was synergistic. e, hM1A subject–derived organoids were grown for 10 d in the presence of indicated concentrations of CQ and SCH772984 (ERKi, 0.039 to 2.5 µM). Growth curve is representative of five independent experiments. f, Heatmap representing BLISS independence scores corresponding to representative growth curve shown in e. g, Immunocompromised (NSG) mice with implanted KRAS-mutant PDX tumor (AZ1013) were treated with SCH772984 (ERKi) alone or together with hydroxychloroquine (HCQ) for 22 d. Mean tumor volume is plotted over time; error bars denote s.e.m. The control and single-agent data are the mean of four independent tumors, and the combination is the mean of five independent tumors. h, Quantitation of AZ1013 tumor weights; P value is from two-sided, unpaired t-test comparing ERKi-treated to ERKi plus hydroxychloroquine (HCQ)-treated tumors; error bars denote s.e.m.; sample sizes are as in g.
To extend these in vitro findings to in vivo tumor growth, we evaluated the combination of ERKi and hydroxychloroquine in two heterogeneous KRAS-mutant pancreatic subject–derived tumor xenograft (PDX) models. In both models, whereas ERKi alone had a significant impact on tumor growth, the combination blocked tumor progression and extended survival more effectively (Fig. 5g and Extended Data Fig. 9a,d). Additionally, tumors harvested from mice treated with the combination of ERKi and hydroxychloroquine were significantly smaller than tumors from mice treated with ERKi alone (Fig. 5h and Extended Data Fig. 9e). We conclude that concurrent inhibition of ERK1/ERK2 and autophagy suppresses PDAC growth more effectively than inhibition of ERK alone.
Because chloroquine inhibits autophagy indirectly by blocking lysosomal function, we next determined whether genetic or pharmacologic blockade of specific components of autophagy21 would also synergize with ERK inhibition (Extended Data Fig. 1a). We first tested synergy using shRNA suppression of two essential autophagy-related genes (ATG5 and ATG7) involved in elongation of the autophagosome membrane and complete formation of the autophagosome vesicle39. Suppression of either ATG5 or ATG7 significantly enhanced ERKi-induced growth suppression in PDAC cell lines (Fig. 6a,d). Furthermore, whereas hydroxychloroquine is the only clinically tractable autophagy inhibitor so far, other, more specific tool compounds have been developed, including SBI0206965 (SBI)40, MRT68921 (MRT)41, and Spautin-142. SBI targets ULK1 and MRT targets ULK1 and ULK2, which are components of the autophagic preinitiation complex that are phosphorylated by active AMPK. Spautin-1 inhibits two ubiquitin-specific peptidases, USP10 and USP13, that regulate ubiquitination of Beclin-1 in Vps34 complexes that initiate autophagosome formation. Like chloroquine, all three additional autophagy inhibitors reduced the proliferation of PDAC cell lines (Fig. 6e and Extended Data Fig. 10a). As we observed after genetic suppression of ATG5 and ATG7, treatment with all three distinct pharmacologic inhibitors of different components of autophagy also synergistically enhanced ERKi-mediated growth suppression (Fig. 6f,g and Extended Data Fig. 10b,c). Having established robust synergy between ERK and autophagy inhibition, we hypothesized that KRAS inhibition would likewise synergize autophagy inhibition. Because the KRAS G12C–mutant MIA-PaCa-2 cells are resistant to chloroquine (Supplementary Fig. 5), we treated them with ARS-1620 (RASi) in combination with SBI or MRT. We observed a synergistic enhancement of ARS-1620-induced growth suppression as well as significantly enhanced apoptosis in combination-treated cells (Fig. 6h,i and Extended Data Fig. 10d).
Fig. 6. Synergy with ERK inhibition is observed when autophagy is inhibited at multiple levels.
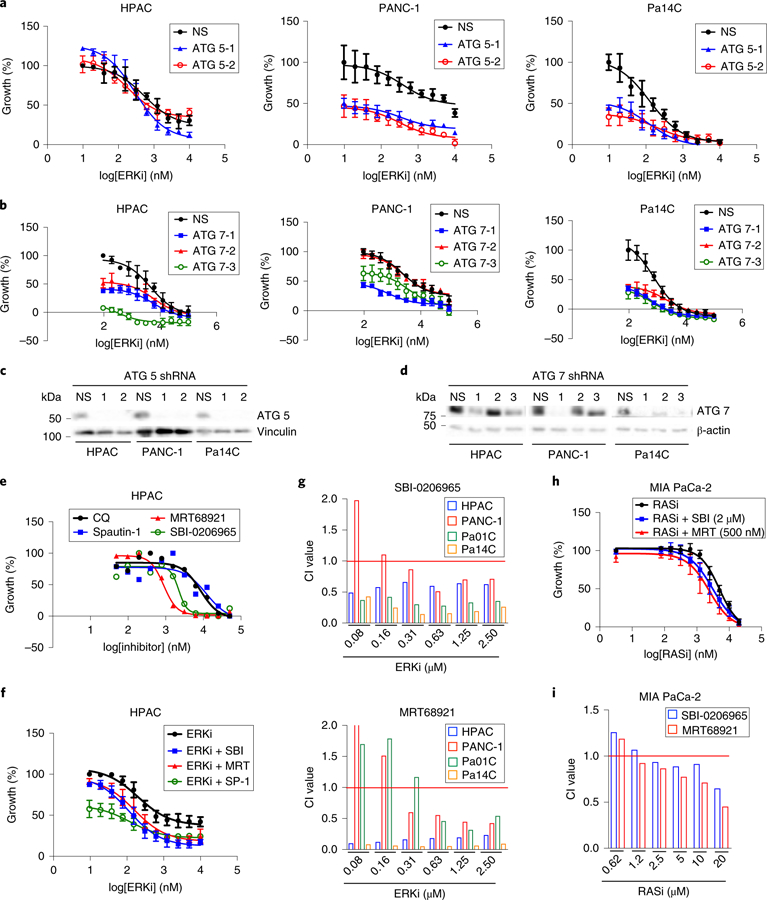
a, A panel of PDAC cell lines was stably transduced with two distinct shRNA constructs (ATG 5–1 or ATG 5–2) or a nonspecific control construct (NS). Cell lines were treated with a range of SCH772984 concentrations (ERKi, 0.0195–10 µM, 72 h), and proliferation was assessed by live cell counting. Normalized mean cell number, comparing treatment conditions to SCH (ERKi)-only control, which was normalized to 100, is plotted, and error bars denote s.d. of three technical replicates. Curves are representative of three independent experiments. b, A panel of PDAC cell lines were stably transduced with three distinct shRNA constructs (ATG 7–1, ATG7–2 or ATG 7–3) or NS and were treated and analyzed as in a. c, Immunoblot analyses of cell lysates were done to determine the levels of ATG5 and vinculin, and are representative of three independent experiments. d, Immunoblot analyses of cell lysates were done to determine the levels of ATG7 and β-actin, and are representative of three independent experiments. e, A panel of PDAC cell lines (HPAC data shown as representative) were treated with a two-fold dilution range (beginning at 50 µM) of indicated autophagy inhibitors for 72 h. Proliferation was assessed using live cell counting. f, A panel of PDAC cell lines were treated with a range of SCH772984 concentrations (ERKi, 0.0195–10 µM) and a constant concentration of each autophagy inhibitor: SBI-0206965 (SBI, 2 μM), MRT68921 (MRT, 500 nM) and Spautin-1 (SP-1, 1.25 μM). HPAC data shown are representative of three independent experiments. Proliferation was assessed using live cell counting. Data were analyzed and plotted as in a. g, CI values calculated from representative data displayed in f for multiple cell lines. h, MIA PaCa-2 cells were treated with a range of ARS-1620 concentrations (0.039–20 µM) and constant concentrations of SBI-0206965 (SBI) or MRT68921 (MRT) for 5 d, and proliferation was quantified by live cell counting. Data were analyzed and plotted as in a, and the plot is representative of three independent experiments. i, Representative CI values for each combination described in h are shown.
Discussion
KRAS-mutant PDAC is characterized by multiple metabolic alterations that include increased dependence on glycolysis, glutaminolysis, autophagy and macropinocytosis3,43. Our previous analyses in the iKRAS PDAC mouse model have shown that increased glycolytic activity is driven by KRAS activation of the ERK MAPK cascade and loss of MYC in a Kras-driven mouse model of PDAC3. In the present study, we extend this observation to human PDAC cells by showing that KRAS suppression or ERK inhibition causes similar decreases in glycolytic function. Regarding another metabolic process, Bar-Sagi and colleagues have shown that elevated macropinocytosis in human PDAC is also KRAS dependent43, although the effector pathways that drive macropinocytosis remain to be elucidated. We and others have observed that human PDAC exhibits high levels of basal autophagy12,13,20; herein, we find that acute KRAS suppression increased rather than decreased autophagy. Furthermore, ERK inhibition phenocopied KRAS suppression and also stimulated increased autophagic flux. Further work is needed to determine the order of the direct and indirect signaling events that lead to increased autophagic flux; however, because we have observed rapid MYC loss associated with both KRAS suppression and ERK inhibition in PDAC, it will be important to assess whether MYC can also regulate autophagy in PDAC.
Additionally, we show that impaired mitochondrial function is a third metabolic alteration caused by either KRAS suppression or ERK inhibition. In agreement with previous studies, we observed that KRAS transformation is associated with a highly fragmented mitochondrial matrix and that ERK MAPK inhibition can block mitochondrial fission, leading to increased mitochondrial fusion34,35. However, although increased mitochondrial fusion has been assumed to reflect an increase in oxygen consumption, and our finding of increased mitochondrial potential is consistent with this possibility, to our surprise, we observed a decrease or no change in mitochondrial oxygen consumption or ATP production after either short-term KRAS suppression or ERK inhibition, in both human and mouse PDAC cell lines. We suggest that the decreased glycolytic activity caused by KRAS suppression or ERK inhibition induces a compensatory response to increase mitochondrial activity that cannot be completed, possibly owing in part to ERK inhibition–induced suppression of the expression of genes involved in mitochondrial biogenesis. Our findings may seem at odds with observations from a recent study in which a subpopulation (<10%) of mouse PDAC cells able to survive long-term Kras G12D ablation become more dependent on mitochondrial respiration19. However, as these PDAC cells have escaped addiction to mutant Kras, probably through Yap1 activation, our findings support the critical role of mitochondrial function in supporting PDAC growth after acute ablation of ERK MAPK signaling.
The relationship between mitochondrial morphological dynamics and mitochondrial activities is a topic of intense research44. We demonstrated that ERK inhibition leads to the subsequent loss of glycolytic inputs into the TCA cycle. Thus we hypothesize that, to compensate, the cells increase mitochondrial fusion to promote efficient mitochondrial activity. Although we did not observe the increased mitochondrial dependence described after long-term KRAS ablation19, mitochondria persisted after acute KRAS suppression and ERK inhibition, albeit at a lower level of activity. Autophagy supplies substrates for the TCA cycle in PDAC cells12. Therefore, a basis for the synergy we observe between ERK and autophagy inhibition may be the additive loss of multiple TCA cycle inputs, both from glycolysis and from scavenging pathways such as autophagy.
At least 11 RAS effector families have been identified so far, and 6 of these have been validated as contributing to KRAS-driven cancer initiation and/or maintenance5,6. Herein, we demonstrate that ERK inhibition alone phenocopies the genetic silencing of KRAS in both human-and mouse-derived pancreatic cancer models, implicating the RAF-MEK-ERK pathway as the major modulator of RASmediated metabolic alterations. Extending these observations, we additionally observed increased autophagic flux after KRAS silencing or inhibition as well as ERK inhibition in both human PDAC cell lines and lines derived from iKRAS PDAC mice. Thus, although inhibition of specific metabolic enzymes (for example, glutaminase) is being pursued to impair the altered metabolic activities in PDAC10, and current inhibitors of macropinocytosis are limited by issues of selectivity and potency, our results lead us to conclude that ERK inhibition is an effective pharmacologic approach for blocking metabolic processes driven by mutant KRAS. This block in turn further enhances PDAC addiction to autophagy, and consequently increases sensitivity to treatment with autophagy inhibitors.
Our previous determination that autophagy is elevated in PDAC and that inhibition of autophagy can suppress PDAC tumorigenic growth has prompted clinical evaluation of the autophagy inhibitor hydroxychloroquine for the treatment of PDAC. Ongoing clinical trials have observed limited to no efficacy of hydroxychloroquine as monotherapy14. Herein we demonstrate that concurrent treatment with the ERK inhibitor SCH772984, the clinical candidate ERK inhibitor ulixertinib/BVD-52338, or the clinical candidate MEK inhibitor binimetinib synergistically enhanced hydroxychloroquine-mediated growth inhibition in both organoid and PDX models of PDAC, preclinical models that provide improved modeling of the drug response in PDAC subjects45,46. Independent of our studies, a companion study demonstrated marked, synergistic, antitumor activity with combined hydroxychloroquine and MEK or ERK inhibitors in pancreatic and other mutant Kras-or Brafdriven mouse models of cancers (see Kinsey et al. in this issue47). Furthermore, in one PDAC subject, the researchers observed a marked response to concurrent treatment with a MEK inhibitor and hydroxychloroquine. In conclusion, taking our findings together with theirs, we propose a therapeutic strategy whereby inhibitors of the RAF-MEK-ERK cascade disrupt KRAS-driven metabolic processes, driving PDAC to become acutely dependent on autophagy, thereby enhancing its vulnerability and responsiveness to hydroxychloroquine-mediated inhibition of autophagy. As ongoing efforts toward more specific autophagy inhibitors are underway, we anticipate that their use will only increase the efficacy of this treatment strategy.
Methods
Cell lines.
Pa01C, Pa02C, Pa04C, Pa14C and Pa16C cell lines were provided by A. Maitra (MD Anderson Cancer Center). The remaining PDAC cell lines and HEK-293T line were obtained from American Type Culture Collection (ATCC) and were maintained in either DMEM or RPMI 1640 supplemented with 10% FBS. Cell lines 12282, 14837 and 192 were derived from the doxycycline-inducible iKRAS mouse model3 and cultured in RPMI 1640 supplemented with 10% FBS. The RIE-1 cell line was received from R. Coffey (Vanderbilt University) and cultured in RPMI 1640 supplemented with 10% FBS. All cell lines were maintained in a humidified chamber with 5% CO2 at 37 °C. Organoids were cultured at 37 °C in 5% CO2. Cells were seeded in growth factor–reduced Matrigel (Corning) domes and fed with complete human feeding medium: advanced DMEM/F12-based WRN condition medium (L-WRN, ATCC CRL-3276), 1× B27 supplement, 10 mM HEPES, 0.01 µM GlutaMAX, 10 mM nicotinamide, 1.25 mM N-acetylcysteine, 50 ng ml–1 hEGF, 100 ng ml–1 hFGF10, 0.01 µM hGastrin I, 500 nM A83–01, 1 µM PGE2 and 10.5 µM Y27632. All cell lines were regularly monitored for mycoplasma contamination and immediately discarded if a positive result was detected. All cell line identities were verified by short-tandem-repeat profiling.
Mice.
NSG mice were purchased from The Jackson Laboratory and experiments were performed at the University of Arizona. All mice were maintained in a specific pathogen-free facility and all animal experiments were performed in accordance with protocols approved by the Institutional Animal Care and Use Committees of the University of Arizona.
Antibodies, plasmids and chemical reagents.
siRNA oligonucleotides targeting KRAS were: KRAS 1, CUAUGGUCCUAGUAGGAAAtt (Thermo Fisher, 4390824, s7939), and KRAS 2, GCCUUGACGAUACAGCUAAtt (Thermo Fisher, 4390824, s7940). The target sequence for the validated shRNA construct used to target KRAS was CAGTTGAGACCTTCTAATTGG. To determine the levels of activated proteins, immunoblot analyses were done using phosphospecific antibodies to AMPKα (T172; 40H9), Beclin-1 (S93; D9A5G), DRP1 (S616) and RSK (T395/S363). Antibodies recognized total LC3B, KRAS (234–4.2), AMPKα (Δ63Γ4) Beclin-1 (2A4), PINK1 (D8G3), VDAC (D73D12), DRP1 (D8H5), RSK (32D7), ATG5, ATG7 (EP1759Y), β-actin (AC-15), vinculin (hVIN-1) or GAPDH (GAPDH-71.1) to control for total protein expression. All antibodies were obtained from Cell Signaling Technologies except ATG7 (Abcam), KRAS (Calbiochem), β-actin (Sigma) and vinculin (Sigma). Immunochemical labeling of mitochondria was performed using TOMM20 (Santa Cruz). Chemical reagents used were bafilomycin A1, oligomycin A, rotenone, antimycin, FCCP, CCCP, doxycycline, MTT and chloroquine diphosphate (Sigma); calcein AM and AlamarBlue (Invitrogen); hydroxychloroquine (SelleckChem); binimetinib (SelleckChem); ARS-1620 (Medchem Express); Spautin-1, SBI-0206965 and MRT68921 (Xcessbio); SCH772984 (provided by Merck) and BVD-523 (provided by Biomed Valley Discoveries).
Retroviral expression and vector infections.
The pBabe-puro retroviral expression vector was used to ectopically express mCherry-EGFP-LC3B (a gift from J. Debnath (University of California at San Francisco); Addgene plasmid 22418; http://n2t.net/addgene:22418 RRID:Addgene_22418)48 and a panel of hemagglutinin-tagged KRAS mutants in PDAC cell lines. The pCLBW retroviral vector was used to ectopically express Cox8-EGFP-mCherry (a gift from D. Chan (California Institute of Technology); Addgene plasmid 78520; http://n2t.net/addgene:78520; RRID:Addgene_78520)49 in PDAC cell lines. To generate retroviral particles, 0.9 × 10⁶ HEK293T cells were plated and incubated overnight. DNA transfection of HEK293T cells was achieved using the Fugene6 protocol. Vector DNA (5 μg) and PCL10A DNA (5 μg) were combined in 400 μl Optimem. Fugene6 (24 μl) was added and the mixture was incubated for 20 min at room temperature before being added dropwise to the HEK293T cells. The next day, the medium was exchanged for fresh DMEM plus 20% FBS. After 2 d, target cells were transduced by combining 2.5 ml of viral particle–containing medium containing 8 μg ml–1 polybrene with 105 cells. The cells were fed 8 h later with fresh medium and selection was initiated 48 h after transduction.
shRNA expression and gene downregulation.
The lentivirus vector encoding shRNA targeting KRAS (TRCN0000010369) was provided by J. Settleman (Genentech). shRNAs targeting ATG5 (TRCN0000151963 and TRCN0000151474) and ATG7 (TRCN0000007584, TRCN0000007587 and TRCN0000007586) were obtained from the Lenti-shRNA Core Facility (UNC Chapel Hill). Lentiviral particles were generated as described above, except using vector (4 μg), pSPAX2 (3 μg) and pMD2.G (1 μg) plasmid DNAs. After 2 d, target cells were transduced by combining 0.5 ml of viral particle–containing medium with 2 ml of complete medium with polybrene at a final concentration of 8 μg ml–1 with 2 × 10⁶ cells per T25 flask. Media were exchanged 8 h later and selection was initiated after 16 h incubation in complete medium. Experiments were typically performed 72–120 h after the initiation of selection.
siRNA treatment of cell lines.
siRNA Silencer Select oligonucleotides against scrambled and KRAS sequences were obtained from Thermo Fisher. The siRNA concentration used was 10 nM. Oligonucleotide transfections were performed using RNAiMAX (Life Technologies) according to the manufacturer’s instructions. Cells were routinely analyzed 60–72 h after the addition of siRNA.
iKRAS cell lines.
Cell lines were generated from a doxycycline-inducible Kras G12D–driven mouse model of PDAC (iKRAS)3. iKRAS cell lines depend on continued Kras G12D expression for growth and were therefore maintained in doxycycline (1 μg ml–1). To silence Kras G12D expression the cells were incubated in growth medium lacking doxycycline for 24 h.
RNA sequencing.
For KRAS knockdown studies, a panel of human PDAC cell lines was infected with lentiviral vectors encoding shRNA targeting KRAS or a scrambled control construct for 8–10 h, and then selected for 48–96 h (depending on cell line). For the ERK inhibitor study, cells were seeded at 50% confluence, and the next day were treated with SCH772984 (1 μM) for 24 h. After selection (KRAS studies) or treatment (ERKi studies), cells were washed twice in ice-cold PBS, scraped in ice-cold PBS, collected by centrifugation and flash frozen. Total RNA (50 ng) for the pancreatic cell lines was used to generate whole transcriptome libraries for RNA sequencing using Illumina’s TruSeq RNA Sample Prep. Poly(A) mRNA selection was performed using oligo(dT) magnetic beads, and libraries were enriched using the TruSeq PCR Master Mix and primer cocktail. Amplified products were cleaned and quantified using the Agilent Bioanalyzer and Invitrogen Qubit. The clustered flowcell was sequenced on the Illumina HiSeq 2500 for paired 100-bp reads using Illumina’s TruSeq SBS Kit V3. Lane level fastq files were appended together if they were sequenced across multiple lanes. These fastq files were then aligned with STAR 2.3.1 to GRCh37.62 using ensembl.74.genes.gtf as GTF files. Transcript abundance was quantified and normalized using Salmon in units of transcripts per million. Clustering was performed using R heatmap.2 package with Euclidean distance and McQuitty clustering method. GSVA was then performed to determine the change and variation in pathway activities on previously published gene signatures. Log transformation was applied, and default parameter settings were followed for RNA-seq data in GSVA.
Immunoblotting.
Cells were washed twice with ice-cold PBS, lysed in 1% Triton buffer (25 mM Tris-HCl, pH 7.4, 100 mM NaCl, 1 mM EDTA, 1% Triton) supplemented with phosphatase (Sigma) and protease (Roche) inhibitors, scraped and collected in prechilled tubes. Lysates were then cleared by centrifugation at 15,000g for 10 min at 4 °C, and protein concentration was determined using Bradford assay (Bio-Rad). Standard immunoblotting procedures were followed. Membranes were blocked in 5% BSA diluted in TBS with 0.05% Tween 20 (TBST).
For assessing autophagic flux by immunoblotting, cells were treated with siRNA or ERKi as described in the text and figure legends. Before the collection of samples, cells were treated with bafilomycin A1 (200 nM) for 2 h. Autophagic flux was quantified by immunoblot for LC3B and for densitometric quantification of the LC3B doublet, the ratio of LC3BII to LC3BI is reported.
Quantitative PCR.
Total RNA was isolated using a RNeasy kit (Qiagen) and reverse transcription was performed using the High Capacity RNA-to-cDNA kit (Thermo Fisher). Real-time quantitative Taqman PCR was performed on the QuantStudio 6 Flex (Thermo Fisher) with minor groove binder FAM dye-labeled probes against MYC (Hs00153408_m1, Thermo Fisher), SQSTM1 (Hs1061917_g1, Thermo Fisher), GABARAPL1 (Hs00740588_mH, Thermo Fisher), WIPI1 (Hs00924447_m1, Thermo Fisher), BECN1 (Hs01007018_m1, Thermo Fisher) and PRKAA1 (Hs01562315_m1, Thermo Fisher) and endogenous control VIC and TAMRA dye-labeled ACTB (Thermo Fisher).
Immunochemistry and immunofluorescence.
All cells were plated in glassbottom dishes (MatTEK Corporation) and imaged on a Zeiss 700 or Zeiss 710 confocal microscope with a 63×, 1.4-numerical aperture objective. Cells expressing mCherry-EGFP-LC3B or labeled with JC-1 were treated as indicated and imaged live. To quantify autophagic flux, the 488-nm and 561-nm laser lines were used to excite mCherry-EGFP-LC3B. Images were acquired in line mode to minimize movement of autophagosomes between acquisition of each channel. Images were analyzed in ImageJ as described previously for the quantification of macropinocytotic vesicles50. The ratio of the total fluorescence of mCherry+ vesicles to the total fluorescence of EGFP+ vesicles is reported as the autophagic index. Cells expressing EGFP-LC3B were treated as indicated, then fixed in 3.7% formaldehyde for 20 min and imaged in 0.001% BSA in PBS. For imaging mitochondria, cells were fixed in 3.7% paraformaldehyde for 15 min at 37 °C. Nonspecific signals were blocked using 0.01% BSA, and cells were permeabilized with 0.1% Triton (15 min). TOMM20 (Santa Cruz Biotechnology) was used to label mitochondria, followed by an Alexa-488 secondary antibody (Invitrogen). DAPI staining (1:10,000) was used to visualize the nucleus. To quantify mitochondrial morphology, cells were imaged and scored blind. More than 50 cells were imaged per cell line and per condition.
To quantify mitophagic flux49, the 488-nm and 561-nm laser lines were used to excite cox8-EGFP-mCherry. Images were acquired in line mode to minimize movement of mitochondria between acquisition of each channel. Images were analyzed in ImageJ by first thresholding each channel and finding the area of overlap. This overlap region was then used as a mask to analyze the mCherry channel for particles >500 nm2 in area and >0.15 in roundness to exclusively identify mCherry-only vesicles. The area of mCherry+ vesicles was then taken as a proportion of EGFP-mCherry overlap (that is, total mitochondrial area) and represented as a percentage.
Transmission electron microscopy.
Transmission electron microscopy samples were fixed with a solution containing 3% glutaraldehyde plus 2% paraformaldehyde in 0.1 M cacodylate buffer, pH 7.3, then washed in 0.1 M sodium cacodylate buffer and treated with 0.1% Millipore-filtered cacodylate-buffered tannic acid, postfixed with 1% buffered osmium, and stained en bloc with 1% Millipore-filtered uranyl acetate. The samples were dehydrated in increasing concentrations of ethanol, infiltrated, embedded in LX-112 medium, and polymerized in a 60 °C oven for ~3 d. Ultrathin sections were cut in an Ultracut microtome (Leica), stained with uranyl acetate and lead citrate in a Leica EM Stainer, and examined in a JEM 1010 transmission electron microscope (JEOL) at an accelerating voltage of 80 kV. Digital images were obtained using an AMT Imaging System (Advanced Microscopy Techniques).
Flow cytometry.
Apoptosis analyses were performed with the TACS Annexin V– FITC kit (Trevigen) according to the manufacturer’s protocol. Briefly, spent culture medium containing detached cells was collected, mixed with trypsinized cells and centrifuged at 300g for 5 min. After washing once in ice-cold 1× PBS, cells were incubated in Annexin V Incubation reagent (1% Annexin V–FITC, 1× propidium iodide solution, in 1× calcium-containing binding buffer) at room temperature for 15 min in the dark before being diluted 1:5 in 1× binding buffer. Cells were analyzed on a BD LSRFortessa flow cytometer, and 30,000 cells were collected and exported with FACSDiva v8.0.1 and analyzed with Cytobank. First, for a side scatter area (SSC-A) (y) versus forward scatter area (FSC-A) (x) dot plot, a ‘cells’ gate was used to exclude small and large debris that fell in the bottom right corner or off-scale on either axis. Cells were analyzed for apoptosis in a propidium idodide area (PI-A) (y) versus fluorescein isothiocyanate area (FITC-A) (x) dot plot and a quadrant gate was established around the healthy population of DMSO control cells (PI-A negative, FITC-A negative). To assess mitochondrial mass, cells were plated and treated the next day as indicated. After 24 h of treatment, cells were labeled with MitoTracker Green FM (50 nM, Thermo Fisher Scientific) in the presence of drug for 30 min according to the manufacturer’s instructions. Cells were subsequently washed with PBS, harvested with trypsin and washed an additional time with PBS before being resuspended in Tyrodes solution (20 mM HEPES, 135 mM NaCl, 1.8 mM CaCl2, 2 mM MgCl2, 5.6 mM glucose, pH 7.4) supplemented with 1% BSA (Tyrodes/BSA) and analyzed on a BD LSRFortessa flow cytometer. After separating live cells from debris and dead cells with a ‘cells’ gate in an SSC-A (y) versus FSC-A (x) dot plot, doublets were excluded with a forward scatter height (FSC-H) (y) vs FSC-A (x) dot plot and 30,000 singlet cells were analyzed for FITC staining on a histogram. Emission wavelengths were monitored with a 595-nm longpass filter and at 610 nm with a 20 nm bandpass (610/20) filter from a 561-nm laser line for PI, and with a 505-nm longpass filter and at 530 nm with a 30 nm bandpass (530/30) filter from a 488-nm laser line for FITC. Data were collected and exported with FACSDiva v8.0.1 and analyzed with FCS Express 6.
To assess mitochondrial potential in human PDAC cell lines, cells were plated and treated as described above, washed with PBS, harvested with trypsin, centrifuged at 300g for 5 min and resuspended in DMEM plus 10% FBS containing JC-1 mitochondrial dye (2 μM, Thermo Fisher Scientific) with inhibitor for 30 min at 37 °C. For cells treated with carbonyl cyanide 3-chlorophenylhydrazone (CCCP), cells were first incubated with 50 μM CCCP for 5 min at 37 °C before JC-1 was added. After incubation, cells were washed with PBS, resuspended in Tyrodes/BSA with drug and immediately analyzed on a BD LSRFortessa flow cytometer. Data were collected by monitoring emission wavelengths at 610 nm with a 20 nm bandpass (610/20) and a 595-nm longpass filter and at 530 nm with a 30 nm bandpass (530/30) and a 505-nm longpass filter with the 488-nm laser line for excitation. Data were exported with FACSDiva v8.0.1 and analyzed with FCS express 6. Cells were discriminated as described above, and singlet populations were gated using a dot plot of FCS-H (y) vs FCS-A (x). Compensation was performed manually using a dot plot of 610-nm emission (y) and 530-nm emission (x) of the control samples incubated with CCCP to give a homogenous population on the x-axis. Overlays were generated by plotting the signal from the 610-nm emission (representing JC-1 aggregates) versus 530-nm emission (representing JC-1 monomers) of the compensated data sets. Histograms represent the median JC-1 aggregate/monomer ratio from overlays.
To assess mitochondrial potential in iKRAS mouse cells, cells were seeded in 12-well plates. On the second day, cells were washed with PBS twice and cultured with or without doxycycline. After 24 h, tetramethyl rhodamine, ethyl ester (TMRE) was added to the cells in medium to a final concentration of 200 nM and incubated at 37 °C for 20 min. Cells were then harvested with trypsin and washed with PBS, and TMRE staining was analyzed on a Beckman Gallios Flow Cytometer. After excluding dead cells with DAPI staining, singlets gated with a FCS-H (y) vs FCS-A (x) dot plot were analyzed for TMRE staining on a histogram. Data were collected and analyzed with Kaluza Analysis 1.5a. The median of the TMRE signal was normalized to doxycycline ON (that is, KRAS expression). The mitochondrial uncoupler FCCP (20 μM) was added to doxycycline ON cells for 30 min before TMRE staining and then processed as described above as a positive control.
Sample preparation and reverse-phase protein microarray.
Six-well plates were lysed in buffer prepared and processed as we described previously51. Protein concentration was estimated using the Coomassie Protein Assay Reagent kit (Thermo Fisher Scientific) according to the manufacturer’s instructions. Cell lysates were diluted to 0.5 mg ml–1 in 2× Tris-glycine SDS Sample buffer (Life Technologies) supplemented with 5% β-mercaptoethanol and boiled for 8 min. Samples were stored at −20 °C until arrayed. Cell lysates and internal experimental controls were immobilized onto nitrocellulose-coated glass slides (Grace Bio-Labs) and printed in technical replicates (n = 3) using an Aushon 2470 automated system (Aushon BioSystems)52. Protein concentration in each sample was quantified in selected arrays using a Sypro Ruby Protein Blot Stain (Molecular Probes) protocol according to the manufacturer’s instructions. The remaining arrays were pretreated with Reblot Antibody Stripping solution (Chemicon) for 15 min at room temperature, followed by two washes with PBS, and incubated for 5 h in I-block (Tropix) before antibody staining51. Using an automated system (DakoCytomation), arrays were incubated with 3% hydrogen peroxide and blocked in biotin (DakoCytomation) and an additional serum-free protein block (DakoCytomation) to reduce nonspecific binding of endogenous proteins. Each array was probed for 30 min with one antibody targeting the protein of interest. Arrays were probed with ~160 antibodies targeting proteins involved in signaling networks that regulate cell growth, survival and metabolism (See Supplementary Table 2 for complete list). Antibodies were validated for their use on the RPPA platform as described53. Biotinylated anti-rabbit (Vector Laboratories) or anti-mouse secondary antibody (DakoCytomation) and a commercially available tyramide-based avidin-biotin amplification system (Catalyzed Signal Amplification System, DakoCytomation) were used for signal amplification. IRDye 680RD streptavidin (LI-COR Biosciences) was used as a fluorescent detection system. Sypro Ruby-and antibody-stained slides were scanned on a laser scanner (TECAN). Images were analyzed using commercially available software (MicroVigene Version 5.1.0.0, Vigenetech) as described54. Intensity levels of treated and untreated (DMSO control) cells were compared under a null hypothesis stating that there was not a difference between the means of the two groups. Quantilequantile plots were used to assess sample distribution and normality for each of the measured analyses. Based on sample distribution, a two-sided parametric t-test or a nonparametric Wilcoxon rank-sum test was used to compare the population means of treated and untreated (DMSO control) cells54. Statistical analysis was performed using the software package R; P ≤ 0.05 was considered statistically significant. Spearman’s nonparametric correlation analysis was performed for an experimental set of signaling proteins among all 24-h samples using the Hmisc package (v4.1–1) in R 3.4.3. Two-sided t-testing was used to assess the statistical significance of correlation coefficients. Unsupervised hierarchical clustering with the gplots package (v3.0.1) was used to generate heatmaps.
Oxygen consumption.
Human PDAC cell lines were harvested and seeded into XF96 cell culture microplates (Seahorse Bioscience). To measure oxygen consumption rate (OCR) after inhibitor treatment, cells were treated for 24 h with ERKi (SCH772984, 1 μM). On the day of the experiment, culture medium was exchanged for base assay medium containing 25 mM glucose, 1 mM glutamine and 1 mM sodium pyruvate; cells remained in the presence of their respective treatment conditions. Oligomycin, FCCP, antimycin and rotenone (XF Cell Mito Stress Test Kit, Seahorse Bioscience) were injected sequentially. Experiments were run using an XF96 analyzer and raw data were normalized to cell number, evaluated by live cell counting and imaged with a SpectraMax MiniMax 300 Imaging Cytometer (Molecular Devices). To measure OCR after KRAS suppression, cells were treated with siRNA targeting KRAS as described above. After 48 h of knockdown, cells were harvested, counted and seeded into XF96 cell culture microplates as described above. The next day, the XF Cell Mito Stress Test Kit was used and data were normalized as described above.
Metabolomics.
For the [1,6-13C2]glucose metabolic flux assay, cells were either treated with SCH772984 or transfected with siRNA targeting KRAS as described. Upon inhibitor treatment or after genetic suppression of KRAS, culture medium was exchanged with fresh DMEM containing 13C-labeled glucose and a 24-h time course experiment was performed during which media samples and cell extracts were collected at the indicated time points. Cells were rinsed with PBS and extracted in 100% methanol on ice, then vortexed and diluted to 80% methanol before being frozen at −80 °C overnight. Cell debris was removed by centrifugation at 15,000 r.p.m. for 5 min, and then extracts were dried in a speed vacuum. Dried extract was resuspended in 60 μl of 50:50 acetonitrile/water and vortexed, and 10 μl was used for LC-MS analysis. The LC portion used a HILIC column (Venusil HILIC Column, 3 μm, 100 Å, 2.1 × 100 mm, Agela Technologies) attached to an ABSciex 5600 TripleTOF mass spectrometer in positive mode as described37. All NMR spectra were processed using ACD/1D NMR Manager software (version 12.0; ACD/Labs). Isotopologues were determined from the mass spectral data as described37, using the software Isocor55.
For metabolite labeling assay by gas chromatography–MS (GC-MS), dried residues were resuspended in 25 μl of methoxylamine hydrochloride (2% (w/v) in pyridine) and incubated at 40 °C for 90 min. After brief centrifugation, 35 μl of N-tert-Butyldimethylsilyl-N-methyltrifluoroacetamide (MTBSTFA) plus 1% tert-Butyldimethylchlorosilane (TBDMS) was added, and the samples were incubated at 60 °C for 30 min. The derivatized samples were centrifuged for 5 min at 20,000g, and the supernatants were transferred to GC vials for GC-MS analysis. The injection volume was 1 μl, and samples were injected in split or splitless mode depending on analyte of interest. GC oven temperature was held at 80 °C for 2 min, increased to 280°C at a rate of 7 °C per min, and held at 280 °C for a total run time of 40 min. GC-MS analysis was performed on an Agilent 7890B GC system equipped with a HP-5MS capillary column (30 m, 0.25-mm internal diameter, 0.25-µm phase thickness; Agilent J&W Scientific), connected to an Agilent 5977 A GC/MS Spectrometer operating under ionization by electron impact at 70 eV. Helium flow was maintained at 1 ml min–1. The source temperature was maintained at 230 °C, the MS quad temperature at 150 °C, the interface temperature at 280 °C and the inlet temperature at 250 °C. Mass spectra were recorded in scan mode from m/z of 50 to 700. Measured mass isotopomer distributions, expressed as mol percentage, were corrected for natural enrichment56,57. For isotopologue analysis of 13C-labeled metabolites, glucose consumption and glycolytic flux of glucose to lactate were determined using 1H NMR spectroscopy as described37. To determine the TCA cycle flux, the time courses of M+1 and M+2 glutamate, representing the first and second turns of the TCA cycle, respectively, as described37, were plotted and fit with an exponential using Prism software (v. 5.0).
For one-dimensional LC–MS/MS-based polar metabolomics experiments, cells were cultured in DMEM containing 10% FBS until they reached 70% confluence. Media were exchanged with fresh DMEM containing either DMSO (vehicle) or SCH772984 (1 μM) for 22 h, then exchanged for fresh medium for another 2 h. Cells were rinsed with PBS and snap-frozen on dry ice. Cell extracts were prepared in 80% methanol on dry ice and incubated on dry ice for 30 min, and cell debris was removed. Extracts were lyophilized and subjected to mass spectrometry analysis according to published methodology58,59. Metabolite levels were normalized to the protein content of cell lysates obtained from cells treated with similar conditions.
Drug response testing.
Cells (1,000–2,500 per well depending on cell line) were seeded in 96-well plates and incubated for 24 h before addition of drug. For synergy studies with chloroquine, cells were treated with SCH772984 (19.5 nM to 10 μM), BVD-523 (19.5 nM to 10 μM) or binimetinib (4.87 nM to 2.5 μM) and chloroquine (0.78 μM to 12.5 μM) in a matrix. Cells were incubated at 37˚C for 72 h or 5 d before proliferation was quantified. For experiments involving other autophagy inhibitors, cells were treated with SCH772984 (19.5 nM to 10 μM) either alone or in combination with a constant amount of Spautin-1 (targeting Vps34; 1.25 μM), SBI-0206965 (targeting ULK1; 2 μM) or MRT68921 (targeting ULK½; 500 nM) (Xcessbio). DMSO was held constant at 5 nM. Cells were incubated at 37 ˚C for 5 d. Proliferation was quantified using a SpectraMax i3x multimode detection platform (Molecular Devices) by live-cell counting after labeling with calcein AM (500 nM, 15 min) (Invitrogen). Calcein AM labeling was used solely to mark cells (above background) for counting, thus total fluorescence was not used as a measure of viability. Alternatively, in for some assays, proliferation was assessed by incubation with 3-(4,5-dimethylthiazol-2-yl)-2,5-diphenyltetrazolium bromide (MTT, Sigma) for 3 h before cell lysis and quantification of absorbance at 550 nm. Parental ATG5 and ATG7 knockdown cells were generated as described above, plated and treated with SCH772984 (19.5 nM to 10 μM). At that time, samples were also collected for immunoblotting to confirm reduction in ATG5/7 proteins. Viability was assessed by live cell counting of calcein AM–labeled cells after 72 h of treatment. Percentage viability was calculated by normalizing treated values to vehicle-control (DMSO-treated) samples. Four-parameter drug response curves were generated with GraphPad Prism version 7.03. Combination indices were calculated with CompuSyn software.
For anchorage-dependent colony-formation assays, cells were seeded at a density of 750–2,500 cells per well depending on cell line. After 24 h, cells were treated with indicated concentrations of ERKi (SC772984 or BVD-523) and chloroquine. The cells were cultured until quantifiable colonies appeared in the DMSO control wells (10–14 d). Cells were stained with crystal violet and the total area covered by stain was quantified in Fiji.
For anchorage independent growth assays, cells were seeded into 100 μl of growth-factor-reduced Matrigel (Corning) domes in the centers of individual wells of a 24-well plate at a concentration of 5,000 cells per dome. The next day, wells were drugged as indicated. Matrix-embedded spheroids were grown for 2 weeks, and drugs were replenished every 4 d. To quantify proliferation, domes were incubated with AlamarBlue reagent (1:10 dilution of stock, Invitrogen) for 8–16 h. Media samples were transferred to a 96-well plate and fluorescence (560-nm excitation, 590-nm emission) was read using a SpectraMax i3x multimode detection platform (Molecular Devices). For organoid viability assays, organoids were dissociated and 3,000 single cells per well were seeded in 150 µl of 10% growth-factor-reduced Matrigel (Corning) and 90% human organoid feeding medium plus 10.5 µM Y27632 (Selleckchem) into poly(2-hydroxyethyl methacrylate)-coated (Sigma) 96-well, clear flat-bottom plates (Corning, 3903). On the second day after seeding organoids were drugged with SCH772984 (78.1 nM to 2.5 μM) and chloroquine (1.56–12.5 μM), and chloroquine was replenished every 4 d. At 10 d after drugging, organoids were imaged with the Molecular Devices SpectraMax i3x MiniMax 300 imaging cytometer. After image acquisition, organoid viability was accessed with Cell Titer Glo 3D Cell Viability assay (Promega) according to the manufacturer’s protocol on the SpectraMax i3x plate reader. Bliss independence scores were calculated and heatmaps were generated using R 3.4.3. Combination indices were calculated using Compusyn software.
Subject-derived xenotransplantation models.
PDX models were used to assess the effect of the ERK1/ERK2i plus hydroxychloroquine inhibitor combination on tumor growth. Subjects consented to the collection of tissue for the development of PDX models under approved Institutional Review Board protocol of the University of Arizona. NOD-SCID IL2Rγ null (NSG) mice were purchased from The Jackson Laboratory and experiments were performed at the University of Arizona. All mice were maintained in a specific pathogen-free facility and all animal experiments were performed in accordance with protocols approved by the Institutional Animal Care and Use Committees of the University of Arizona. All of the PDX models were established by direct engraftment of pancreatic cancer tissue fragments from subjects undergoing surgical resection into NSG mice, expanded and viably frozen at low passage for future use. All of the PDX models deployed were developed from subjects who were therapy naïve. To develop treatment cohorts, frozen PDX tumor fragments were thawed, implanted into recipient mice and expanded by passaging in mouse without exposing tumor fragments to in vitro conditions. PDX were passaged in NSG mice to develop treatment cohorts. Mice were randomized to treatment arms comprised of approximately equal numbers of male and female mice when tumors reached 100–200 mm3. All treatment arms contained four or more mice to support the statistical analysis performed. SCH772984 was delivered at 50 mg kg–1 6 d per week by intraperitoneal injection. Hydroxychloroquine was delivered at 60 mg kg–1 6 d per week via intraperitoneal injection. Tumor volumes were measured by digital calipers every 48 h. The mean tumor volume and s.e.m. were graphed. Only a subset of gross tumor pictures was taken; weight and volume measures represent all treated mice in study. Mice were killed when tumors reached >1,000 cm or at the end of 21 d of treatment.
Statistical Analysis.
Data were analyzed by GraphPad Prism built-in tests (specifics are indicated in figure legends). Data are presented relative to their respective controls. For all graphs, error bars indicate mean or median ± s.e.m. or s.d. for n ≥ 3 independent experiments (except where noted) and P values on graphs are denoted within each figure panel or in the Supplemental Information (RPPA data). Number of samples analyzed per experiment and whether data are the mean of multiple experiments, or selected as representative, are indicated in figure legends.
Reporting Summary.
Further information on experimental design is available in the Nature Research Reporting Summary linked to this article.
Extended Data
Extended Data Fig. 1. Genetic suppression of mutant KRAS increases autophagic flux in PDAC cell lines.
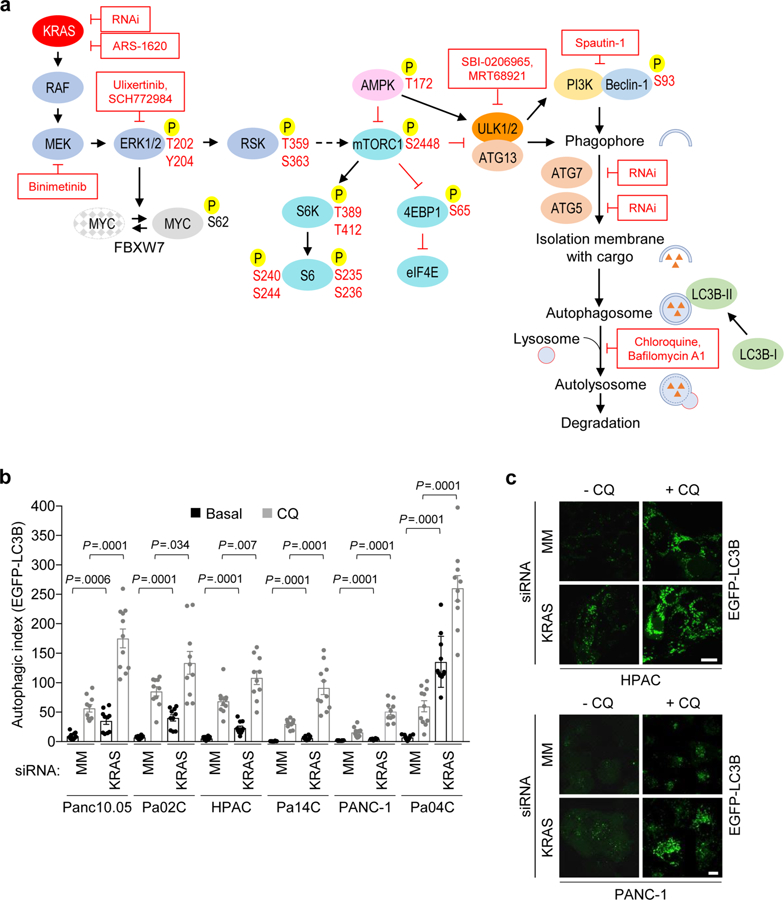
a, Signaling diagram displaying the multiple ways the KRAS ERK MAPK and autophagy pathways were perturbed in this study, as well as the specific components in autophagic signaling that were inhibited and monitored. Red text denotes phosphorylation sites that were assayed, and genetic and pharmacologic inhibitors that were used. b, A panel of human PDAC lines were transduced with a lentiviral vector to stably express EGFP-LC3B and transiently transfected with siRNA targeting KRAS (KRAS) or a mismatch (MM) control oligo (72 h) and treated with chloroquine (12 h) to assess flux. Quantification of EGFP+ punctae area normalized to cell area (autophagic index). Mean autophagic index is plotted, with each individual data point representing one field containing at least ten analyzed cells. Data are representative of two biological replicates for Pa02C and PANC-1 cells, and one biological replicate for Panc10.05, HPAC, Pa14C and Pa04C cells. P values shown are from unpaired, two-sided t-test; error bars represent s.e.m. c, Representative images of EGFP-LC3B expressing cells described and quantified in b. Scale bar, 20 μm..
Extended Data Fig. 2. Pharmacological inhibition of ERK1/ERK2 increases autophagic flux in PDAC cell lines.
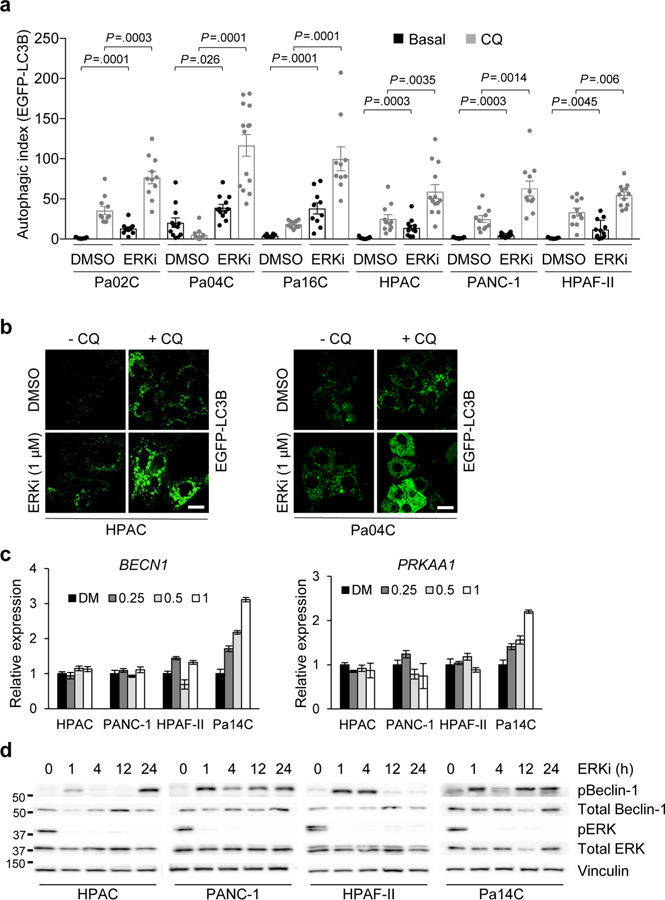
a, PDAC lines were transduced with a lentiviral vector to stably express EGFP-LC3B and treated with DMSO or SCH772984 (ERKi, 1 μM) for 24 h, and chloroquine was added (12 h) to assess flux. Mean autophagic index is plotted, with each individual data point representing one field containing at least ten analyzed cells. Data are representative of two independent experiments for HPAC and PANC-1 cells, and one independent experiment for Pa02C, Pa04C, Pa16C and HPAF-II cells. P values are from unpaired t-test; error bars denote s.e.m. b, Representative images of EGFP-LC3B-expressing cells described and quantified in a. Scale bar, 20 μm. c, PDAC cells were treated with SCH772984 (concentrations in µM shown) for 24 h, RNA was extracted and BECN1 and PRKAA1 gene expression was measured. mRNA levels were normalized to ACTB mRNA. Relative expression quantified via the double delta Ct method is plotted. Data are from one independent experiment; error bars represent s.d. of three technical replicates. d, PDAC cell lines were treated with SCH772984 (1 µM, ERKi) for a time course of 1, 4, 12 and 24 h. Shown are immunoblots to determine levels of phosphorylated Beclin-1 (pBeclin-1), total Beclin-1, phosphorylated ERK (pERK), total ERK and vinculin, and are representative of two independent experiments..
Extended Data Fig. 3. ERK inhibition influences the transcription and activation of upstream mediators of autophagic signaling.
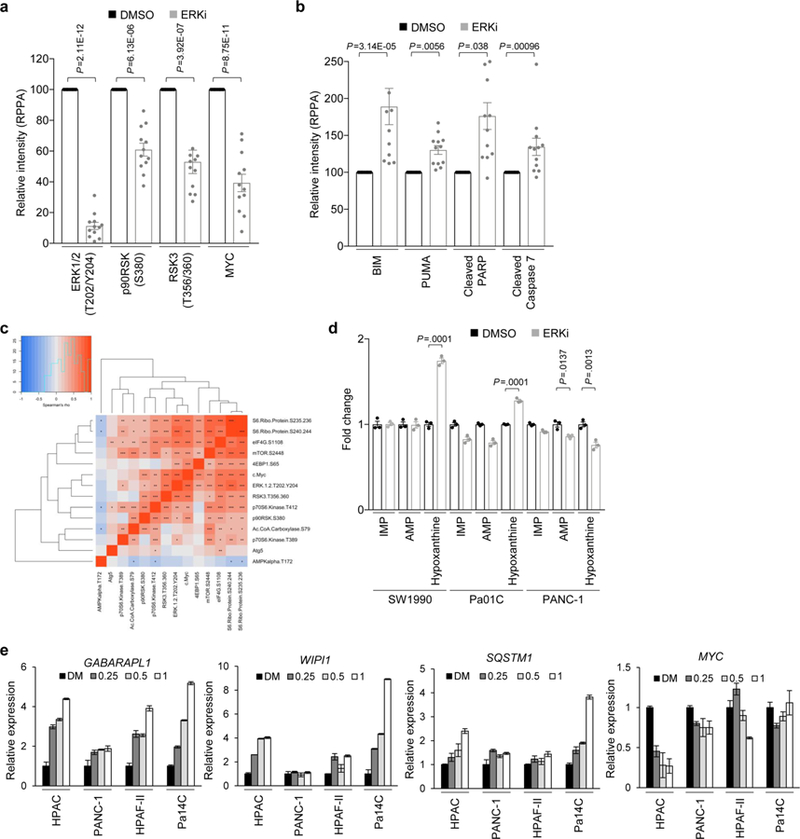
a, Mean comparisons of RPPA data for markers of ERK activity. All 12 cell lines were averaged based on treatment condition and treated as biological replicates. P values are from two-sided, unpaired t-test (RSK-3) or Wilcoxon test (all other proteins) comparing the mean of cells treated with SCH772984 (ERKi, 1 μM, 24 h) to untreated vehicle control (DMSO); error bars denote s.e.m. b, Mean comparisons of RPPA data for apoptotic markers. Means were calculated as described in a; P values are from Wilcoxon test; error bars denote s.e.m. c, Signaling pathway correlation analysis of RPPA data after treatment with vehicle (DMSO) or SCH772984 (1 μM, 24 h). Spearman’s correlation coefficients among 14 signaling proteins were used to create the heatmap. All 12 cell lines were averaged based on treatment condition and treated as biological replicates. Unsupervised hierarchical clustering analysis was performed on correlation coefficients. Red color represents positive correlation, gray represents no correlation and blue represents negative correlation (***P < 0.0005, **P < 0.005, *P < 0.05 from two-sided, unpaired t-test). d, Normalized mean-peak intensities for IMP, AMP and hypoxanthine identified from triplicate LC–MS/MS experiments. The mean metabolite concentrations from SCH772984-treated (ERKi, 1 μM) samples are normalized to DMSO controls; P values are from two-sided, unpaired t-test; error bars denote s.e.m. of mean peak intensity across three biological replicates. e, PDAC cells were treated with SCH772984 (concentrations in µM shown) for 24 h and RNA was extracted to measure GABARAPL1, WIPI1, SQSTM1 and MYC (control for ERK inhibition) gene expression. mRNA levels were normalized to ACTB mRNA. Relative expression quantified via the double delta Ct method is plotted. Data are from one independent experiment; error bars represent s.d. of three technical replicates.
Extended Data Fig. 4. Genetic silencing of KRAS and ERK inhibition reduces glycolytic flux in PDAC.
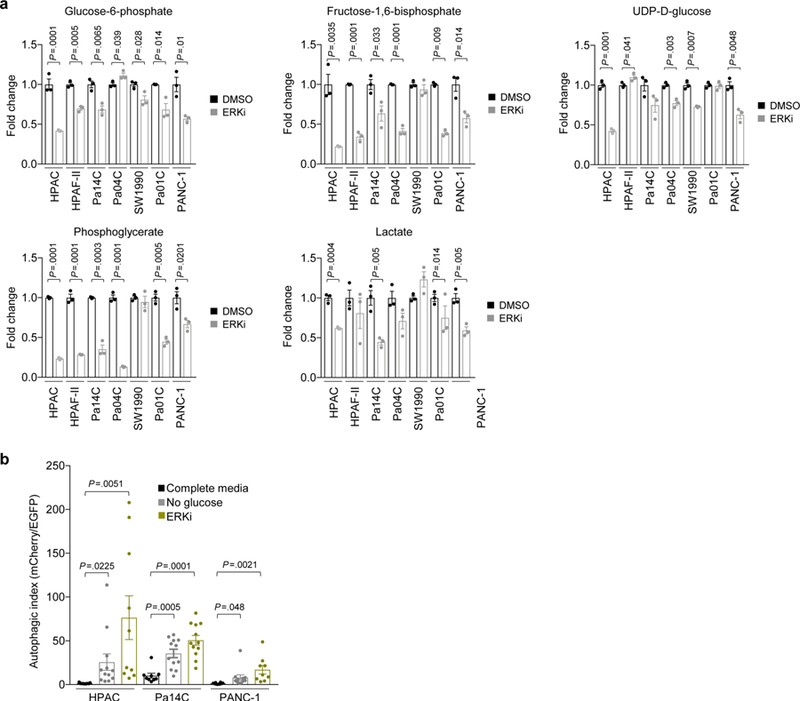
a, Normalized mean-peak intensities for indicated glycolytic metabolites identified from triplicate LC–MS/MS experiments. The mean metabolite concentrations from SCH772984-treated (ERKi, 1 μM) samples are normalized to DMSO controls and plotted for the seven PDAC lines assayed; P values are from two-sided, unpaired t-test; error bars denote s.e.m. Mean of three independent experiments is plotted. b, PDAC cells stably expressing EGFP-mCherry-LC3B were treated with SCH772984 (ERKi, 1 µM, 16 h) or cultured in medium containing dialyzed FBS and no glucose (16 h). Mean autophagic index is plotted, with each individual data point representing one field containing at least ten analyzed cells. Data for all cell lines are representative of two biological replicates; P values are from two-sided, unpaired t-test; error bars denote s.e.m.
Extended Data Fig. 5. Genetic silencing of KRAS and ERK inhibition alters mitochondrial dynamics in PDAC.
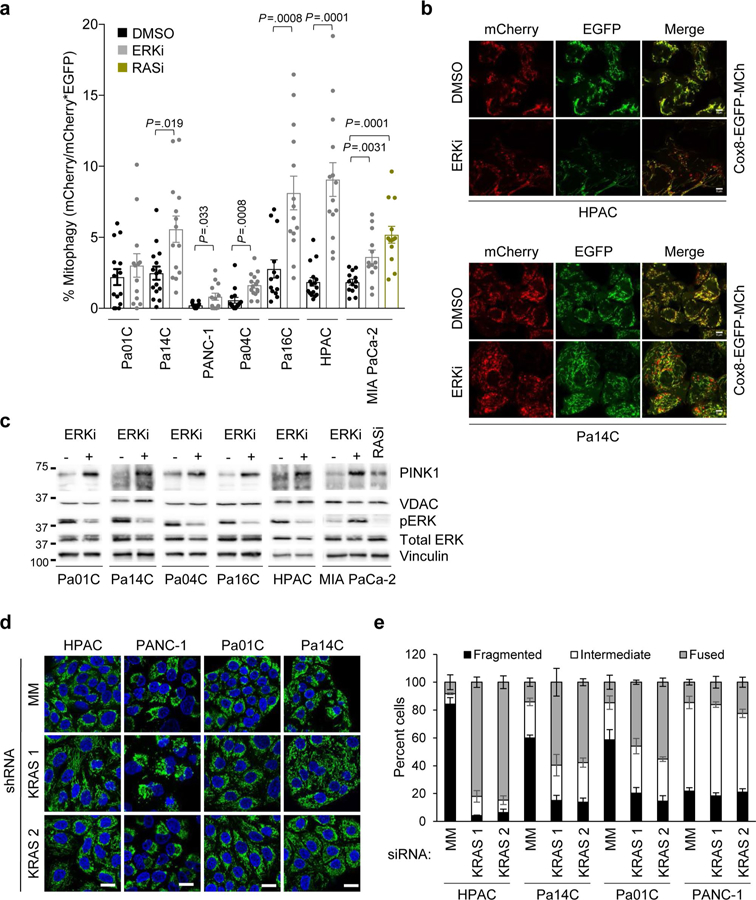
a, PDAC cells were transduced with the mitophagy probe COX8-mCherry-EGFP and treated with DMSO or SCH772984 (ERKi, 1 µM, 24 h). To assess mitophagy, the proportion of mCherryonly vesicles was quantified in relation to the total area of mitochondria (that is, EGFP+ and mCherry+). This proportion is represented as percentage mitophagy, with each individual data point representing one field containing at least ten analyzed cells; P values are from two-sided, unpaired t-test; error bars denote s.e.m. b, Representative images of HPAC and Pa14C cell lines expressing COX8-EGFP-mCherry quantified in l. Scale bar, 5 μm. c, Immunoblot analysis of PDAC cells treated with DMSO or SCH772984 (ERKi, 1 μM, 24 h) to determine the expression levels of PINK1, VDAC, phosphorylated ERK (pERK), total ERK and vinculin, representative of three independent experiments. d, PDAC cells were transiently transfected with siRNA constructs targeting KRAS (KRAS 1 and KRAS 2) or a mismatch (MM) control construct (72 h). Shown are representative images of mitochondrial morphologies after KRAS knockdown. Green, Anti-TOMM20; blue, DAPI. Scale bar, 20 μm. e, Quantification of mitochondrial morphologies observed in cells shown in d. Some 50 cells per condition per repetition were blindly scored and data are the mean of four independent experiments; error bars denote s.e.m.
Extended Data Fig. 6. Genetic silencing of KRAS decreases oxygen consumption in PDAC.
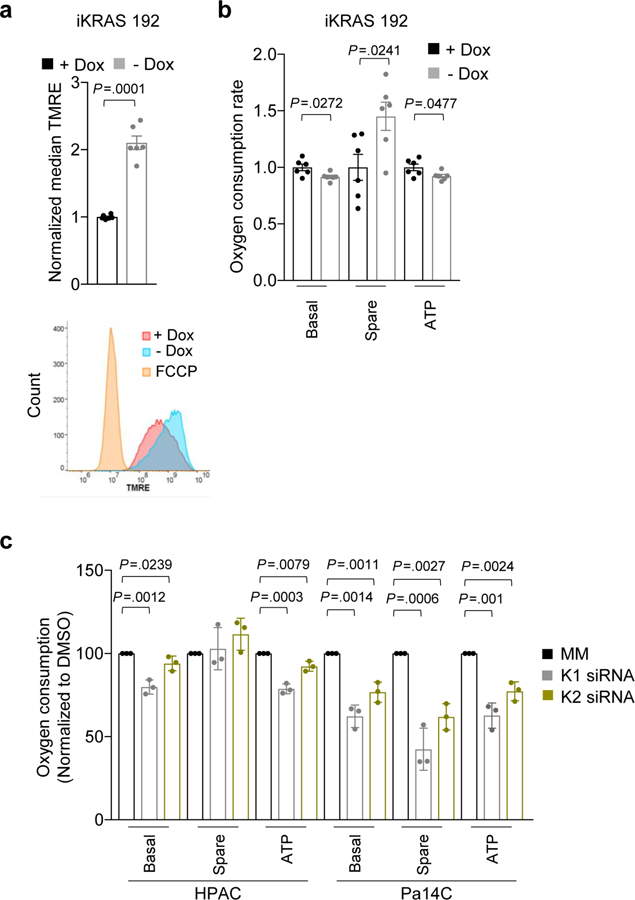
a, iKRAS 192 cells, derived from the doxycycline (Dox)inducible iKRAS mouse model, were cultured without doxycycline (24 h) to turn off Kras G12D expression. TMRE (200 nM) was added to the medium for 20 min and staining was analyzed by FACS. Median TMRE signal normalized to doxycycline ON is plotted and is the mean of six independent experiments; P values are from two-sided, unpaired t-test; error bars denote s.e.m. b, OCR response after doxycycline withdrawal (24 h) in iKRAS 192 cells. Mean oxygen consumption is plotted and is the mean of six independent experiments; P values are from two-sided, unpaired t-test comparing –Dox to +Dox, which was normalized to 1 for each measurement; error bars denote s.e.m. c, PDAC cell lines were transiently transfected with two siRNA constructs targeting KRAS (KRAS 1 or KRAS 2) or a mismatched control (MM). OCR response of PDAC cells after knockdown (60 h). Data are the mean of three independent experiments for each line, P values are from two-sided, unpaired t-test, comparing KRAS KD to MM, which was normalized to 100 for each measurement; error bars denote s.e.m.
Extended Data Fig. 7. ERK and MEK inhibition synergizes with the inhibition of autophagy to reduce proliferation in human PDAC cells.
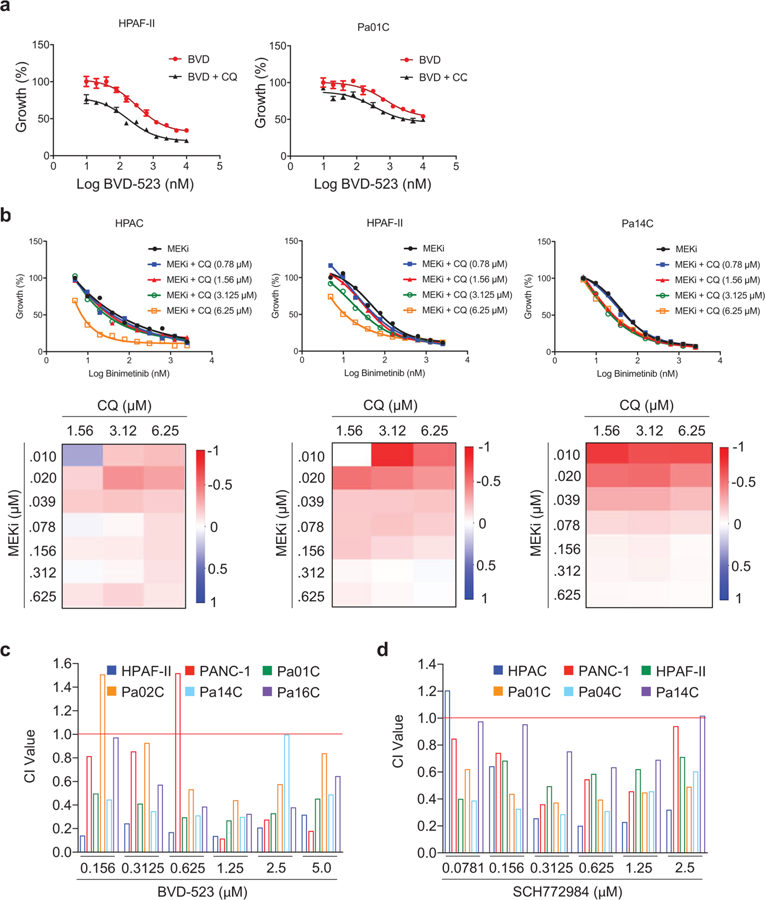
a, A panel of PDAC cell lines (indicated lines shown as representative) were treated with a range of BVD-523 concentrations (BVD, 0.0195–10 µM) and a constant concentration of chloroquine (CQ, 6.25 μM) for 72 h and proliferation was monitored by the addition of MTT (3 h) at end of experiment. Normalized absorbance at 590 nm, comparing treatment conditions to BVD-only DMSO control, which was normalized to 100, is plotted and error bars denote s.d. of three technical replicates. Curves are representative of four independent experiments. b, PDAC cells (indicated) were treated with a range of binimetinib concentrations (0.005–2.5 µM) and indicated constant concentrations of chloroquine, and proliferation was quantified via live cell counting after 5 d of treatment. Shown are dose response curves and heatmaps representing BLISS independence scores. Plots are representative of three independent experiments. c, CI values for a panel of indicated PDAC cell lines treated with BVD-523 were calculated using Compusyn. d, A panel of PDAC cell lines were treated with a range of SCH772984 concentrations (0.0195–10 µM) and a constant concentration of chloroquine (6.25 μM) for 72 h, and proliferation was monitored by live cell counting. CI values for a panel of indicated PDAC cell lines were calculated using Compusyn.
Extended Data Fig. 8. ERK inhibition synergizes with the inhibition of autophagy to reduce proliferation in subject-derived PDAC organoid models.
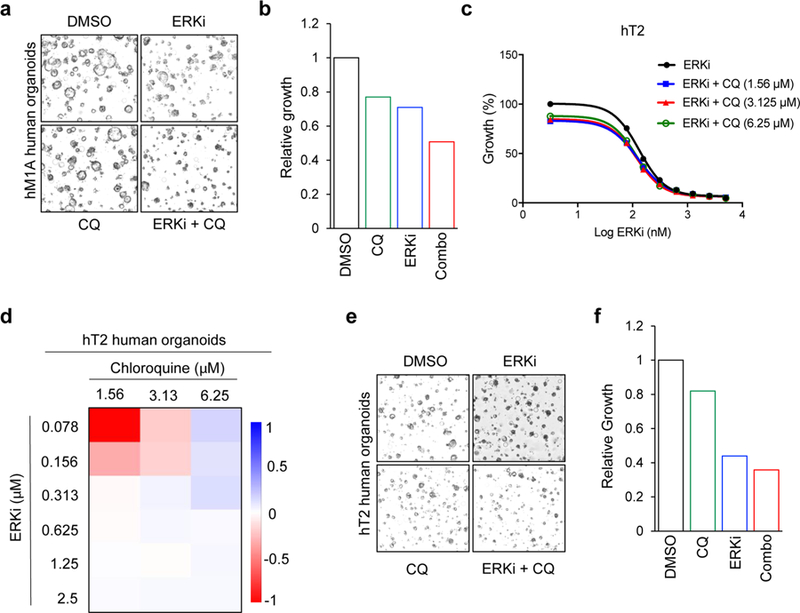
a, Representative images of organoids from experiment described in Fig. 5e,f. Scale bar, 100 μm. Images are representative of five independent experiments. b, Quantification of organoid viability in representative wells shown in a, representative of five independent experiments. c, hT2 subject–derived organoids were grown for 10 d in the presence of indicated concentrations of chloroquine (CQ) and SCH772984 (ERKi). Growth curves shown are representative of five independent experiments. d, BLISS independence scores from experiment described in c. e, Representative images of organoids from d; scale bar, 100 μm. Images are representative of five independent experiments. f, Quantification of organoid viability in representative wells shown in e, representative of five independent experiments.
Extended Data Fig. 9. ERK inhibition synergizes with the inhibition of autophagy to reduce tumor growth in PDAC PDX mouse models.
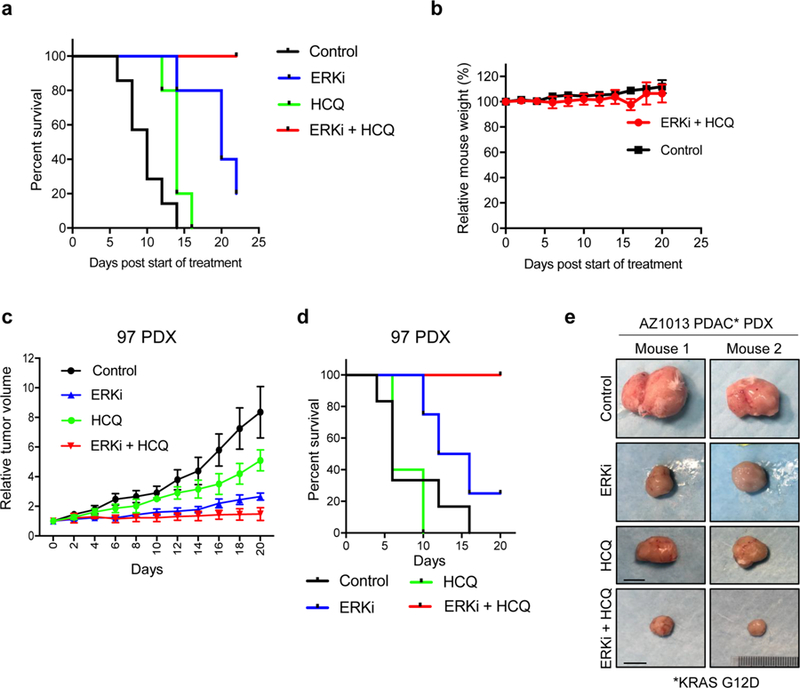
a, Kaplan-Meier survival curves for tumor-bearing NSG mice described in Fig. 5g. b, Relative mouse weights throughout the course of the experiment described in Fig. 5g. Plotted is the mean percentage change in weight, normalized to weight at day 0 of treatment. c, Immunocompromised (NSG) mice with implanted KRAS-mutant PDX tumors AZ97 were treated with SCH772984 (ERKi) and hydroxychloroquine (HCQ) alone or in combination for the indicated days. Mean tumor volume normalized to tumor volume at day 0 of treatment is plotted over time; error bars denote s.e.m. The control and single-agent data are the mean of four independent tumors and the combination is the mean of five independent tumors. d, Kaplan-Meier survival curves for tumor-bearing NSG mice described in c. e, Images of representative tumors from AZ1013 PDAC PDX treatment groups. Images of control and ERKi-treated tumors are reproduced from Vaseva et al60.
Extended Data Fig. 10. Inhibition of upstream regulators of autophagy reduces PDAC proliferation and synergizes with ERK inhibition.
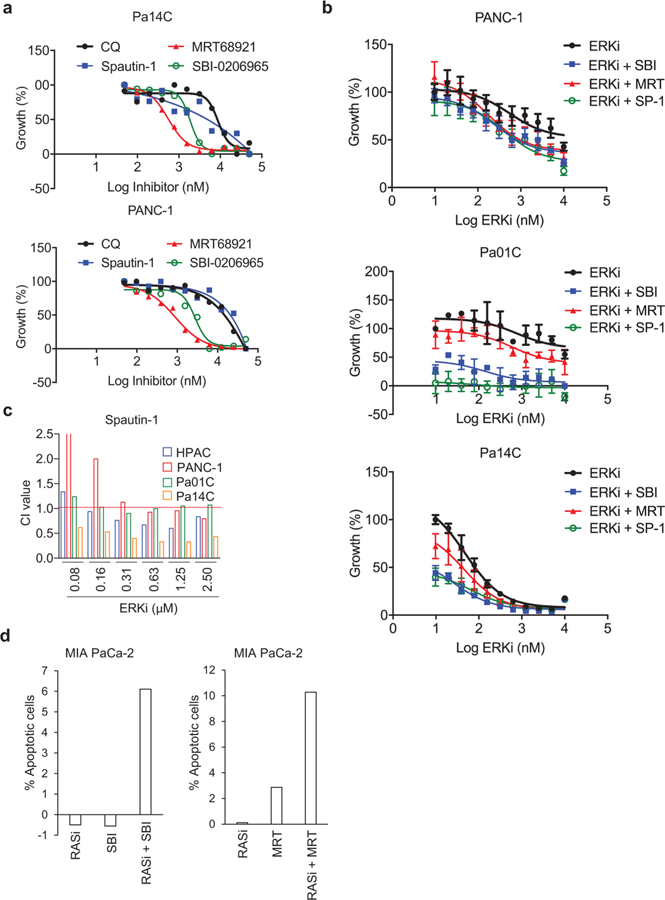
a, Additional PDAC cell lines (Pa14C and PANC-1) were treated with a two-fold dilution range (beginning at 50 µM) of the indicated autophagy inhibitors. Proliferation was assessed using live cell labeling with calcein AM. b, Additional PDAC cell lines were treated with a range of SCH772984 concentrations (ERKi, 0.0195–10 µM) and a constant concentration of each autophagy inhibitor: SBI-0206965 (SBI, 2 μM), MRT68921 (MRT, 500 nM) and Spautin-1 (SP-1, 1.25 μM). Proliferation was assessed by live cell counting. Normalized mean cell number, comparing treatment conditions to SCH (ERKi)-only DMSO control, which was normalized to 100, is plotted and error bars denote s.d. of three technical replicates. Curves are representative of three independent experiments. c, CI values for Spautin-1 + SCH772984 combination were calculated from representative data displayed in Fig. 6f for multiple cell lines. d, MIA PaCa-2 cells were treated with ARS-1620 (RASi, 3 µM), SBI-0206965 (SBI, 2 µM) or MRT68921 (MRT, 1 µM) alone or in combination (5 d). Apoptosis was monitored using FACS analysis of Annexin-V/propidium iodide-labeled cells. Percentage apoptotic cells (normalized to vehicle (DMSO) control) is plotted. Data are representative of two biological replicates.
Supplementary Material
Acknowledgements
We thank A. Maitra (MD Anderson Cancer Center) for PDAC cell lines, D. Tuveson (Cold Spring Harbor Laboratory) for patient-derived organoids, and C. Kinsey and M. McMahon (Huntsman Cancer Center) for helpful discussions and communication of data before publication. K.L.B. is thankful to B. Elzer Jr. for continued inspiration. Support was provided by grants from the National Cancer Institute (NCI) (R01CA42978, R01CA175747, U01CA199235, P50CA196510, P01CA203657 and R35CA232113), the Department of Defense (W81XWH-15–1-0611), the Lustgarten Foundation (388222) and the Pancreatic Cancer Action Network/American Association for Cancer Research (AACR) (15–90-25-DER) (C.J.D. and A.D.C.). K.L.B. was supported by NCI T32CA009156 and a grant from the Pancreatic Cancer Action Network/AACR (1570–25-BRYA). C.A.S. was supported by NCI T32CA009156 and F32CA232529. J.E.K. was supported by NCI T32CA009156 and F32 CA239328. A.M.W. was supported by American Cancer Society fellowship PF-18–061. B.P. was supported by the Deutsche Forschungsgemeinschaft (DFG PA 3051/1–1). G.A.H. was supported by NCI T32CA009156 and F32CA200313. T.K.H. was supported by NCI T32CA071341 and NCI F3180693. J.N.D. was supported by NCI T32CA071341. P.K.S. was supported by NCI grants R01 CA163649, R01 CA210439, R01 CA216853, and P30CA036727. A.C.K. was supported by NCI grants R01CA157490, R01CA188048 and P01CA117969, American Cancer Society Research Scholar Grant RSG-13–298-01-TBG, National Institutes of Health grant R01GM095567 and a grant from the Lustgarten Foundation. The Microscopy Services Laboratory, the UNC Flow Cytometry Core Facility and the Lenti-shRNA Core Facility (UNC) are supported in part by P30 CA016086 Cancer Center Core Support grant to the UNC Lineberger Comprehensive Cancer Center. Transmission electron microscopy was conducted in the High-Resolution Electron Microscopy Facility of the MD Anderson Cancer Center (supported by NIH P30CA016672).
Footnotes
Online content
Any methods, additional references, Nature Research reporting summaries, source data, statements of data availability and associated accession codes are available at doi.org/10.1038/s41591-019-0368-8.
Competing interests
C.J.D. is on the Scientific Advisory Board of Mirati Therapeutics. A.C.K. has financial interests in Vescor Therapeutics, LLC. A.C.K. is an inventor on patents pertaining to KRAS-regulated metabolic pathways, redox control pathways in pancreatic cancer, targeting GOT1 as a therapeutic approach, and the autophagic control of iron metabolism. A.C.K. is on the Scientific Advisory Board of Cornerstone/Rafael Pharmaceuticals.
Additional information
Extended data is available for this paper at https://doi.org/10.1038/s41591-019-0368-8.
Supplementary information is available for this paper at https://doi.org/10.1038/s41591-019-0368-8.
Publisher’s note: Springer Nature remains neutral with regard to jurisdictional claims in published maps and institutional affiliations.
Code availability
All unique code generated to analyze RPPA data will be deposited into the following github: https://github.com/derlab/Bryant_Nature_2018. The code for generating heatmaps representing BLISS scores has been deposited into the following github: https://github.com/SamuelDGeorge/R_Utilities.
Data Availability
Binary sequence alignment/map (BAM) files of RNA-seq data from KRAS knockdown and ERK inhibitor treatment studies are available from the European Bioinformatics Institute European Nucleotide Archive database (http://www.ebi.ac.uk/ena/) with accession numbers PRJEB25797 and PRJEB25806, respectively. For the KRAS knockdown study, the sample accession numbers are ERS2363485– ERS2363504 the ERK inhibitor treatment study, the sample accession numbers are ERS2367000–ERS2367034. All other data sets generated for the current study are available from the corresponding author upon request.
References
- 1.Hingorani SR et al. Preinvasive and invasive ductal pancreatic cancer and its early detection in the mouse. Cancer Cell 4, 437–450 (2003). [DOI] [PubMed] [Google Scholar]
- 2.Collins MA et al. Oncogenic Kras is required for both the initiation and maintenance of pancreatic cancer in mice. J. Clin. Invest 122, 639–653 (2012). [DOI] [PMC free article] [PubMed] [Google Scholar]
- 3.Ying H et al. Oncogenic Kras maintains pancreatic tumors through regulation of anabolic glucose metabolism. Cell 149, 656–670 (2012). [DOI] [PMC free article] [PubMed] [Google Scholar]
- 4.Ryan DP, Hong TS & Bardeesy N Pancreatic adenocarcinoma. N. Engl. J. Med 371, 2140–2141 (2014). [DOI] [PubMed] [Google Scholar]
- 5.Waters AM & Der CJ KRAS: The critical driver and therapeutic target for pancreatic cancer. Cold Spring Harb. Perspect. Med 8, a031435 (2017). [DOI] [PMC free article] [PubMed] [Google Scholar]
- 6.Cox AD, Fesik SW, Kimmelman AC, Luo J & Der CJ Drugging the undruggable RAS: mission possible? Nat. Rev. Drug. Discov 13, 828–851 (2014). [DOI] [PMC free article] [PubMed] [Google Scholar]
- 7.Papke B & Der CJ Drugging RAS: know the enemy. Science 355, 1158–1163 (2017). [DOI] [PubMed] [Google Scholar]
- 8.Stephen AG, Esposito D, Bagni RK & McCormick F Dragging ras back in the ring. Cancer Cell 25, 272–281 (2014). [DOI] [PubMed] [Google Scholar]
- 9.Bryant KL, Mancias JD, Kimmelman AC & Der CJ KRAS: feeding pancreatic cancer proliferation. Trends. Biochem. Sci 39, 91–100 (2014). [DOI] [PMC free article] [PubMed] [Google Scholar]
- 10.Kimmelman AC Metabolic dependencies in RAS-driven cancers. Clin. Cancer Res 21, 1828–1834 (2015). [DOI] [PMC free article] [PubMed] [Google Scholar]
- 11.Guo JY & White E Autophagy, metabolism, and cancer. Cold Spring Harb. Symp. Quant. Biol 81, 73–78 (2016). [DOI] [PMC free article] [PubMed] [Google Scholar]
- 12.Yang S et al. Pancreatic cancers require autophagy for tumor growth. Genes Dev 25, 717–729 (2011). [DOI] [PMC free article] [PubMed] [Google Scholar]
- 13.Yang A et al. Autophagy is critical for pancreatic tumor growth and progression in tumors with p53 alterations. Cancer Discov 4, 905–913 (2014). [DOI] [PMC free article] [PubMed] [Google Scholar]
- 14.Wolpin BM et al. Phase II and pharmacodynamic study of autophagy inhibition using hydroxychloroquine in patients with metastatic pancreatic adenocarcinoma. Oncologist 19, 637–638 (2014). [DOI] [PMC free article] [PubMed] [Google Scholar]
- 15.Boone BA et al. Safety and biologic response of pre-operative autophagy inhibition in combination with gemcitabine in patients with pancreatic adenocarcinoma. Ann. Surg. Oncol 22, 4402–4410 (2015). [DOI] [PMC free article] [PubMed] [Google Scholar]
- 16.Society of Surgical Oncology 70th Annual Cancer Symposium. Ann. Surg. Oncol 24, 1–202 (2017). [DOI] [PubMed] [Google Scholar]
- 17.Sanduja S et al. AMPK promotes tolerance to Ras pathway inhibition by activating autophagy. Oncogene 35, 5295–5303 (2016). [DOI] [PMC free article] [PubMed] [Google Scholar]
- 18.Ma XH et al. Targeting ER stress-induced autophagy overcomes BRAF inhibitor resistance in melanoma. J. Clin. Invest 124, 1406–1417 (2014). [DOI] [PMC free article] [PubMed] [Google Scholar]
- 19.Viale A et al. Oncogene ablation-resistant pancreatic cancer cells depend on mitochondrial function. Nature 514, 628–632 (2014). [DOI] [PMC free article] [PubMed] [Google Scholar]
- 20.Guo JY et al. Activated Ras requires autophagy to maintain oxidative metabolism and tumorigenesis. Genes Dev 25, 460–470 (2011). [DOI] [PMC free article] [PubMed] [Google Scholar]
- 21.Klionsky DJ et al. Guidelines for the use and interpretation of assays for monitoring autophagy (3rd edition). Autophagy 12, 1–222 (2016). [DOI] [PMC free article] [PubMed] [Google Scholar]
- 22.Kabeya Y et al. LC3, GABARAP and GATE16 localize to autophagosomal membrane depending on form-II formation. J. Cell. Sci 117, 2805–2812 (2004). [DOI] [PubMed] [Google Scholar]
- 23.Hayes TK et al. Long-term ERK inhibition in KRAS-mutant pancreatic cancer is associated with MYC degradation and senescence-like growth suppression. Cancer Cell 29, 75–89 (2016). [DOI] [PMC free article] [PubMed] [Google Scholar]
- 24.Janes MR et al. Targeting KRAS mutant cancers with a covalent G12C-specific inhibitor. Cell 172, 578–589 e517 (2018). [DOI] [PubMed] [Google Scholar]
- 25.White E Exploiting the bad eating habits of Ras-driven cancers. Genes Dev 27, 2065–2071 (2013). [DOI] [PMC free article] [PubMed] [Google Scholar]
- 26.Hanzelmann S, Castelo R & Guinney J GSVA: gene set variation analysis for microarray and RNA-seq data. BMC Bioinformatics 14, 7 (2013). [DOI] [PMC free article] [PubMed] [Google Scholar]
- 27.Campbell PM et al. K-Ras promotes growth transformation and invasion of immortalized human pancreatic cells by Raf and phosphatidylinositol 3-kinase signaling. Cancer Res 67, 2098–2106 (2007). [DOI] [PubMed] [Google Scholar]
- 28.Morris EJ et al. Discovery of a novel ERK inhibitor with activity in models of acquired resistance to BRAF and MEK inhibitors. Cancer Discov 3, 742–750 (2013). [DOI] [PubMed] [Google Scholar]
- 29.Moschos SJ et al. Development of MK-8353, an orally administered ERK½ inhibitor, in patients with advanced solid tumors. JCI Insight 3, 92352 (2018). [DOI] [PMC free article] [PubMed] [Google Scholar]
- 30.Chen SH et al. Oncogenic BRAF deletions that function as homodimers and are sensitive to inhibition by RAF dimer inhibitor LY3009120. Cancer Discov 6, 300–315 (2016). [DOI] [PubMed] [Google Scholar]
- 31.Foster SA et al. Activation mechanism of oncogenic deletion mutations in BRAF, EGFR, and HER2. Cancer Cell 29, 477–493 (2016). [DOI] [PubMed] [Google Scholar]
- 32.Federici G et al. Systems analysis of the NCI-60 cancer cell lines by alignment of protein pathway activation modules with “-OMIC” data fields and therapeutic response signatures. Mol. Cancer Res 11, 676–685 (2013). [DOI] [PubMed] [Google Scholar]
- 33.Kim J, Kundu M, Viollet B & Guan KL AMPK and mTOR regulate autophagy through direct phosphorylation of Ulk1. Nat. Cell Biol 13, 132–141 (2011). [DOI] [PMC free article] [PubMed] [Google Scholar]
- 34.Kashatus JA et al. Erk2 phosphorylation of Drp1 promotes mitochondrial fission and MAPK-driven tumor growth. Mol. Cell 57, 537–551 (2015). [DOI] [PMC free article] [PubMed] [Google Scholar]
- 35.Serasinghe MN et al. Mitochondrial division is requisite to RAS-induced transformation and targeted by oncogenic MAPK pathway inhibitors. Mol. Cell 57, 521–536 (2015). [DOI] [PMC free article] [PubMed] [Google Scholar]
- 36.Shestov AA et al. (13)C MRS and LC-MS flux analysis of tumor intermediary metabolism. Front. Oncol 6, 135 (2016). [DOI] [PMC free article] [PubMed] [Google Scholar]
- 37.Tech K et al. Pyruvate kinase inhibits proliferation during postnatal cerebellar neurogenesis and suppresses medulloblastoma formation. Cancer Res 77, 3217–3230 (2017). [DOI] [PMC free article] [PubMed] [Google Scholar]
- 38.Sullivan RJ et al. First-in-class ERK½ inhibitor ulixertinib (BVD-523) in patients with MAPK putant advanced solid tumors: results of a Phase I dose-escalation and expansion study. Cancer Discov 8, 184–195 (2018). [DOI] [PubMed] [Google Scholar]
- 39.Rabinowitz JD & White E Autophagy and metabolism. Science 330, 1344–1348 (2010). [DOI] [PMC free article] [PubMed] [Google Scholar]
- 40.Egan DF Small molecule inhibition of the autophagy kinase ULK1 and identification of ULK1 substrates. Mol. Cell 59, 285–297 (2015). [DOI] [PMC free article] [PubMed] [Google Scholar]
- 41.Petherick KJ et al. Pharmacological inhibition of ULK1 kinase blocks mammalian target of rapamycin (mTOR)-dependent autophagy. J. Biol. Chem 290, 11376–11383 (2015). [DOI] [PMC free article] [PubMed] [Google Scholar]
- 42.Liu J et al. Beclin1 controls the levels of p53 by regulating the deubiquitination activity of USP10 and USP13. Cell 147, 223–234 (2011). [DOI] [PMC free article] [PubMed] [Google Scholar]
- 43.Commisso C et al. Macropinocytosis of protein is an amino acid supply route in Ras-transformed cells. Nature 497, 633–637 (2013). [DOI] [PMC free article] [PubMed] [Google Scholar]
- 44.Cogliati S, Enriquez JA & Scorrano L Mitochondrial cristae: where beauty meets functionality. Trends. Biochem. Sci 41, 261–273 (2016). [DOI] [PubMed] [Google Scholar]
- 45.Garrido-Laguna I et al. Tumor engraftment in nude mice and enrichment in stroma-related gene pathways predict poor survival and resistance to gemcitabine in patients with pancreatic cancer. Clin. Cancer Res 17, 5793–5800 (2011). [DOI] [PMC free article] [PubMed] [Google Scholar]
- 46.Tiriac H et al. Organoid profiling identifies common responders to chemotherapy in pancreatic cancer. Cancer Discov 8, 1112–1129 (2018). [DOI] [PMC free article] [PubMed] [Google Scholar]
- 47.Kinsey CG et al. Protective autophagy elicited by RAF→MEK→ERK inhibition suggests a treatment strategy for RAS-driven cancers. Nat. Med 10.1038/s41591-019-0367-9 (2019). [DOI] [PMC free article] [PubMed] [Google Scholar]
- 48.N’Diaye EN et al. PLIC proteins or ubiquilins regulate autophagy-dependent cell survival during nutrient starvation. EMBO Rep 10, 173–179 (2009). [DOI] [PMC free article] [PubMed] [Google Scholar]
- 49.Rojansky R, Cha MY & Chan DC Elimination of paternal mitochondria in mouse embryos occurs through autophagic degradation dependent on PARKIN and MUL1. Elife 5, e17896 (2016). [DOI] [PMC free article] [PubMed] [Google Scholar]
- 50.Commisso C, Flinn RJ & Bar-Sagi D Determining the macropinocytic index of cells through a quantitative image-based assay. Nat. Protoc 9, 182–192 (2014). [DOI] [PMC free article] [PubMed] [Google Scholar]
- 51.Baldelli E et al. Reverse phase protein microarrays. Methods Mol. Biol 1606, 149–169 (2017). [DOI] [PubMed] [Google Scholar]
- 52.Pierobon M et al. Enrichment of PI3K-AKT-mTOR pathway activation in hepatic metastases from breast cancer. Clin. Cancer Res 23, 4919–4928 (2017). [DOI] [PMC free article] [PubMed] [Google Scholar]
- 53.Signore M & Reeder KA Antibody validation by western blotting. Methods Mol. Biol 823, 139–155 (2012). [DOI] [PubMed] [Google Scholar]
- 54.Baldelli E et al. Functional signaling pathway analysis of lung adenocarcinomas identifies novel therapeutic targets for KRAS mutant tumors. Oncotarget 6, 32368–32379 (2015). [DOI] [PMC free article] [PubMed] [Google Scholar]
- 55.Millard P, Letisse F, Sokol S & Portais JC IsoCor: correcting MS data in isotope labeling experiments. Bioinformatics 28, 1294–1296 (2012). [DOI] [PubMed] [Google Scholar]
- 56.Fernandez CA, Des Rosiers C, Previs SF, David F & Brunengraber H Correction of 13C mass isotopomer distributions for natural stable isotope abundance. J. Mass. Spectrom 31, 255–262 (1996). [DOI] [PubMed] [Google Scholar]
- 57.Tomcik K et al. Isotopomer enrichment assay for very short chain fatty acids and its metabolic applications. Anal. Biochem 410, 110–117 (2011). [DOI] [PMC free article] [PubMed] [Google Scholar]
- 58.Gunda V, Kumar S, Dasgupta A & Singh PK Hypoxia-induced metabolomic alterations in pancreatic cancer cells. Methods Mol. Biol 1742, 95–105 (2018). [DOI] [PubMed] [Google Scholar]
- 59.Shukla SK et al. MUC1 and HIF-1alpha signaling crosstalk induces anabolic glucose metabolism to impart gemcitabine resistance to pancreatic cancer. Cancer Cell 32, 71–87 e77 (2017). [DOI] [PMC free article] [PubMed] [Google Scholar]
- 60.Vaseva AV et al. KRAS Suppression-induced degradation of MYC is antagonized by a MEK5-ERK5 compensatory mechanism. Cancer Cell 34, 807–822 e807 (2018). [DOI] [PMC free article] [PubMed] [Google Scholar]
Associated Data
This section collects any data citations, data availability statements, or supplementary materials included in this article.