Abstract
Stimulated emission depletion (STED) nanoscopy is one of a suite of modern optical microscopy techniques capable of bypassing the conventional diffraction limit in fluorescent imaging. STED makes use of a spiral phase mask to enable 2D super-resolution imaging whereas to achieve full volumetric 3D super-resolution an additional bottle-beam phase mask must be applied. The resolution achieved in biological samples 10 µm or thicker is limited by aberrations induced mainly by scattering due to refractive index heterogeneity in the sample. These aberrations impact the fidelity of both types of phase mask, and have limited the application of STED to thicker biological systems. Here we apply an automated adaptive optics solution to correct the performance of both STED masks, enhancing robustness and expanding the capabilities of this nanoscopic technique. Corroboration in terms of successful high-quality imaging of the full volume of a 15µm mitotic spindle with resolution of 50nm x 50nm x 150nm achieved in all three dimensions is presented.
1. Introduction
Fluorescent nanoscopy has opened up a range of new scientific directions in the biological sciences as well as in optical physics and engineering. The need for super-resolution techniques grows year on year, with increasing demand to match experimental systems with the needs of the end users. Stimulated emission depletion (STED) microscopy [1] is one such technique, and has been shown to successfully resolve structures as small as 20nm in biological samples [2] whereas 5nm resolution has been demonstrated for imaging nitrogen vacancy colour centres in nano-diamonds [3,4].
The STED technique is well established [5] and by making use of appropriate beam shaping techniques [6–10] can operate in both 2D and 3D modes. For generating appropriate beam shapes, a specially designed mask is applied to the depletion beam in order to change its phase. Typically for 2D imaging a doughnut beam such as a Laguerre-Gaussian beam (vortex beam) is used [7], while introducing a π-step phase change produces the bottle-beam [8] that will deplete out-of-focus light, increasing the axial resolution [9] and giving 3D capability. Axial resolution enhancement can be also obtained with the combination of STED microscopy with 4-Pi microscopy [11–13].
Even though the resolution achieved by STED imaging is impressive, it is very often limited to very thin slices, imaging of beads or optically clear samples. For dense structures with thickness over 10µm, imaging with STED still remains a challenge, as optical aberrations increase. Imaging through thick samples has been reported using the LG depletion beam [14–17], as the 2π lateral STED phase mask shows stronger resistance to aberrations compared to the π-step axial STED phase mask [18]. To date there have been multiple reports showing imaging with 2D STED of thick samples, by using, for example, Bessel beams for imaging fluorescence beads at 155µm [17], or adaptive optics (AO) for imaging rat heart tissue at up to 36µm [16]. Urban et. al demonstrated 2D STED imaging of synapses inside 350um thick mouse brain slices up to 78μm deep, with the use of a glycerol objective with correction collar [19], while the combination of STED imaging with 2-photon microscopy, enabled imaging at the depth of 30μm inside slices of mouse brains [20] and 50μm in acute brain slices [21]. Imaging thick, dense specimens is much more challenging with the 3D STED phase mask and requires adaptive optics (AO) and aberration correction routines [22–24], and has so far been limited to proof of concept specimens. Recently, water immersion objective lens-based systems for aberration correction were used for 3D STED imaging of living fibroblasts at depth up to 37µm and up to 180µm for fluorescent beads [25]. However, 3D STED imaging with an oil immersion objective lens at significant depths is still a challenge. In this paper we present a custom-built AO 3D STED microscope, which we have used for full volumetric imaging of thick (>10µm) mitotic spindle samples with both 2D and 3D STED. We introduce a method for correcting the aberrations of the STED beam using sensorless wavefront correction based on minimisation of fluorescent signal. AO enabled a significant improvement in performance of the STED phase masks and expanded the capabilities of the imaging. By incorporating dynamic changes of the phase mask and improvement of the beam shape through aberration correction, we have built and demonstrated a super-resolution microscope that can be applied to realistic 3D cellular samples.
2. Methods
2.1 Optical setup of the AO 3D STED microscope
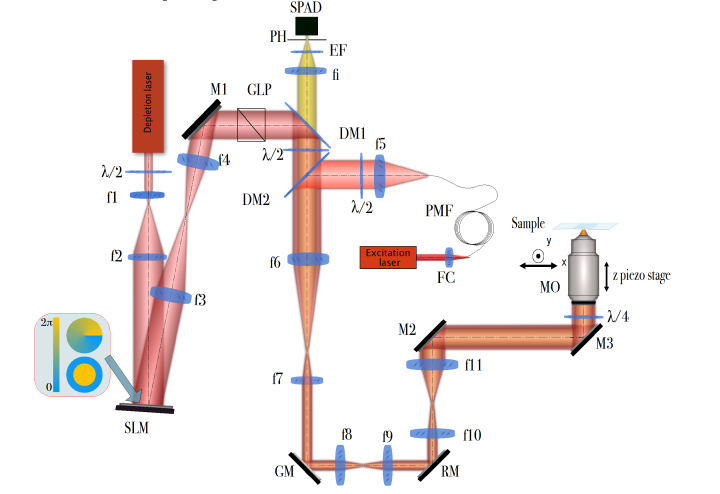
Figure 1 outlines our microscope system. We make use of picosecond pulsed laser diodes for both the STED (766nm, PicoQuant VisIR, 40MHz repetition rate, 56mW of average power measured at the back focal plane of the microscope objective, pulse width ≈0.45ns) and excitation (637nm, PicoQuant LDH P-C-635M, 40MHz repetition rate, 2.1mW of average power measured at the back focal plane of the microscope objective, pulse width <120ps) beams. The STED beam is expanded to illuminate a spatial light modulator (SLM) (Hamamatsu X-10468-02) which imprints the required phase modulation. This beam is then passed through relay optics to a pair of galvanometric mirrors (GM) and a resonant scanning mirror (RM) before being imaged onto the back focal plane of the microscope objective (MO; Nikon Plan apo λ, 100x, NA = 1.45). The objective z-position is controlled by a piezo-focussing-stage (Piezoconcept HS1.70). The excitation beam is overlapped with the STED beam through the use of an appropriate dichroic mirror (Chroma ZT647rdc-UF3), which is coupled into an optical fibre as a means of spatially filtering the beam. The appropriate temporal delay between the pulses is controlled by a picosecond electronic pulse delay unit (Micro Photon Devices Picosecond Delayer). A 150ps delay is used between arrival of the excitation pulse and depletion pulse, as both our own experimental evaluation and previously published work show that such a delay provides the highest depletion efficiency [5,26,27].
Fig. 1.
The optical setup of the custom-built AO 3D STED microscope. M1-M3 are beam steering mirrors, MO - microscope objective, f1-f11 and fi are lenses, FC - fibre coupling lens, RM - resonant mirror, GM - pair of galvanometric mirrors, PMF - polarisation maintaining single mode fibre, PH - pinhole, DM1-DM2 are dichroic mirrors as indicated in the text, GLP - glan laser polariser λ/2 - half-wave plate, λ /4 - quarter-wave plate, EF - emission filter, SPAD - single photon avalanche diode, SLM - spatial light modulator. Detailed description of the setup and its elements can be found in text.
The fluorescence emission beam path from the sample propagates along the same beam path as the depletion beam until it reaches a dichroic mirror (DM1 on Fig. 1, Semrock FF720-SDi01). DM1 transmits the emission beam and separates it from the depletion beam. The emission beam passes through the single-bandpass emission filter EM (Semrock 676/37) and is focused into a multi-mode fibre that acts as a pinhole (PH). A single photon avalanche diode is used for detection. It is connected to a National Instruments FPGA board (NI PCIe-7852R), which is used for counting the fluorescent photons and controlling the rest of the microscope setup.
The 16kHz fixed frequency resonant mirror is used in the imaging as this has been shown to be advantageous in STED microscopy, by successfully decreasing the photobleaching of fluorescent markers [28–30].
2.2 AO correction and imaging of thick samples
When imaging thick, dense structures, optical aberrations can significantly degrade the quality of the imaging beam and the resulting image. This is because the biological specimen is not optically clear and contains local variations of refractive index that introduce aberrations. This becomes crucial for STED imaging, as the aberrations can severely degrade the quality of the depletion beam, especially in the axial direction [18,31–34]. A solution to this problem is the addition of adaptive optics [35–38]. In this work we implemented a sensorless modal wavefront sensing aberration correction method [39]. In this approach the wavefront and its aberrations are approximated by the summation of a set of orthogonal modes, such as Zernike polynomials (as shown in Eq. (1)
| (1) |
where is a radial term [40] r is the normalised circular aperture radius , and φ is the azimuthal angle measured clockwise from the y-axis, n is the radial order and m, the azimuthal order.
Sensorless wavefront correction for STED imaging has been previously described by Gould et. al [22] and Patton et. al [24]. In our setup, we only correct for the aberrations occurring in the depletion beam, which is much more sensitive to aberrations than the excitation beam, and plays a crucial role in the final super-resolved image. Aberrations corresponding to Zernike polynomials are corrected one at a time. For each polynomial, a set of the values corresponding to the amplitude of each aberration is selected and applied. The phase pattern with the different mode amplitude values within the chosen range is then displayed on the SLM, deforming the wavefront in a controlled manner. An image is acquired for each of the previously defined aberration values and the quality metric is calculated (i.e. square of the total image intensity in our correction method). Through this process we are then able to maximize the quality metric, correcting the wavefront in turn.
The correction is a two-step process. In the first step, aberrations introduced by the optical system are corrected through direct visualization of gold nanobeads. The total image intensity is used as the quality metric [41]. In the second phase the depletion beam is corrected while imaging the fluorescent sample with the same total image intensity metric and the same set of Zernike polynomials. Both the excitation beam and depletion beam are used, in the absence of a STED phase mask. In this correction, instead of finding the maximum of the quality metric, we look for the minimum. This way we maximize the depletion efficiency through fine adjustment of the aberrations that originate at the sample. The intensity of the depletion laser is set to minimum value for which depletion is obtained, minimising the illumination intensity at the sample. For correcting aberrations of thick samples, the aberration correction routine is carried out for the full 3D volume of the imaged object.
2.3 Cell preparation
Human Retinal Pigmented Epithelial Cells (RPE-1) were chosen as a cell line for imaging the mitotic spindle. RPE-1 cells grow dense mitotic cell structures, with thickness over 10µm. The cells were cultured in a T75 flask at regular environmental conditions (37°C, 5% CO2 and 95% of humidity) with DMEM growing medium with 10% Fetal Bovine Serum (FBS), 2mM glutamine and antibiotics (100U penicillin/0.1mg/ml of streptomycin). When the cells became 100% confluent they were fixed onto #1.5 coverslips with freshly made 3.7% formaldehyde (FA) with an additional 0.1% of glutaraldehyde for preservation of the microtubule structure. After fixing, the cells were processed with an immunostaining protocol. Mouse anti-α-tubulin primary antibody (DM1A, catalogue number #T9026, Sigma-Aldrich) with 1:200 dilution was applied to the cells followed by the application of the Aberrior STAR635P secondary antibody with 1:50 dilution. In order to match the refractive index of the microscope lens immersion oil (n = 1.515) cells were mounted with 97% Thiodiethanol (TDE) in a step-wise manner. Coverslips were fixed to a microscope slide with transparent nail polish and left overnight in the freezer before use.
2.4 Image acquisition and processing
Images were acquired using custom software written in Labview. The software builds an image pixel by pixel by reading and counting the photons detected by the SPAD photon counter. Then the metadata is added to the images and they are converted to the OME-TIFF format [42]and stored and managed using OMERO software [43]. Further processing was done using ImageJ and Matlab. The colormap used for displaying images is cubehelix colormap [44], which maximises contrast and has the advantage of being easily converted to grayscale without loss of information. Smooth manifold extraction (SME) projection [45] was implemented in Matlab using the code provided by the authors of the FastSME [46].
3. Results
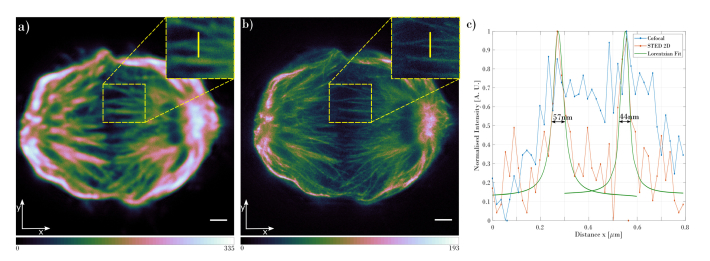
The samples were imaged in the AO 3D STED microscope, which has three imaging modes: confocal, 2D STED (imaging with the vortex phase mask applied to the depletion beam) and 3D STED (imaging with the π-step phase mask applied to the depletion beam). The stack for the mitotic spindle was acquired with all three microscope modes sequentially: 2D, 3D then confocal. Each optical section was separated by a 50nm step and each frame was acquired in 31s. The depletion laser power was set at an average power of 50mW with a 20MHz repetition rate. Mitotic spindle images were acquired for three different microscope modes: confocal, 2D STED (vortex phase mask) and 3D STED (π-step phase mask). Figure 2 shows the comparison of confocal and 2D STED images and have the size 800 x 800 pixels, with the pixel size of 18nm. The top of the mitotic cell is located 15µm from the coverslip. Before imaging, the aberration correction protocol was applied: the correction was carried out for the whole stack volume, acquiring 10 images of different, equally separated planes, starting at the bottom and finishing on top of the spindle. Then the total intensity of all images was summed and used as a metric. Zernike modes used for correction were: 1st, 2nd and 3rd orders of spherical aberrations and 1st order astigmatism, coma and trefoil. The experiments showed that correcting aberrations for the full volume of the imaged stack was sufficient for obtaining high quality images. Correct Zernike coefficients were established by acquiring a set of images at different depths separated by 3 µm and their intensities were summed. The quality metric was then applied to such a summed image. We found that there was no difference between correcting for the whole stack and for correcting individual planes.
Fig. 2.
Comparison of the mitotic spindle acquired with (a) confocal and (b) 2D STED. Images are displayed with the cubehelix colormap. The insets in (a) and (b) show the zoomed area marked with the dashed rectangle. The plot in (c) shows the intensity cross-section at the position shown by the yellow line in the zoomed images in (a) and (b). The blue plot shows the cross-section through the confocal image, red is the cross-section through 2D STED image and the green plots represents the Lorentzian fit to the 2D STED cross-section. The slices shown are at a depth of 5µm from the bottom of the mitotic cell. The scale bar is 1µm.
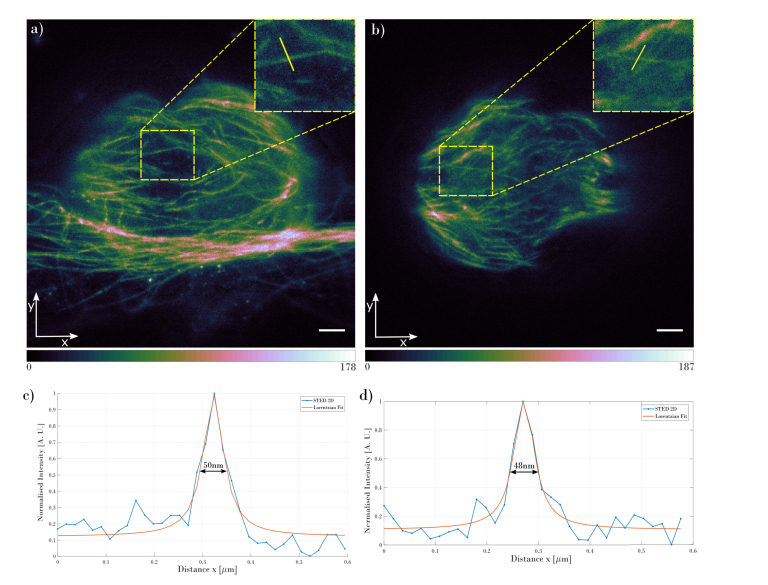
The 2D STED image in Fig. 2(b) clearly shows an increased resolution compared to the confocal image (Fig. 2(a)). In both images, the same area was chosen (as shown in the insets in Figs. 2(a) and 2(b)) and intensity cross-section was plotted, Fig. 2(c). The intensity plots show that the two individual microtubules can be unambiguously detected in the 2D STED image, while the confocal mode is only able to resolve them as a single structure in the marked position. In order to estimate the resolution of the acquired images, the full width at half maximum (FWHM) was calculated for the Lorentzian fit to the 2D STED data. The resolution obtained for microtubules shown in the Fig. 2 demonstrates a resolving power of 44nm. Comparing the 2D STED imaging resolution to the Abbe’s limit (220nm) gives 5-fold increase of the microscope resolution. To verify the resolution of the microscope in the whole volume of the imaged mitotic spindle, the FWHM has been calculated for the slice located 1µm (Fig. 3(a)) and 10µm (Fig. 3(b)) from the bottom of the spindle. Results confirm that the microscope can resolve structures as small as 50nm in the lateral direction. Figure 3 shows the acquired slices at different depths of the imaged structure and intensity cross-sections through the microtubules that were used for the FWHM calculation.
Fig. 3.
Slices of the mitotic spindle acquired with the 2D STED mode at different depths measured from the bottom of the cell: (a) 1µm from the bottom and (b) 10µm from the bottom. Insets in the images show the zoomed area marked with the yellow dashed rectangle. Plots in (c) and (d) show the intensity cross-sections for the microtubules, at the position marked with the yellow line inside the insets. The scale bar on both images are 1µm.
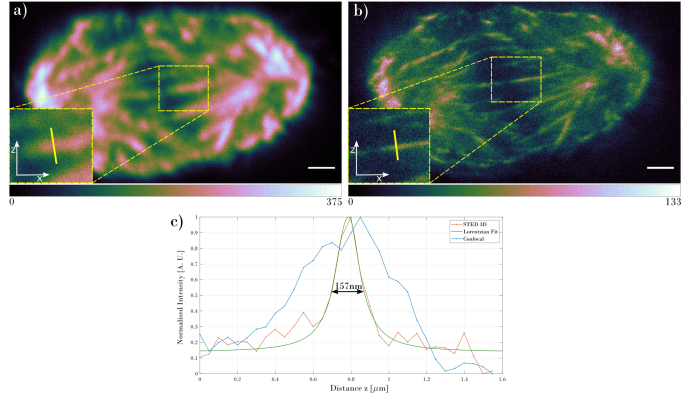
Switching to the 3D STED modality allows comparison with the confocal resolution in the z-direction. Figure 4 shows the comparison between the two modes, illustrating the xz view, using the same pixel number and size, z-sectioning distance, exposure time and laser power as in Fig. 2. The 3D STED image shows much finer details in the axial direction as well as being much sharper compared to the confocal image.
Fig. 4.
Comparison of the xz views of the mitotic spindle acquired using (a) confocal and (b) 3D STED. The insets show zoomed areas marked with the yellow rectangle. The plots in (c) show intensity cross-sections marked with the yellow line inside the insets. Scale bar in both images are 1µm.
The calculated FWHM for the 3D STED images gives the axial resolution as 157nm. The calculated FWMH for the confocal imaging gives an axial resolution of 652nm, which compares well with a calculated FWHM of 606nm using Abbe’s resolution. Thus, the 3D STED microscope achieves a 4-fold increase in axial resolution compared to conventional confocal imaging. We also evaluated the lateral resolution for the 3D STED images using FWHM of microtubules and observed a value of 178nm, while FWHM of the same structure in confocal image resulted in value of 239nm. This is also a significant improvement over the diffraction limited, confocal image. The 3D STED images exhibit an intensity decrease compared with the 2D STED images, as they were obtained after acquiring the 2D STED stack.
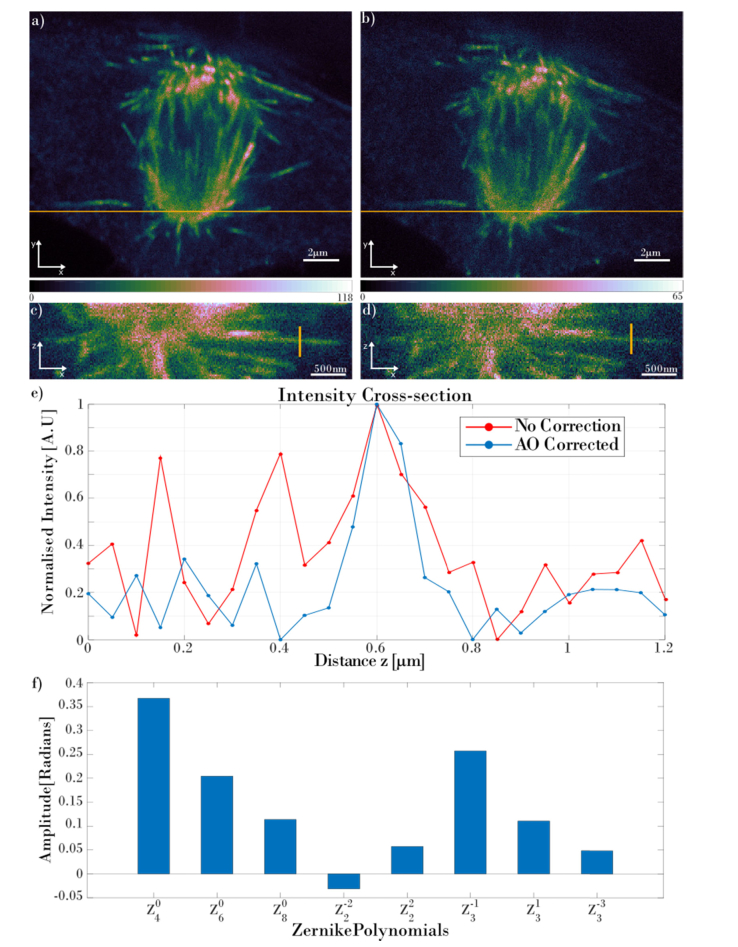
For the comparison of the images obtained with and without the aberration correction routine, a stack of optical sections of a mitotic spindle from a different cell was acquired using π-step STED phase mask (3D STED), as it is more sensitive to aberrations. Figure 5 shows the comparison of 3D STED images obtained with and without the aberration correction. In order to make sure that the quality of the non-corrected image is decreased due to the aberrations and not due to the photobleaching, the non-corrected 3D STED stack of mitotic spindle was acquired in the first instance. It was followed by the aberration correction routine of the whole imaged volume and the acquisition of the corrected stack. Figure 5(a) presents the xy slice acquired 4µm from the coverslip of the 3D STED image with aberration correction; Fig. 5(b) shows the same slice without aberration correction and this image is significantly dimmer and has a higher noise level than Fig. 5(a). Figures 5(c) and 5(d) show the xz views of the stack obtained with and without aberration correction respectively. Figure 5(e) shows the cross-sections A-A marked with the yellow vertical lines in images in Figs. 5(c) and 5(d). The cross-section of the microtubule with the aberration correction shows unambiguous profile of the microtubule structure. Calculating the SNR (mean µ of the signal divided by the standard deviation σ of the background, SNR = µ/σ [47]) results in SNRCorr = 99.45 and SNRUncorr = 64.35 for the aberration corrected image and uncorrected image respectively. For the calculation, the regions of interest (ROIs) with signal and background of the same size were chosen. Then, using ImageJ, the average intensity Z-projection was performed and for such projection the µ and σ values were calculated. Comparing both SNR values, the aberration corrected stack gave 1.55 times higher SNR compared to the uncorrected stack, showing the strong improvement of the quality of the aberration corrected images. When analysing the xz cross-section of the uncorrected microtubule, the noise is much more evident, and the cross-section does not unambiguously show the microtubule structure. The mitotic spindle imaged with the corrected depletion beam gives a higher quality image and better SNR level, even though the corrected stack was acquired after the acquisition of the uncorrected stack, hence the signal should have dropped due to the photobleaching. Overall, Fig. 5 shows the improvement in SNR and resolution delivered by the aberration correction.
Fig. 5.
The comparison of the mitotic spindle stack obtained with and without aberration correction. Images (a) and (b) show the xy slice obtained at the 4µm distance from the coverslip with and without the aberration correction respectively. (c) and (d) show the corrected and uncorrected XZ views respectively, taken at the location marked with the yellow horizontal lines in (a) and (b). (e) presents the intensity cross-section marked with the vertical yellow lines in (c) and (d). Red plot presents the uncorrected cross-section and blue plot presents the corrected cross-section. Graph (f) presents the amplitudes of the Zernike coefficients that are applied to the SLM.
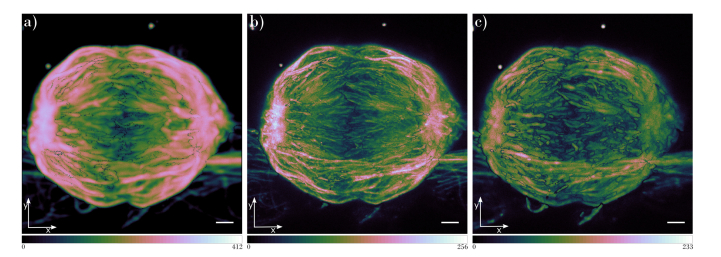
As shown in Figs. 2-4, our AO 3D STED microscope enables imaging of thick structures with the resolution significantly surpassing the diffraction limit. The microscope enables imaging with 50nm lateral resolution and 150nm axial resolution. With the addition of adaptive optics, the resolution is consistent throughout the whole 3D stack of dense biological structure, such as a mitotic spindle with a thickness of 15µm. Figure 6 shows the comparison of the confocal, 2D STED and 3D STED smooth manifold extraction (SME) projection [45], as an alternative to the maximum intensity projection (MIP). SME projection is an algorithm that enables a 2D representation of a 3D volume to be produced by extracting continuous focused 2D data from the 3D volume. It has been shown that it preserves local spatial relationships accurately while, in contrast, the MIP projection mixes all the stack layers together and does not provide a reliable geometric interpretation of the sample [45]. We used the Fast SME algorithm for decreasing computation time of calculation of SME projection [46].
Fig. 6.
Smooth Manifold Extraction (SME) projection of the stacks acquired using (a) confocal, (b) 2D STED and (c) 3D STED microscope mode with the aberrations corrected. Scale bar in all images is 1µm.
4. Summary
In this paper we proposed a custom-built AO 3D STED microscope which enables full volume super-resolution imaging of thick biological highly scattering samples. We demonstrated that widely used general immunostaining protocol is sufficient for imaging in the STED system and no specially optimised sample preparation is needed. The use of adaptive optics in 3D STED mode allows correction of aberrations that originate in both optical components and the biological specimen. We used an aberration correction protocol based on the modal sensing method with a basic total image intensity quality metric. We proposed a method for the aberration correction of depletion beam by the minimisation of the fluorescent signal. Such aberration correction protocol can be applied directly on the sample image. In the correction process we use as low laser intensities as possible so that the sample exposure to the high power depletion beam is minimised to avoid photobleaching as much as possible.
The key feature of our 3D AO STED system is its application to a routine, yet optically challenging, biological sample. Human cells in culture round up during progression through the mitosis, and when grown on a conventional coverslip will be 12-15 um thick. Variations in refractive index in biological material make imaging in thick specimens challenging for optical methods like STED that are sensitive to aberrations. Our AO 3D STED system compensates for aberrations and also preserves signal making it practical to collect a full 3D stack of optical sections through relatively thick specimens.
We showed the capabilities of our AO 3D STED setup for imaging a thick and optically dense biological specimen with thickness >10µm. The SLM used in the setup enables both aberration correction and dynamic changes of the STED phase mask, which allows switching between 2D and 3D STED imaging. The mitotic spindles shown in Figs. 2-4 show much sharper images in all 3 dimensions, with the lateral resolution <50nm and axial resolution <160nm. Comparison of the corrected und uncorrected images presented in Fig. 5 show the superiority of the images obtained with the corrected depletion beam, manifested in the 1.5-fold increase of the SNR. The aberration correction performed on the full volume of the imaged sample offers consistent resolution at all planes of the imaged structure, confirmed by calculating the FWHM at the bottom, middle and top of the structure. Imaging of a full 3D volume, namely a thick mitotic spindle was shown here for first time using super-resolution STED modality using a staining protocol, imaging lightpath and objective lens that are routinely available. The system enables the acquisition of full super-resolution volumes comprised of greater than 200 optical sections, which in turn enables the detection of sub-resolution cellular organelles throughout the full volume. Our results indicate that aberration correction is crucial and enables obtaining high quality and super-resolved images of thick biological specimens using 3D STED nanoscopy.
Acknowledgements
We would like to acknowledge the help of Michael Porter and Dr Iain Porter for the guidance and assistance in showing cell culturing, fixing and immunostaining protocols. We would also like to thank for the help of Dr Brian Patton for his useful tips regarding the optical setup. P. Z. would like to acknowledge Dr Maciej Trusiak for fruitful discussion and comments.
Funding
The People Programme (Marie Curie Actions) of the European Union’s Seventh Framework Programme (FP7/2007-2013) under REA grant agreement No 608133. The microscope development was supported by the Wolfson Foundation and the Scottish Universities Physics Alliance (SUPA). P. Z. would like to acknowledge that preparation of the paper was supported by National Science Center, Poland, under the project OPUS 13 (UMO- 2017/25/B/ST7/02049); Statutory funds of Faculty of Mechatronics of Warsaw University of Technology.
Disclosures
The authors declare that there are no conflicts of interest related to this article.
References
- 1.Hell S. W., “Far-Field Optical Nanoscopy,” Science 316(5828), 1153–1158 (2007). 10.1126/science.1137395 [DOI] [PubMed] [Google Scholar]
- 2.Göttfert F., Wurm C. A., Mueller V., Berning S., Cordes V. C., Honigmann A., Hell S. W., “Coaligned dual-channel STED nanoscopy and molecular diffusion analysis at 20 nm resolution,” Biophys. J. 105(1), L01–L03 (2013). 10.1016/j.bpj.2013.05.029 [DOI] [PMC free article] [PubMed] [Google Scholar]
- 3.Rittweger E., Han K. Y., Irvine S. E., Eggeling C., Hell S. W., “STED microscopy reveals crystal colour centres with nanometric resolution,” Nat. Photonics 3(3), 144–147 (2009). 10.1038/nphoton.2009.2 [DOI] [Google Scholar]
- 4.Wildanger D., Patton B. R., Schill H., Marseglia L., Hadden J. P., Knauer S., Schönle A., Rarity J. G., O’Brien J. L., Hell S. W., Smith J. M., “Solid immersion facilitates fluorescence microscopy with nanometer resolution and sub-ångström emitter localization,” Adv. Mater. 24(44), OP309–OP313 (2012). 10.1002/adma.201203033 [DOI] [PMC free article] [PubMed] [Google Scholar]
- 5.Blom H., Widengren J., “Stimulated Emission Depletion Microscopy,” Chem. Rev. 117(11), 7377–7427 (2017). 10.1021/acs.chemrev.6b00653 [DOI] [PubMed] [Google Scholar]
- 6.Kennedy S. A., Szabo M. J., Teslow H., Porterfield J. Z., Abraham E. R. I., “Creation of Laguerre-Gaussian laser modes using diffractive optics,” Phys. Rev. A – At. Mol. Opt. Phys. 66, 438011 (2002). [Google Scholar]
- 7.Török P., Munro P., “The use of Gauss-Laguerre vector beams in STED microscopy,” Opt. Express 12(15), 3605–3617 (2004). 10.1364/OPEX.12.003605 [DOI] [PubMed] [Google Scholar]
- 8.Arlt J., Padgett M. J., “Generation of a beam with a dark focus surrounded by regions of higher intensity: the optical bottle beam,” Opt. Lett. 25(4), 191–193 (2000). 10.1364/OL.25.000191 [DOI] [PubMed] [Google Scholar]
- 9.Klar T. A., Jakobs S., Dyba M., Egner A., Hell S. W., “Fluorescence microscopy with diffraction resolution barrier broken by stimulated emission,” Proc. Natl. Acad. Sci. U.S.A. 97(15), 8206–8210 (2000). 10.1073/pnas.97.15.8206 [DOI] [PMC free article] [PubMed] [Google Scholar]
- 10.Wildanger D., Medda R., Kastrup L., Hell S. W., “A compact STED microscope providing 3D nanoscale resolution,” J. Microsc. 236(1), 35–43 (2009). 10.1111/j.1365-2818.2009.03188.x [DOI] [PubMed] [Google Scholar]
- 11.Schmidt R., Wurm C. A., Jakobs S., Engelhardt J., Egner A., Hell S. W., “Spherical nanosized focal spot unravels the interior of cells,” Nat. Methods 5(6), 539–544 (2008). 10.1038/nmeth.1214 [DOI] [PubMed] [Google Scholar]
- 12.Curdt F., Herr S. J., Lutz T., Schmidt R., Engelhardt J., Sahl S. J., Hell S. W., “isoSTED nanoscopy with intrinsic beam alignment,” Opt. Express 23(24), 30891–30903 (2015). 10.1364/OE.23.030891 [DOI] [PubMed] [Google Scholar]
- 13.Böhm U., Hell S. W., Schmidt R., “4Pi-RESOLFT nanoscopy,” Nat. Commun. 7(1), 10504 (2016). 10.1038/ncomms10504 [DOI] [PMC free article] [PubMed] [Google Scholar]
- 14.Auksorius E., Boruah B. R., Dunsby C., Lanigan P. M. P., Kennedy G., Neil M. A. A., French P. M. W., “Stimulated emission depletion microscopy with a supercontinuum source and fluorescence lifetime imaging,” Opt. Lett. 33(2), 113–115 (2008). 10.1364/OL.33.000113 [DOI] [PubMed] [Google Scholar]
- 15.Yan W., Yang Y., Li Y., Peng X., Lin D., Qu J., Ye T., “Aberration correction for stimulated emission depletion microscopy with coherent optical adaptive technique,” Adapt. Opt. Wavefront Control Biol. Syst. II 9717, 97170K (2016). [Google Scholar]
- 16.Yan W., Yang Y., Tan Y., Chen X., Li Y., Qu J., Ye T., “Coherent optical adaptive technique improves the spatial resolution of STED microscopy in thick samples,” Photon. Res. 5(3), 176–181 (2017). 10.1364/PRJ.5.000176 [DOI] [PMC free article] [PubMed] [Google Scholar]
- 17.Yu W., Ji Z., Dong D., Yang X., Xiao Y., Gong Q., Xi P., Shi K., “Super-resolution deep imaging with hollow Bessel beam STED microscopy,” Laser Photonics Rev. 10(1), 147–152 (2016). 10.1002/lpor.201500151 [DOI] [Google Scholar]
- 18.Deng S., Liu L., Cheng Y., Li R., Xu Z., “Investigation of the influence of the aberration induced by a plane interface on STED microscopy,” Opt. Express 17(3), 1714–1725 (2009). 10.1364/OE.17.001714 [DOI] [PubMed] [Google Scholar]
- 19.Urban N. T., Willig K. I., Hell S. W., Nägerl U. V., “STED nanoscopy of actin dynamics in synapses deep inside living brain slices,” Biophys. J. 101(5), 1277–1284 (2011). 10.1016/j.bpj.2011.07.027 [DOI] [PMC free article] [PubMed] [Google Scholar]
- 20.Takasaki K. T., Ding J. B., Sabatini B. L., “Live-cell superresolution imaging by pulsed STED two-photon excitation microscopy,” Biophys. J. 104(4), 770–777 (2013). 10.1016/j.bpj.2012.12.053 [DOI] [PMC free article] [PubMed] [Google Scholar]
- 21.Bethge P., Chéreau R., Avignone E., Marsicano G., Nägerl U. V., “Two-photon excitation STED microscopy in two colors in acute brain slices,” Biophys. J. 104(4), 778–785 (2013). 10.1016/j.bpj.2012.12.054 [DOI] [PMC free article] [PubMed] [Google Scholar]
- 22.Gould T. J., Burke D., Bewersdorf J., Booth M. J., “Adaptive optics enables 3D STED microscopy in aberrating specimens,” Opt. Express 20(19), 20998–21009 (2012). 10.1364/OE.20.020998 [DOI] [PMC free article] [PubMed] [Google Scholar]
- 23.Lenz M. O., Sinclair H. G., Savell A., Clegg J. H., Brown A. C. N., Davis D. M., Dunsby C., Neil M. A. A., French P. M. W., “3-D stimulated emission depletion microscopy with programmable aberration correction,” J. Biophotonics 7(1-2), 29–36 (2014). 10.1002/jbio.201300041 [DOI] [PubMed] [Google Scholar]
- 24.Patton B. R., Burke D., Owald D., Gould T. J., Bewersdorf J., Booth M. J., “Three-dimensional STED microscopy of aberrating tissue using dual adaptive optics,” Opt. Express 24(8), 8862–8876 (2016). 10.1364/OE.24.008862 [DOI] [PubMed] [Google Scholar]
- 25.Heine J., Wurm C. A., Keller-Findeisen J., Schönle A., Harke B., Reuss M., Winter F. R., Donnert G., “Three dimensional live-cell STED microscopy at increased depth using a water immersion objective,” Rev. Sci. Instrum. 89(5), 053701 (2018). 10.1063/1.5020249 [DOI] [PubMed] [Google Scholar]
- 26.Galiani S., Harke B., Vicidomini G., Lignani G., Benfenati F., Diaspro A., Bianchini P., “Strategies to maximize the performance of a STED microscope,” Opt. Express 20(7), 7362–7374 (2012). 10.1364/OE.20.007362 [DOI] [PubMed] [Google Scholar]
- 27.Dyba M., Hell S. W., “Photostability of a fluorescent marker under pulsed excited-state depletion through stimulated emission,” Appl. Opt. 42(25), 5123–5129 (2003). 10.1364/AO.42.005123 [DOI] [PubMed] [Google Scholar]
- 28.Wu Y., Wu X., Lu R., Zhang J., Toro L., Stefani E., “Resonant Scanning with Large Field of View Reduces Photobleaching and Enhances Fluorescence Yield in STED Microscopy,” Sci. Rep. 5, 14766 (2015). 10.1038/srep14766 [DOI] [PMC free article] [PubMed] [Google Scholar]
- 29.Wu X., Toro L., Stefani E., Wu Y., “Ultrafast photon counting applied to resonant scanning STED microscopy,” J. Microsc. 257(1), 31–38 (2015). 10.1111/jmi.12183 [DOI] [PMC free article] [PubMed] [Google Scholar]
- 30.Li C., Liu S., Wang W., Liu W., Kuang C., Liu X., “Recent research on stimulated emission depletion microscopy for reducing photobleaching,” J. Microsc. 271(1), 4–16 (2018). 10.1111/jmi.12698 [DOI] [PubMed] [Google Scholar]
- 31.Patton B. R., Burke D., Vrees R., Booth M. J., “Is phase-mask alignment aberrating your STED microscope?” Methods Appl. Fluoresc. 3(2), 024002 (2015). 10.1088/2050-6120/3/2/024002 [DOI] [PubMed] [Google Scholar]
- 32.Antonello J., Burke D., Booth M. J., “Aberrations in stimulated emission depletion (STED) microscopy,” Opt. Commun. 404, 203–209 (2017). 10.1016/j.optcom.2017.06.037 [DOI] [PMC free article] [PubMed] [Google Scholar]
- 33.Deng S., Liu L., Cheng Y., Li R., Xu Z., “Effects of primary aberrations on the fluorescence depletion patterns of STED microscopy,” Opt. Express 18(2), 1657–1666 (2010). 10.1364/OE.18.001657 [DOI] [PubMed] [Google Scholar]
- 34.Chen X., Chen J., Dong S., Yang H., Xie S., “Effects of Seidel aberration and light polarization on the resolution of STED imaging,” Optik (Stuttg.) 130, 76–81 (2017). 10.1016/j.ijleo.2016.11.026 [DOI] [Google Scholar]
- 35.Booth M. J., Neil M. A. A., Juskaitis R., Wilson T., “Adaptive aberration correction in a confocal microscope,” Proc. Natl. Acad. Sci. U.S.A. 99(9), 5788–5792 (2002). 10.1073/pnas.082544799 [DOI] [PMC free article] [PubMed] [Google Scholar]
- 36.Booth M. J., “Adaptive Optics in Microscopy,” Opt. Digit. Image Process. Fundam. Appl. 295–322 (2011). 10.1002/9783527635245.ch14 [DOI]
- 37.Vellekoop I. M., “Feedback-based wavefront shaping,” Opt. Express 23(9), 12189–12206 (2015). 10.1364/OE.23.012189 [DOI] [PubMed] [Google Scholar]
- 38.Ji N., “Adaptive optical fluorescence microscopy,” Nat. Methods 14(4), 374–380 (2017). 10.1038/nmeth.4218 [DOI] [PubMed] [Google Scholar]
- 39.Booth M. J., “Adaptive optical microscopy: The ongoing quest for a perfect image,” Light Sci. Appl. 3(4), e165 (2014). 10.1038/lsa.2014.46 [DOI] [Google Scholar]
- 40.Gross H., Zügge H., Peschka M., Blechinger F., Handbook of Optical Systems Volume 3: Aberration Theory and Correction of Optical Systems (Wiley-VCH Verlag GmbH & Co. KGaA, 2006), Vol. 2. [Google Scholar]
- 41.Debarre D., Booth M. J., Wilson T., “Image based adaptive optics through optimisation of low spatial frequencies,” Opt. Express 15(13), 8176–8190 (2007). 10.1364/OE.15.008176 [DOI] [PubMed] [Google Scholar]
- 42.Linkert M., Rueden C. T., Allan C., Burel J. M., Moore W., Patterson A., Loranger B., Moore J., Neves C., Macdonald D., Tarkowska A., Sticco C., Hill E., Rossner M., Eliceiri K. W., Swedlow J. R., “Metadata matters: Access to image data in the real world,” J. Cell Biol. 189(5), 777–782 (2010). 10.1083/jcb.201004104 [DOI] [PMC free article] [PubMed] [Google Scholar]
- 43.Allan C., Burel J.-M., Moore J., Blackburn C., Linkert M., Loynton S., Macdonald D., Moore W. J., Neves C., Patterson A., Porter M., Tarkowska A., Loranger B., Avondo J., Lagerstedt I., Lianas L., Leo S., Hands K., Hay R. T., Patwardhan A., Best C., Kleywegt G. J., Zanetti G., Swedlow J. R., “OMERO: flexible, model-driven data management for experimental biology,” Nat. Methods 9(3), 245–253 (2012). 10.1038/nmeth.1896 [DOI] [PMC free article] [PubMed] [Google Scholar]
- 44.Szegedy C., Liu W., Jia Y., Sermanet P., Reed S., Anguelov D., Erhan D., Vanhoucke V., Rabinovich A., “Going deeper with convolutions,” in 2015 IEEE Conference on Computer Vision and Pattern Recognition (CVPR) (IEEE, 2015), 39, pp. 1–9. [Google Scholar]
- 45.Shihavuddin A., Basu S., Rexhepaj E., Delestro F., Menezes N., Sigoillot S. M., Del Nery E., Selimi F., Spassky N., Genovesio A., “Smooth 2D manifold extraction from 3D image stack,” Nat. Commun. 8, 15554 (2017). 10.1038/ncomms15554 [DOI] [PMC free article] [PubMed] [Google Scholar]
- 46.Basu S., Rexhepaj E., Spassky N., Genovesio A., Reinhold R., Curie I., “FastSME : faster and smoother manifold extraction from 3D stack,” in Proceedings of the IEEE Conference on Computer Vision and Pattern Recognition Workshops (2018). 10.1109/CVPRW.2018.00305 [DOI] [Google Scholar]
- 47.Gonzalez R. C., Woods R. E., Digital Image Processing (3rd Edition) (Prentice-Hall, Inc., 2006). [Google Scholar]


