Abstract
Current measures for assessing the viability of donor kidneys are lacking. Optical coherence tomography (OCT) can image subsurface tissue morphology to supplement current measures and potentially improve prediction of post-transplant function. OCT imaging was performed on donor kidneys before and immediately after implantation during 169 human kidney transplant surgeries. A system for automated image analysis was developed to measure structural parameters of the kidney’s proximal convoluted tubules (PCTs) visualized in the OCT images. The association of these structural parameters with post-transplant function was investigated. This study included kidneys from live and deceased donors. 88 deceased donor kidneys in this study were stored by static cold storage (SCS) and an additional 15 were preserved by hypothermic machine perfusion (HMP). A subset of both SCS and HMP deceased donor kidneys were classified as expanded criteria donor (ECD) kidneys, with elevated risk of poor post-transplant function. Post-transplant function was characterized as either immediate graft function (IGF) or delayed graft function (DGF). In ECD kidneys stored by SCS, increased PCT lumen diameter was found to predict DGF both prior to implantation and following reperfusion. In SCD kidneys preserved by HMP, reduced distance between adjacent lumen following reperfusion was found to predict DGF. Results suggest that OCT measurements may be useful for predicting post-transplant function in ECD kidneys and kidneys stored by HMP. OCT analysis of donor kidneys may aid in allocation of kidneys to expand the donor pool as well as help predict post-transplant function in transplanted kidneys to inform post-operative care.
1. Introduction
The number of people on the waiting list for a kidney transplant grows each year and efforts to expand the donor pool to meet this demand have fallen short [1]. Kidney offers have expanded to include higher risk donors with various comorbidities, suboptimal procurement, and longer cold ischemia times. The inclusion of these higher risk, expanded criteria donors (ECD) in the donor pool has been successful in increasing the number of transplants performed annually but transplant centers still ultimately discard a large portion of ECD kidneys procured and offered for transplant [2–4]. The discard rate for ECD kidneys is nearly 45% compared to just over 10% for standard criteria donor (SCD) kidneys [5].
These discards represent a largely untapped source of potentially viable kidneys which, if properly utilized, could further widen the donor pool and narrow the gap between kidney supply and kidney demand. Studies have demonstrated that patients who receive moderately compromised kidneys live longer and have a higher quality of life than those who remain on dialysis and wait for a more viable option [6,7]. Currently there are approximately 17,000 kidney transplants a year in the United States. It is estimated that this number could be as high as 38,000 if more marginally compromised kidneys were considered and the donor pool properly utilized [8].
Surgeons reference a multitude of factors which contribute to their decision to reject a kidney. Principal among these are the results of biopsies, which are performed routinely on ECD kidneys, and are credited as the most frequent reason for discard. The true relevance of these factors is contested, with the majority appearing to have little correlation with graft function following transplant [9]. There is a critical need to enhance prognostic measures and to explore new ways of gaining insights into the viability of these more at-risk kidneys.
Optical Coherence Tomography (OCT) provides a non-invasive method for obtaining optical cross-sections of the superficial kidney cortex [10,11]. OCT is an interferometry based imaging modality, similar in principle to ultrasound, which uses the light scattering characteristics of tissue to construct high-resolution subsurface images. Cross-sectional 2-dimensional OCT images (B-scans) are composed of a series of sequential 1-dimensional A-scans, reflectivity vs. depth profiles, which represent subsurface features in the sample [12–14]. These images reveal the microanatomy of the proximal convoluted tubules (PCTs), which comprise the majority of the superficial kidney cortex. Swelling of the epithelium of the PCTs is evident in OCT images and may be considered a symptom of ischemic insult [15,16]. Conversely, dilation of the tubular lumen is similarly evident in OCT and may be considered a symptom of pre-existing pathology or acute tubular injury (ATI) [17–19]. Quantification of the degree of swelling or prevalence of dilation may provide a valuable addition to current measures of kidney viability. This would contribute to more informed decision making and optimal usage of the kidney donor pool.
OCT also has potential utility following transplant, where a more accurate prediction of post-transplant function could influence post-operative care. Delayed Graft Function (DGF) is an established risk factor for survival of a transplanted kidney [20]. If DGF can be predicted immediately following transplant, early post-operative biopsies to investigate poor function can be avoided. Early diagnosis of DGF can similarly inform the development of immunosuppressive treatments, where evidence of potential DGF would provide incentive for a less nephrotoxic, Calcineurin-sparing regiment [21]. An accurate prediction of DGF would also promote the usage of any of a number of anti-DGF medications currently in development, should they be approved.
For OCT to be used effectively in a clinical setting, image analysis must be conducted quickly, reliably, and without bias. Automated segmentation achieves these goals and can provide rapid and accurate assessments of ischemic damage to the kidney [22,23]. In this paper, we present a fully automated system which can identify and segment the microanatomy of the human kidney in OCT images with accuracy comparable to manual segmentation. We demonstrate the correlation between quantitative measurements derived from this segmentation and graft function following transplant.
2. Methods
2.1 Patient demographics
This study was approved by the Georgetown University and the University of Maryland Institutional Review Boards (Study number: IRB#2010-396). Written informed consent was obtained prior to enrollment. Patients eligible for this study included any kidney transplant recipient 18 years or older at the MedStar Georgetown Transplant Hospital.
Patient demographics were obtained at the time of consent. The patient pool was composed of approximately 60% male and 40% female recipients. Mean age at transplant was 52 with a standard deviation of ( ± ) 12.5 years. Mean BMI of recipients was 28.4 ± 4.7. 61% of patients in this study were African American, 24% were Caucasian, 8% were Hispanic, and 7% were Asian.
2.2 Transplant group categorizations
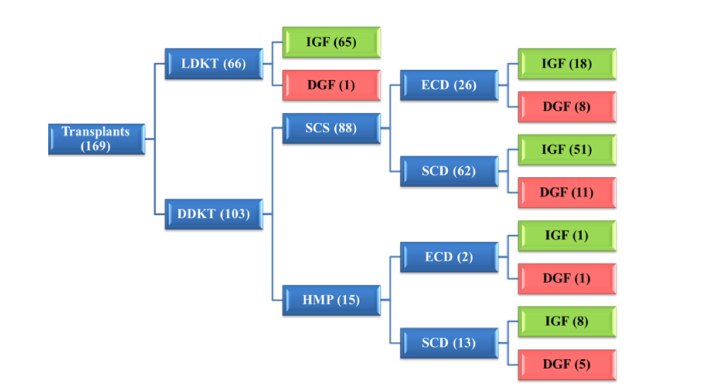
Of the 169 kidneys imaged and included in this study, 66 were from living-donor kidney transplants (LDKTs) and 103 were from deceased-donor kidney transplants (DDKTs). All LDKTs were preserved by static cold storage (SCS). Of the 103 DDKTs, 88 were preserved by SCS and 15 were preserved by hypothermic machine perfusion (HMP). 4 of the kidneys in the SCS group were part of a multi-organ transplant (kidney/pancreas). Of the 88 SCS kidneys, 26 had a KDPI (Kidney Donor Profile Index: score from 0 to 100 based on 10 donor factors, estimating the risk of graft failure) of 85 or more and were subcategorized as expanded criteria donor (ECD) kidneys. The remaining 62 SCS kidneys were subcategorized as standard criteria donor (SCD) kidneys [3]. Of the 15 kidneys in the HMP group, 2 kidneys qualified as ECD, and the remaining 13 were subcategorized as SCD kidneys (Fig. 1). Patients whose data were excluded from the analysis included those involved in parallel studies for anti-DGF clinical trials (1 patient) and those where image quality of the OCT image sets was compromised (2 patients).
Fig. 1.
Hierarchy classification of transplant groups with all transplants (blue tier 1) divided into live and deceased donor kidney transplants (blue tier 2). DDKTs are further divided into subgroups based on storage method (blue tier 3). DDKTs stored by SCS and HMP are further divided into subgroups based on risk of graft failure (blue tier 4). Each end-tier transplant group is divided into recovery groups based on requirement of dialysis (green and red).
2.3 Recovery group categorizations
Graft function following transplant was categorized as either immediate or delayed. Delayed graft function was designated when a transplant recipient was required to undergo dialysis within the first seven days following transplant [24] or when otherwise specified as DGF in clinical notes. All cases where transplant recipients did not require dialysis prior to discharge were considered immediate graft function (IGF). Recovery groupings for each transplant group were as follows: LDKT (65 IGF, 1 DGF), SCS SCD (51 IGF, 11 DGF), SCS ECD (18 IGF, 8 DGF), HMP SCD (8 IGF, 5 DGF), and HMP ECD (1 IGF, 1 DGF) (Fig. 1).
2.4 Imaging protocol
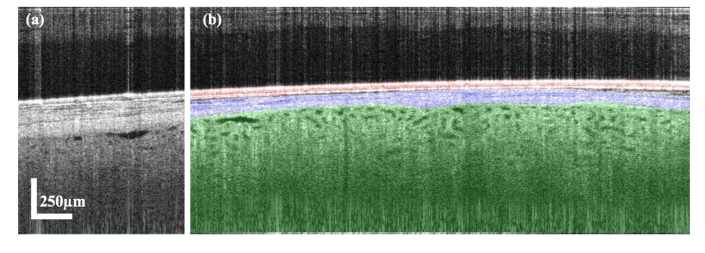
Imaging in this study was performed with a 1325 nm center wavelength spectral-domain OCT imaging system (Telesto-II, Thorlabs Inc.), with an incident power of 2.5 mW. The Telesto OCT system was equipped with a 36 mm focal length (LSM03, Thorlabs Inc.) objective, providing a lateral resolution of 13 µm and an axial resolution of 5.5 µm in air. Scans were captured at a rate of 28 kHz, with a sensitivity of 103 dB. A-scans were averaged by 2 and no B-scan averaging was applied. B-scan settings were optimized to minimize file storage size while providing a sufficient field of view (FOV) and resolution for analysis. Parameters included a FOV of 4.9 mm in x-axis and 1.9 mm in z-axis (after adjusting for a refractive index of 1.3) at a scale of approximately 2.73 µm/pixel in each dimension (Fig. 2).
Fig. 2.
Representative B-scan captured in the operating room of a donor kidney (pre-implantation) (a) The original greyscale B-scan. (b) The Tegaderm film highlighted in red, the renal capsule highlighted in blue and the kidney cortex highlighted in green.
A technician in sterile surgical attire operated a handheld scanner, draped in a sterile sleeve with a layer of sterile Tegaderm transparent film dressing affixed to the focal spacer. Image sets were obtained ex-vivo immediately prior to implantation and again in-vivo immediately (13 ± 4 minutes) following reperfusion of the transplanted kidney.
Three-dimensional volumetric scans proved to be impractical in the operating room (OR) setting due to difficulty in stabilizing the kidney and a limited capture rate. Similarly, variation in thickness of the renal capsule (Fig. 3(a), 3(b)) and variation in the amount of adipose tissue present on the kidney surface (Fig. 3(c), 3(d)) made a global imaging protocol surveying different positions on the kidney surface infeasible; thicker portions of the capsule and areas of high adipose impeded OCT penetration into the cortex.
Fig. 3.
Cropped portions of B-scans of donor kidneys with a thin renal capsule (a), thick renal capsule (b), small degree of adipose present above the renal capsule (c) and higher degree of adipose present (d). Yellow arrows indicate the thickness of the renal capsule (a, b) and adipose tissue (c, d).
Manual raters were asked to measure capsule and adipose thickness at a randomized location on the X-axis in a randomized set of 1,000 B-scans. The renal capsule ranged in thickness from 44 µm to just over 1 mm with an average thickness of 189.5 ± 108.7 µm. Kidneys often had little or no adipose present on their surface but in some instances had adipose that exceeded the penetration depth of the OCT system. Average adipose thickness across all 1,000 B-scans was 67.2 ± 90.6 µm.
Technicians in the operating room were therefore directed to survey the kidney under a live two-dimensional video feed, and image regions of the kidney where adipose was minimal and the renal capsule appeared thin. Within these regions, technicians were instructed to search for an area where the highest volume of visible PCT lumen was apparent.
2.5 Manual segmentation
Images were manually segmented to provide a standard to evaluate performance of the automatic segmentation and also to produce thresholds for inclusion/exclusion of automatically segmented PCT lumen. Manual categorization and segmentation of images was performed in ImageJ (NIH) by 4 trained raters. Pre-implantation and post-reperfusion image sets from the first 150 patients were anonymized, randomly divided into 4 groups, and split between the 4 trained raters. Following manual analysis, 20 percent of the manually segmented images were reassigned to different raters to produce measures of inter-rater variation (Fig. 4).
Fig. 4.
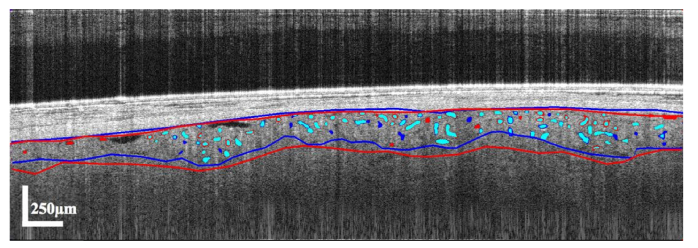
Representative B-scan independently segmented by 2 manual raters. Selections by the first rater are indicated in red while selections by the second rater are indicated in blue. Cyan indicates an overlap in selection by both raters.
Manual segmentation was performed on 5 randomly selected images from each image set. Raters segmented the interface between the renal capsule and the cortex (upper red and blue lines in Fig. 4). Raters also segmented the full volume of quantifiable cortex (the area of cortex beneath the capsule where the signal appeared sufficient to discriminate anatomical features) (area between upper and lower red and blue lines in Fig. 4). Raters then segmented all regions which appeared to be cross-sections of PCT lumen, using the ImageJ “Versatile Wand” plugin [25] (red and blue selections in Fig. 4 with cyan indicating overlap). If a randomly selected image contained no quantifiable cortex, the image was skipped and the reason for exclusion was tallied as either “empty” with no contact between the probe and kidney (section 2.6.1), “high reflection” (section 2.6.2), or “high adipose” (section 2.6.3).
2.6 Automatic segmentation
Automatic segmentation was executed in MATLAB R2017b (Mathworks, Inc., Natick, MA, USA). To remove user bias and to improve feasibility of clinical application, automatic segmentation and analysis was performed on the original full 2D video image sets and not manually selected subsets of images. To expedite analysis and prevent error, it was necessary to remove images from processing which contained no quantifiable cortex. Features were extracted and compiled from images skipped and marked during manual analysis. These features were utilized to identify empty, high reflection, or high adipose images prior to performing more computationally expensive sections of the algorithm.
2.6.1 Empty B-scan detection
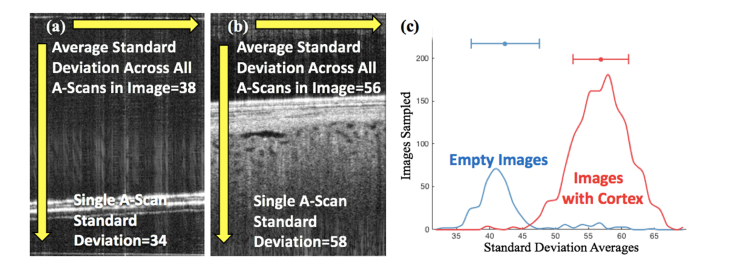
While a threshold of total intensity values would be an intuitive and high-speed approach to detection of empty B-scans, variations between empty images in background intensity, imaging artifacts and hyper-reflectivity of Tegaderm disallowed this strategy. Empty images were therefore identified by their average standard deviation in intensity values across the z-axis.
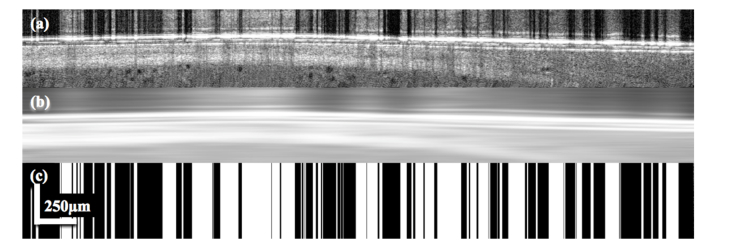
For each B-scan, the standard deviation of intensity values across each A-scan was taken and all A-scan standard deviations for that B-scan averaged. This process was repeated for all images marked during manual analysis as “empty” (Fig. 5(a)), and for all images which had cortex present and were manually segmented (Fig. 5(b)). Comparison between these two groups demonstrated that a mean A-scan standard deviation of 47 or less correlated highly with images categorized as “empty” while a mean A-scan standard deviation above 47 correlated well with images which contained kidney (Fig. 5(c)). A standard deviation cutoff of 47 identified empty images with a sensitivity of 83.28% and a specificity of 98.91%.
Fig. 5.
(a) Section of a B-scan with no kidney. The white horizontal lines in the bottom third of the image result from the Tegaderm. The vertical arrow represents the location of a single A-scan with a corresponding standard deviation in intensity values of 34.3. The average of all A-scans across the image is 37.8. (b) Section of a B-scan with kidney. The vertical arrow represents the location of a single A-scan with a corresponding standard deviation in intensity values of 56.1. The average of all A-scans across the image is 58.4. (c) Histogram representing the average standard deviation of all images manually marked as empty (blue) and all images which contained quantifiable cortex and were manually segmented (red).
2.6.2 Reflection detection
Bright vertical stripes due to strong reflection were a frequent imaging artifact which interfered with several segmentation steps and in some instances rendered images impossible to analyze (Fig. 6(a)). To isolate and quantify these stripes of reflection, a horizontal filter was applied to each image to provide an estimate of the image without the reflection (Fig. 6(b)). Reflection stripes were then defined as A-scans from the original image whose average intensity exceeded a global threshold above the corresponding A-scans from the filtered image (Fig. 6(c)). Images where reflection stripes exceeded 30% of the total number of A-scans were excluded from analysis. A similar strategy was employed to isolate stripes of shadowing to aid in capsule segmentation and PCT lumen selection (section 2.6.4, section 2.6.8).
Fig. 6.
(a) Original section of B-scan with high reflection. (b) Section of the same high reflection B-scan following application of a horizontal blurring filter. (c) Binary mask with all white portions representing all A-scans in 6a whose mean intensity value exceeded 15 above the mean intensity value of the corresponding A-scan in 6b. (49% of A-scans in this example qualify as reflection stripes)
2.6.3 High adipose detection
The amount of adipose tissue on the surface of the kidney was widely variable between kidneys and between regions within the same kidney. Images which contained enough adipose tissue to interfere with segmentation were infrequent in most scan sets but when present often contained features which were falsely identified as PCT lumen (Fig. 7). Since the intent was to analyze regions of the highest area of PCT lumen, in image sets where the overall area of PCT lumen was low, falsely segmented adipose was prioritized and significantly affected results.
Fig. 7.
(a-b) Sections of B-scans with kidney cortex and PCT lumen. (c-d). Sections of B-scans with high degrees of adipose and circular features which may be mistaken for PCT lumen.
In the majority of images where adipose interfered with segmentation, the segmentation of the renal capsule was interrupted, triggering an error and exclusion. In a small but significant number of images, the segmentation process finished uninterrupted but falsely identified adipose as cortex. To detect these instances, a complex decision tree was generated with MATLAB’s “Classification Learner App”. Two image sets were compiled containing falsely segmented high-adipose images and correctly segmented images respectively. Features were extracted from the images in each set. Features included variations in intensity values in what was interpreted as cortex as well as the dimensions, orientation, eccentricity and size of what was interpreted as PCT lumen. Training was performed with 10-fold cross validation and yielded a sensitivity of 97.5% and a specificity of 98.6%.
2.6.4 Segmentation of the renal capsule-kidney cortex interface
Segmentation of the interface between the renal capsule and cortex is a necessary step preceding segmentation of the kidney cortex and PCT lumen. Defining this interface prevents anything above it (capsule, adipose, background) from being falsely identified as cortex or PCT lumen. In OCT scans, the renal capsule had consistently higher intensity than the cortex beneath it. The shift in intensity provided a border which edge detection was able to identify.
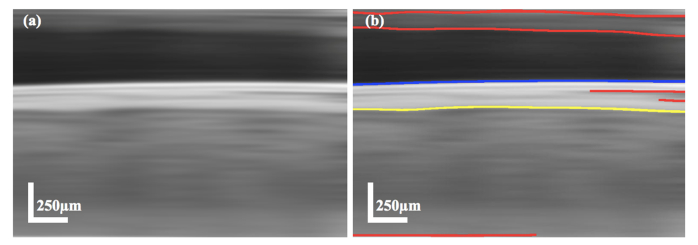
The kidney was most often flush to the OCT probe during imaging and so in most B-scans spanned the full x-axis. The capsule-cortex interface was therefore identified by targeting strong edges which spanned the majority of the x-axis. Breaks in edge continuity by stripes of reflection and shadowing were filled in with values from adjacent A-scans. Images similarly underwent a horizontally weighted Gaussian blur (kernel = 2.73x45.78 µm) to unify the length of the interface (Fig. 8(a)). A relatively weak Canny edge detection (threshold = 0.22:0.66, σ = 1.83) was used to detect and remove the Tegaderm edge and all edges above it from selection (blue line in Fig. 8(b)). More sensitive Canny edge detection (threshold = 0.13:0.28, σ = 10.99) was used to identify edges which would correspond with the capsule-cortex interface (red and yellow lines in Fig. 8(b)). From the identified edges, the lowermost detected edge which spanned at least half of the x-axis and contained higher intensity values above the edge than below (i.e. high intensity capsule above lower intensity cortex) was selected as the capsule-cortex interface (yellow line in Fig. 8(b)).
Fig. 8.
(a) Section of B-scan following reflection and shadow stripe filling, and Gaussian blurring. (b) Blurred B-scan section with overlay of output from weak Canny edge detection (blue) and higher sensitivity Canny edge detection (red and yellow lines). The yellow line indicates the selected capsule-cortex interface from the higher sensitivity edge detection output.
2.6.5 Segmentation of quantifiable kidney cortex
Segmentation of the area of quantifiable kidney cortex was a necessary step for assessing the degree of swelling of the PCTs (section 2.7). Variations in capsule thickness, adipose, and OCT performance led to widely variable penetration into the kidney cortex both between kidneys and between different regions in the same kidney. To accurately segment the quantifiable cortex, it was necessary to identify features which could help discriminate between noise and strong-signal regions of cortex.
The z-axis depth of 1.9 mm should at no point penetrate past the renal cortex, which has an average thickness of just less than ~14 mm [26]. The cortex is densely populated with PCTs. If swelling is minimal, the lumen of the PCTs should be visible throughout a cross-section of the cortex with their visibility restricted only by the limitations of the OCT system’s penetration. In images where PCT lumen were readily visible, the volume of quantifiable cortex could be inferred as the area immediately surrounding lumen with distinct edges, with anything beneath that point defined as background/noise beyond the penetration of the OCT system (Fig. 9(a)). However, in images where PCT were fully swollen and their lumen fully occluded by their swollen epithelium, there were often no visible anatomical landmarks to help distinguish strong-signal cortex from noise (Fig. 9(b)). Quantifiable cortex in these images was challenging even for trained raters to identify.
Fig. 9.
(a) Section of a B-scan with visible PCT lumen. (b) Section of a B-scan with no visible PCT lumen and no anatomical landmarks. (c) Section of a B-scan with rapidly diminishing intensity values as the FOV moves past the OCT system’s penetration into the cortex. (d) Section of a B-scan with little reduction in intensity values as the FOV moves past the OCT system’s penetration into the cortex.
Intensity alone was likewise not a consistent marker of quantifiable cortex as the average intensity of the cortex varied widely between scans (Fig. 9(c), 9(d)). Similarly, the intensity gradient marking the transition between signal and noise was widely variable between scans. Some scans had a rapidly diminishing intensity as the penetration increased beyond where signal was present (Fig. 9(c)), while in other scans intensity was roughly homogenous between the signal and noise (Fig. 9(d)). Automating segmentation to accurately identify quantifiable cortex in images with and without visible PCT lumen required a weighted combination of PCT lumen edge strength, texture estimates, and intensity values.
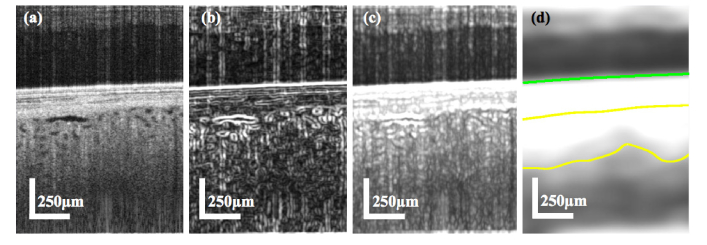
Maps of lumen edge strength were generated by a local standard deviation filter passed over the original B-scan with a contrast adjusted output (kernel = 15x25 µm) (Fig. 10(b)). Texture was estimated with a second vertically weighted standard deviation filter (kernel = 45x2.73 µm), which more clearly highlighted transition from signal to noise in regions where no or little lumens were present (Fig. 10(c)). Intensity values were drawn from the original B-scan and were weighted by variables reflecting the contrast between the capsule and superficial cortex, the contrast between cortex and lumen, and the intensity gradient beneath the capsule-cortex interface. In each instance, higher contrast or degree of gradient increased the weighting of the B-scan intensity values. Weighted intensity values were combined with the map of lumen edge strength and texture to yield a greyscale image (Fig. 10(d)) from which quantifiable cortex could be inferred by thresholding (area between yellow lines in Fig. 10(d)).
Fig. 10.
(a) Original section of a B-scan. (b) Map of lumen edge strength with brighter regions corresponding to stronger lumen edges. (c) Texture estimate generated by a vertically weighted standard deviation filter and contrast adjustment. (d) Greyscale output of the weighted combination of Fig. 10(a)-(c). The area between the green line and bottom yellow line represents the output of the thresholding of the image. The area between the top yellow line (derived from the capsule-cortex interface segmentation step (section 2.6.4) and the bottom yellow line represents the final segmented area of quantifiable cortex.
2.6.7 Segmentation of PCT lumen (region of interest map for automatic selection)
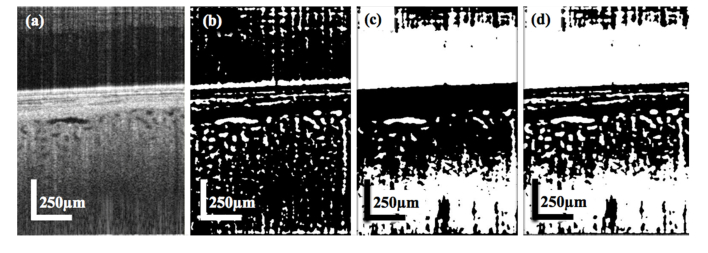
Prior to PCT lumen selection, a map of all potential PCT lumen was generated with a combination of local adaptive thresholding and global thresholding around an empirically determined level. The local adaptive thresholding binarized the original B-Scan tile by tile within an approximately 70x70 µm window, with a threshold defined by the values within each tile (Fig. 11(b)). The global thresholding was performed on a contrast-enhanced version of the original image where contrast was enhanced with MATLAB’s histeq function in a similar tiled fashion based on the range of values in each tile (Fig. 11(c)).
Fig. 11.
(a) Section from B-scan (same section as used in Fig. 10(a)) following adaptive histogram equalization. (b) Binary output of adaptive thresholding performed on original B-scan (Fig. 10(a)). (c) Binary output of global thresholding performed on the contrast-enhanced image (Fig. 11(a)). (d) ROI map generated after combining Fig. 11(b) and 11(c).
The adaptive thresholding was especially proficient in locating potential regions of interest (ROIs) throughout the image but was indiscriminate in identifying ROIs and routinely located them throughout regions of noise. The set-limit thresholding was less comprehensive in its identification of ROIs but was better able to discriminate between signal and noise (i.e. identified high-noise regions as a single large ROI). The logical sum of the two thresholded images produced a comprehensive binary mapping of ROIs with a signal to noise weighting component (Fig. 11(d)). ROIs outside of the segmented quantifiable cortex were removed from the ROI map.
2.6.8 Selection of PCT lumen (ROI threshold generation from manual PCT selections)
Selection of PCT lumen was the most subjective of the manual segmentation processes and varied considerably between raters. Manual raters were instructed to segment regions within the quantifiable cortex which they could, with confidence, identify as cross-sections of PCT lumen. Criteria for selection included size consistent with PCT lumen, and well-defined lumen edges such that the selection could be reliably distinguished from imaging artifacts or noise. Raters were instructed not to segment ROIs which could be confidently distinguished from PCTs as glomeruli (characterized by their ~200 µm diameter and capillary tuft), blood vessels (characterized by large diameter lumen and length relative to PCT lumens), or cysts (characterized by their >200 µm diameter, and irregular shape). Features from manual selections were summed and employed to define thresholds for inclusion/exclusion of automatic selections.
A set of features including edge-strength, diameter, and depth beneath the capsule-cortex interface were extracted from automatic ROI selections which coincided with PCT lumen selections made during manual analysis. These features were similarly extracted from automatic ROI selections which manual raters did not select as PCT lumen. These groups of features were assigned a “hit” or “miss” label respectively and were used to train a fit binary classification tree using the MATLAB fitctree function. The classification tree was employed following generation of the ROI map, wherein ROIs whose features yielded a “hit” were included in analysis and ROIs whose features yielded a “miss” were excluded.
Additional criteria were set for exclusion of false ROIs and imaging artifacts. Vertical stripes of shadowing and areas between adjacent stripes of reflection were routinely falsely identified as PCT lumen (Fig. 12(a)). The shadow and reflection masks generated during capsule segmentation were utilized here to remove these ROIs from selection at points where these masks overlapped with selected ROIs (Fig. 12(b)). Similarly, separation between the renal capsule and cortex, while infrequent, created ROIs which were frequently identified as PCT lumen (Fig. 12(c)). These ROIs were identified by their proximity to the capsule-cortex interface and their horizontally elongated appearance, and were excluded from analysis (Fig. 12(d)).
Fig. 12.
(a) Section of a B-scan with adjacent stripes of reflection (surrounding left arrow) and shadowing (right arrow) which produce false ROIs. (b) B-scan section from 12a with yellow representing the corresponding ROI map generated for this image. The vertical red stripes represent detected stripes of reflection while the vertical blue stripe represents detected stripes of shadowing. (c) Section of a B-scan with separation between capsule and cortex. The arrow indicates pockets at the point of separation which produce false ROIs. (d) B-scan section from 12c with yellow representing the corresponding ROI map. The arrow indicates a region (red) where separation of the capsule and cortex produces false ROIs.
2.7 Quantification of PCT morphology
2.7.1 Density measurements
PCT swelling was rarely homogenous within a kidney. Swelling (as evidenced by a reduction in visible PCT lumen size) often varied within a kidney with some PCT lumen being fully occluded by swelling, while others had little reduction in lumen diameter. Since fully occluded PCT lumens were not visible in the OCT image sets, measurements of PCT morphology in these instances would be biased by only including less swollen PCT lumen. To supplement tubular measurements with a measure which accounts for the influence of fully occluded PCT lumen, a “density” measure was devised which calculates the total area of PCT lumen divided by the total area of quantifiable cortex. This method does not neglect the swelling of PCTs whose lumen is fully occluded, but instead provides an estimate of the ratio of the total area of PCT lumen to quantifiable cortex for each B-scan. A high diameter measurement may, for example, be taken together with a low density measurement suggesting a small population of dilated PCTs within a B-scan showing mostly occluded lumen. The density measurement also provides a number value for the criteria technicians were instructed to pursue (technicians were instructed to preferentially image regions with a higher total area of PCT lumen).
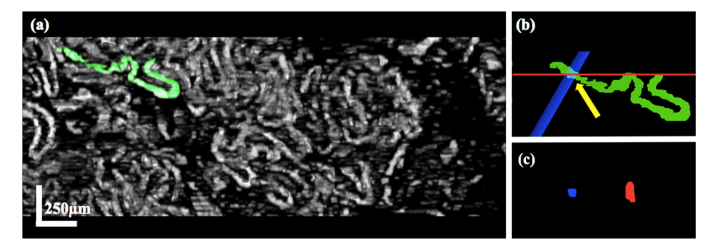
One limitation of the 2D imaging protocol is that B-scans intersect the PCTs randomly (horizontal red line in Fig. 13(b)) and do not necessarily create cross-sections orthogonal to the direction of the tubule (blue plane in Fig. 13(b)). This creates elongated and irregularly shaped cross-sections (red shape in Fig. 13(c)) which may misrepresent the cross-sectional area of PCT lumen (blue shape in Fig. 13(c)). This impacts the density measurement, with non-orthogonal cross-sections contributing a greater amount to the total lumen area than the corresponding true orthogonal cross-section (red and blue shapes respectively in Fig. 13c). To adjust for this bias, a set of features including circularity, extent, and eccentricity were compiled for every B-scan cross-section in the 3D scan performed on a preserved kidney (red line and red shape in Fig. 13(b) and 13(c) respectively). The true area of each cross-section was acquired by capturing a plane (blue plane in Fig. 13(b)) at the same location (yellow arrow in Fig. 13(b)) orthogonal to the orientation of that section (40 µm section length) of the tubule.
Fig. 13.
(a) En face view of automatically segmented PCT lumen in a reconstructed 3D scan. Each tubule was extracted for comparison of B-scan cross-section features to features of cross-sections taken orthogonal to the orientation of the PCT at the same locations. The tubule segment highlighted in green is represented in 13b. (b) The red line represents the location of the B-scan while the blue plane represents the plane orthogonal to the orientation of that section of the PCT lumen segment (orientation from position 20 µm earlier in the segment to 20 µm further). The arrow indicates the point on the tubule where the cross-sections in 13c are captured. This process was repeated at every point along the length of the tubule. (c) Resulting B-scan and orthogonal cross-sections from 13b are represented in red and blue respectively.
The B-scan cross-section features were fed as inputs into MATLAB’s “Regression Learner App” with the percent reduction in area from the B-scan cross-section to the true cross-section as the response. A linear regression model was trained with 10-fold cross-validation to predict the percent reduction in area required to transform an elongated or irregularly shaped cross-section into the area of the corresponding orthogonal cross-section. The model yielded a root-mean-square error (RMSE) of 0.15 and an R-Squared value of 0.69. The linear regression model was employed to correct the area of elongated and irregularly shaped cross-sections to the area of the corresponding true cross-sections. A notable limitation of this correction method, however, is that only one kidney was used for training of the model. In addition, this kidney was preserved in a formaldehyde solution and so may not accurately represent PCT morphology of a kidney used for transplant. Similarly, feature evaluation of the orthogonal cross-sections revealed that these sections were, on average, moderately elliptical (eccentricity of 0.67 ± 0.15); orthogonal cross-sections contained, on average, a minor axis to major axis length ratio of 3:4. Consequently, the linear regression model, depending on input features, may produce area estimations of non-circular orthogonal cross-sections. While orthogonal sectioning of tubules in kidneys preserved for transplant likely do not consistently produce perfectly circular lumen cross-sections due to anatomical heterogeneity and storage effects, it should be considered that the formaldehyde preservation of the kidney used in the linear regression model may have altered circularity of tubular lumen.
2.7.2 Diameter measurements
The diameter of lumen in PCT cross-sections was measured for all cross-sections in each B-scan. As the epithelium of the PCTs swells, the visible lumen should reduce. Conversely, as the epithelium is flattened or simplified, the visible lumen should increase. Diameter of the PCT lumen should therefore maintain an inverse relationship to the degree of swelling, and a direct relationship to the degree of epithelial flattening/simplification.
Diameter measurements are similarly impacted by the limitations of the 2D imaging protocol, with elongated non-orthogonal sections (red in Fig. 13(c)) potentially misrepresenting true lumen diameter. To circumvent this issue, diameter was defined as the “minor axis length” (shortest diameter which passes through the center of the ROI). This definition ensures that the elongated axis of tangential sections does not bias the diameter measurement. However, this may result in under-representation of the true diameter if the imaging plane does not cut through the tubular center axis. Consequently, an additional diameter measurement, derived from the corrected area, was used. This measure calculated diameter from the linear regression corrected area using the equation for calculating the area of a circle ().
To assess accuracy, a 50 µm capillary phantom was embedded in an agar solution which mimicked the scattering properties of kidney tissue. OCT scans were performed on the phantoms at three locations, and ROI maps were generated by the described method. Diameter of the interior of the capillary phantoms was calculated by the two methods described in this section and produced diameters of 45.7 ± 2.9 µm and 50.3 ± 3.1µm as measured by minor axis length and from corrected area respectively.
2.7.3 Inter-Lumen measurements
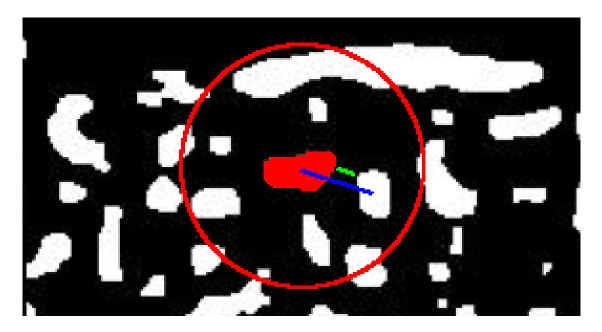
The minimum distance between edges of adjacent lumen was measured between all adjacent PCT lumen cross-sections in each B-scan (green in Fig. 14). Adjacency of ROIs was defined as when centroids were within 110 µm of each other (determined empirically as the maximum distance before tubule lumen outside of immediate adjacency were included) (red circle in Fig. 14). This inter-lumen distance was considered a measurement of the combined thickness of the epithelium of two adjacent PCTs and any interstitial space. As the epithelium swells, the inter-lumen distance should increase. Conversely, as the epithelium is flattened or simplified, the inter-lumen distance should reduce.
Fig. 14.
Depiction of methodology for inter-lumen and inter-centroid measurements. The red circle represents a 110 µm radius around the center ROI of “adjacent” ROIs. Distances between lumen edges and centroids are represented in green and blue respectively.
2.7.4 Inter-centroid measurements
The distance between centroids of adjacent PCT lumen was similarly measured between all adjacent PCT lumen cross-sections in each B-scan (blue in Fig. 14). This was considered a measurement of the combined lumen, epithelium, and interstitial space. The inter-centroid distance may be mostly unaffected by PCT swelling and epithelial flattening as changes to epithelial thickness and lumen diameter are inversely related and may balance. The inter-centroid distance may therefor reflect changes to the interstitial space.
2.7.5 B-scan selection and measurement compilation
Measurements were compiled for each B-scan in each image set. As the 2D imaging protocol produced numerous duplicate or redundant images, only one B-scan was selected from each image set for analysis. As imaging protocol was to survey regions with the greatest area of visible tubule lumen (i.e. highest PCT lumen density), B-scan results were sorted by density and the maximum density B-scan was selected for inclusion in results. Measurements from these selected B-scans were averaged to yield values for pre-implantation and post-reperfusion scans for each kidney. Results were averaged for each recovery group (IGF, DGF) in each transplant group (LDKT, SCS (SCD), SCS (ECD), HMP (SCD)) and represented in box and whisker plots.
In addition to analysis of correlation between measurements from selected B-scans and binary recovery group categories (IGF/DGF), the relationship between measurements and decline in patient’s serum creatinine levels (which should decline rapidly and to a level <3.0 mg/dL if a transplanted kidney is well functioning) following transplant was investigated [27]. Linear mixed effects models were fitted to regress the longitudinal measures of serum creatinine from day 0 to day 5 on each patient to account for the within-subject variation by assuming an AR(1) (first order auto-regressive structure with homogenous variances) covariance structure and allowing for random intercepts for between-subject variation. The baseline creatinine measure, time, and interactions between time and each measurement were also included in the models. Models were fitted following our initial hypotheses that flattened PCT epithelium and dilated lumen would represent pathology, and consequently higher inter-lumen distance measurements, lower diameter measurements, and lower density measurements (which we initially predicted would echo diameter measurement trends) would correlate with a faster recovery (steeper decline in creatinine). Higher inter-centroid distances were hypothesized to represent pathology (as indicative of interstitial inflammation), and consequently lower inter-centroid distances would correlate with a faster recovery (steeper decline in serum creatinine).
3. Results
3.1 Comparison of automatic and manual segmentation
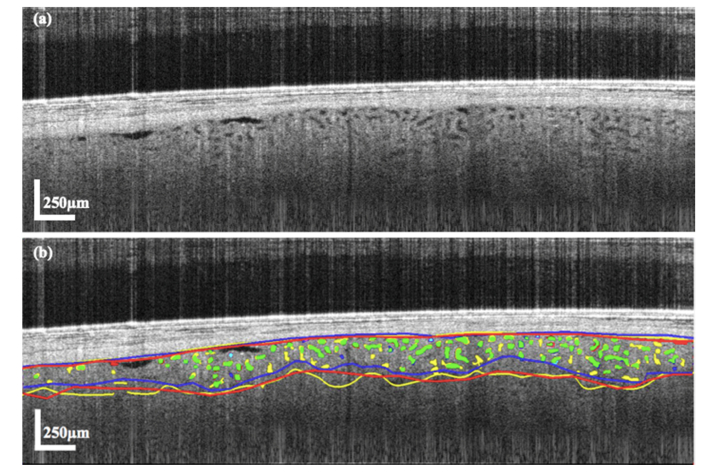
Automatic segmentation performed on images which were also manually segmented (~1,500 images) had a capsule-cortex interface with a mean absolute error (MAE) of 15.0 ± 10.7 µm (5.2 ± 3.7 pixels) as compared to the manual segmentations (top yellow, blue and red lines in Fig. 15(b) for automatic and the 2 manual raters respectively). Multiple raters performing manual segmentation on the same images deviated by an average of 11.5 ± 5.9 µm (4.0 ± 2.0 pixels).
Fig. 15.
(a) Original B-scan (same as used in Fig. 4) and (b) B-scan following segmentation automatically and by 2 manual raters. Segmentation of the capsule-cortex interface is represented by the top yellow, red and blue lines as segmented by the algorithm and 2 manual raters respectively. Segmentation of the quantifiable cortex boundary is represented by the bottom yellow, red and blue lines as segmented by the algorithm and 2 manual raters respectively. Automatic PCT lumen selections are represented in green if they overlap with either of the manual rater’s selections and yellow if they do not overlap with manual segmentation. Manual PCT lumen selections are represented in cyan if they overlap with 2nd rater’s selections and red or blue for each rater if there is no overlap.
Automatic segmentation performed on images which were also manually segmented produced a quantifiable cortex boundary (line across x-axis highlighting the point at which signal transitions into noise, represented by the bottom yellow, blue and red lines in Fig. 15(b) for automatic and the 2 manual raters respectively) with a MAE of 45.0 ± 11.23 µm (4.0 ± 2.0 pixels) as compared with manual segmentations.
Multiple raters performing manual segmentation on the same images deviated by an average of 59.0 ± 29.3 µm (20.8 ± 10.7 pixels). Sørensen-Dice similarity coefficient scores were calculated to demonstrate the degree of agreement (agreement between methods as to what area was segmented as quantifiable cortex and what area was excluded; a Dice score of 0 would indicate no agreement whereas a Dice score of 1 would indicate perfect agreement) between manual and automatic selections of cortex volume (area between the segmented capsule-cortex interface and the segmented quantifiable cortex boundary). Automatically segmented cortex volumes compared to manually segmented cortex produced a Dice score of 0.84 ± 0.05. Comparison between manual raters’ segmentations produced a Dice score of 0.81 ± 0.06.
For selection of PCT lumen from the ROI map, a simple decision tree, with sensitivity and specificity comparable to more complex models, was selected to ensure robustness of the classifier. The classification tree was able to accurately select PCT lumen from the ROI map with a sensitivity of 85.58% and a specificity of 89.04%.
To assess reproducibility among manual raters, raters were reassigned 25 B-scans, randomly selected from B-scans which they had previously segmented. MAE was calculated, for segmentation of the capsule-cortex interface, between each rater’s two segmentations for each B-scan, and ranged from 9 to 15 µm between raters (Fig. 16). Dice scores were similarly calculated between each rater’s two segmentations of quantifiable kidney cortex and ranged from 0.77 to 0.9, with most raters achieving >0.8. Cohen’s kappa coefficients were calculated between PCT lumen selections in both sets of segmented images and demonstrated fair to moderate agreement, with a range in scores between 0.38 and 0.6. Kappa coefficients improved dramatically to a range of scores between 0.55 to 0.72 when assessing only images with at least moderate (>5%) density.
Fig. 16.
Table representing reproducibility measurements for manual raters (left) reassigned 25 B-scans each from their original sets. MAE, Dice coefficients, and Cohen’s kappa coefficients are calculated for reproducibility in capsule-cortex interface, quantifiable cortex, and PCT lumen selections respectively. Kappa scores are also shown for only B-scans where density measurements were >5% (i.e. there was not a low population of tubule lumen). Comparison between manual raters’ initial segmentations of the 25 reassigned images and automatic segmentation performed on those same images is also shown (right).
3.2 Density by area results
3.2.1 Density by area results stratified by transplant group (IGF/DGF combined)
Distinctions between measurements from the ECD subgroup of DDKT kidneys stored by HMP and other transplant groups were not investigated due to limited sampling of ECD kidneys in the DDKT-HMP group (n = 2).
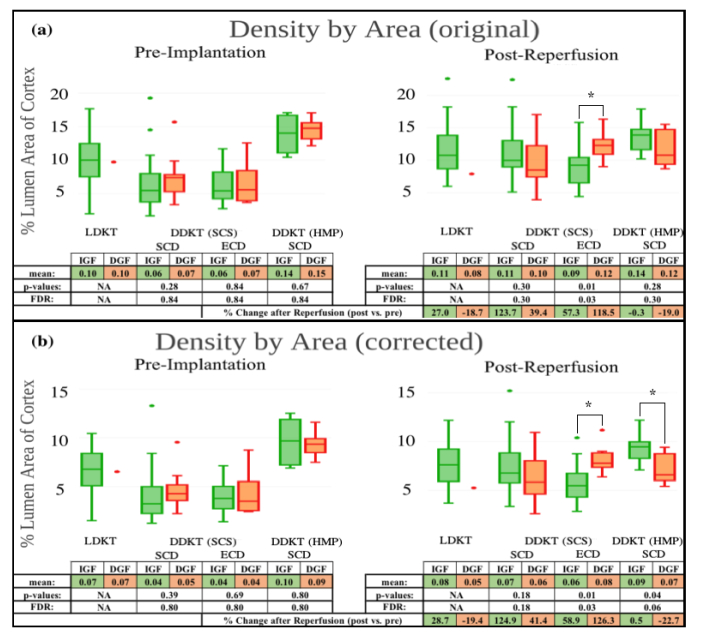
Prior to implantation (left in Fig. 17), kidneys from the LDKT transplant group demonstrated higher (p<0.001) PCT lumen density than DDKT kidneys stored by SCS. This difference may be considered a consequence of the markedly different transplant conditions, namely a considerably reduced ischemic time (mean of 1.47 ± 0.61 hours for LDKT versus 13.49 ± 7.06 hours for DDKT-SCS SCD and ECD subgroups). The SCD subgroup of DDKT kidneys stored by HMP had a higher (p<0.001) pre-implantation density than all other transplant groups. The high HMP density may be a result of artificial dilation of the PCT lumen by the machine-perfusion process. The LDKT group, and the DDKT-SCS SCD and ECD subgroups all experienced an increase in density between pre-implantation and post-reperfusion scans. This is consistent with prior studies demonstrating a dramatic reduction in swelling of ischemic PCTs (which would present as an increase to total lumen area) following reperfusion [13,15]. In contrast to all other groups, the HMP group experienced a reduction in density following reperfusion, suggesting either some dissipation of the artificial dilation or induction of swelling. Post-reperfusion density (right in Fig. 17) was similar between LDKT and the DDKT-SCS SCD and ECD subgroups. Post-reperfusion density in the HMP group remained higher (p<0.05) than in both DDKT-SCS subgroups, and moderately higher than in the LDKT transplant group (p = 0.09)). The high post-reperfusion density suggests some persistence of the effects of the artificial dilation.
Fig. 17.
Box and whisker plots of density measurements calculated with original lumen area (a) and with lumen area corrected by linear regression (b) for pre-implantation (left) and post-reperfusion (right) scans for the LDKT group, and the DDKT subgroups: SCD kidneys stored by SCS, ECD kidneys stored by SCS, and SCD kidneys stored by HMP. Each transplant group is further divided into recovery groups which experienced either IGF (green) or DGF (red) following transplant. Mean density values for each recovery group are included in the attached table with p-values (from Student’s t-test), and values adjusted for false discovery rate (FDR) between transplant groups, representing significance of difference between recovery groups for each transplant group. The mean percent change (increase or decrease) to density following reperfusion is included at the bottom of each table for both recovery groups in each transplant group.
3.2.2 Density by area results stratified by recovery group (IGF vs. DGF)
Distinctions between IGF and DGF recovery group measurements in the LDKT transplant group were not investigated due to limited sampling of DGF kidneys (n = 1). Similarly, distinctions between IGF and DGF recovery group measurements in the ECD subgroup of DDKT kidneys stored by HMP were not investigated due to limited sampling (n = 1 for IGF, n = 1 for DGF).
In all transplant groups, density values were similar between IGF and DGF recovery groups (green and red respectively in Fig. 17) prior to implantation. Following transplant and reperfusion, density measurements for the DDKT kidneys stored by SCS increased in both SCD and ECD subgroups for both IGF and DGF recovery groups. In the HMP group, the IGF recovery group experienced a <1% change in density while the DGF recovery group experienced a 23% reduction in density following reperfusion. In the SCD subgroup of DDKT kidneys stored by SCS, post-reperfusion density was similar between IGF and DGF recovery groups. In the ECD subgroup, however, post-reperfusion density in the IGF recovery group was lower (p<0.05) than that of the DGF group. Conversely, in the HMP group, post-reperfusion density in the IGF recovery group was higher (p = 0.28 for original density, p<0.05 for corrected) than in the DGF recovery group.
3.2.3 Density results by association with post-transplant creatinine decline
Following our initial hypothesis that lower PCT lumen density would correlate with a faster recovery following transplant (i.e. density is positively correlated with creatinine values and lower density is correlated with a steeper decline in creatinine (i.e., has a negative interaction effect with time)), linear mixed effect models were fitted for each DDKT transplant group. The pre-implantation fitted model for the SCS-SCD group did not support the hypothesis (p = 0.89), however the post-reperfusion SCS-SCD model trended towards support of the hypothesis moderately (p = 0.09). Both pre-implantation and post-reperfusion fitted models for the SCS-ECD group similarly did not support the hypothesis (p = 0.74, and p = 0.15 respectively). Finally, the pre-implantation model for the HMP-SCD group did support the hypothesis (p<0.01), as did the post-reperfusion model (p<0.001).
3.3 Diameter results
3.3.1 Diameter results stratified by transplant group (IGF/DGF combined)
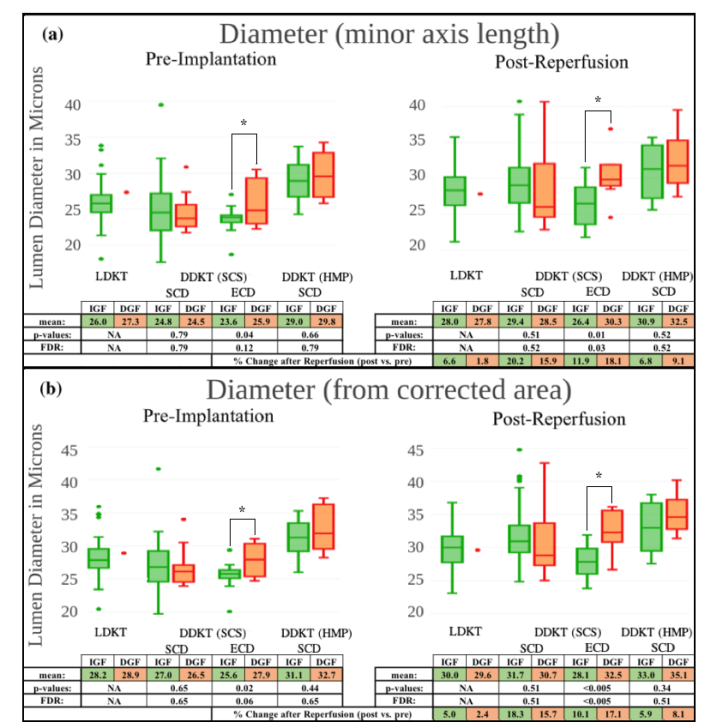
Diameter measurements were relatively consistent between minor axis length and corrected area methods of measurement. Diameter calculated from corrected area was, however, moderately but consistently higher than diameter calculated as the minor axis length. This effect is likely due to the linear regression model’s predictions of instances of moderately elliptical orthogonal cross-sections, which the minor axis length would underestimate.
Prior to implantation (left in Fig. 18), kidneys from the LDKT transplant group demonstrated moderately higher PCT lumen diameter than DDKT kidneys stored by SCS. DDKT kidneys stored by HMP had higher (p<0.001) pre-implantation diameter than all other transplant groups. All groups experienced an increase in diameter between pre-implantation and post-reperfusion scans. The LDKT and DDKT-HMP groups both experienced a modest 5% increase, while DDKT-SCS SCD and ECD subgroups both experienced a larger increase in diameter (18%, and 13% respectively). Post-reperfusion diameter (right in Fig. 18) was similar between the LDKT transplant group and the ECD subgroup of DDKT kidneys stored by SCS. Post-reperfusion diameter in the SCD subgroup of DDKT kidneys stored by SCS was moderately higher (p = 0.08) than in the ECD subgroup and the LDKT transplant group (p<0.05). Post-reperfusion diameter in the HMP group was higher than in all other groups (p<0.005, p = 0.08, p<0.005 for DDKT-SCS, LDKT, and DDKT-ECD respectively).
Fig. 18.
Box and whisker plots of diameter measurements calculated by minor axis length (a) and from lumen area corrected by linear regression (b) for pre-implantation (left) and post-reperfusion (right) scans for the LDKT group, and the DDKT subgroups: SCD kidneys stored by SCS, ECD kidneys stored by SCS, and SCD kidneys stored by HMP. Each transplant group is further divided into recovery groups which experienced either IGF (green) or DGF (red) following transplant. Mean diameter values for each recovery group are included in the attached table with p-values (from Student’s t-test) and values adjusted for FDR between transplant groups, representing significance of difference between recovery groups for each transplant group. The mean percent change (increase or decrease) to diameter following reperfusion is included at the bottom of each table for both recovery groups in each transplant group.
3.3.2 Diameter results stratified by recovery group (IGF vs. DGF)
In the SCD subgroup of DDKT kidneys stored by SCS, diameter measurements were similar between IGF and DGF recovery groups (green and red respectively in Fig. 18) prior to implantation. In the ECD subgroup of DDKT kidneys stored by SCS, pre-implantation diameter measurements were lower (p<0.05) in the IGF than in the DGF recovery group. In the SCD subgroup of DDKT kidneys stored by HMP, pre-implantation diameter measurements were similar between IGF and DGF recovery groups. Following reperfusion, diameter measurements for all recovery groups in all transplant groups increased. Within the SCD subgroup of DDKT kidneys stored by SCS and the HMP group, increases were similar between IGF and DGF recovery groups. In the ECD subgroup, diameter of the IGF recovery group increased 10% while diameter in the DGF group increased 17%. Post-reperfusion diameter in the SCD subgroup of kidneys stored by SCS was similar between IGF and DGF recovery groups. Within the ECD subgroup, diameter in the IGF recovery group remained lower (p<0.005) than in the DGF group. In the HMP transplant group, IGF diameter was moderately lower than in the DGF group (p = 0.34).
3.3.3 Diameter results by association with post-transplant creatinine decline
Following our initial hypothesis that lower PCT lumen diameter would correlate with a faster recovery following transplant (i.e. diameter is positively correlated with creatinine values and lower diameter is correlated with a steeper decline in creatinine (i.e., has a negative interaction effect with time)), linear mixed effect models were fitted for each DDKT transplant group. The pre-implantation fitted model for the SCS-SCD group did not support the hypothesis (p = 0.54), however the post-reperfusion SCS-SCD model did support the hypothesis (p<0.05). The pre-implantation fitted model for the SCS-ECD group similarly did not support the hypothesis (p = 0.96), and the post-reperfusion SCS-ECD model did support the hypothesis (p<0.05). Finally, the pre-implantation model for the HMP-SCD group did support the hypothesis (p<0.05), while the post-reperfusion model did not (p = 0.56).
3.4 Inter-centroid results
3.4.1 Inter-centroid results stratified by transplant group (IGF/DGF combined)
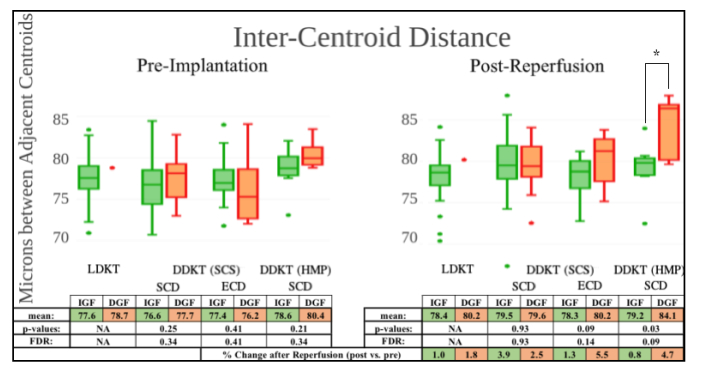
Prior to implantation (left in Fig. 19), kidneys from the LDKT transplant group and DDKT kidneys stored by SCS (both SCD and ECD) all exhibited a similar inter-centroid distance. DDKT kidneys stored by HMP had a higher (p<0.05) pre-implantation inter-centroid distance than all other transplant groups. All groups experienced a modest 1-4% increase in inter-centroid distance between pre-implantation and post-reperfusion scans. Post-reperfusion (right in Fig. 19) inter-centroid distance in the LDKT transplant group, and DDKT-SCS subgroups was similar. Post-reperfusion inter-centroid distance in the HMP group remained higher (p<0.005) than the LDKT group and moderately higher than the DDKT-SCS SCD and ECD subgroups (p = 0.14, and p = 0.06 respectively).
Fig. 19.
Box and whisker plots of inter-centroid measurements for pre-implantation (left) and post-reperfusion (right) scans for the LDKT group, and the DDKT subgroups: SCD kidneys stored by SCS, ECD kidneys stored by SCS, and SCD kidneys stored by HMP. Each transplant group is further divided into recovery groups which experienced either IGF (green) or DGF (red) following transplant. Mean inter-centroid distance values for each recovery group are included in the attached table with p-values (from Student’s t-test) and values adjusted for FDR between transplant groups, representing significance of difference between recovery groups for each transplant group. The mean percent change (increase or decrease) to inter-centroid distance following reperfusion is included at the bottom of each table for both recovery groups in each transplant group.
3.4.2 Inter-centroid results stratified by recovery group (IGF vs. DGF)
Prior to implantation, inter-centroid distance was similar between the IGF and DGF recovery groups in all transplant groups. Following reperfusion, inter-centroid distances increased in all transplant groups for both IGF and DGF recovery groups. In the SCD subgroup of DDKT kidneys stored by SCS, IGF and DGF recovery groups (green and red respectively in Fig. 19) experienced a similar increase following reperfusion. In the ECD subgroup of DDKT kidneys stored by SCS, and in the SCS subgroup of DDKT kidneys stored by HMP, the IGF recovery groups experienced a smaller increase in inter-centroid distance following reperfusion than the DGF groups. In the SCD subgroup of DDKT kidneys stored by SCS, post-reperfusion inter-centroid distance measurements were similar between IGF and DGF groups. In the ECD subgroup, inter-centroid distance was moderately lower (p = 0.09) in the IGF recovery group than in the DGF group. Post-reperfusion inter-centroid distance for the HMP group was lower (p<0.05) in the IGF recovery group than in the DGF group.
3.4.3 Inter-centroid results by association with post-transplant creatinine decline
Following our hypothesis that lower inter-centroid distance would correlate with a faster recovery following transplant (i.e. inter-centroid distance is positively correlated with creatinine values and lower inter-centroid distance is correlated with a steeper decline in creatinine (i.e., has a negative interaction effect with time)), linear mixed effect models were fitted for each DDKT transplant group. Both the pre-implantation and post-reperfusion fitted models for the SCS-SCD group did not support the hypothesis (p = 0.14, and p = 0.17 respectively). Both the pre-implantation and post-reperfusion fitted models for the SCS-ECD group did not support the hypothesis (p = 0.28, and p = 0.72 respectively). Finally, the pre-implantation model for the HMP-SCD group did not support the hypothesis (p = 0.37), however the post-implantation model trended towards moderate support of the hypothesis (p = 0.07).
3.5 Inter-Lumen results
3.5.1 Inter-Lumen results stratified by transplant group (IGF/DGF combined)
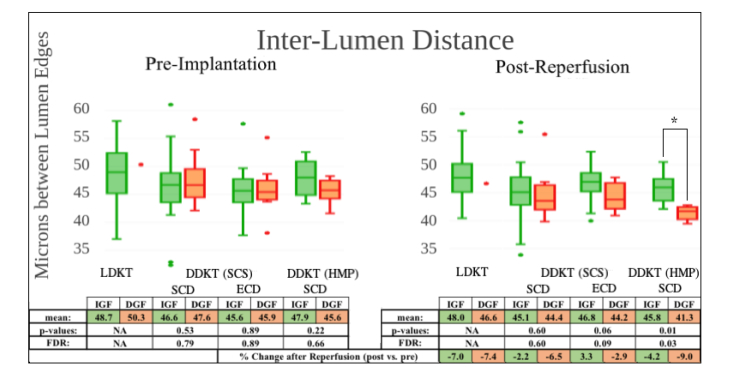
Prior to implantation (left in Fig. 20), the LDKT group exhibited larger (p<0.05) inter-lumen distance than the SCD and ECD subgroups of DDKT kidneys stored by SCS. The SCD subgroup of DDKT kidneys stored by HMP exhibited an inter-lumen distance similar to the LDKT group. Following reperfusion, inter-lumen distance decreased slightly in the LDKT transplant group, the SCD subgroup of DDKT kidneys stored by SCS, and the SCD subgroup of DDKT kidneys stored by HMP. In the ECD subgroup of DDKT kidneys stored by SCS, inter-lumen distance increased slightly following reperfusion. Post-reperfusion (right in Fig. 20) inter-lumen distance was higher (p<0.05) in the LDKT transplant group than in the SCD subgroup of DDKT kidneys stored by SCS, and the SCD subgroup of DDKT kidneys stored by HMP.
Fig. 20.
Box and whisker plots of inter-lumen measurements for pre-implantation (left) and post-reperfusion (right) scans for the LDKT group (green), and the DDKT subgroups: SCD kidneys stored by SCS, ECD kidneys stored by SCS, and SCD kidneys stored by HMP. Each transplant group is further divided into recovery groups which experienced either IGF (green) or DGF (red) following transplant. Mean inter-lumen distance values for each recovery group are included in the attached table with p-values (from Student’s t-test) and values adjusted for FDR between transplant groups, representing significance of difference between recovery groups for each transplant group. The percent change (increase or decrease) to inter-lumen distance following reperfusion is included at the bottom of each table for both recovery groups in each transplant group.
3.5.2 Inter-Lumen results stratified by recovery group (IGF vs. DGF)
Prior to implantation, inter-lumen distance was similar between the IGF and DGF recovery groups in all transplant groups. Following reperfusion, inter-lumen distances in all transplant groups decreased by less in the IGF recovery groups than in DGF groups (green and red respectively in Fig. 20). Post-reperfusion inter-lumen distance in the SCD subgroup of DDKT kidneys stored by SCS was similar between IGF and DGF recovery groups. In the ECD subgroup, post-reperfusion inter-lumen distance was moderately higher (p = 0.06) in the IGF recovery group than in the DGF group. In the HMP group, post-reperfusion inter-lumen distance was higher (p<0.05) in the IGF recovery group than in the DGF group.
3.5.3 Inter-Lumen results by association with post-transplant creatinine decline
Following our initial hypothesis that smaller inter-lumen distance would correlate with a faster recovery following transplant (i.e. inter-lumen distance is negatively correlated with creatinine values and higher inter-lumen distance is correlated with a steeper decline in creatinine (i.e., has a negative interaction effect with time)), linear mixed effect models were fitted for each DDKT transplant group. The pre-implantation fitted model for the SCS-SCD group did not support the hypothesis (p = 0.24), however the post-reperfusion SCS-SCD model showed strong support of the hypothesis (p<0.001). The pre-implantation model for the SCS-ECD group did not support the hypothesis (p = 0.78), however the post-reperfusion model did support the hypothesis (p<0.05). Finally, both the pre-implantation and post-reperfusion models for the HMP-SCD group showed strong support for the hypothesis (p<0.0005, and p<0.005 respectively).
3.6 Parsimony of image measurements
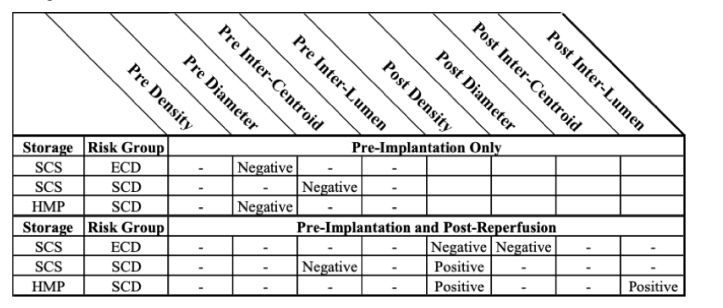
To assess relevance and redundancy of measurements, the compiled measurements from each transplant group were included in the pool of candidate predictor variables in lasso penalized regression models, with the post-transplant function (IGF coded as 1 vs. DGF coded as 0) as the binary outcome variable. Two sets of penalized logistic regression models were run for each transplant group: one included pre-implantation measurements only in the candidate pool to identify the most relevant of pre-implantation measurements to post-transplant function (i.e., measurements which could affect allocation or discard), and the other included all the pre-implantation and post-reperfusion measurements in the pool to determine the most relevant measurements to post-transplant function (i.e., measurements which could affect post-operative care). The number of selected measurements was determined by minimizing the averaged 3-fold cross-validation error. Selected measurements and their impact are listed in Fig. 21.
Fig. 21.
Table displaying measurements selected by lasso penalized regression modeling as the most relevant to post-transplant function. Selected measurements from only pre-implantation measurements (top), and from the combined pre-implantation and post-reperfusion measurements (bottom) were selected.
In the ECD subgroup of DDKT kidneys stored by SCS, the penalized model indicated pre-implantation diameter was most relevant, among pre-implantation measurements, to post-transplant function. Pre-implantation diameter had a negative impact on post-transplant function in this instance, suggesting that larger lumen diameter is the most predictive of assessed measurements for development of DGF in this transplant subgroup. When including both pre-implantation and post-reperfusion measurements, the regression model indicated post-reperfusion diameter and post-reperfusion density as the two variables, among all measurements, that were most relevant to post-transplant function. Both have negative impact on the outcome, suggesting that larger post-reperfusion lumen diameter and higher post-reperfusion lumen density are the most predictive of assessed measurements for development of DGF in this transplant subgroup.
In the SCD subgroup of DDKT kidneys stored by SCS, the penalized model indicated pre-implantation inter-centroid distance was most relevant, among pre-implantation measurements, to post-transplant function. Pre-implantation inter-centroid distance had a negative impact on post-transplant function in this instance, suggesting that larger inter-centroid distance is the most predictive of assessed measurements for development of DGF in this transplant subgroup. When including both pre-implantation and post-reperfusion measurements, the regression model indicated pre-implantation inter-centroid distance and post-reperfusion density as the two variables, among all measurements, that were most relevant to post-transplant function. Inter-centroid distance and density had negative and positive impacts on outcome, respectively, suggesting that larger pre-implantation inter-centroid distance and lower post-reperfusion lumen density are the most predictive of assessed measurements for development of DGF in this transplant subgroup.
In the SCD subgroup of DDKT kidneys stored by HMP, the penalized model indicated pre-implantation diameter was most relevant, among pre-implantation measurements, to post-transplant function. Pre-implantation diameter had a negative impact on post-transplant function in this instance, suggesting that larger diameter is the most predictive of assessed measurements for development of DGF in this transplant subgroup. When including both pre-implantation and post-reperfusion measurements, the regression model indicated post-reperfusion inter-lumen distance and post-reperfusion density as the two variables, among all measurements, that were most relevant to post-transplant function. Both have negative impact on the outcome, suggesting that smaller post-reperfusion inter-lumen distance and lower post-reperfusion lumen density are the most predictive of assessed measurements for development of DGF in this transplant subgroup.
Discussion
Fibrosis in donor kidneys may compromise graft viability, and is routinely evaluated in pre-implantation kidney biopsies [28–30]. Partial epithelial-to-mesenchymal transition (EMT) may play a role in the progression of fibrosis. This process has the effect of flattening PCT epithelial cells, and may produce an increased lumen diameter in affected tubules [31,32]. Similarly, fibrosis contributes to tubular atrophy, and in turn, compensatory hypertrophy of surviving PCTs [33,34]. The lumen of hypertrophied tubules is also frequently dilated to accommodate their increased role [35]. The effects of fibrosis therefore may be visible in OCT imaging, evidenced by the dilation of tubular lumen.
Acute tubular injury (ATI) in donor kidneys may similarly compromise graft viability. ATI can induce simplification of the tubular epithelium [18]. Shedding of the PCTs’ microvillus brush border and sloughing of tubular epithelial cells into the lumen may also present as a dilation of the tubular lumen in OCT scans. In addition, as blood flow is restored following reperfusion, sloughed epithelial cells may obstruct flow and increase proximal tubule pressure dramatically; heightened pressure may produce substantial dilation of the tubular lumen presented in post-reperfusion OCT scans and potentially pre-implantation OCT scans of kidneys preserved by HMP [36]. The short-term effects of ATI therefor may be visible in OCT imaging, evidenced by the dilation of visible tubular lumen.
Swelling of the PCT epithelium, induced by ischemic damage, may similarly represent the effects or symptoms of ATI [18]. Epithelial swelling occludes the luminal space, resulting in a reduced diameter and an increased inter-lumen distance. If PCT swelling reduces the tubular lumen beyond the resolution of the OCT system, diameter and inter-lumen measurements would not reflect the contribution of more swollen PCTs. Density measurements, however, would illustrate this effect. In the SCD subgroup of DDKT kidneys stored by SCS, there were no strong differences in measurements between IGF and DGF recovery groups. In the ECD subgroup—those most at risk for poor post-transplant function, and most subject to discard—measures of PCT lumen density and diameter, acquired both prior to implantation and following reperfusion, were lower in the IGF than in the DGF recovery group. The IGF recovery group similarly demonstrated a larger inter-lumen distance measurement following reperfusion than the DGF group. Taken together, these measurements suggest a flattening of the PCT epithelium and consequent dilation of tubular lumen in ECD kidneys which go on to experience DGF. This may be a symptom of pre-existing pathology (fibrosis) or ATI. It is unclear why this pattern does not present in the SCD subgroup.
Following reperfusion, density and diameter measurements in both the SCD and ECD subgroups of DDKT kidneys stored by SCS experienced increases in both IGF and DGF recovery groups. This may reflect dissipation of epithelial swelling as the kidney moves away from an ischemic state. This may also result from the effect of flow rate of filtrate on luminal diameter [37]. Increased distinction between IGF and DGF recovery group measurements following reperfusion may be due to pre-existing pathology being revealed by the dissipation of swelling (e.g. dilated lumen of hypertrophied tubules may become more evident when epithelial swelling subsides). More likely, this is the result of the reperfusion process inducing further shedding of the microvillus brush border and/or further epithelial sloughing. Similarly, sloughed tubular epithelial cells which may have fully occluded the lumen during static-storage may be cleared following reperfusion, revealing further luminal dilation.
In the ECD subgroup, but not the SCD subgroup, of DDKT kidneys stored by SCS, the DGF recovery group experienced an increase in inter-centroid distance following reperfusion, while the IGF group did not. This may reflect infiltration of inflammatory cells into the interstitial space, and subsequent interstitial edema [38]. This would be consistent with the ATI theory and would suggest symptoms of ischemia/reperfusion injury (IRI) in the DGF group.
In the SCD subgroup of DDKT kidneys stored by HMP, diameter, and inter-lumen measurements for DGF kidneys echo the trends apparent in the ECD subgroup of DDKT kidneys stored by SCS (i.e. increased lumen diameter and reduced inter-lumen distance). This suggests that, in HMP preserved kidneys, ATI or pre-existing pathology may also present as dilated tubular lumen with simplified or flattened tubular epithelium. Inter-centroid measurements similarly echo trends apparent in the ECD transplant group. Following reperfusion, the DGF recovery group experienced an increase in inter-centroid distance and subsequently exhibited a higher inter-centroid measurement than the IGF recovery group. This again may suggest interstitial edema following reperfusion.
Surprisingly, HMP kidneys in the DGF recovery group experienced a dramatic reduction in density following reperfusion, while the IGF group experienced little change. The resulting IGF density was higher than the density in the DGF group. Higher diameter and lower inter-lumen distances in the post-reperfusion DGF group would normally correlate with higher density measurements. One explanation for this contradictory result is that some PCT lumens in the HMP-DGF group had become fully occluded following reperfusion, excluding these PCTs from diameter and inter-lumen measurement, but still detracting from luminal area in the density measurement.
One limitation of this study is the imaging protocol, which heavily weighted the composition of image sets towards regions of the kidney where tubule lumens were most visible and dilated. While this protocol may highlight focal points of pathology, it does not provide a global distribution of PCT features. Global imaging sampling multiple areas of the kidney may reveal a more heterogeneous pattern of swelling and dilation, with some areas exhibiting tubular lumen dilated by fibrosis or ATI, and other areas exhibiting significant swelling.
In future studies, a more systematic and global imaging strategy may yield further insights. While the selection of a single B-scan for each image set removes issues of redundancy, it also severely limits the total area being investigated. In future studies, a 3D imaging protocol would eliminate redundancy, allowing all imaging data to be evaluated and a larger volume of kidney to be assessed. Similarly, 3D imaging would enable orientation of tubular features in a 3D space and would provide more accurate measurements. While the linear regression model utilized in this study attempts to correct for this issue, training data for the model is extracted only from a single preserved kidney and may not be applicable to all kidneys.
Conclusion
There is a dire need in the transplant community for new measures of kidney viability. To support the growing need for kidneys, higher risk kidneys must be considered for transplant. To efficiently utilize this deeper end of the donor pool, surgeons must be able to confidently predict kidneys’ potential function and longevity following transplant.
OCT provides a non-invasive view of the microanatomy of the superficial kidney cortex. Assessment of this anatomy has the potential to offer insights into the viability of a kidney offered for transplant. This study shows that dilation of tubular lumen and simplification of tubular epithelium of the PCTs can be assessed by OCT, and these measurements correlate with post-transplant function. These factors may represent symptoms of pre-existing pathology or acute tubular injury.
OCT analysis may provide a valuable supplement to current methods for assessing kidney viability. Accurate prediction of post-transplant function prior to implantation may aid in allocation of kidneys, while accurate prediction of post-transplant function following transplant may influence post-operative care.
The variability between manual raters in this study demonstrates the necessity of consistency and reproducibility in analysis. The fully automated analysis used in this study removes the elements of user bias and subjective segmentation. Similarly, manual segmentation is considerably too slow a process when advising a surgeon on the time-sensitive decision to accept or reject a kidney for transplant. Fully automated segmentation and analysis provides a high-speed solution to obtaining accurate predictive measures.
This study assessed the potential utility of OCT imaging in predicting post-transplant function. While results are promising, inclusion of additional variables (KDPI, ischemic times, biopsy scoring, etc.) into one prediction model may provide a more comprehensive view of kidney viability. Similarly, global OCT imaging and capture of 3D volumes would provide a more detailed view of the distribution of PCT morphology, and may aid in prediction of post-transplant function. 3D volumes would similarly enable adoption of previously developed OCT segmentation strategies, for example the Hessian filter approach by Yousefi et al. and single-scattering model with segment-joining algorithm by Gong et al. [39,40].
Acknowledgements
We thank ThorLabs Inc. for assistance with the OCT equipment. Brandon Gaitan is supported by the Clark Doctoral Fellowship Program.
Funding
National Institutes of Health (NIH) 1R01 DK 094877.
Disclosures
Drs. Chen and Tang have financial interests in Vitae Organi, Inc., which, however, did not provide support for this work. Drs. Chen and Andrews hold a U.S. patent “Apparatus and Methods for Non-invasive Assessment of Transplant Kidney Viability” (US 9,737,256 B2). Other authors declare that there are no conflicts of interest related to this article.
References
- 1.Hart A., Smith J. M., Skeans M. A., Gustafson S. K., Stewart D. E., Cherikh W. S., Wainright J. L., Kucheryavaya A., Woodbury M., Snyder J. J., Kasiske B. L., Israni A. K., “OPTN/SRTR 2015 Annual Data Report: Kidney,” Am. J. Transplant. 17(Suppl 1), 21–116 (2017). 10.1111/ajt.14124 [DOI] [PMC free article] [PubMed] [Google Scholar]
- 2.Nagaraja P., Roberts G. W., Stephens M., Horvath S., Kaposztas Z., Chavez R., Asderakis A., “Impact of Expanded Criteria Variables on Outcomes of Kidney Transplantation from Donors After Cardiac Death,” Transplantation 99(1), 226–231 (2015). 10.1097/TP.0000000000000304 [DOI] [PubMed] [Google Scholar]
- 3.Pascual J., Zamora J., Pirsch J. D., “A Systematic Review of Kidney Transplantation From Expanded Criteria Donors,” Am. J. Kidney Dis. 52(3), 553–586 (2008). 10.1053/j.ajkd.2008.06.005 [DOI] [PubMed] [Google Scholar]
- 4.Tomita Y., Tojimbara T., Iwadoh K., Nakajima I., Fuchinoue S., “Long-Term Outcomes in Kidney Transplantation From Expanded-Criteria Donors After Circulatory Death,” Transplant. Proc. 49(1), 45–48 (2017). 10.1016/j.transproceed.2016.10.009 [DOI] [PubMed] [Google Scholar]
- 5.Bae S., Massie A. B., Luo X., Anjum S., Desai N. M., Segev D. L., “Changes in Discard Rate After the Introduction of the Kidney Donor Profile Index (KDPI),” Am. J. Transplant. 16(7), 2202–2207 (2016). 10.1111/ajt.13769 [DOI] [PMC free article] [PubMed] [Google Scholar]
- 6.Ojo A. O., Hanson J. A., Meier-Kriesche H., Okechukwu C. N., Wolfe R. A., Leichtman A. B., Agodoa L. Y., Kaplan B., Port F. K., “Survival in recipients of marginal cadaveric donor kidneys compared with other recipients and wait-listed transplant candidates,” J. Am. Soc. Nephrol. 12(3), 589–597 (2001). [DOI] [PubMed] [Google Scholar]
- 7.Snoeijs M. G., Schaubel D. E., Hené R., Hoitsma A. J., Idu M. M., Ijzermans J. N., Ploeg R. J., Ringers J., Christiaans M. H., Buurman W. A., van Heurn L. W. E., “Kidneys from donors after cardiac death provide survival benefit,” J. Am. Soc. Nephrol. 21(6), 1015–1021 (2010). 10.1681/ASN.2009121203 [DOI] [PMC free article] [PubMed] [Google Scholar]
- 8.Heilman R. L., Green E. P., Reddy K. S., Moss A., Kaplan B., “Potential Impact of Risk and Loss Aversion on the Process of Accepting Kidneys for Transplantation,” Transplantation 101(7), 1514–1517 (2017). 10.1097/TP.0000000000001715 [DOI] [PubMed] [Google Scholar]
- 9.Doshi M. D., Reese P. P., Hall I. E., Schröppel B., Ficek J., Formica R. N., Weng F. L., Hasz R. D., Thiessen-Philbrook H., Parikh C. R., “Utility of Applying Quality Assessment Tools for Kidneys With KDPI ≥80,” Transplantation 101(6), 1125–1133 (2017). 10.1097/TP.0000000000001388 [DOI] [PMC free article] [PubMed] [Google Scholar]
- 10.Onozato M. L., Andrews P. M., Li Q., Jiang J., Cable A., Chen Y., “Optical coherence tomography of human kidney,” J. Urol. 183(5), 2090–2094 (2010). 10.1016/j.juro.2009.12.091 [DOI] [PubMed] [Google Scholar]
- 11.Wierwille J., Andrews P. M., Onozato M. L., Jiang J., Cable A., Chen Y., “In vivo, label-free, three-dimensional quantitative imaging of kidney microcirculation using Doppler optical coherence tomography,” Lab. Invest. 91(11), 1596–1604 (2011). 10.1038/labinvest.2011.112 [DOI] [PMC free article] [PubMed] [Google Scholar]
- 12.Andrews P. M., Wang H.-W., Wierwille J., Gong W., Verbesey J., Cooper M., Chen Y., “Optical coherence tomography of the living human kidney,” J. Innov. Opt. Health Sci. 7(2), 1350064 (2014). 10.1142/S1793545813500648 [DOI] [Google Scholar]
- 13.Andrews P. M., Chen Y., Onozato M. L., Huang S.-W., Adler D. C., Huber R. A., Jiang J., Barry S. E., Cable A. E., Fujimoto J. G., “High-resolution optical coherence tomography imaging of the living kidney,” Lab. Invest. 88(4), 441–449 (2008). 10.1038/labinvest.2008.4 [DOI] [PubMed] [Google Scholar]
- 14.Huang D., Swanson E. A., Lin C. P., Schuman J. S., Stinson W. G., Chang W., Hee M. R., Flotte T., Gregory K., Puliafito C. A., Et A., “Optical coherence tomography,” Science 254(5035), 1178–1181 (1991). 10.1126/science.1957169 [DOI] [PMC free article] [PubMed] [Google Scholar]
- 15.Li Z., Tang Q., Jin L., Andrews P. M., Chen Y., “Monitoring Kidney Microanatomy Changes During Ischemia-Reperfusion Process Using Texture Analysis of OCT Images,” IEEE Photonics J. 9(2), 4000110 (2017). 10.1109/JPHOT.2017.2669482 [DOI] [PMC free article] [PubMed] [Google Scholar]
- 16.Andrews P. M., Chen Y., “Using Optical Coherence Tomography (OCT) to Evaluate Human Donor Kidneys Prior to and Following Transplantation,” J. Nephrol. Ther. 04(01), 1000151 (2014). 10.4172/2161-0959.1000151 [DOI] [Google Scholar]
- 17.Farris A. B., Colvin R. B., “Renal interstitial fibrosis: mechanisms and evaluation,” Curr. Opin. Nephrol. Hypertens. 21(3), 289–300 (2012). 10.1097/MNH.0b013e3283521cfa [DOI] [PMC free article] [PubMed] [Google Scholar]
- 18.Moeckel G. W., “Pathologic Perspectives on Acute Tubular Injury Assessment in the Kidney Biopsy,” Semin. Nephrol. 38(1), 21–30 (2018). 10.1016/j.semnephrol.2017.09.003 [DOI] [PubMed] [Google Scholar]
- 19.Boor P., Ostendorf T., Floege J., “Renal fibrosis: novel insights into mechanisms and therapeutic targets,” Nat. Rev. Nephrol. 6(11), 643–656 (2010). 10.1038/nrneph.2010.120 [DOI] [PubMed] [Google Scholar]
- 20.Irish W. D., Ilsley J. N., Schnitzler M. A., Feng S., Brennan D. C., “A Risk Prediction Model for Delayed Graft Function in the Current Era of Deceased Donor Renal Transplantation,” Am. J. Transplant. 10(10), 2279–2286 (2010). 10.1111/j.1600-6143.2010.03179.x [DOI] [PubMed] [Google Scholar]
- 21.Flechner S. M., Kobashigawa J., Klintmalm G., “Calcineurin inhibitor-sparing regimens in solid organ transplantation: focus on improving renal function and nephrotoxicity,” Clin. Transplant. 22(1), 1–15 (2008). [DOI] [PubMed] [Google Scholar]
- 22.Wang B., Wang H.-W., Guo H., Anderson E., Tang Q., Wu T., Falola R., Smith T., Andrews P. M., Chen Y., “Optical coherence tomography and computer-aided diagnosis of a murine model of chronic kidney disease,” J. Biomed. Opt. 22(12), 1–11 (2017). 10.1117/1.JBO.22.12.121706 [DOI] [PMC free article] [PubMed] [Google Scholar]
- 23.Li Q., Onozato M. L., Andrews P. M., Chen C.-W., Paek A., Naphas R., Yuan S., Jiang J., Cable A., Chen Y., “Automated quantification of microstructural dimensions of the human kidney using optical coherence tomography (OCT),” Opt. Express 17(18), 16000–16016 (2009). 10.1364/OE.17.016000 [DOI] [PubMed] [Google Scholar]
- 24.Yarlagadda S. G., Coca S. G., Formica R. N., Jr., Poggio E. D., Parikh C. R., “Association between delayed graft function and allograft and patient survival: a systematic review and meta-analysis,” Nephrol. Dial. Transplant. 24(3), 1039–1047 (2008). 10.1093/ndt/gfn667 [DOI] [PubMed] [Google Scholar]
- 25.Schmid M., “Versatile Wand Tool,” (2015).
- 26.Lubas A., Kade G., Ryczek R., Banasiak P., Dyrla P., Szamotulska K., Schneditz D., Niemczyk S., “Ultrasonic evaluation of renal cortex arterial area enables differentiation between hypertensive and glomerulonephritis-related chronic kidney disease,” Int. Urol. Nephrol. 49(9), 1627–1635 (2017). 10.1007/s11255-017-1634-7 [DOI] [PMC free article] [PubMed] [Google Scholar]
- 27.Boom H., Mallat M. J. K., de Fijter J. W., Zwinderman A. H., Paul L. C., “Delayed graft function influences renal function, but not survival,” Kidney Int. 58(2), 859–866 (2000). 10.1046/j.1523-1755.2000.00235.x [DOI] [PubMed] [Google Scholar]
- 28.Risdon R. A., Sloper J. C., De Wardener H. E., “Relationship between renal function and histological changes found in renal-biopsy specimens from patients with persistent glomerular nephritis,” Lancet 2(7564), 363–366 (1968). 10.1016/S0140-6736(68)90589-8 [DOI] [PubMed] [Google Scholar]
- 29.Remuzzi G., Grinyò J., Ruggenenti P., Beatini M., Cole E. H., Milford E. L., Brenner B. M., “Early experience with dual kidney transplantation in adults using expanded donor criteria,” J. Am. Soc. Nephrol. 10(12), 2591–2598 (1999). [DOI] [PubMed] [Google Scholar]
- 30.Munivenkatappa R. B., Schweitzer E. J., Papadimitriou J. C., Drachenberg C. B., Thom K. A., Perencevich E. N., Haririan A., Rasetto F., Cooper M., Campos L., Barth R. N., Bartlett S. T., Philosophe B., “The Maryland Aggregate Pathology Index: A Deceased Donor Kidney Biopsy Scoring System for Predicting Graft Failure,” Am. J. Transplant. 8(11), 2316–2324 (2008). 10.1111/j.1600-6143.2008.02370.x [DOI] [PubMed] [Google Scholar]
- 31.Lovisa S., Zeisberg M., Kalluri R., “Partial Epithelial-to-Mesenchymal Transition and Other New Mechanisms of Kidney Fibrosis,” Trends Endocrinol. Metab. 27(10), 681–695 (2016). 10.1016/j.tem.2016.06.004 [DOI] [PubMed] [Google Scholar]
- 32.Ovadya Y., Krizhanovsky V., “A new Twist in kidney fibrosis,” Nat. Med. 21(9), 975–977 (2015). 10.1038/nm.3938 [DOI] [PubMed] [Google Scholar]
- 33.Schelling J. R., “Tubular atrophy in the pathogenesis of chronic kidney disease progression,” Pediatr. Nephrol. 31(5), 693–706 (2016). 10.1007/s00467-015-3169-4 [DOI] [PMC free article] [PubMed] [Google Scholar]
- 34.Nicholson M. L., Bailey E., Williams S., Harris K. P., Furness P. N., “Computerized histomorphometric assessment of protocol renal transplant biopsy specimens for surrogate markers of chronic rejection,” Transplantation 68(2), 236–241 (1999). 10.1097/00007890-199907270-00013 [DOI] [PubMed] [Google Scholar]
- 35.Chevalier R. L., “The proximal tubule is the primary target of injury and progression of kidney disease: role of the glomerulotubular junction,” Am. J. Physiol. Renal Physiol. 311(1), F145–F161 (2016). 10.1152/ajprenal.00164.2016 [DOI] [PMC free article] [PubMed] [Google Scholar]
- 36.Cortell S., Gennari F. J., Davidman M., Bossert W. H., Schwartz W. B., Ponte M. L., “A definition of proximal and distal tubular compliance. Practical and theoretical implications,” J. Clin. Invest. 52(9), 2330–2339 (1973). 10.1172/JCI107422 [DOI] [PMC free article] [PubMed] [Google Scholar]
- 37.Maunsbach A. B., Giebisch G. H., Stanton B. A., “Effects of flow rate on proximal tubule ultrastructure,” Am. J. Physiol. 253(3 Pt 2), F582–F587 (1987). [DOI] [PubMed] [Google Scholar]
- 38.Bonventre J. V., Yang L., “Cellular pathophysiology of ischemic acute kidney injury,” J. Clin. Invest. 121(11), 4210–4221 (2011). 10.1172/JCI45161 [DOI] [PMC free article] [PubMed] [Google Scholar]
- 39.Yousefi S., Qin J., Zhi Z., Wang R. K., “Label-free optical lymphangiography: development of an automatic segmentation method applied to optical coherence tomography to visualize lymphatic vessels using Hessian filters,” J. Biomed. Opt. 18(8), 086004 (2013). 10.1117/1.JBO.18.8.086004 [DOI] [PMC free article] [PubMed] [Google Scholar]
- 40.Gong P., Es’haghian S., Harms K.-A., Murray A., Rea S., Wood F. M., Sampson D. D., McLaughlin R. A., “In vivo label-free lymphangiography of cutaneous lymphatic vessels in human burn scars using optical coherence tomography,” Biomed. Opt. Express 7(12), 4886–4898 (2016). 10.1364/BOE.7.004886 [DOI] [PMC free article] [PubMed] [Google Scholar]


