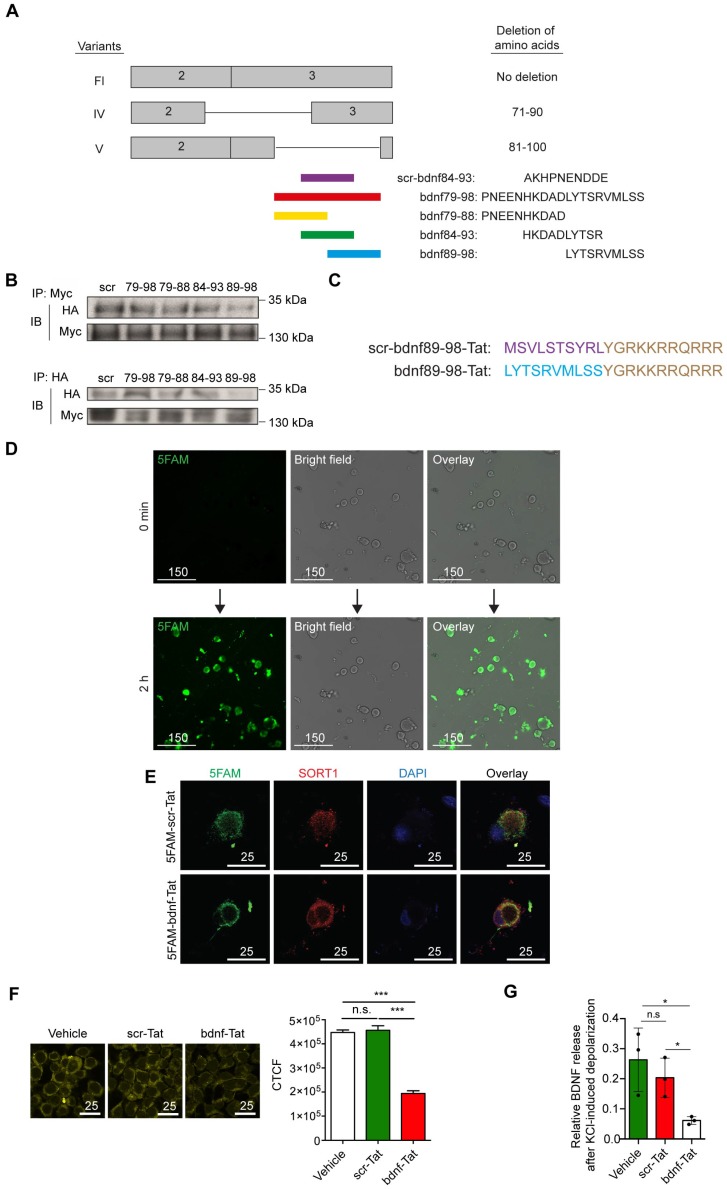
Figure 4.
Construction of a novel peptide targeting proBDNF-sortilin Interaction. (A) Schematic diagram illustrating the design of a series of blocking peptides targeting proBDNF-sortilin interaction interface. Scr-bdnf84-83 (scr), scrambled peptide with permutation of peptide sequence at amino acid 84-93. (B) Immunoblots of co-immunoprecipitation (upper) or reverse co-immunoprecipitation (lower) of sortilin and proBDNF variants in cell lysates overexpressing full-length proBDNF and sortilin followed by peptide incubation obtained with antibodies against HA or Myc. IP, Immunoprecipitation; IB, Immunoblot. (C) Schematic diagram of the design of the Tat-tagged interfering peptide. Scr-bdnf89-98-Tat, Tat-tagged scrambled peptide with permutation of peptide sequence at amino acid 89-98. (D) Live fluorescence micrographs of 5FAM (green) or bright field in rat DRG neuronal cultures before (0 min) and incubated with 5 µM 5FAM-tagged bdnf89-98-Tat (bdnf-Tat) for 2 h. Scale bar represents 150 µm. (E) Fluorescence micrograph of 5FAM (green), sortilin (red) or DAPI (blue) in rat DRG neuronal cultures with peptides pre-treatment for 30 min. Scale bars represent 25 µm. (F) Left, fluorescence micrograph of BiFC assay (yellow) of HEK293T cells overexpressing full-length BDNF and sortilin with vehicle, 10 µM scr-Tat or bdnf-Tat pre-treatment for 30 min. Scale bars represent 25 µm. Right, Determination of the corrected total cell fluorescence (CTCF) of the BiFC signal. P<0.0001, one-way ANOVA. ***P<0.0001, scr-Tat treatment versus bdnf-Tat treatment. Mean values ± SEM. n = 100 individual cells from 5 images. (G) Effect of 30 min peptide pre-treatment on activity-dependent secretion of BDNF in rat DRG neuronal cultures with high-potassium stimulus using ELISA. P<0.05, one-way ANOVA. *P<0.05, vehicle versus scr-Tat treatment or scr-Tat treatment versus bdnf-Tat treatment. Values are means ± SEM. Each data point represents the average of 3 independent experiments.

