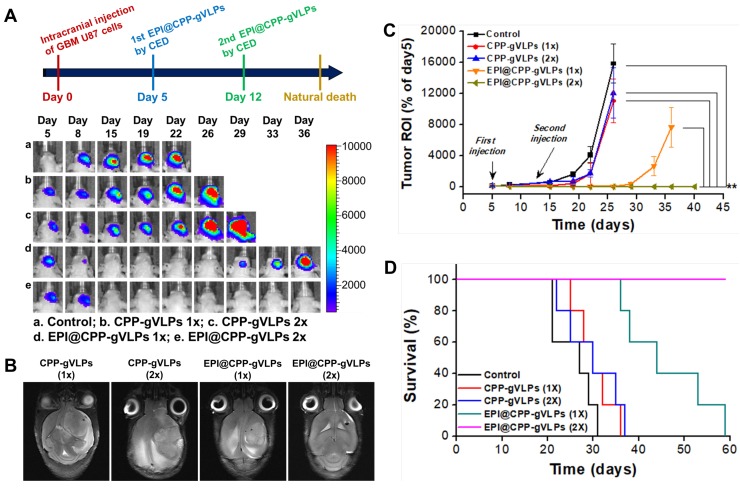
Figure 6.
(A) Treatment protocols assessing nanotherapeutic agent-based therapy by CED infusion. Animals were monitored by IVIS imaging at the indicated time points to measure tumor growth; one representative mouse from each of the indicated groups is shown. (B) MR images of U87-MGLu bearing tumors after CED infusions of various nanotherapeutic agents at the end-time point to verify the tumor size measured by IVIS. (C) Tumor progression observation among groups; corresponding tumor volume ratio determined from IVIS ROI value in (B) for each time point compared with day 5. Values are expressed as means ± SD (n = 10). **indicates a significant difference (Student's t-test, **p ≤ 0.05). (D) Kaplan-Meier curve shows the survival of mice implanted with U87-MGLu cells at 5 × 10⁵ cells per mouse. On day 5 after transplantation, animals were infused with one or two doses of CPP-gVLPs (3.6 mg of CPP-gVLPs/kg; n = 10) or EPI@CPP-gVLPs (5.0 mg of EPI@CPP-gVLPs/kg containing 1.4 mg of EPI/kg; n = 10) by CED. The animals that did not receive any treatment were the control group (n = 10). 1x: 1 dose; 2x: 2 doses.

