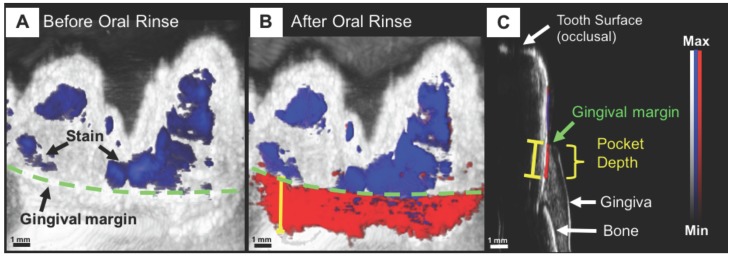
Figure 10.
Non-invasive and precise measurement of porcine periodontal pocket depths using PAI. (A) PA/Ultrasound image of the gum line (green) and tooth with stains (blue) at 680 nm, prior to oral rinse of contrast agent. (B) Image following oral rinse with contrast agent, revealing the pocket (red) under the gum line. (C) Sagittal view of a 3D PA scan of the tooth, distinguishing hard and soft tissue, and revealing the PA signal from the contrast agent beginning at the gingival margin and extending through the pocket depth 209.

