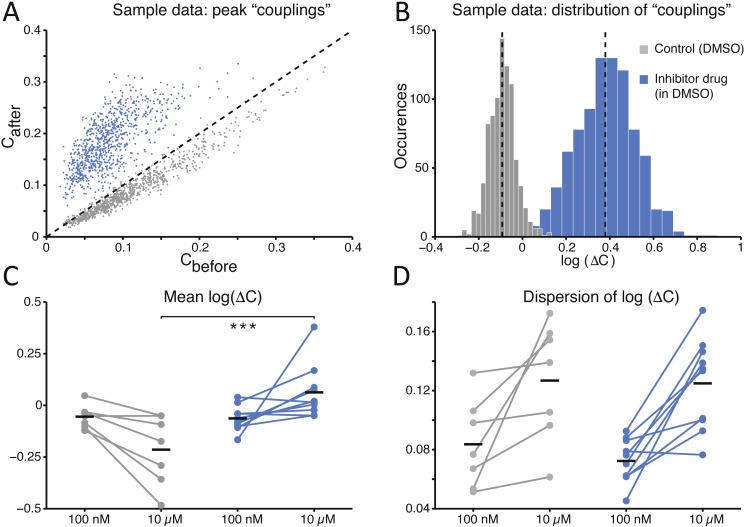
Figure 4. The average functional coupling across any microelectrode pair appears strengthened under SP inhibition.
When compared to control conditions (grey), the strength of functional coupling increases (A) with the inhibitor at the high dose (blue). Each dot in the scatter plot corresponds to one pair of microelectrodes and displays the value of the peak of the spike cross-correlogram before and after the SP inhibition: dots above the unitary slope line imply an increase in strength with respect to baseline. The actual distribution of values, in the same representative example of panel (A), can be better displayed in logarithmic scale (base 10) while expressing the change (B) after the dose referred to the baseline: the black dotted vertical lines are the mean values of the distributions (control versus high dose) and are significantly different. Across all our experiments (C), 10 µM of the SP inhibitor significantly strengthened the functional couplings between microelectrodes compared to the control, while the latter tends to even decrease over time (black horizontal bars indicate the group averages). The standard deviation or dispersion (D) of the log10(ΔC) distributions increases over time, but in the same manner comparing the effect of the compound and the control.

