Abstract
BACKGROUND. The West African Ebola virus epidemic from 2014–2016 highlighted the lack of knowledge about the pathogenicity of the virus and the factors responsible for outcome. A performant and rapid diagnosis is of crucial importance, as is overcoming the difficulty of providing high-quality patient management during such an extensive outbreak. Here, we propose to study the role of the immune mediators during Ebola virus disease and to define some molecules of importance in the outcome.
METHODS. Plasma from Guinean patients sampled during the outbreak were analyzed using RT-qPCR, magnetic bead assay, ELISA, and high-quality statistical analyses. We also performed a transcriptomic analysis in leukocytes samples. Therefore, we deeply characterized the immune responses involved in Ebola virus disease.
RESULTS. We evaluated the immune patterns depending on the outcome of the disease. Survivors presented an efficient and well-balanced immune response, whereas fatalities were characterized by an intense inflammatory response, overexpression of multiple cytokines, and a “chemokine storm.” The plasma concentration of most of the parameters tested increased until death. Statistical analyses also allowed us to define a panel of markers highly predictive of outcome.
CONCLUSION. The immune response observed in fatalities was highly similar to that characterizing septic shock syndrome. Our results suggest that immune responses can play a major pathogenic role during severe Ebola virus infection and argue in favor of therapeutic approaches that act on both viral replication and the induction of shock syndrome.
FUNDING. French Ministry of Foreign Affairs, the Agence Française de Développement, and the Institut Pasteur.
Keywords: Infectious disease, Virology
Keywords: Chemokines, Cytokines, Innate immunity
Immune patterns in Ebola virus disease correlate with outcome in humans.
Introduction
From March 2014 to March 2016, western Africa suffered the largest Ebola virus (EBOV) outbreak to date, resulting in 28,652 cases and 11,325 deaths. To contain the epidemic, Ebola treatment centers (ETC) associated with diagnostic labs were installed in all strategic areas. In addition to diagnosing EBOV, some of these labs analyzed biochemical parameters that could be important markers of severity and beneficial in the treatment of EBOV disease (EVD) and restoring homeostasis (1–5).
For a better knowledge of the illness, immune responses were monitored during the epidemic. At the same time that survivors presented moderate viral loads and early antibody responses, fatalities were characterized by high viral loads, weak humoral responses, and the release of proinflammatory and antiinflammatory cytokines as well as the expression of free radicals (6–9) and disseminated intravascular coagulation (10–12). Macrophages and DCs have been considered to be the major cells responsible for this unbalanced immune response and to be critical for dissemination of the virus from the site of infection (11). However, although the infection of macrophages induced type I IFN and proinflammatory cytokine synthesis, in vitro EBOV infection of DCs did not activate them; they did not produce type I IFNs or proinflammatory cytokines and produced only small amounts of chemokines (13–15). In addition, severe lymphopenia has been shown to be a hallmark of EVD and results in the loss of T cells and NK cells (16–20), whereas the depletion of B cells is still uncertain (17, 20). Such lymphopenia is due to massive apoptosis (6, 17, 20). T cell–derived cytokines, such as IL-2 and IL-4, have been therefore consistently absent from patient blood samples (16, 21, 22). Moreover, T cells from fatalities were shown to express higher levels of inhibitory CTLA-4 than those from survivors (23), thus avoiding T cell activation by antigen-presenting cells.
Here, we explored the immune response in patients infected with the Makona isolate of EBOV. We constructed an outcome-dependent map of the immune response and were able to define parameters of crucial importance in outcome prognosis. Nonhealthy EBOV-negative patients were used as controls to distinguish specific patterns due to EVD.
Results
Virological and serological parameters.
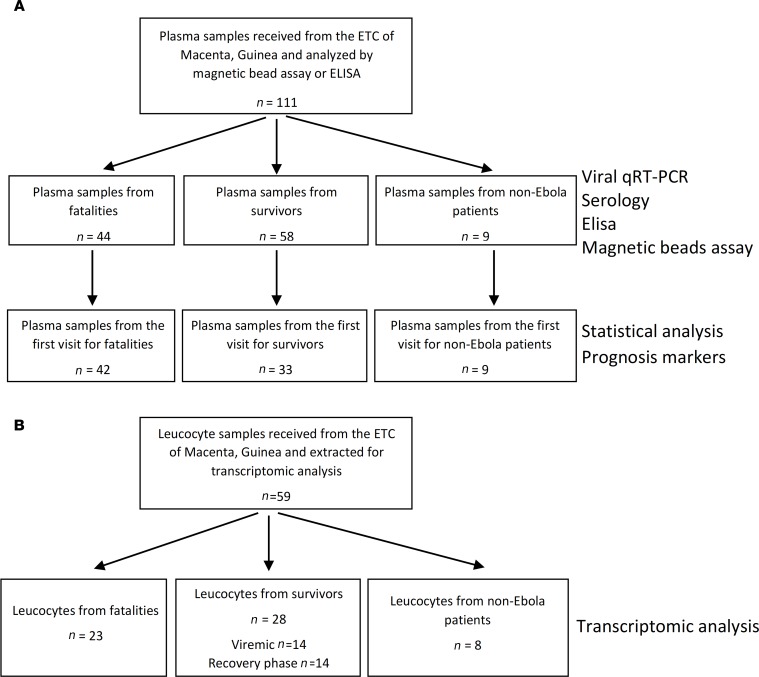
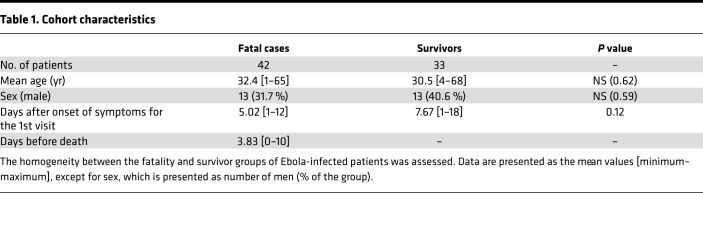
The study included 44 samples from 42 patients that succumbed to the disease and 58 samples from 33 survivors (Figure 1A), corresponding to a mortality rate of 56%, consistent with that observed during the epidemic (62%). There were no significant differences between the mean age, sex ratio, or time between the onset of symptoms and admission when comparing fatalities and survivors (Table 1). Only the first sample from each patient (obtained at admission) was further considered for statistical analysis to avoid introducing a bias from the varying number of samples between patients. Control samples were taken from 9 EBOV-negative patients (Figure 1A) and 8 healthy donors.
Figure 1. Presentation of the cohort.
(A) Plasma samples received from the Ebola treatment center of Macenta, Guinea, were assayed, and statistical analysis was performed using only the first sample from each patient. (B) RNA from leucocyte samples was extracted and used for microarrays assay.
Table 1. Cohort characteristics.
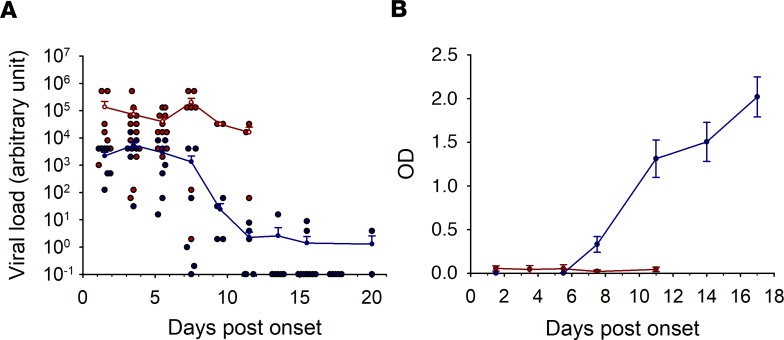
Viral loads are represented as arbitrary units, as they were evaluated in the field with a diagnostic method that did not provide a standard for absolute quantification (1). However, some samples for which sufficient quantity was available were tested by in-house RT-qPCR that included a standard RNA. Viral loads rose to 4 × 10⁹ copies RNA/ml, and the kinetic curves were comparable to those obtained with the commercial kit (Real-Star Filovirus Screen RT-PCR kit 1.0, Altona Diagnostics), despite the low number of samples tested (data not shown). High viral loads were observed in fatal cases until death, whereas viremia was lower in survivors and dropped around day 7 (Figure 2A).
Figure 2. Virological and serological parameters.
(A) Viral load was determined by RT-qPCR using the Real-Star Filovirus Screen RT-PCR kit 1.0 (Altona Diagnostics). Curves represent the mean values with standard error of the mean, and dots represent the individual values (red: fatal cases, n = 44; blue: survivors, n = 58). (B) IgG antibodies were assayed by ELISA. Results are presented as the mean of optical density (OD) with standard error bars (red: fatal cases, n = 26; blue: survivors, n = 50).
Survivors were characterized by efficient IgG antibody production beginning at day 7 after onset of symptoms, whereas no IgG was detectable in fatal cases during the disease (Figure 2B).
Activation of immune pathways.
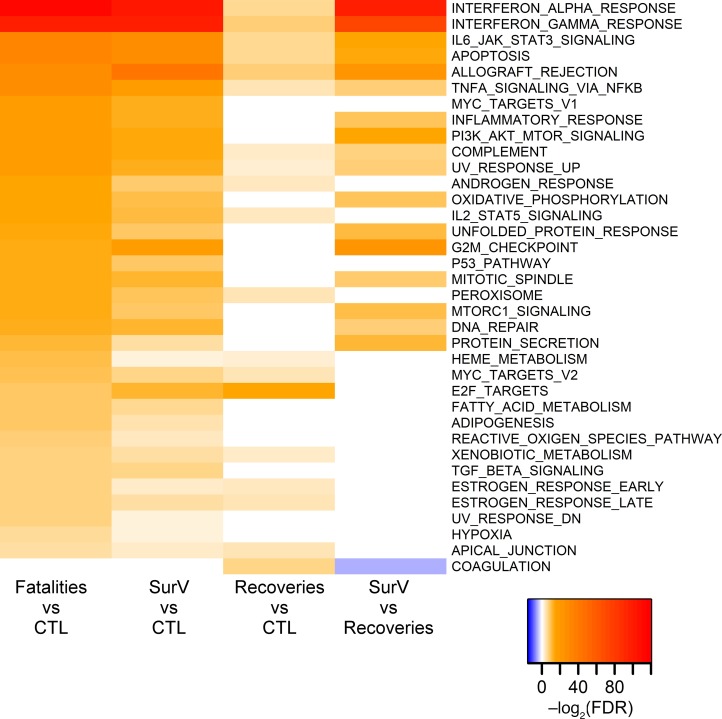
We used RNA from leucocytes to compare the activation of immune pathways between survivors and fatalities. RNA-chip experiments were performed on 59 samples and divided into 4 groups: nonhealthy controls, fatalities, viremic survivors, and survivors in recovery phase (Figure 1B). The activated pathways were quite similar between fatalities and viremic survivors relative to controls, but the regulation of these pathways was globally more intense in fatalities (Figure 3). Those that appeared to be the most highly upregulated were involved in the innate immune response and apoptosis.
Figure 3. Transcriptomic analysis was performed with RNA from leucocytes analyzed on RNA chips.
Pathway activation is represented. Upregulated pathways are in red and downregulated pathways are in blue. The color intensity represents the FDR value: intense color represents a highly significant value. Patients were divided into 4 groups: CTL (patients not infected by EBOV, n = 8), fatal cases (n = 23), SurV (viremic phase in patients who survived, n = 14), and recoveries (postviremic phase in patients who survived, n = 14).
Survivors in recovery phase and controls also showed a similar activation state. The differences were not highly marked except for the E2F target pathway, which may be important for DNA repair and remained consistently upregulated. Moreover, the coagulation pathway was upregulated only during the recovery phase of the disease (Figure 3).
Inflammatory response.
We quantified cytokines from the plasma of patients by ELISA and magnetic bead multiplex assays to further assess the responses.
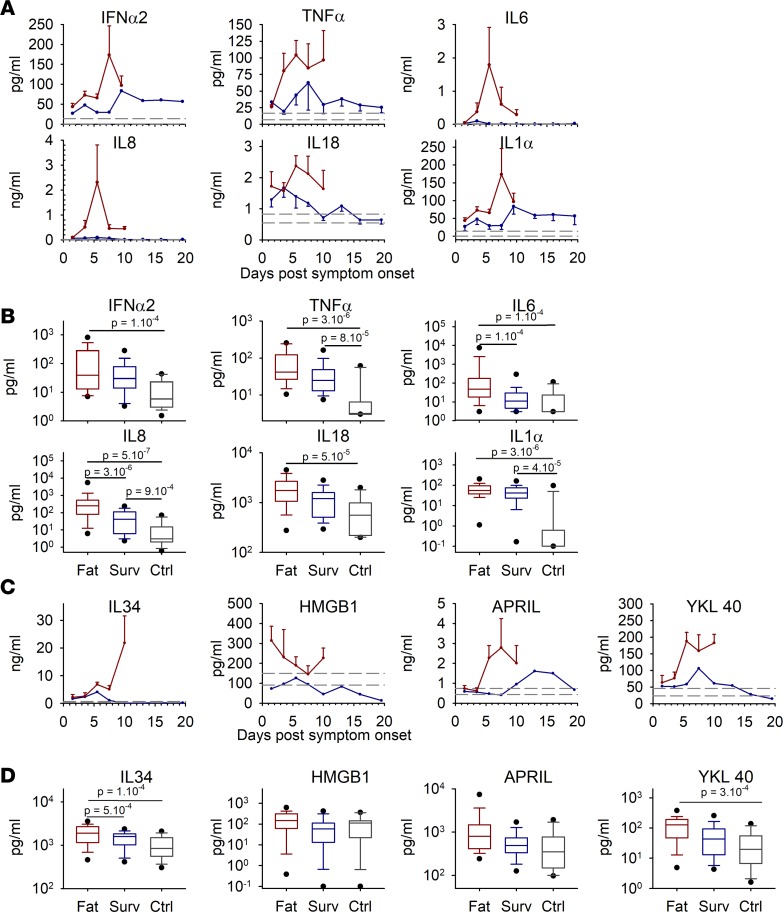
Fatal cases showed very high levels of proinflammatory cytokines, which peaked between 5 and 7 days after symptom onset and then decreased, except for TNF-α, which remained elevated. Survivors synthesized moderated levels of IFN-α2, TNF-α, IL-18, and IL-1α; very low levels of IL-8; and no IL-6. In addition, control patients showed lower levels of proinflammatory cytokines, even if 9 of 15 patients were nonhealthy (Figure 4A).
Figure 4. The proinflammatory response was evaluated in plasma samples by ELISA (IFN-α2 only) or magnetic bead multiplex assay.
(A) Kinetics are presented as mean values with standard error of the mean for each time point (red: fatal cases, n = 44; blue: survivors, n = 58). Dashed lines represent the mean value ± standard error of the mean of the controls (n = 15). (B) Box plots represent all time points combined for each group, with only the first sample for each patient analyzed. The boxes define the 25th and 75th percentiles, with a line at the median; error bars define the 10th and 90th percentile; and dots define the 5th and 95th percentile (fatal cases [Fat], n = 42; survivors [Surv], n = 33; controls [Ctrl], n = 15). The P values were determined by a Wilcoxon rank sum test and are indicated in the box plots. (C) Assay of cytokines with a role in the reinforcement of proinflammatory responses. Representation is the same as in A. (D) Box plots associated with the markers from C. Representation, samples, and statistical analysis are the same as in B.
To improve the differences observed, we combined all the time points in each group to perform a statistical analysis. The difference in proinflammatory cytokine levels between survivors and fatalities was only significant for IL-6 and IL-8, but differences were always significant between fatal cases and controls (Figure 4B).
Additional parameters involved in the inflammation process in humans were tested. We observed high expression of IL-34, HMGB1, APRIL, and YKL40 in fatal cases, whereas these mediators were only moderately synthesized in survivors (Figure 4C). The protein levels for IL-34 and YKL40 were significantly higher in fatal cases than in controls and, for IL-34, the difference was also significant between fatalities and survivors (Figure 4D).
Antiinflammatory response.
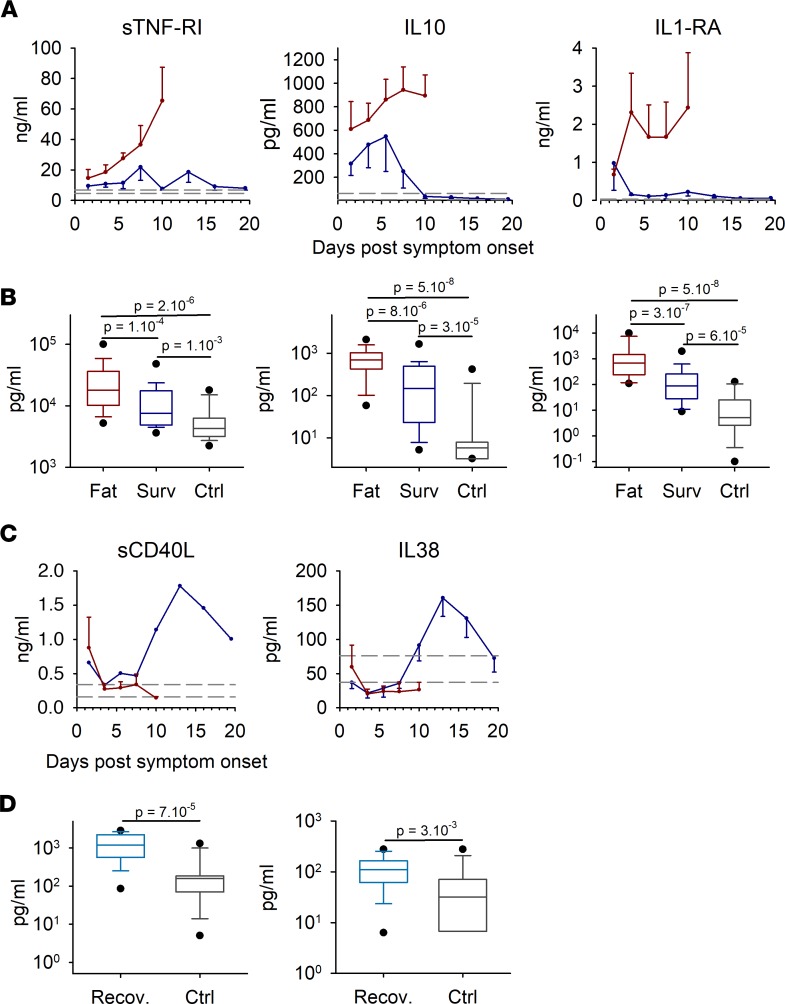
The massive inflammatory response previously observed in fatal cases was also accompanied by the release of large amounts of antiinflammatory cytokines until death, particularly sTNF-RI, IL-10, and IL-1RA (Figure 5A). In survivors, this release was moderate, and it was very low in control patients. The differences observed were highly significant between all groups (Figure 5B). Interestingly, levels of IL-38 and sCD40L were higher or similar in controls than in Ebola patients during the acute phase of the disease but were strongly increased in survivors from day 7 (Figure 5C). We focused on this recovery phase of the disease and found that the difference was significant between survivors and control patients (Figure 5D).
Figure 5. Antiinflammatory cytokines were assayed using magnetic bead multiplex panels.
(A) Data are presented using the same representation as in Figure 4A with fatal cases (n = 44), survivors (n = 58), and controls (n = 15). (B) The box plots represent all time points combined for each group, with only the first sample for each patient analyzed, as in Figure 4, B and D (fatal cases [Fat], n = 42; survivors [Surv], n = 33; controls [Ctrl], n = 15). The boxes define the 25th and 75th percentiles, with a line at the median; errors bars define the 10th and 90th percentile; and dots define the 5th and 95th percentile. The P values were determined by a Wilcoxon rank-sum test and are indicated in the box plots. (C) Antiinflammatory cytokines involved in the recovery phase in survivors. Representation is the same as in A. (D) Samples obtained from survivors after day 12 after onset of symptoms were compared with controls using a Wilcoxon rank sum test and presented as box plots, as in B. The light blue box represents samples from survivors between days 12 and 21, during the recovery period (n = 23), and the gray box represents controls (n = 15)
Chemokine expression.
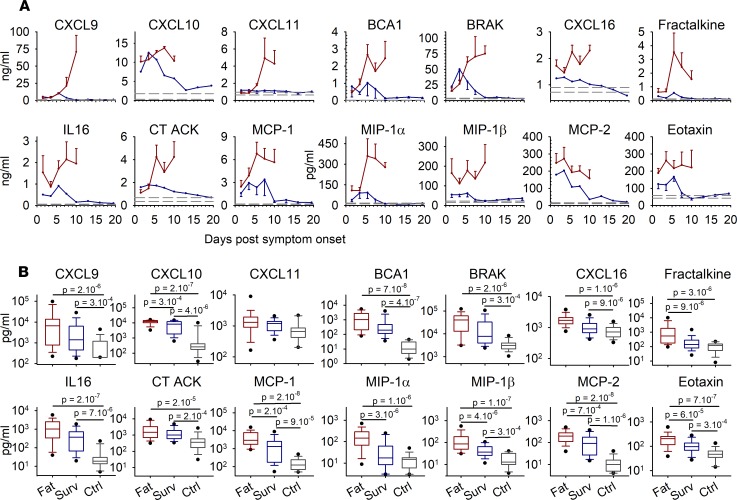
Numerous chemokines were also tested. They were overexpressed in fatal cases, and levels rose until death for most of them. In survivors, the levels were moderate but were higher than in controls during the first days of the disease, except for CXCL10 and, to a lesser extent, MCP-2 and BRAK, which were highly synthesized until day 10 (Figure 6A).
Figure 6. Chemokines expressed in plasma samples were assayed using multiplex bead panels, as in Figures 4 and 5.
(A) Kinetics are presented as mean values with standard error of the mean for each time point, as in Figure 4, A and C, and Figure 5, A and C, with fatal cases (n = 44), survivors (n = 58), and controls (n = 15). (B) The box plots represent all time points combined for each group, with only the first sample for each patient analyzed, as in Figure 4, B and D, and Figure 5B (fatal cases [Fat], n = 42; survivors [Surv], n = 33; controls [Ctrl], n = 15). The boxes define the 25th and 75th percentiles, with a line at the median; errors bars define the 10th and 90th percentile; and dots define the 5th and 95th percentile. The P values were determined by a Wilcoxon rank-sum test and are indicated in the box plots.
The differences observed were always significant between fatalities and control patients, except for those for CXCL11, and they were also significant between survivors and controls for most of the measured parameter. Half of the parameters tested were also significantly increased in fatalities when compared with survivors (Figure 6B).
Cytotoxic T cell response.
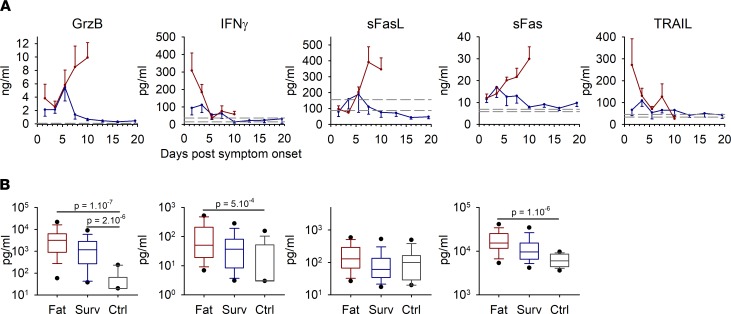
T cell activity was evaluated by measuring the levels of soluble cytotoxic molecules. Granzyme B levels were very high in fatal cases and rose until death, whereas only a peak of synthesis was observed in survivors around day 5 (Figure 7A). sFas and sFasL both rose until death in fatal outcomes, but only low levels were expressed in survivors. Fatal cases also expressed IFN-γ and TRAIL during the first days after symptom onset. However, the differences observed in cytotoxic molecules were not significant between fatalities and survivors. When fatalities were compared with controls, cytotoxic molecules were significantly overexpressed, except for sFasL, while when survivors and controls were compared, only granzyme B levels were significantly increased (Figure 7B).
Figure 7. Soluble forms of cytotoxic molecules involved in T cell response were assayed using magnetic bead multiplex panels.
(A) Samples were analyzed, and data are presented as in Figure 4, A and C; Figure 5, A and C; and Figure 6A, with fatal cases (n = 44), survivors (n = 58), and controls (n = 15). (B) The box plots represent all time points combined for each group, with only the first sample for each patient analyzed, as in Figure 4, B and D; Figure 5B; and Figure 6A (fatal cases [Fat], n = 42; survivors [Surv], n = 33; controls [Ctrl], n = 15). The boxes define the 25th and 75th percentiles, with a line at the median; errors bars define the 10th and 90th percentile; and dots define the 5th and 95th percentile. The P values were determined by a Wilcoxon rank-sum test and are indicated in the box plots.
Cytokine expression correlates with disease severity.
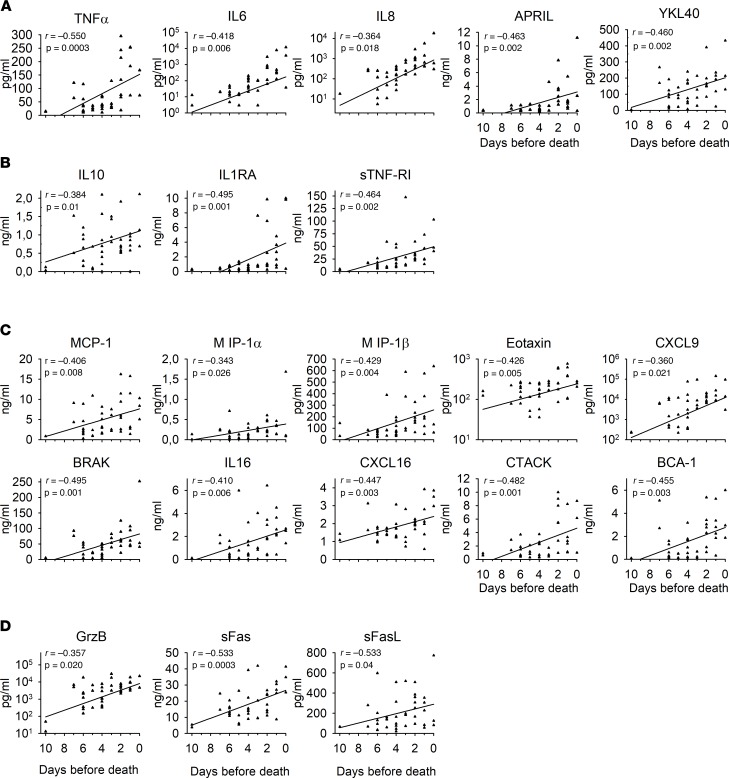
Cytokines and chemokines were dysregulated in fatal cases, regardless of their immunological function. We plotted the values measured in patients in relation to the number of days before death and observed that cytokine levels rose until death, with a highly significant correlation between levels and the day before death for most parameters (Figure 8).
Figure 8. The results obtained from fatal human cases (n = 44) were plotted using the day before death as the time line.
Regression lines were calculated. The Pearson correlation coefficient and associated P values were determined using a Pearson correlation test and are indicated in the plots. (A) Proinflammatory response. (B) Antiinflammatory response. (C) Chemokine expression. (D) Cytotoxic molecule secretion.
A cytokine panel to predict the outcome.
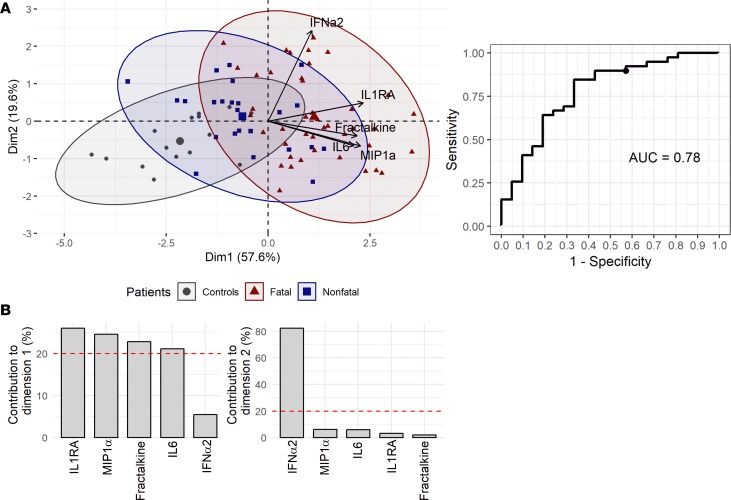
We aimed to define an easily assayable cytokine panel that could confidently predict the outcome. The analysis was performed using samples from survivors until day 12 after onset of symptoms, so that values could be compared with fatal cases. The selection was made using gg-LASSO and a set of 5 cytokines was obtained: IL-1RA, MIP1α, fractalkine, IL-6, and IFN-α2. Principal component analysis (PCA) representation showed that EBOV-infected patients were clearly distinct from non-EBOV controls, with the group of fatal cases being most distant (Figure 9A).
Figure 9. Cytokines associated with outcome.
The cytokine values were tested for their ability to predict outcome: the molecules of interest were determined using gg-LASSO analysis. (A) Principal component analysis using the 5 proteins of interest. (B) Receiver operating characteristic curve, representing the specificity and sensitivity of the protein panel to predict outcome.
We calculated a ROC curve to evaluate the specificity and sensitivity of this cytokine set as a prognostic tool. The prognosis rate obtained with the panel of cytokines was 78% (Figure 9B).
Discussion
The aim of this study was to analyze immune response parameters in a cohort of EBOV-infected patients from Guinea to better understand the pathogenic mechanisms that lead to survival or death during EVD. The supportive care provided to patients in the ETC was previously described (1), and no experimental antiviral therapy was used at this time. The delay between symptom onset and admission in the ETC tended to be lower for fatal cases, even if the difference was not significant (mean 5.02 vs. 7.67 days). The severity of the disease in these patients is likely the reason for their seeking earlier care. Indeed, patients came for treatment during the acute phase of the illness, as they died a few days after admission (mean 3.83 days). These characteristics are consistent with those from an ETC in Conakry, Guinea (24). Fatal cases showed higher viral loads and no antibody response, whereas survivors synthesized specific EBOV-IgG from day 7, which coincided with a drop in viremia, in accordance with data from various epidemics (1, 6).
We performed transcriptomic analysis of white blood cells to explore immune responses, depending on the outcome. Pathway analysis did not reveal any inhibition of the immune system, but rather a statistically significant upregulation of multiple pathways involved in the innate immune response. Numerous innate immune pathways were much more consistently upregulated in fatalities than in survivors. In addition, the level of activation of these pathways in patients who did not present any remaining viremia has already returned to lower levels at this time, except for the coagulation pathway and the E2F target pathway involved in DNA repair. This could be important for the repair of lesions caused by EBOV infection, although it is unknown whether EVD survivors harbor such lesions.
We also characterized the mediators involved by measuring numerous cytokines and chemokines acting on several immune functions: proinflammatory and antiinflammatory responses, chemokine signalization, and cytotoxic T cell responses. In survivors, the expression of all of the molecules tested was transitory, with some synthesized at high levels for only a few days. Another study did not report any peak of cytokine expression in survivors when the date after admission was used as time line, suggesting that patients came at the peak of the illness (25). Interestingly, IL-38 and sCD40L levels were elevated in survivors from day 7, the day that viremia dropped. IL-38 is involved in the regulation of inflammatory and immune responses (26). Thus, its overexpression during the recovery phase could be linked to the control of the immune response after the disappearance of viremia. sCD40L expression can be linked with that of the nonsoluble form, which is expressed on T cells and activated platelets. It promotes inflammatory responses and induces a procoagulant activity (27, 28). Its expression during recovery may be associated with the activation of the coagulation pathway described above and thus may be involved in the restoration of vascular integrity, as EBOV infection causes vascular leakage (29). Interestingly, the pattern of cytokine expression in survivors was distinct from that of controls. Nine control samples in fifteen were unhealthy patients who came to the ETC for an EBOV diagnosis, but were negative for EBOV. Their immune pattern was not comparable with that of EBOV infected patients, highlighting the specificity of the immune response in EVD.
In fatalities, overexpression of numerous cytokines and chemokines was observed, regardless of their functions. This unbalanced immune response is associated with a poor prognosis and has been described for various epidemics and defined as a cytokine storm (7, 8, 16, 25, 30, 31). In our study, chemokine expression was the most highly dysregulated, as chemokines were released in very large amounts in fatalities. This observation suggests that a “chemokine storm” is induced during EBOV infection. DCs and macrophages support the replication of EBOV in the early stages of infection and are believed to act as vehicles for the virus and to be responsible for dissemination of the infection in many organs (32, 33). The “chemokine storm” could play an important role in tissue damage, as the recruitment of leukocytes to the site of inflammation is mediated by chemokines. These cells adhere to the vascular endothelium before they cross the junctional space in the endothelium. The permeability of the vascular endothelium, which allows the migration of leukocytes, may be in part responsible for the vascular leakage observed in EVD. Leukocytes are then guided through the tissue by a chemoattractant gradient. Upon arriving at the site of inflammation, the cells are stimulated by the chemokines to activate their effector functions and release cytotoxic molecules, such as granzyme or perforin by NK or T cells or oxidizing compounds by neutrophils (34). In addition, chemokines perpetuate the inflammatory reaction by promoting the synthesis of inflammatory cytokines, such as IL-1, IL-6, or TNF-α (34). Altogether, the intense viral replication that takes place in the early stages of the disease could be the starting point of an unbalanced inflammatory response. The damage caused by the virus is then replaced by that caused by the cytokines and chemokines themselves. The massive apoptosis affecting lymphocytes participates in the loss of spleen and lymph node architecture (11). Necrotic foci are observed throughout the infected organs (35) and result in amplification of inflammation at the sites of infection, with the recruitment of additional leucocytes and impairment of the vascular endothelium. Together, this could activate a cascade of events, leading to the dramatic overexpression of cytokines and chemokines and the recruitment of monocytes, macrophages, and neutrophils to the site. Moreover, a decreased liver function disrupts the homeostasis of coagulation. This may result in the organ failure, hypotensive and hypovolemic shock, and disseminated hemorrhaging, hallmarks of severe EVD (29).
The level of many cytokines increased continuously during the illness, as has also been demonstrated in another study during the same epidemic (25). Our data were based on individual values instead of a kinetic study of each patient. However, our results tend to demonstrate an increase of the mediator levels during illness progression. The values correlated with the day of death, strongly evoking a septic shock like syndrome (36, 37), as previously suggested (18, 38). A recent study showed a correlation between the concentration of PD-1 and outcome in Ebola-infected patients (23). PD-1 expression in monocytes has also been linked with a greater mortality in patients with severe sepsis (39, 40). Interestingly, we found here that cytokines defined as strong markers of sepsis, primarily TNF-α, IL-6, IL-8, IL-10, IL-1, IFN-γ, and MCP1 (36, 37), were overexpressed in fatal EVD, and the levels of most increased until death. We also observed high levels of several other molecules released during sepsis. YKL 40, secreted by macrophages, was one of them and has been defined as a biomarker of sepsis and to be of importance in the physiopathology of this syndrome (41). Another molecule involved in sepsis is HMGB1, an inflammatory mediator released by activated immune cells and necrotic tissue and that activates TLR4 (42–44). In our cohort, HMGB1, a damage-associated molecular pattern (DAMP), was also highly expressed during the first days of symptoms. This mediator, together with shed GP, activated TLR4 (42, 45, 46) and may lead to a dramatic triggering of this pattern recognition receptor (PRR). Therefore, DAMP expression, associated with sepsis severity and the dysregulation of coagulation (47), may also be associated with tissue damage in EVD, leading to disseminated intravascular coagulation (48). Together, these results suggest that the pathogenic cascade that ultimately leads to terminal shock and death during EVD closely resembles septic shock syndrome.
On the contrary, we never observed such a dysregulated response in survivors. Whether the moderated viral load in these patients is responsible for the lower activation of PRR, leading to a well-balanced immune response, or if an early and efficient immune response allows a well-regulated activation of PRR, enabling the control of viral replication is not well understood. Unfortunately, patient follow-up was begun too late to assess this question. Animal experiments in nonhuman primates (NHPs) did not answer this question, because the model of EBOV infection is fully lethal. However, NHPs could be more resistant to the infection depending on the species or the geographical origin and survival cases were observed with fewer pathogenic isolates (49). Maybe these models could be used to study the earliest mechanisms of pathogenicity in survivors. Lower viral loads could result in a lower burden of pathogen-associated molecular patterns, such as double-stranded RNAs (50, 51) and shed viral GP (42, 45).
Overall, these data highlight the importance of treating the shock syndrome in severe EVD. Volume resuscitation accompanied by inotropic support and blood transfusion is still currently the only efficient supportive treatment for sepsis, along with high-quality intensive care (52, 53). Patients with EVD may benefit from such a treatment during the shock phase. The lower mortality rate observed for EVD patients treated in intensive care units in Northern countries compared with that observed for patients admitted to ETCs is consistent with this hypothesis. However, such support is difficult to provide in the field.
We performed statistical analyses to define a panel of cytokines that can confidently predict outcome. We found a panel of 5 cytokines to be highly predictive of outcome. These molecules are easily assayable, even in the field. Thus, we propose a highly reliable panel of prognostic markers in association with viral load and biochemical results to distinguish fatal from nonfatal cases (1) or define, in the very first days, the patients who would need intensive care support.
Overall, the hypothesis that emerges from our study is that the high viral load could be responsible for the dysregulated immune response observed in fatal EVD. Indeed, uncontrolled and massive viral replication probably leads to dramatic levels of pathogen-associated molecular patterns that result in extensive activation of PRR. The infection is also responsible for extensive apoptosis and necrotic foci, leading to the secretion of DAMPs and further activation of PRR. Together, this results in overstimulation of PRR and in a dramatic release of inflammatory mediators that contribute to the recruitment of cytotoxic cells, tissue damages, vascular leakage, and, finally, multivisceral failure, terminal shock, and death.
Here, we determined the kinetics of the immune responses in fatal and nonfatal outcomes and described the molecular events leading to the final shock, mainly due to an inappropriate immune response that is deleterious for the organism. This response is highly similar to that observed in sepsis and demonstrates the absolute necessity for intense supportive care in addition to specific treatments like antiviral molecules. This could help to reduce the immune dysregulation that could be a major factor of pathogenicity. Moreover, it would be pertinent to add another arm in the care of patients, aiming at limiting the intensity of PRR activation and consequently the exacerbated release of inflammatory mediators and chemokines.
Methods
Human samples.
Blood samples were taken from patients admitted to the ETC in Macenta, Guinea. Patient information was collected by the medical staff. Diagnosis was performed in the field, and plasma samples were frozen at –40°C and sent to Jean Merieux-Inserm BSL4 Laboratory, Lyon, France. Control samples were taken from 9 nonhealthy EBOV-negative patients admitted to the ETC and 6 healthy donors from the Etablissement Français du Sang.
Viral loads.
Viral loads were evaluated in the field with the Real-Star Filovirus Screen RT-PCR kit 1.0 (Altona Diagnostics), according to the manufacturer’s instructions. The results, obtained as Ct values, were transformed into arbitrary units relative to 100% efficacy, as described previously (1).
Detection of EBOV-specific IgG.
Antibody titers were determined by ELISA. Briefly, wells of a microtiter plate were coated with homemade antigens (Zaire ebolavirus, strain Gabon 2001) overnight. Samples were diluted 1:150 and incubated for 1 hour at 37°C before a final 1-hour incubation with anti-human IgG conjugated with peroxidase. Optical density was measured after incubation with the chromogenic substrate TMB. Results were calculated as the mean of two duplicates, taking account of nonspecific signals for control antigens.
Transcriptomic analysis.
Blood samples from patients were treated twice with ACK lysis buffer for 8 minutes, with centrifugation steps to collect leukocytes. Cell pellets were stored at –40°C in a few microliters of ACK buffer before their transfer to the BSL4 laboratory. Trizol RNA extraction was performed according to the manufacturer’s instructions (Life Technologies). RNA was triple amplified and converted into ss-cDNA using the ExpressArt Trinucleotide mRNA amplification Pico kit (AmpTec) and GeneChip WT Plus Reagent kit (Affymetrix). Samples were loaded on Human Gene ST 2.0 chips (Affymetrix) for expression profiling, and the analysis was performed after interchip RMA normalization (54). Differential expression was determined using R version 3.4.3 and the limma package version 3.34.6 (55), and pathway analysis was performed using the camera method (competitive gene set test accounting for intergene correlation, ref. 56). A total of 59 samples were analyzed, including 23 from fatal cases, 14 from survivors with viremia, 14 from survivors during the recovery phase (cycle threshold ≥30 with Ebola RT-PCR), and 8 from nonhealthy controls (Figure 1B). Data are available at GEO (accession GSE122692).
IFN-α ELISA.
Human IFN-α2 was detected by ELISA in the BSL4 laboratory using matched paired antibodies and standard protein (Human IFN-α matched antibody pairs, BMS216MST, eBioscience) according to the manufacturer’s instructions.
Cytokine/chemokine multiplex assays.
In the BSL4 laboratory, 96 parameters were analyzed in plasma samples using magnetic bead assays: the Human premixed Multi-Analyte kit (R&D Systems) and Human Cytokine/Chemokine Magnetic Bead Panels (Merck). Plates were prepared according to the manufacturers’ recommendations and read on a Magpix instrument (Merck).
Statistics.
Clinical data were compared using the χ² test for binary traits and the 2-tailed t test or Wilcoxon signed rank sum test for continuous data. Mean and standard error of the mean were calculated at each time point and longitudinally represented. Protein levels obtained during the first visit, whatever the day after onset of symptoms, were compared between the 3 different groups (controls, fatal, and surviving patients) using the Wilcoxon rank sum test, except for IL-38 and sCD40L levels, for which the expression level in survivors was considered only after day 12 (recovery phase). P values of less than 0.05 were considered significant.
To select a predictive set of proteins, only data before day 12 were analyzed, and protein levels were log transformed. The selection of a set of proteins predictive of the outcome was performed by using group least absolute shrinkage and selection operator (gg-LASSO) (57, 58), a penalized regression method, after multiple imputation using chained equations to address missing data for variable selection (5 imputations). This method requires selection of a penalty term, selected in this analysis by a 5-fold cross-validation. Proteins selected by gg-LASSO have non-null coefficient for each imputation.
By using logistic regression coefficients and leave-one-out cross-validation on proteins with non-null coefficient, the predicted risk for death for each patient was calculated. We summarized the predictive value of the model by calculating the area under the receiver operating curve (AUROC). A principal component analysis was performed to summarize the information contained in the data from this model by reducing the dimensionality of this data and adding controls patients.
Statistical analyses were performed with R 3.4.3 software. Principal component analysis was performed using the factoextra package and R software and the ROC and AUROC using the plotROC R-package (59).
Study approval.
Patient samples were sent from Guinea to the BSL4 laboratory, with the approval of the Guinean Comité National d’Ethique pour la Recherche en Santé (070/CNERS/15; Conakry, Guinea), the French Commission Nationale Informatique et Liberté (DR-2016-085; Paris, France), and the Clinical Research Committee of Institut Pasteur (2015-16; Paris, France).
Author contributions
SR performed the experiments, analyzed the data, and wrote the manuscript. AJ, JS, MM, and NB performed some experiments and JS created one of the figures. EG, JM, and CL were in charge of the statistical analysis. HV and NP performed the transcriptomic data analyses. HR is the director of the BSL4 laboratory where the experiments were performed. SB is the principal investigator of this study.
Acknowledgments
Experiments were carried out in the Jean Merieux-Inserm BSL4 Laboratory. We thank the Etablissement Français du Sang for providing blood from healthy donors and ViroScan 3D for performing the RNA-chip experiments. The work in the field was supported by funding from the French Ministry of Foreign Affairs, the Agence Française de Développement, and the Institut Pasteur. We thank the Guinean Health Authorities in Conakry and Macenta and, particularly, S. Keita and L. Koivogui. We thank the French Embassy in Conakry for its help and, in particular, B. Cochery, R. Migliani, O. Buchbinder, R. Devouge, and P. Gibelot. We thank C. Taron-Brocard and C. Schmit of the French Ministry of Foreign Affairs. We are also particularly grateful to all the staff who worked in the Laboratoire Pasteur du CTE de Macenta from November 2014 to December 2015, including M.-A. Vernet, P. Lecine, D. Pannetier, M. Poivogui, and T.M. Tchamdja and N. Gangneux who helped transport samples. We thank the medical staff of the ETC, particularly M. Rives, N. Georges, N. Garcia-Bonnet, A.I. Sylla, P. Grovogui, J.-Y. Kerheve, F. L’Hériteau, C. Longuet, C. Savio, S. Savio-Coste, M.-L. de Séverac, P. Zloczewski, and S. Linares. We are also grateful to S. Harouna, B. M’Lebing Abdoul, F. Petitjean, N. Samake, S. Shepherd, M. Kinda, F.R. Koundouno, L. Joxe, and S. Barbe from ALIMA and B. Simon and T. Tran-Minh from the French Red Cross. We thank Z. Koivogui, M. Keita, S. Berete, C.M. Loua, R. Lolamou, A. Soumah, S. Condé, and M. Condé for their involvement in the collection of samples and data and care of the patients. We thank the French Red Cross staff of Paris, Conakry, and Macenta for logistic support. Finally, we thank C. Batejat from the Environment and Infectious Risk Unit, Institut Pasteur, for training staff; M. Jouan, A. Granier-Blanc, K. Victoir, and M. Rabenoro from the International Division, Institut Pasteur; and C. Rousseau from the Purchase Department, Institut Pasteur.
Version 1. 01/10/2019
Electronic publication
Footnotes
Conflict of interest: The authors have declared that no conflict of interest exists.
License: Copyright 2019, American Society for Clinical Investigation.
Reference information: JCI Insight. 2019;4(1):e125106. https://doi.org/10.1172/jci.insight.125106.
Contributor Information
Stéphanie Reynard, Email: stephanie.reynard@pasteur.fr.
Alexandra Journeaux, Email: afizet@pasteur.fr.
Emilie Gloaguen, Email: emilie.gloaguen@inserm.fr.
Justine Schaeffer, Email: justine.schaeffer@pasteur.fr.
Hugo Varet, Email: hugo.varet@pasteur.fr.
Natalia Pietrosemoli, Email: natalia.pietrosemoli@pasteur.fr.
Mathieu Mateo, Email: mathieu.mateo@pasteur.fr.
Nicolas Baillet, Email: nicolas.baillet@pasteur.fr.
Jimmy Mullaert, Email: jimmy.mullaert@inserm.fr.
Sylvain Baize, Email: sylvain.baize@pasteur.fr.
References
- 1.Vernet MA, et al. Clinical, virological, and biological parameters associated with outcomes of Ebola virus infection in Macenta, Guinea. JCI Insight. 2017;2(6):e88864. doi: 10.1172/jci.insight.88864. [DOI] [PMC free article] [PubMed] [Google Scholar]
- 2.Hunt L, et al. Clinical presentation, biochemical, and haematological parameters and their association with outcome in patients with Ebola virus disease: an observational cohort study. Lancet Infect Dis. 2015;15(11):1292–1299. doi: 10.1016/S1473-3099(15)00144-9. [DOI] [PubMed] [Google Scholar]
- 3.Cournac JM, et al. Rhabdomyolysis in Ebola Virus Disease. Results of an Observational Study in a Treatment Center in Guinea. Clin Infect Dis. 2016;62(1):19–23. doi: 10.1093/cid/civ779. [DOI] [PubMed] [Google Scholar]
- 4.Rollin PE, Bausch DG, Sanchez A. Blood chemistry measurements and D-Dimer levels associated with fatal and nonfatal outcomes in humans infected with Sudan Ebola virus. J Infect Dis. 2007;196 Suppl 2:S364–S371. doi: 10.1086/520613. [DOI] [PubMed] [Google Scholar]
- 5.Schieffelin JS, et al. Clinical illness and outcomes in patients with Ebola in Sierra Leone. N Engl J Med. 2014;371(22):2092–2100. doi: 10.1056/NEJMoa1411680. [DOI] [PMC free article] [PubMed] [Google Scholar]
- 6.Baize S, et al. Defective humoral responses and extensive intravascular apoptosis are associated with fatal outcome in Ebola virus-infected patients. Nat Med. 1999;5(4):423–426. doi: 10.1038/7422. [DOI] [PubMed] [Google Scholar]
- 7.Baize S, et al. Inflammatory responses in Ebola virus-infected patients. Clin Exp Immunol. 2002;128(1):163–168. doi: 10.1046/j.1365-2249.2002.01800.x. [DOI] [PMC free article] [PubMed] [Google Scholar]
- 8.Villinger F, et al. Markedly elevated levels of interferon (IFN)-gamma, IFN-alpha, interleukin (IL)-2, IL-10, and tumor necrosis factor-alpha associated with fatal Ebola virus infection. J Infect Dis. 1999;179 Suppl 1:S188–S191. doi: 10.1086/514283. [DOI] [PubMed] [Google Scholar]
- 9.Sanchez A, et al. Analysis of human peripheral blood samples from fatal and nonfatal cases of Ebola (Sudan) hemorrhagic fever: cellular responses, virus load, and nitric oxide levels. J Virol. 2004;78(19):10370–10377. doi: 10.1128/JVI.78.19.10370-10377.2004. [DOI] [PMC free article] [PubMed] [Google Scholar]
- 10.Baskerville A, Bowen ET, Platt GS, McArdell LB, Simpson DI. The pathology of experimental Ebola virus infection in monkeys. J Pathol. 1978;125(3):131–138. doi: 10.1002/path.1711250303. [DOI] [PubMed] [Google Scholar]
- 11.Geisbert TW, et al. Pathogenesis of Ebola hemorrhagic fever in cynomolgus macaques: evidence that dendritic cells are early and sustained targets of infection. Am J Pathol. 2003;163(6):2347–2370. doi: 10.1016/S0002-9440(10)63591-2. [DOI] [PMC free article] [PubMed] [Google Scholar]
- 12.Formenty P, Hatz C, Le Guenno B, Stoll A, Rogenmoser P, Widmer A. Human infection due to Ebola virus, subtype Côte d’Ivoire: clinical and biologic presentation. J Infect Dis. 1999;179 Suppl 1:S48–S53. doi: 10.1086/514285. [DOI] [PubMed] [Google Scholar]
- 13.Bosio CM, et al. Ebola and Marburg viruses replicate in monocyte-derived dendritic cells without inducing the production of cytokines and full maturation. J Infect Dis. 2003;188(11):1630–1638. doi: 10.1086/379199. [DOI] [PubMed] [Google Scholar]
- 14.Mahanty S, Hutchinson K, Agarwal S, McRae M, Rollin PE, Pulendran B. Cutting edge: impairment of dendritic cells and adaptive immunity by Ebola and Lassa viruses. J Immunol. 2003;170(6):2797–2801. doi: 10.4049/jimmunol.170.6.2797. [DOI] [PubMed] [Google Scholar]
- 15.Olejnik J, et al. Ebolaviruses associated with differential pathogenicity induce distinct host responses in human macrophages. J Virol. 2017;91(11):e00179-17. doi: 10.1128/JVI.00179-17. [DOI] [PMC free article] [PubMed] [Google Scholar]
- 16.Wauquier N, Becquart P, Padilla C, Baize S, Leroy EM. Human fatal zaire Ebola virus infection is associated with an aberrant innate immunity and with massive lymphocyte apoptosis. PLoS Negl Trop Dis. 2010;4(10):e837. doi: 10.1371/journal.pntd.0000837. [DOI] [PMC free article] [PubMed] [Google Scholar]
- 17.Geisbert TW, Hensley LE, Gibb TR, Steele KE, Jaax NK, Jahrling PB. Apoptosis induced in vitro and in vivo during infection by Ebola and Marburg viruses. Lab Invest. 2000;80(2):171–186. doi: 10.1038/labinvest.3780021. [DOI] [PubMed] [Google Scholar]
- 18.Ebihara H, et al. Host response dynamics following lethal infection of rhesus macaques with Zaire ebolavirus. J Infect Dis. 2011;204 Suppl 3:S991–S999. doi: 10.1093/infdis/jir336. [DOI] [PMC free article] [PubMed] [Google Scholar]
- 19.Baize S, Leroy EM, Mavoungou E, Fisher-Hoch SP. Apoptosis in fatal Ebola infection. Does the virus toll the bell for immune system? Apoptosis. 2000;5(1):5–7. doi: 10.1023/A:1009657006550. [DOI] [PubMed] [Google Scholar]
- 20.Reed DS, Hensley LE, Geisbert JB, Jahrling PB, Geisbert TW. Depletion of peripheral blood T lymphocytes and NK cells during the course of ebola hemorrhagic Fever in cynomolgus macaques. Viral Immunol. 2004;17(3):390–400. doi: 10.1089/vim.2004.17.390. [DOI] [PubMed] [Google Scholar]
- 21.Leroy EM, Becquart P, Wauquier N, Baize S. Evidence for Ebola virus superantigen activity. J Virol. 2011;85(8):4041–4042. doi: 10.1128/JVI.00181-11. [DOI] [PMC free article] [PubMed] [Google Scholar]
- 22.Leroy EM, Baize S, Debre P, Lansoud-Soukate J, Mavoungou E. Early immune responses accompanying human asymptomatic Ebola infections. Clin Exp Immunol. 2001;124(3):453–460. doi: 10.1046/j.1365-2249.2001.01517.x. [DOI] [PMC free article] [PubMed] [Google Scholar]
- 23.Ruibal P, et al. Unique human immune signature of Ebola virus disease in Guinea. Nature. 2016;533(7601):100–104. doi: 10.1038/nature17949. [DOI] [PMC free article] [PubMed] [Google Scholar]
- 24.Bah EI, et al. Clinical presentation of patients with Ebola virus disease in Conakry, Guinea. N Engl J Med. 2015;372(1):40–47. doi: 10.1056/NEJMoa1411249. [DOI] [PubMed] [Google Scholar]
- 25.Kerber R, et al. Kinetics of soluble mediators of the host response in Ebola virus disease. J Infect Dis. 2018;218(suppl_5):S496–S503. doi: 10.1093/infdis/jiy429. [DOI] [PMC free article] [PubMed] [Google Scholar]
- 26.Yuan X, Peng X, Li Y, Li M. Role of IL-38 and its related cytokines in inflammation. Mediators Inflamm. 2015;2015:807976. doi: 10.1155/2015/807976. [DOI] [PMC free article] [PubMed] [Google Scholar]
- 27.Grewal IS, Flavell RA. The CD40 ligand. At the center of the immune universe? Immunol Res. 1997;16(1):59–70. doi: 10.1007/BF02786323. [DOI] [PubMed] [Google Scholar]
- 28.Mach F, Schönbeck U, Bonnefoy JY, Pober JS, Libby P. Activation of monocyte/macrophage functions related to acute atheroma complication by ligation of CD40: induction of collagenase, stromelysin, and tissue factor. Circulation. 1997;96(2):396–399. doi: 10.1161/01.CIR.96.2.396. [DOI] [PubMed] [Google Scholar]
- 29.Feldmann H, Geisbert TW. Ebola haemorrhagic fever. Lancet. 2011;377(9768):849–862. doi: 10.1016/S0140-6736(10)60667-8. [DOI] [PMC free article] [PubMed] [Google Scholar]
- 30.McElroy AK, et al. Ebola hemorrhagic Fever: novel biomarker correlates of clinical outcome. J Infect Dis. 2014;210(4):558–566. doi: 10.1093/infdis/jiu088. [DOI] [PMC free article] [PubMed] [Google Scholar]
- 31.Hutchinson KL, Rollin PE. Cytokine and chemokine expression in humans infected with Sudan Ebola virus. J Infect Dis. 2007;196 Suppl 2:S357–S363. doi: 10.1086/520611. [DOI] [PubMed] [Google Scholar]
- 32.Schnittler HJ, Feldmann H. Marburg and Ebola hemorrhagic fevers: does the primary course of infection depend on the accessibility of organ-specific macrophages? Clin Infect Dis. 1998;27(2):404–406. doi: 10.1086/517704. [DOI] [PubMed] [Google Scholar]
- 33.Geisbert TW, et al. Pathogenesis of Ebola hemorrhagic fever in primate models: evidence that hemorrhage is not a direct effect of virus-induced cytolysis of endothelial cells. Am J Pathol. 2003;163(6):2371–2382. doi: 10.1016/S0002-9440(10)63592-4. [DOI] [PMC free article] [PubMed] [Google Scholar]
- 34.Furie MB, Randolph GJ. Chemokines and tissue injury. Am J Pathol. 1995;146(6):1287–1301. [PMC free article] [PubMed] [Google Scholar]
- 35.Ryabchikova EI, Kolesnikova LV, Luchko SV. An analysis of features of pathogenesis in two animal models of Ebola virus infection. J Infect Dis. 1999;179 Suppl 1:S199–S202. doi: 10.1086/514293. [DOI] [PubMed] [Google Scholar]
- 36.Brown KA, Brown GA, Lewis SM, Beale R, Treacher DF. Targeting cytokines as a treatment for patients with sepsis: A lost cause or a strategy still worthy of pursuit? Int Immunopharmacol. 2016;36:291–299. doi: 10.1016/j.intimp.2016.04.041. [DOI] [PubMed] [Google Scholar]
- 37.Bozza FA, et al. Cytokine profiles as markers of disease severity in sepsis: a multiplex analysis. Crit Care. 2007;11(2):R49. doi: 10.1186/cc5783. [DOI] [PMC free article] [PubMed] [Google Scholar]
- 38.Bray M, Mahanty S. Ebola hemorrhagic fever and septic shock. J Infect Dis. 2003;188(11):1613–1617. doi: 10.1086/379727. [DOI] [PubMed] [Google Scholar]
- 39.Guignant C, et al. Programmed death-1 levels correlate with increased mortality, nosocomial infection and immune dysfunctions in septic shock patients. Crit Care. 2011;15(2):R99. doi: 10.1186/cc10112. [DOI] [PMC free article] [PubMed] [Google Scholar]
- 40.Shao R, Fang Y, Yu H, Zhao L, Jiang Z, Li CS. Monocyte programmed death ligand-1 expression after 3-4 days of sepsis is associated with risk stratification and mortality in septic patients: a prospective cohort study. Crit Care. 2016;20(1):124. doi: 10.1186/s13054-016-1301-x. [DOI] [PMC free article] [PubMed] [Google Scholar]
- 41.Hattori N, et al. YKL-40 identified by proteomic analysis as a biomarker of sepsis. Shock. 2009;32(4):393–400. doi: 10.1097/SHK.0b013e31819e2c0c. [DOI] [PubMed] [Google Scholar]
- 42.Escudero-Pérez B, Volchkova VA, Dolnik O, Lawrence P, Volchkov VE. Shed GP of Ebola virus triggers immune activation and increased vascular permeability. PLoS Pathog. 2014;10(11):e1004509. doi: 10.1371/journal.ppat.1004509. [DOI] [PMC free article] [PubMed] [Google Scholar]
- 43.Stevens NE, Chapman MJ, Fraser CK, Kuchel TR, Hayball JD, Diener KR. Therapeutic targeting of HMGB1 during experimental sepsis modulates the inflammatory cytokine profile to one associated with improved clinical outcomes. Sci Rep. 2017;7(1):5850. doi: 10.1038/s41598-017-06205-z. [DOI] [PMC free article] [PubMed] [Google Scholar]
- 44.Bell CW, Jiang W, Reich CF, Pisetsky DS. The extracellular release of HMGB1 during apoptotic cell death. Am J Physiol, Cell Physiol. 2006;291(6):C1318–C1325. doi: 10.1152/ajpcell.00616.2005. [DOI] [PubMed] [Google Scholar]
- 45.Younan P, Ramanathan P, Graber J, Gusovsky F, Bukreyev A. The Toll-like receptor 4 antagonist eritoran protects mice from lethal filovirus challenge. MBio. 2017;8(2):e00226-17. doi: 10.1128/mBio.00226-17. [DOI] [PMC free article] [PubMed] [Google Scholar]
- 46.Iampietro M, Santos RI, Lubaki NM, Bukreyev A. Ebola virus shed glycoprotein triggers differentiation, infection, and death of monocytes through Toll-like receptor 4 activation. J Infect Dis. 2018;218(suppl_5):S327–S334. doi: 10.1093/infdis/jiy406. [DOI] [PMC free article] [PubMed] [Google Scholar]
- 47.Chan JK, et al. Alarmins: awaiting a clinical response. J Clin Invest. 2012;122(8):2711–2719. doi: 10.1172/JCI62423. [DOI] [PMC free article] [PubMed] [Google Scholar]
- 48.Vourc’h M, Roquilly A, Asehnoune K. Trauma-induced damage-associated molecular patterns-mediated remote organ injury and immunosuppression in the acutely ill patient. Front Immunol. 2018;9:1330. doi: 10.3389/fimmu.2018.01330. [DOI] [PMC free article] [PubMed] [Google Scholar]
- 49.Wong G, et al. Pathogenicity comparison between the Kikwit and Makona Ebola virus variants in rhesus macaques. J Infect Dis. 2016;214(suppl 3):S281–S289. doi: 10.1093/infdis/jiw267. [DOI] [PMC free article] [PubMed] [Google Scholar]
- 50.Cárdenas WB, et al. Ebola virus VP35 protein binds double-stranded RNA and inhibits alpha/beta interferon production induced by RIG-I signaling. J Virol. 2006;80(11):5168–5178. doi: 10.1128/JVI.02199-05. [DOI] [PMC free article] [PubMed] [Google Scholar]
- 51.Messaoudi I, Amarasinghe GK, Basler CF. Filovirus pathogenesis and immune evasion: insights from Ebola virus and Marburg virus. Nat Rev Microbiol. 2015;13(11):663–676. doi: 10.1038/nrmicro3524. [DOI] [PMC free article] [PubMed] [Google Scholar]
- 52.Hotchkiss RS, Karl IE. The pathophysiology and treatment of sepsis. N Engl J Med. 2003;348(2):138–150. doi: 10.1056/NEJMra021333. [DOI] [PubMed] [Google Scholar]
- 53.Taeb AM, Hooper MH, Marik PE. Sepsis: current definition, pathophysiology, diagnosis, and management. Nutr Clin Pract. 2017;32(3):296–308. doi: 10.1177/0884533617695243. [DOI] [PubMed] [Google Scholar]
- 54.Irizarry RA, et al. Exploration, normalization, and summaries of high density oligonucleotide array probe level data. Biostatistics. 2003;4(2):249–264. doi: 10.1093/biostatistics/4.2.249. [DOI] [PubMed] [Google Scholar]
- 55.Ritchie ME, et al. limma powers differential expression analyses for RNA-sequencing and microarray studies. Nucleic Acids Res. 2015;43(7):e47. doi: 10.1093/nar/gkv007. [DOI] [PMC free article] [PubMed] [Google Scholar]
- 56.Wu D, Smyth GK. Camera: a competitive gene set test accounting for inter-gene correlation. Nucleic Acids Res. 2012;40(17):e133. doi: 10.1093/nar/gks461. [DOI] [PMC free article] [PubMed] [Google Scholar]
- 57. Yang Y, Zou H. A fast unified algorithm for solving group-lasso penalize learning problems. Stat Comput. 2015;25(6):1129–1141. https://doi.org/10.1007/s11222-014-9498-5.
- 58. Yuan M, Lin Y. Model selection estimation in regression with grouped variables. JR Stat Soc Ser B (Statistical Methodol). 68(1):49–67. doi:10.1111/j.1467-9868.2005.00532.x. [Google Scholar]
- 59.Sachs MC. plotROC: A Tool for Plotting ROC Curves. J Stat Software. 2017;79(Code Snippet 2):1–19. doi: 10.18637/jss.v079.c02. doi:10.18637/jss.v079.c02. [DOI] [PMC free article] [PubMed] [Google Scholar]


