Summary
The successful segregation of germ cells from somatic lineages is vital for sexual reproduction and species survival. In the mouse, primordial germ cells (PGCs), precursors of all germ cells, are induced from the post-implantation epiblast1. Induction requires BMP4 signalling to prospective PGCs2 and the intrinsic action of PGC transcription factors (TFs)3–6. However, the molecular mechanisms connecting BMP4 to induction of the PGC TFs responsible for segregating PGCs from somatic lineages are unknown. Here we show that the transcription factor OTX2 is a key regulator of these processes. Down-regulation of Otx2 precedes the initiation of the PGC programme both in vitro and in vivo. Deletion of Otx2 in vitro dramatically increases PGCLC differentiation efficiency and prolongs the period of PGC competence. In the absence of Otx2 activity, PGCLC differentiation becomes independent of the otherwise essential cytokine signals, with germline entry initiating even in the absence of the PGC TF Blimp1. Deletion of Otx2 in vivo increases PGC numbers. These data demonstrate that OTX2 functions repressively upstream of PGC TFs, acting as a roadblock to limit entry of epiblast cells to the germline to a small window in space and time, thereby ensuring correct numerical segregation of germline cells from the soma.
Different species form their germ cells by either of two general methods: segregation of preformed germplasm, or induction by signalling 7,8. In mammals, germ cell precursors arise by induction 9–11. In the mouse, competence to initiate germ cell development is restricted to a few cells within the E5.5-6.25 epiblast 1. BMP4 from the extraembryonic ectoderm acts on these competent cells to specify germ cell identity 2. Specification also requires transcription factors (TFs), notably Blimp1, Ap2γ and Prdm14 3–6. However, the molecular mechanisms connecting exposure of competent cells to BMP4 to activation of PGC TFs are obscured by limited access to the peri-implantation embryo. Recently, a system for differentiation of primordial germ cell-like cells (PGCLCs) from embryonic stem cells (ESCs) via germline competent epiblast-like cells (EpiLCs) 12 has opened up investigation of molecular events segregating germline and soma.
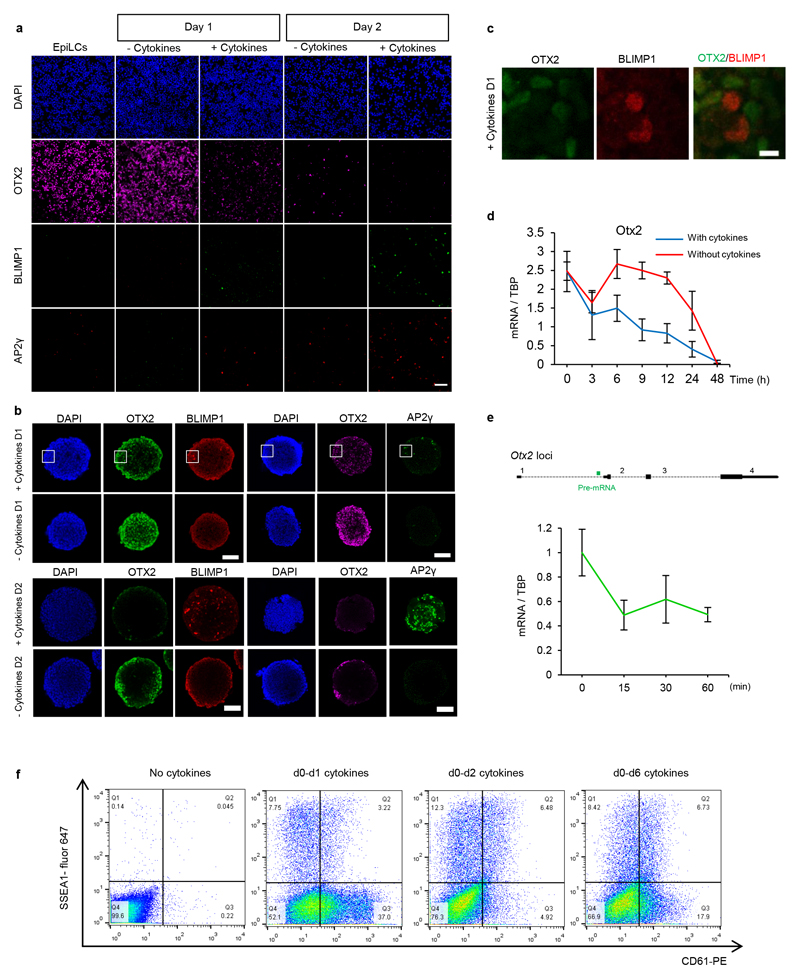
During the ESC to EpiLC transition the TF OTX2 becomes expressed and redirects binding of OCT4 to genomic regulatory elements13,14. OTX2 was previously characterised as a regulator of anterior patterning 15,16. Recent work has demonstrated antagonistic functions for OTX2 and NANOG in ESCs17,18. A positive role for NANOG in PGCLC differentiation has also been added to the known requirements for Blimp1, Prdm14 and Ap2γ 19–21. We therefore assessed expression of the corresponding mRNAs following addition of PGCLC-inducing cytokines to EpiLCs (Figure 1a, b). Blimp1, Prdm14 and AP2γ mRNAs did not change during the first 12 hours. A modest increase in Ap2γ mRNA at 24h preceded more pronounced increases in all three mRNAs by 48h (Figure 1b). In contrast, Otx2 mRNA dropped to ~20% of the EpiLC level at 24h (Figure 1b). Immunofluorescence analysis indicated that the proportion of cells expressing OTX2 protein decreased at 24h, with almost no OTX2-expressing cells detected at 48h (Figure 1c; Extended Data Figure 2a, b). Cultures in which PGCLC cytokines were omitted lost OTX2-expressing cells more slowly (Extended Data Figure 2a, b). Moreover, while Otx2 mRNA declines upon FGF/Activin withdrawal, the kinetics of suppression are enhanced by PGCLC cytokine addition (Extended Data Figure 2d). This suggests that PGCLC cytokines directly repress Otx2 transcription, a notion supported by the prompt decline in Otx2 pre-mRNA upon switching EpiLCs into PGCLC media (Extended Data Figure 2e). BLIMP1 and AP2γ proteins were initially detectable at 24h, but only in cultures treated with cytokines (Extended Data Figure 2a, b) and only in cells with reduced OTX2 (Figure 1c, d; Extended Data Figure 2c). These results suggest that before the PGC gene regulatory network (GRN) becomes activated, the transcriptional circuitry of the formative pluripotent 22, germline competent 23 state characterised by OTX2 expression 13 becomes extinguished.
Figure 1. Otx2 expression is down-regulated prior to expression of PGC TFs.
a. Scheme for PGCLC differentiation.
b. Top, scheme illustrating the time-points (hours) during PGCLC differentiation when mRNAs were analysed. Bottom, Q-RT-PCR of Otx2 and PGC TFs in E14Tg2a ESCs. Expression levels are normalised to TBP; h, hours; Values are means±SD, n= 3 biologically independent replicates.
c. Single cell quantification of immunofluorescence for Otx2 and Ap2γ in cytospin preparations of EpiLCs and cell aggregates at day 1 and day 2 of PGCLC induction. 2 biologically independent replicates were performed.
d. Whole mount immunofluorescence of E14Tg2a aggregates after 1 day of PGCLC differentiation. n=3. Scale bar, 50μm (top) and 10μm (bottom)
e-g. Representative confocal images of whole mount staining of embryos at pre-streak (e, n=4), early streak (f, n=3) and late streak (g, n=3) stages. Bar = 40μm (e), 100μm (f, g).
h-i. Magnified image of the regions highlighted in (f) and (g) respectively. OTX2-negative cells expressing BLIMP1 and FRAGILIS are outlined (g, h). Bar = 20μm.
The reciprocal relationship between OTX2 and BLIMP1/AP2γ during PGCLC induction prompted determination of whether a similar spatio-temporal relationship between changes in expression of OTX2 and PGC TFs held in vivo. Whole mount immunofluorescence of pre-streak stage embryos indicated that all epiblast cells express both OCT4 and OTX2 (Figure 1e). At early-mid streak, OTX2 remains widely expressed in the epiblast except for cells showing incipient FRAGILIS 24 and BLIMP1 3 expression (Figure 1f, h). By late streak-early bud stage, BLIMP1 is clearly detectable within the FRAGILIS field in cells lacking OTX2 (Figure 1g, i). These results indicate that OTX2 is expressed ubiquitously in pre-streak epiblast cells but is specifically down regulated in the prospective PGC population prior to BLIMP1 expression.
Cytokine addition is required for PGCLC differentiation 12. To assess when, cells were treated for 1, 2 or 6 days with cytokines and analysed by FACS for surface expression of SSEA1 and CD61, which together mark PGCLCs 12. Cytokine treatment for the first day induces around half of the potentially responsive population to become CD61+/SSEA1+ (Extended Data Figure 2f). Two or 6 days of cytokine treatment were equally effective at inducing CD61/SSEA1 (Extended Data Figure 2f). This suggests that cytokine exposure reaches maximum efficacy at 2 days, the time required to reduce Otx2 to minimal levels and initiate PGCLC TF expression (Figure 1b, d; Extended Data Figure 2a, b, c).
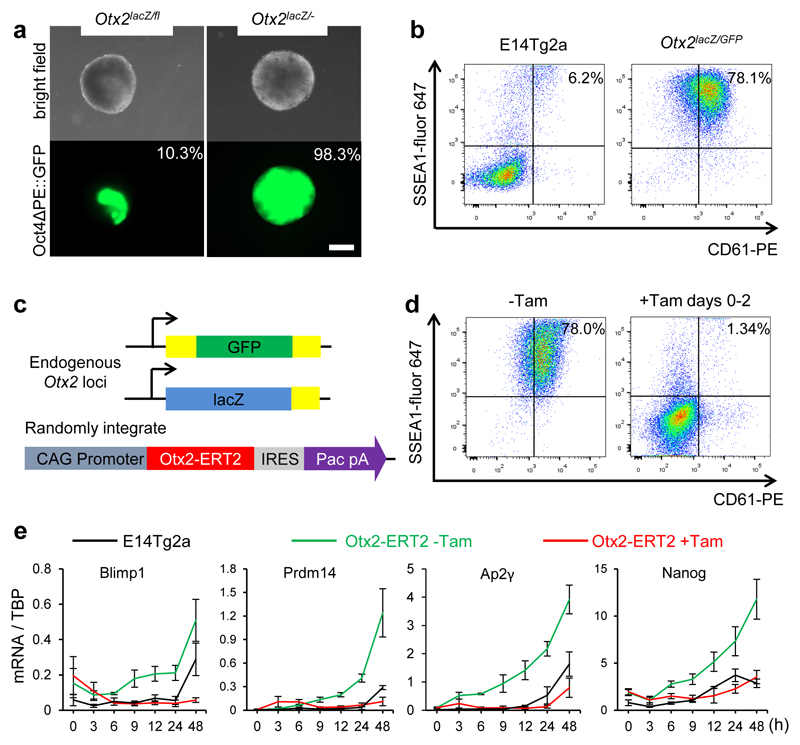
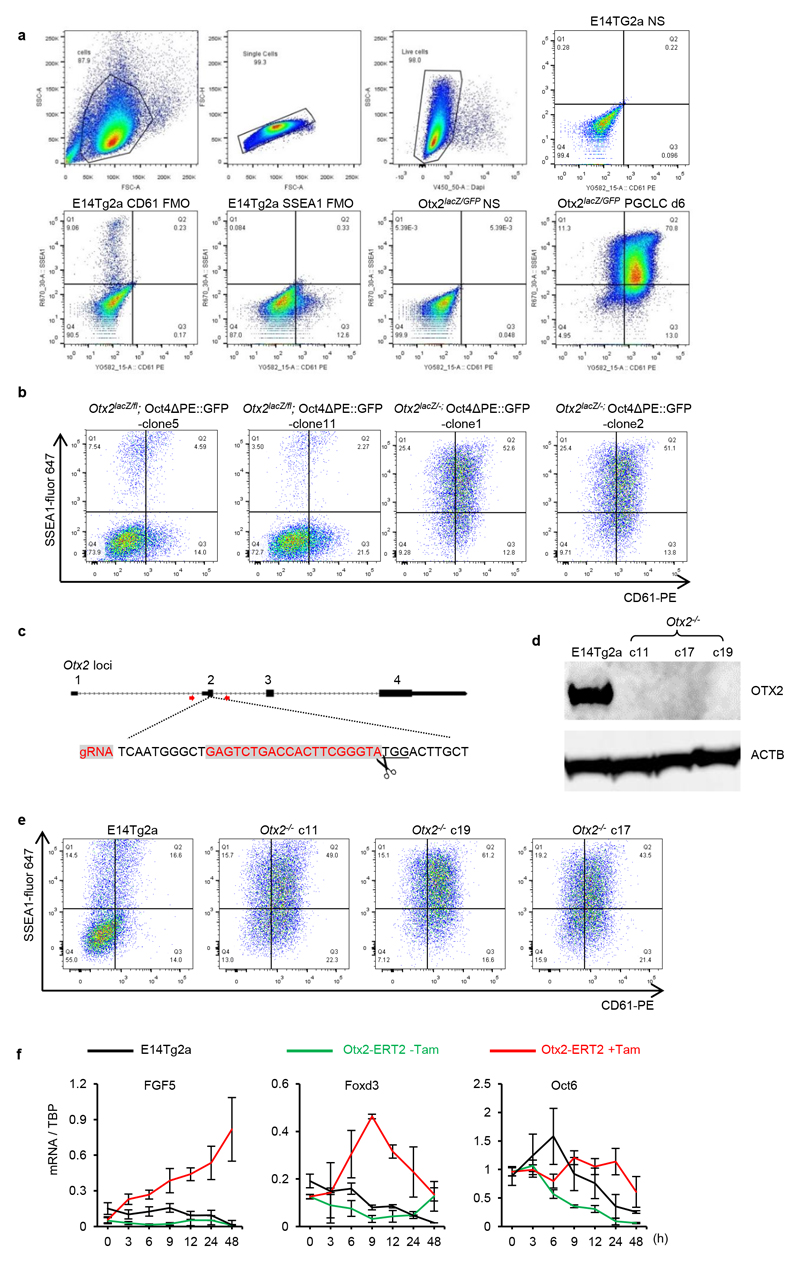
To directly assess whether OTX2 downregulation influences entry of pluripotent cells into the germline, Otx2-null cells were examined. A transgenic Oct4ΔPE::GFP reporter activated upon germline entry 25 was added to Otx2fl/- and Otx2-/- ESCs 17(Extended Data Figure 1). Compared to Otx2 heterozygotes, Otx2-/- cell populations showed widespread activation of Oct4ΔPE, with essentially all cells activating GFP (Figure 2a). Furthermore, the SSEA1+/CD61+ cell number is increased 5-10-fold in Otx2-/- versus Otx2+/+ cells (Figure 2b). This was also the case in independently generated Otx2-/- ESCs (Extended Data Figure 3b) and in additional independent Otx2-/- ESCs generated using CRISPR/Cas9 (Extended Data Figure 1, 3c). Three new ESC lines lacking OTX2 protein (Extended Data Figure 3d) showed enhanced CD61/SSEA1 expression during PGCLC differentiation (Extended Data Figure 3e). These results confirm that a lack of OTX2 promotes germline differentiation.
Figure 2. Otx2-/- EpiLCs have an enhanced propensity to differentiate into PGCLCs.
a. Representative morphologies and Oct4ΔPE::GFP expression in aggregates at day 4 of PGCLC differentiation in the presence of cytokines. Percentages indicate GFP-positive cells; n=9. Bar = 200μm.
b. E14Tg2a and Otx2-/- cells were assessed by flow cytometry for surface expression of SSEA1 and CD61 at days 6 of PGCLC differentiation; (n=12).
c. Diagram of the tamoxifen inducible Otx2 cell line, carrying an Otx2-ERT2 fusion protein transgene and replacements of endogenous Otx2 alleles by GFP or LacZ.
d. Otx2lacZ/GFP::Otx2ERT2 cells were assessed by flow cytometry for surface expression of SSEA1 and CD61 at day 6 of PGCLC differentiation, either without Tamoxifen or with Tamoxifen from days 0-2, n= 4 biologically independent replicates.
e. Q-RT-PCR of PGC TFs. Expression levels are normalised to TBP; h, hours; Values are means±SD, n= 3 biologically independent replicates.
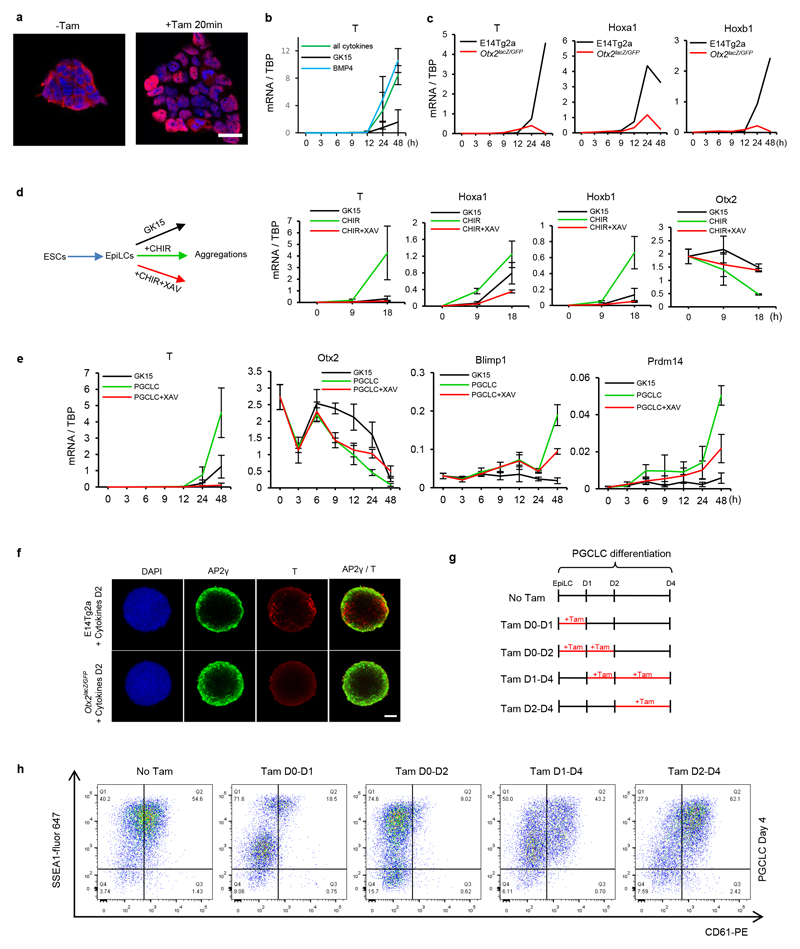
To investigate when during differentiation OTX2 influences germline entry, an Otx2-ERT2 transgene (enabling tamoxifen-induced re-localisation of OTX2) was introduced into Otx2lacZ/GFP ESCs (Figure 2c, Extended Data Figure 4a). Tamoxifen treatment for the first 2 days suppressed emergence of SSEA1+/CD61+ cells (Figure 2d). These results establish that enforcing OTX2 activity at a time when cells are competent to enter the germline 12 and when cytokines act to decrease endogenous Otx2 expression, is sufficient to block cytokine-mediated PGCLC differentiation.
To examine the mechanism by which OTX2 inhibits PGCLC differentiation, mRNAs were analysed. Expression of PGCLC TF mRNAs occurred sooner and to a greater extent without OTX2 (Figure 2e). In contrast, enforcing OTX2 activity inhibited PGCLC TF mRNA induction (Figure 2e). NANOG also directs PGCLC differentiation 20,26. Consistent with this, endogenous Nanog mRNA was induced precociously in Otx2-/- cells (Figure 2e). In addition, while Fgf5, FoxD3 and Oct6 mRNAs were not induced without OTX2 (Extended Data Figure 3f), their expression was increased above wild-type levels by OTX2 induction (Extended Data Figure 3f). These analyses suggest that OTX2 acts at the juncture between somatic and germline differentiation and inhibits PGCLC differentiation by preventing PGC TF expression.
A previous report has provided evidence for the involvement of T (Brachyury) in PGCLC induction 27 by showing that BMP4 induced T expression via endogenous wnt. We also found that T is activated robustly only when BMP4 is present (Extended Data Figure 4b) with T and other somatic markers induced during PGCLC differentiation (Extended Data Figure 4c). In vivo, BMP4 induces epiblast cells to secrete wnt28. Therefore, to assess whether wnt acts as an intermediary between BMP4 and activation of T and other somatic markers, wnt signalling was mimicked by adding CHIR99021 to basal media (Extended Data Figure 4d). T, hoxa1 and hoxb1 mRNAs were induced by CHIR99021 but Otx2 mRNA was repressed; effects that were reversed by addition of the wnt antagonist XAV939 (Extended data Figure 4d). Therefore, Otx2 down-regulation by BMP4 may occur via wnt signalling. To further assess this, XAV939 was added during PGCLC differentiation. XAV939 does not affect Otx2 mRNA for 9 hours but dampens further reduction (Extended data Figure 4e). Moreover, XAV939 diminishes induction of Blimp1 and Prdm14 mRNAs seen after 24h (Extended data Figure 4e). This is consistent with a model in which BMP induction of wnt enforces timely repression of Otx2 and full induction of Blimp1 and Prdm14. Finally, Otx2-/- cells do not activate T mRNA (Extended data Figure 4c) or protein (Extended data Figure 4f). Therefore, activation of T is dispensable for PGC induction, at least when OTX2 is absent. These observations suggest that the effects of wnt signalling during PGC differentiation might be attributed to OTX2 down-regulation.
To assess whether OTX2 can interfere with the function of an established PGCLC GRN, OTX2 activity was restored at day 2, once the PGC GRN was already activated (Figure 2e). This produced a similar proportion of SSEA1+/CD61+ cells as cultures receiving no tamoxifen (Extended Data Figure 4g, h). Therefore, OTX2 does not impair the function of an established PGC network, but rather restricts the efficiency with which EpiLCs enter the germline.
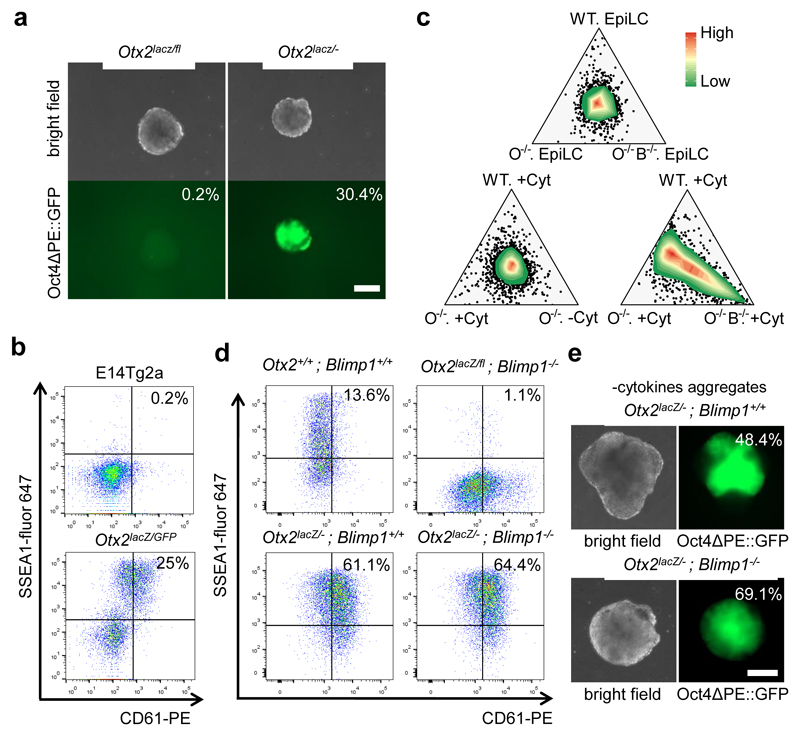
PGCLC induction is considered to strictly require cytokine addition 12. Consistent with this, Oct4ΔPE::GFP was not expressed by aggregates of Otx2fl/- cells cultured in the absence of cytokines (Figure 3a). However, in Otx2-/- cells, cytokines were not essential for OctΔPE reporter activation (Figure 3a), CD61/SSEA1 surface expression (Figure 3b, Extended Data Figure 5a, b) or PGC TF expression (Extended Data Figure 5c, d). Indeed, mRNA profiling indicated that Otx2+/+ and Otx2-/- EpiLCs were transcriptionally similar and that following differentiation, Otx2-/- cells resembled wild-type PGCLCs, irrespective of their exposure to cytokines (Extended Data Figure 6a). Principal component and ternary analysis confirmed these assessments (Figure 3c, Extended Data Figure 6b). These results indicate that without OTX2, germline entry does not require cytokines.
Figure 3. Otx2-null cells can access the germline independently of cytokines and Blimp1.
a. Representative morphologies and Oct4ΔPE::GFP expression in aggregates at day 4 of PGCLC differentiation without cytokines. Percentages indicate GFP-positive cells; (n= 7). Bar = 200μm.
b. E14Tg2a and Otx2-/- cells were assessed by flow cytometry for surface expression of SSEA1 and CD61 at day 6 of differentiation in the absence of PGCLC cytokines; (n=9).
c. Ternary plot analysis (microarray data from 3 biologically independent replicates under 7 different conditions) comparing transcriptomes of EpiLCs (top) or day6 PGCLCs (bottom). Circles represent probes, with colour indicating the probe density. Differentiations performed in the presence or absence of cytokines are indicated (+/-Cyt). WT, E14Tg2a; O-/-, Otx2lacZ/GFP; O-/- B-/-, Otx2lacZ/GFP Blimp1-/-.
d. Cells of the indicated genotypes were assessed by flow cytometry for surface expression of SSEA1 and CD61 at day 6 of PGCLC differentiation; (n=2 for 1 clone of each genotype). Two further clones of each genotype are shown in Extended Data Figure 6.
e. Cytokine-free PGCLC differentiation. Representative morphologies and Oct4ΔPE::GFP expression of aggregates at day 6. Percentages indicate GFP-positive cells; (n=2 for 1 clone of each genotype). Bar = 200μm.
BLIMP1 is essential for wild-type cells to access the germline 3,4. To determine whether Otx2-/- cells retained this dependency, both Blimp1 alleles were deleted from ESCs of distinct Otx2 genotypes using CRISPR/Cas9 (Extended Data Figure1, 7a, b, c). PGCLC differentiation confirmed a BLIMP1 requirement for germline entry of OTX2-expressing cells (Figure 3d, Extended Data Figure 7d). However, deletion of Blimp1 from Otx2-/- cells did not affect the ability of Otx2-/- cells to induce CD61/SSEA1 (Figure 3d; Extended Data Figure 7d). While deletion of Blimp1 from wild-type cells increased expression of somatic transcripts during PGCLC differentiation, this did not occur in Otx2-/-; Blimp1-/- PGCLCs (Extended Data Figure 8a). Nor did Blimp1 removal impair the enhanced ability of Otx2-/- cells to activate expression of Prdm14, Ap2γ, Nanog or Oct4 mRNAs (Extended Data Figure 8b) or DAZL protein (Extended Data Figure 8c). During differentiation, PGCLCs expressing OCT4 have higher H3K27me3 and lower H3K9me2 than OCT4-low cells. These relationships were maintained in Otx2-/- and Otx2-/-; Blimp1-/- PGCLCs (Extended Data Figure 8d). Furthermore, without PGCLC cytokines, CD61/SSEA1 expression and Oct4ΔPE reporter activation was unaffected by Blimp1 deletion in multiple Otx2-/- cell lines (Figure 3e; Extended Data Figure 7e, f). Nevertheless, at day 6 of PGCLC differentiation, Otx2-/-; Blimp1-/- cells are unable to adopt the mature PGCLC transcriptome observed in Otx2+/+ or Otx2-/-; Blimp1+/+ cells (Figure 3c; Extended Data Figure 6). These results indicate that without OTX2, BLIMP1 is not required for phenotypic aspects of germline entry, but is required for a fully mature PGC phenotype.
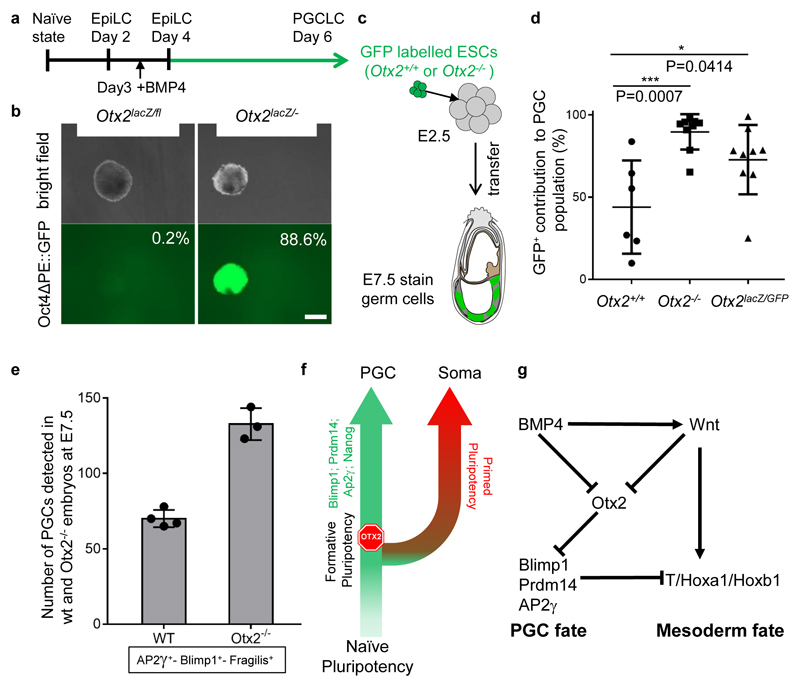
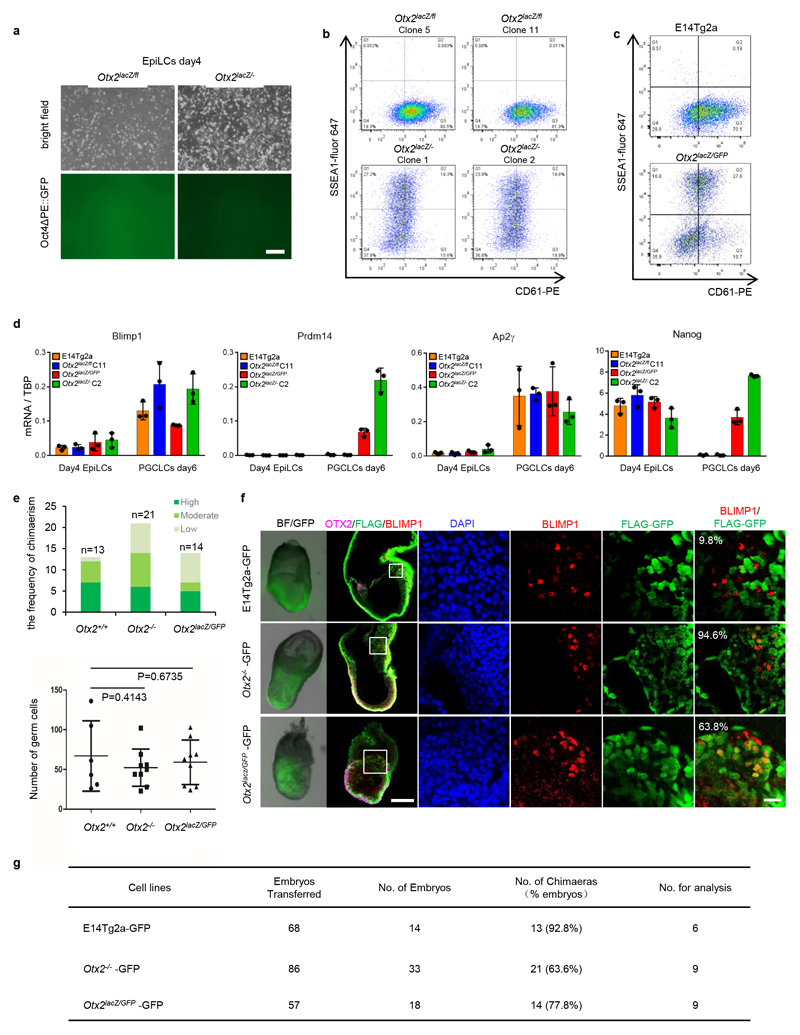
While EpiLCs respond to cytokine induction by PGCLC differentiation, this ability is not maintained upon continued passaging in Activin/Fgf12, suggesting that in these conditions, cells lose germline competence. To assess whether OTX2 affects the period during which pluripotent cells remain competent for germline entry, EpiLCs were passaged in EpiLC media for a further 2 days (Figure 4a). At this point the Oct4ΔPE::GFP reporter is inactive in both Otx2fl/- and Otx2-/- cells (Extended Data Figure 9a). Cells were then transferred to PGCLC differentiation medium for 6 days. Strikingly, Oct4ΔPE::GFP was reactivated robustly in Otx2-/- but not Otx2fl/- cells (Figure 4b). Moreover, while all cell lines expressed Blimp1 and Ap2γ mRNAs, CD61/SSEA1 surface expression and Prdm14 and Nanog mRNA expression were observed only in Otx2-/- and not in Otx2+/+ or Otx2fl/- cells (Extended Data Figure 9b, c, d). This indicates that in the absence of OTX2 the period of competence to enter the germline is extended.
Figure 4. Otx2-/- ESCs contribute to the germline at an enhanced rate in vivo.
a. Scheme for PGCLC differentiation, initiated from day 4 EpiLCs obtained after 1 passage from EpiLCs.
b. Representative morphologies and Oct4ΔPE::GFP expression from aggregates at day 6 of PGCLC differentiation from EpiLCs day4 (n=3 for 1 clone of each genotype). Bar = 200μm.
c. Scheme for generating chimaeras of GFP labelled Otx2+/+ or Otx2-/- ESCs with wildtype host embryos.
d. Comparison of the percentage contribution of GFP labelled wildtype (n=6) or Otx2-null ESCs (genotypes indicated, n=9 for each) to the PGC population in E7.5 chimaeric embryos. Each dot represents the percentage from one chimaera, centre lines and error bars represents means±SD. P value (two-sided unpaired T-test, 0.95 confidence intervals) is indicated. GFP positive cells were counted within the PGC population marked with BLIMP1 or SOX2 in each embryo.
e. Comparison of PGCs number in wild-type (n= 4) and Otx2-/- (n= 3) E7.5 embryos. PGCs were identified with Blimp1, AP2γ and Fragilis. Values= means ± SD.
f. Model indicating the point of operation of OTX2 during germline-soma segregation.
g. A scheme illustrating the regulatory relationships upstream and downstream of Otx2 during germline segregation.
To determine whether Otx2-/- cells exhibit an increased propensity to enter the germline in vivo, Otx2+/+ or Otx2-/- ESCs constitutively expressing GFP were compared in chimaeras following morula aggregation (Figure 4c). Otx2+/+and Otx2-/- cells had a comparable capacity to produce chimaeras (Extended Data Figure 9e, g). However, an enhanced proportion of Otx2-/- cells expressed BLIMP1 or SOX2 (Figure 4d; Extended Data Figure 9f), indicating that enhanced germline entry is a cell autonomous property of Otx2-/- cells.
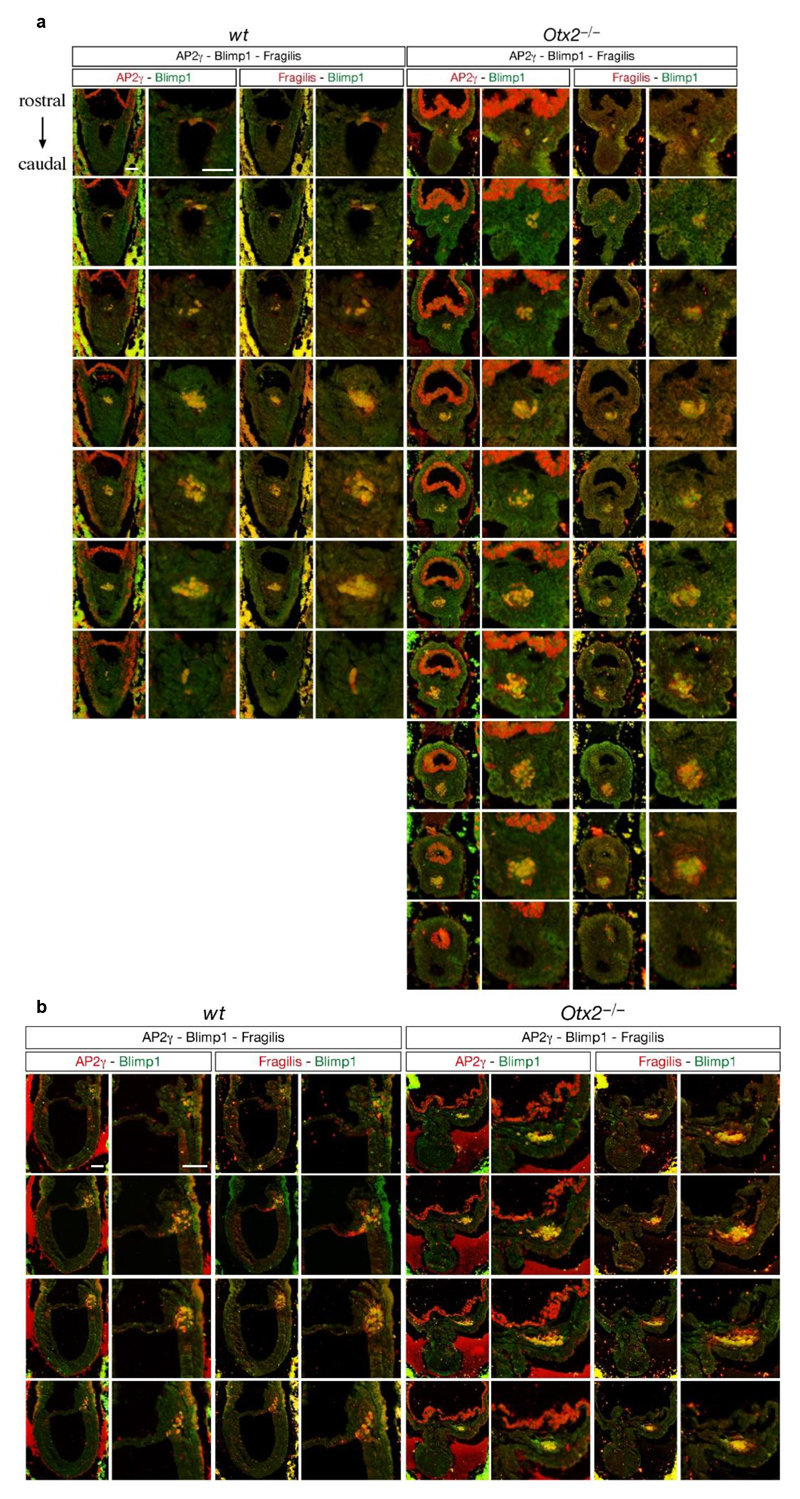
To determine whether Otx2-/- embryos also showed enhanced PGC numbers, Otx2+/- mice15 were intercrossed and Otx2-/- embryos analysed at E7.5. These embryos show strong developmental defects15,16 but also showed increased PGC numbers (Figure 4e, Extended Data Figure 10 a, b), confirming that in vivo, OTX2 acts as a negative regulator of the PGC programme.
Previous studies have shown that, in the mouse, competence to enter the germline exists transiently in embryos from E5.5-6.25 1. In wild-type cells, germline entry requires BMP4 signalling from the extraembryonic ectoderm 2 and is critically dependent on the downstream action of BLIMP1 3. Our work identifies OTX2 as an intermediary fulcrum in these processes (Figure 4f). During the period of PGC competence BMP4 represses Otx2 expression, partly by endogenous wnt activation (Figure 4g). This reduction in OTX2 is necessary for expression of the PGC TFs BLIMP1, PRDM14, AP2γ and NANOG since enforcing OTX2 activity prevents their expression. Moreover, the rate of Otx2 decline appears important since without cytokines, germline entry is diminished. We propose that without cytokines, the window for germline entry closes before OTX2 is reduced below a threshold necessary for PGC TF expression. Furthermore, in the absence of OTX2, PGC TF expression does not require BMP4, indicating that BMP4 functions by repressing Otx2. Otx2-/- cells also exhibit an extended competence period, suggesting that OTX2 sets in train a mechanism that defines the extent of the competence period. Also, as Otx2-/- cells can initiate PGC differentiation without BLIMP1, this suggests a reciprocal relationship between BLIMP1 and OTX2, in which BLIMP1 represses 21,29,30 and OTX2 activates somatic gene expression 17. Supporting this, during PGCLC differentiation Otx2-/- cells do not activate mesendoderm genes17 (Extended Data Figure 4c) that are otherwise repressed by Blimp1 30. This may explain why some aspects of PGCLC differentiation phenotype can be divorced from a Blimp1 requirement in Otx2-/- cells. This places OTX2 at a developmental crossroads where it acts to police excessive access to the germline (Figure 4f).
Finally, our findings are noteworthy in light of the hypothesis that the neural lineage is the default developmental pathway for vertebrate cells31. Interestingly, neural induction requires inhibition of BMP signalling 32. BMP is a known facilitator of germline entry2 and is identified here as a key Otx2 repressor. The default neural induction hypothesis is based principally on studies in chicks and frogs, species in which PGCs are formed by germplasm segregation. Yet, induced germline segregation is considered the ancestral mechanisms that predates the recurrent evolution of germplasm 7,8. The highly efficient entry of pluripotent cells into the germline in the absence of OTX2 reported here suggests that the germline may be the ancient default option that must be overcome in order to elaborate the ancillary structures of the soma.
Methods
All mouse studies were performed in accordance with UK Home Office regulations under project licence PPL 60/4435 and carried out in a Home Office-designated facility.
Cell culture and differentiation
ESCs were routinely cultured in GMEMβ supplemented with 100U/ml LIF and 10% FCS at 3-10 x 105 cells/cm2 density on tissue culture flasks coated with 0.1% gelatin33. EpiLC differentiation and PGCLC induction were carried out according to protocol previously described 12,34,35.
For cytokine-free differentiation, EpiLCs were dissociated and resuspended at 8 x 10⁴ cells/ml in GK15 medium (GMEMβ supplemented with 15% KOSR). 25μl drops containing 2,000 cells were plated on the lids of tissue culture dishes and incubated over a reservoir of PBS for 2 days. Hanging drops were then collected and transferred to untreated culture dishes supplemented with GK15 medium and rotated at 72 rpm. Fresh medium was replenished every other day. CHIR (3μM) and XAV939 (2μM) were used to induce and repress wnt signalling.
Generation of knockout cell lines
For a summary of cell lines used in this report and a history of their derivation, see Extended Data Figure 1.
Otx2 knockout (Otx2lacZ/GFP) and Otx2 conditional knockout (Otx2lacZ/fl; Rosa26CreER/+) cell lines and targeting strategies have been described previously18. To derive Otx2KO (Otx2lacZ/-) lines from Otx2lacZ/fl, Otx2lacZ/fl, ESCs were treated with 1μM tamoxifen for 24 hours, plated at clonal density and after 6 days, individual colonies picked, expanded and genotypes verified with qPCR, western blot and immunostaining.
For KO cell lines derived using Crispr/Cas9 technology, ESCs were transfected with vectors expressing gRNAs and eSpCas9-T2A-mCherry or eSpCas9-T2A-eGFP using Lipofectamine 3000 (Invitrogen, L3000015) and cultured for 24 hours. After FACS sorting, single cell clones were expanded and genotyped. Clones with predicted genotypes were further verified with qPCR or western blot and immunostaining. See Supplementary Table 1 for detailed oligonucleotide sequences of gRNAs, genotyping PCR.
Immunohistochemistry
For whole-mount staining of embryos and PGCLC aggregates, embryos and PGCLC aggregates were fixed with 4% paraformaldehyde (PFA) in PBS (RT, 30min). For Fragilis staining, embryos were washed three times in PBS/0.1%BSA and blocked overnight at 4°C in 3% donkey serum (Sigma)/1% BSA/PBS solution. For other antibodies, samples were washed three times with PBS/0.1% TritonX100 (PBST), permeabilized in 0.5% Triton X100/PBS solution for 15 minutes and incubated in 1 M glycine in PBST for 20 minutes. After three washes, samples were blocked overnight at 4°C using 3% donkey serum, 1% BSA (Sigma) in PBST (blocking buffer). Samples were then incubated for 72 hours with diluted primary antibodies, rinsed four times for 20 min each in PBST and incubated for 4 hours at RT with diluted secondary antibody. Samples were then rinsed four times for 20 min each in PBST. DAPI (Molecular Probes, D1306) was used for nuclear staining (same for other staining). For imaging, embryos were treated with 10%, 25%, 50%, 97% thiodiethanol (Sigma, 166782) for 5min in each gradient and were imaged using the TCS SP8 inverted confocal microscope (Leica).
For frozen sections staining, aggregations were fixed in 4% PFA (RT, 20 min). After washing in PBS, samples were embedded in Tissue-Freezing medium (Thermo Fisher scientific, 6502Y) and sectioned at a thickness of 5μm. For antigen retrieval, sections were microwaved with highest power in 10mM sodium citrate (PH=6.0) for 2 min 30s, twice. After antigen retrieval, samples were incubated in blocking buffer (RT, 1 hour), then incubated with primary antibodies (4 °C overnight), after rinsed three times in PBST for 10 min, incubated for 2 hours at RT with diluted secondary antibody. Sections were then covered by cover slip in Fluoromount (SouthernBiotech, 0100-01) and imaged using the TCS SP8 inverted confocal microscope (Leica)
For immunostaining of cells grown in monolayer, cells were washed once with PBS, fixed in 4% PFA (RT, 10 min), permeabilised in 0.3% Triton X100/PBS (RT, 20 min), incubated in blocking buffer (RT, 1 hour), before addition of primary antibodies and incubation at 4°C overnight. Cells were washed in PBST (4 times, 5 mins) before incubation with diluted secondary antibodies (RT, 1 hour). After washing 4 times (PBST), cells were imaged using the TCS SP8 inverted confocal microscope (Leica).
For cytospin staining, cells or aggregates were dissociated into single cells. 1 ×10⁵ cells in 100μl 1%BSA/PBS buffer were added into sample holders, centrifuged in the cytospin machine (5 min, 1200rpm). Microscope slides were then taken from the holders and cells circled with hydrophobic marker pen. Staining was then finished following the same protocol as for monolayer cells.
For PGC cell counting in wild-type and Otx2-null embryos, embryos were isolated at embryonic day (E) 7.5, washed in PBS, fixed overnight in 4% PFA/PBS, dehydrated and paraffin embedded as reported18. Embryos were sectioned in coronal-frontal or sagittal sections and processed for immunohistochemistry (IHC) with antibodies against Blimp1, AP2γ (Santa Cruz Biotechnology, SC-53162) and Fragilis (R&D Systems, AF3377). All sections were analyzed and those including PGCs captured for cell-counting analysis.
If not specified, primary and secondary antibodies used are listed in Supplementary Table 2.
Immunofluorescence quantification
Cytospin slides were stained at the same time and imaged using a Zeiss Observer microscope (Zeiss), Plan-Apo 20x NA, 0.8 objective (Zeiss), a Hamamatsu ORCA-Flash4.0 V3 camera (Hamamatsu), a Colibri 7 (Zeiss) light source and the following filter cubes (name, excitation LED, beam splitter, band pass emission filter, 49 DAPI - 395 - 480/40; 38 HE GFP - 495 - 525/50; 43 HE dsRed - 570 - 605/70; Cy5-660-700/775). Images were analysed using CellProfiler software (version 2.2.0)36. DAPI staining was first used to segment individual nuclei based on the diameter and intensity of the objects (25-90pixel units and intensity threshold > 0.05 respectively), then the intensity of Otx2 and Ap2γ of the segmented nuclei were measured and the mean intensity of each channel reported. Over 8000 segmented nuclei of each samples were analyzed. The data were analysed in R and plot were generated using the ggplot2 package. The Otx2 KO EpiLCs are negative for both Otx2 and Ap2γ staining and therefore were used to set up the threshold for gating Otx2 and Ap2γ for all samples (negative gate >99.5%).
Flow cytometry
FACS analysis was performed as described34. Cells grown in monolayer or embryoid bodies in suspension were dissociated into single cells with trypsin and neutralised in PBS/10%FCS. A maximum of 5x10⁵ cells were collected by centrifugation and the pellet resuspended in 100μl PBS/10%FCS supplemented with Alexa Fluor® 647 anti-mouse/human CD15 (SSEA-1) (Biolegend, 125608) and PE anti-mouse/rat CD61 (Biolegend, 104307) diluted 1/200 and 1/500 respectively and incubated (30 mins, 4°C). Cells were washed twice in 1 ml PBS/10% FCS before analysis on a BD Fortessa 5 laser LSRII. Gate strategy was shown in Extended Data Figure 3a.
SDS-PAGE Electrophoresis and Immunoblotting
Immunoblot analysis was performed as described37. Briefly, Protein samples from cell lysates, along with protein ladder (Novex, cat. LC5925) were loaded on 10% Bis-Tris Gels (Novex, cat. BG00102BOX) and electrophoresis performed at 200V for 60-80 minutes. Proteins were then transferred onto Nitrocellulose membrane (Capitol Scientific, cat. 10401396), blocked in 10% milk (w/v) (RT, 1 hour), followed by incubation with primary antibodies (4°C, overnight). After 3 washes in PBST membranes were incubated with IRDye conjugated secondary antibody, followed by 3 washes in PBST before being visualised in LI-COR Odyssey Imaging Systems. Primary and secondary antibodies were listed in Supplementary Table 2.
RNA analysis
Total RNA was extracted using either Trizol (Invitrogen,15596026) or RNeasy micro (Qiagen, 74034) or mini kit (Qiagen, 74104) following the manufacturer’s instructions, followed by DNase treatment (Qiagen, 157047207). Reverse transcription reactions were performed using Superscript First Strand Synthesis kit (Invitrogen, 1964419) and quantitative PCR performed using SYBR® Green Kits (Takyon, UF-NSMT-B0701) on Roche LightCycler 480 with cDNA equivalent of 25ng total RNA per reaction. Values for each gene were normalised to expression of TATA-box Binding Protein (TBP) according to 2−ΔCT formula38. Oligonucleotide sequences are shown in Supplementary Table 3.
Transcriptomic Profiling and Data analysis
Total RNAs were extracted using RNeasy Plus Micro Kit (Qiagen, Cat.74034), following supplier's instructions. RNAs were labelled using Illumina® TotalPrep™ RNA Amplification Kit (Illumina, Cat.AMIL1791) following manufacturer's instructions. Briefly, 100~300ng total RNA were reverse transcribed using oligodT primers, followed by 2nd strand cDNA synthesis. The dsDNAs were then in vitro transcribed into biotin labelled complementary RNA (cRNA) at 37°C for 12 hours. The cRNAs were purified and quality analysed using Agilent Bioanalyzer 2100. The hybridizations were performed by the Eurofins Genomics AROS in Denmark. The samples were hybridized on Illumina MouseWG-6 v2 BeadChip. A signal intensity (expression) value and a detection p-value (whether the signal is above background) for each probe on the array was obtained using Illumina GenomeStudio software with standard settings. A total of 13,683 probes which had detection p-value <0.01 in at least three experiments were considered for further analysis. A variance-based filtering of gene expressions was performed using the genefilter package with variance cutoff of 0.75, leaving 3,421 probes for further statistical analysis. Unsupervised hierarchy clustering, generation of heatmap and PCA and ternary plot were carried out by means of R (https://www.R-project.org) using the following packages: cluster, pheatmap, FactoMineR, ggtern and RColorBrewer. The microarray data has been deposited in the GEO database under accession number GSE116640.
Embryo aggregation
E2.5 embryos were collected from superovulated F1 (CBA male cross with C57BL/6J female) females with M2 buffer (Sigma, M1767). After cultured in KSOM (Millipore, MR-020P-5F) for 15min, zona pellucidae were removed by Tyrode’s solution (Sigma, T1788) and embryos cultured in KSOM in aggregation plates prepared by aggregation needle (BLS, DN-10). Wildtype E14Tg2a ESCs and two independent Otx2 knockout cell lines (labelled with Flag-GFP) were used for aggregation. Cells were trypsinized (37 °C, 1min), washed and resuspended with GMEM/FCS medium. Each embryo was aggregated with 6-8 cell clumps and cultured in the incubator. The next day, good quality blastocyst were picked and transferred to E0.5 CD1 recipient 39.
Extended Data
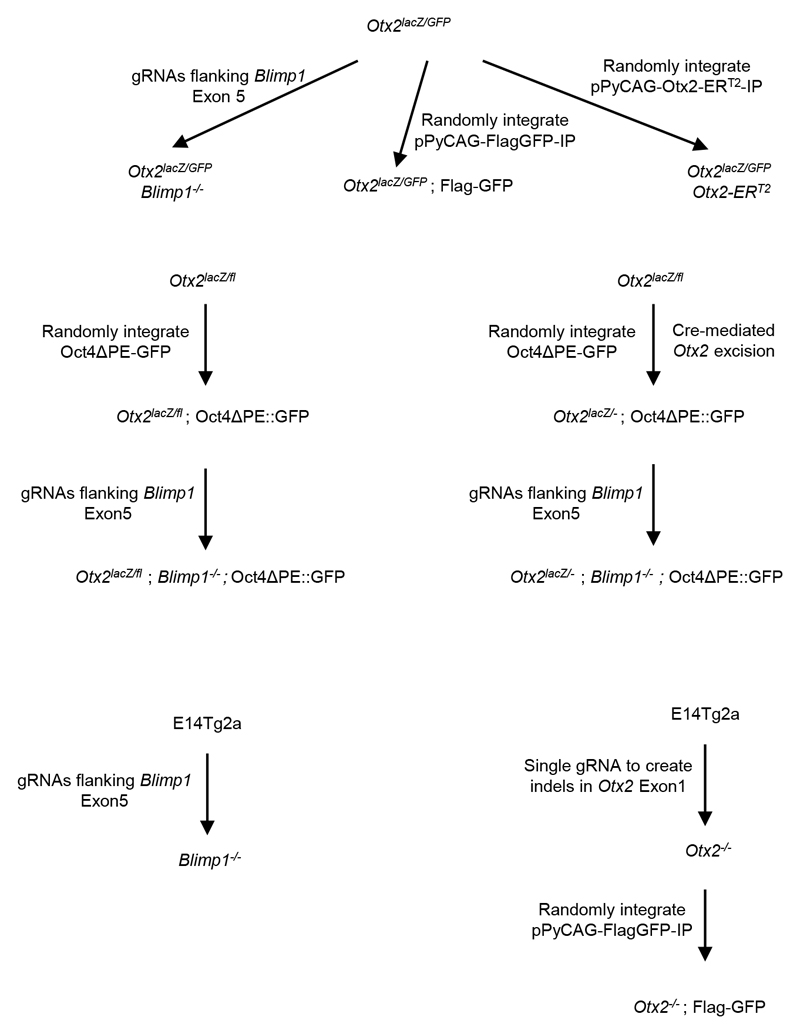
Extended Data Figure 1. Summary of cell lines used in this report.
Otx2lacZ/GFP and Otx2lacZ/fl ESCs have been described previously. Summarized below are further modifications to Otx2 or Blimp1, or transgene additions in the above or wild-type backgrounds. Further schematic details illustrating the points of Cas9 modification of Otx2 or Blimp1 and genotype verification of derived cell lines are shown in Extended Data Figure 3 or 6, respectively.
Extended Data Figure 2. Competence for germline entry is preceded by downregulation of OTX2 protein.
a. Representative cytospin images of OTX2, BLIMP1 and AP2γ staining using E14Tg2a aggregates after 1 day or 2 days of PGCLC differentiation. n=2. Scale bar; 100 μm.
b. Whole mount immunofluorescence of E14Tg2a aggregates after 1 (D1) or 2 days (D2) of differentiation of EpiLCs in the presence or absence of cytokines. Representative images of OTX2 and BLIMP1 are shown. n=3. Scale bar; 50 μm.
c. Magnified image of the region highlighted in b. Scale bar; 10 μm.
d. Quantitative transcript analysis of Otx2 in E14Tg2a cultures with (n=4) or without cytokines (n=7) at indicated time point (h, hours). Schematic illustration is shown in Figure 1b. Expression levels are normalised to TBP; Values are means±SD.
e. Top, primers used for Otx2 pre-mRNA transcript analysis are shown relative to the primary transcript structure. Bottom, quantitative transcript analysis of Otx2 pre-mRNA at the indicated times (minutes) after changing E14Tg2a EpiLCs into PGCLC medium. Expression levels are normalised to TBP and shown relative to expression at t = 0; Values are means±SD, n= 3 biologically independent replicates. f. Assessing the temporal requirement of cytokine treatment for efficient PGCLC induction. Aggregates of E14Tg2a EpiLCs treated with cytokines for 1 (d0-d1), 2 (d0-d2) or 6 days (d0-6) were assessed by flow cytometry for surface expression of SSEA1 and CD61 at day 6 of PGCLCs differentiation. n=3.
Extended Data Figure 3. Independent Otx2-/- clones show enhanced PGCLC induction efficiency.
a. The gating strategies for analysing PGCLCs by flow cytometry. Cells were first gated based on the FSC (size) and SSC (complexities) scatter plot, followed by selection for singlets based on linear correlations between FSC-area and FSC-height. Live cells were then gated based on exclusion of DAPI to indicate cell membrane integrity. Live cells were then analysed for SSEA1 and CD61. Cells stained for fluorescence minus one (FMO) were used to set gates; stained and non-stained cells are also shown.
b. Otx2lacZ/fl and Otx2 lacZ/- cells with the Oct4ΔPE::GFP reporter (2 independent clones each) were assessed by flow cytometry for surface expression of SSEA1 and CD61 at day6 of PGCLC differentiation. For clone 5 and clone 1, n=2; for clone 11and clone 2, n=9
c. Diagram showing the gRNA sequence (in red) and targeting strategy for generating Otx2 knockout cell lines. Red arrows represent genotyping primers used for screening clones.
d. Immunoblot analysis of OTX2 protein expression in EpiLCs of E14Tg2a and three Otx2-/- clones. Experiment preformed once.
e. E14Tg2a and 3 independent Otx2-/- clones generated by CRISPR/Cas9 were assessed by flow cytometry for surface expression of SSEA1 and CD61 at day 6 of PGCLC differentiation. 2 biologically independent experiments for clone c11, one for clone c17 and c19.
f. Q-RT-PCR of epiblast markers during the time-course outlined in Fig 1b. Expression levels are normalised to TBP; h, hours; Values are means±SD, n= 3 biologically independent replicates.
Extended Data Figure 4. OTX2 restricts PGC specification during the first 2 days of induction.
a. OTX2 immunofluorescence of Otx2lacZ/GFP::Otx2ERT2 ESCs before or after treatment with tamoxifen for 20min, n= 2 biologically independent experiments. Scale bar=20um.
b. Quantitative transcript analysis of T (Brachyury) during the time-course outlined in Figure 1b in basal GK15 medium supplemented with the indicated cytokines. Expression levels are normalised to TBP; Values are means±SD, n= 3 biologically independent replicates.
c. Quantitative transcript analysis of T (Brachyury), Hoxa1 and Hoxb1 during the time-course outlined in Figure 1b in indicated cell lines. Expression levels are normalised to TBP; values are means from 2 biologically independent replicates.
d. Left: scheme illustrating the strategy for induction or repression of wnt signalling. E14Tg2a EpiLCs were aggregated in the indicated media and transcripts analysed at 0, 9 and 18 hours. Right: Quantitative transcript analysis of T (Brachyury), Hoxa1, Hoxb1 and Otx2 during the time-courses outlined on the left. (h, hours). Expression levels are normalised to TBP; Values are means±SD, n= 3 biologically independent replicates.
e. Quantitative transcript analysis of T (Brachyury) Otx2, Blimp1 and Prdm14 during E14Tg2a differentiation in three different media conditions (GK15, without cytokines; PGCLC, GK15 with cytokines; PGCLC +XAV, GK15 with cytokines and with XAV939) at the indicated time point (h, hours). Expression levels are normalised to TBP; Values are means±SD, n= 3 biologically independent replicates. f. Whole mount immunofluorescence analysis of AP2γ and T (Brachyury) in E14Tg2a and Otx2lacZ/GFP day2 (D2) PGCLC aggregates. n=2 biological replicates. Scale bar; 50 μm.
g. Scheme illustrating tamoxifen administration schemes.
h. Otx2lacZ/GFP::Otx2ERT2 cells were assessed by flow cytometry for surface expression of SSEA1 and CD61 at days 6 of PGCLC differentiation following the tamoxifen treatment regime outlined (b). n=2 biological replicates.
Extended Data Figure 5. PGCLC differentiation of Otx2–null cells in the absence of cytokines.
a. Otx2lacZ/fl and Otx2lacZ/- cells carrying the Oct4ΔPE::GFP reporter (aggregates shown in Figure 3a) were assessed by flow cytometry for surface expression of SSEA1 and CD61 at day 6 of PGCLC differentiation in the absence of cytokines. n=7.
b. E14Tg2a and 3 independent Otx2-/- clones generated by CRISPR/Cas9 were assessed by flow cytometry for surface expression of SSEA1 and CD61 at day 6 of PGCLC differentiation in the absence of cytokines. 2 biologically independent experiments for clone c11, one for clone c17 and c19.
c. Quantitative transcript analysis of mRNAs encoding PGC TFs during differentiation without PGCLC cytokines at indicated time point. Expression levels are normalised to TBP; Values are means±SD, n= 3 biologically independent replicates.
d. Wholemount immunostaining of aggregates of Otx2lacZ/GFP cells at day 2 in the absence of cytokines for OTX2, BLIMP1 and AP2γ. Bar; 40μm. n=3.
Extended Data Figure 6. Transcriptome analysis of EpiLCs and day6 PGCLCs.
a-b. Heatmap of the normalized gene expression and and principal component analysis of microarray data (from 3 biologically independent replicates under 7 different conditions) ordered by unsupervised hierarchical clustering; rows correspond to transcripts and columns to cells. Differentiations performed in the presence (+Cyt) or absence (-Cyt) of cytokines are indicated. WT, E14Tg2a; O-/-, Otx2lacZ/GFP; O-/- B-/-, Otx2lacZ/GFP; Blimp1-/-.
Extended Data Figure 7. PGCLC induction of independent Blimp1-null cell lines.
a. Scheme showing the strategy used to generate Blimp1 KO cell lines. A pair of gRNAs flanking Blimp1 exon5 were co-expressed to ensure complete deletion of Blimp1 exon5. Red arrows represent genotyping primer pairs used to screen clones.
b, c. Blimp1-null clones used in Figure 3 (b) or Extended Figure 8d (c) were genotyped using primers indicated in a. n= 2 biologically independent replicates for both, all clones have been sequenced.
d. Cells of the indicated genotypes (c) were assessed by flow cytometry for surface expression of SSEA1 and CD61 at day 6 of aggregation in the presence of PGC induction cytokines. n=2
e-f. Cells of the indicated genotypes (c) were assessed by flow cytometry for surface expression of SSEA1 and CD61 at day 6 of aggregation in the absence of PGC induction cytokines. n=2
Extended Data Figure 8. Otx2-/-; Blimp1-/- PGCLCs activate PGC markers.
a. Quantitative analysis of somatic transcripts at day 2 of PGCLC induction in the indicated cell lines. Expression levels are normalised to TBP; Values are means ± SD; n=4 biological replicates, each dot represents the value from one experiment.
b. Quantitative analysis of PGC TF transcripts at day 2 of PGCLC induction in the indicated cell lines. Expression levels are normalised to TBP; Values are means ± SD; n=6 biological replicates for E14Tg2A and Otx2lazZ/GFP, and 4 for Blimp1 KO cell lines each dot represents the value from one experiment.
c. Immunofluorescence staining for OCT4 and DAZL of cryo-sections of Otx2lacZ/GFP and Otx2lacZ/GFP; Blimp1-/- aggregates at day6 of PGCLC induction. Bar; 50μm and 20μm. n= 2 biologically independent replicates.
d. OCT4, H3K27me3 and H3K9me2 immunofluorescence analysis of cryo-sections of E14Tg2a, Otx2lacZ/GFP and Otx2lacZ/GFP; Blimp1-/- aggregates at day6 of PGCLC induction. Bar; 50μm. n= 2 biologically independent replicates.
Extended Data Figure 9. OTX2 safeguards somatic lineages.
a. Representative morphologies and Oct4ΔPE::GFP expression of EpiSCs after 1 passage from EpiLCs (n=3 for 1 clone of each genotype). Bar; 200μm.
b, c. Flow cytometry analysis for surface expression of SSEA1 and CD61 at day 6 of PGCLC differentiation, initiated from EpiSCs after 1 passage from EpiLCs. For panel b, One experiment for c5 and c1 and 6 biologically independent replicates for C11 and C2; for panel c, n= 6 biologically independent replicates.
d. Quantitative transcript analysis of PGC TFs in the indicated cell lines. Expression levels are normalised to TBP; Values are means±SD, n= 3 biologically independent replicates., each dot represents the value from one experiment.
e. Comparison of the frequency of degree of chimaerism (top) and the germ cell numbers (bottom, centre lines and error bars represents means±SD.) in E7.5 chimaeric embryos formed using wildtype or Otx2-null ESCs. P value (two-tailed unpaired T-test, 0.95 confidence intervals) is indicated. High, > 70%; Moderate, 30 - 70%; Low, < 30%.
f. Bright field and representative images of E7.5 chimaeric embryos formed by wild-type host embryos and GFP labelled Otx2+/+ (n=6), Otx2-/- (n=9) or Otx2lacZ/GFP (n=9) ESCs assessed for GFP and BLIMP1/SOX2 expression, with magnified images of the proximal posterior regions. The proportion of BLIMP1-positive cells expressing GFP in the embryos is indicated. Bar, 100μm (left) and 20μm.
g. Summary of embryo aggregations.
Extended Data Figure 10. Otx2-null embryos exhibit increased number of PGCs.
a, b. Frontal-coronal (a) and sagittal (b) sections of wild type and Otx2-/- E7.5 embryos stained with Blimp1, AP2γ and Fragilis to detect PGCs. All sequential sections spanning the PGCLCs niche are shown. Bar; 50μm. The experiments were repeated in 4 wt and 3 Otx2KO embryos.
Supplementary Material
Supplementary Information is linked to the online version of the paper at www.nature.com/nature.
Acknowledgments
We thank Val Wilson and Donal O’Carroll for comments on the manuscript, Val Wilson for help with embryo staging, Nick Mullin for pre-mRNA analyses, Pedro Moreira for help with embryo transfer, the CRM animal house staff for husbandry, Fiona Rossi and Claire Cryer for FACS and Bertrand Vernay for confocal assistance. This research was funded by the Medical and the Biotechnological and Biological Sciences Research Councils of the UK (IC), by a PRIN project from MIUR (AS) and by the Qilu Young Scholars Program of Shandong University (DY).
Footnotes
Data Availability
All the datasets generated or analysed during the current study are available from the corresponding author on reasonable request.
Author Contributions
JZ, MZ and IC conceived the project and designed experiments. AS and DA provided reagents and advice. DY performed bioinformatics analysis. JZ and MZ performed experiments, with help from MV. JZ, MZ and IC analysed the data. IC wrote the paper with input from all authors.
Author Information
Reprints and permissions information is available at www.nature.com/reprints.
The authors declare no competing financial interests.
References
- 1.Ohinata Y, et al. A signaling principle for the specification of the germ cell lineage in mice. Cell. 2009;137:571–584. doi: 10.1016/j.cell.2009.03.014. [DOI] [PubMed] [Google Scholar]
- 2.Lawson KA, et al. Bmp4 is required for the generation of primordial germ cells in the mouse embryo. Genes & development. 1999;13:424–436. doi: 10.1101/gad.13.4.424. [DOI] [PMC free article] [PubMed] [Google Scholar]
- 3.Ohinata Y, et al. Blimp1 is a critical determinant of the germ cell lineage in mice. Nature. 2005;436:207–213. doi: 10.1038/nature03813. [DOI] [PubMed] [Google Scholar]
- 4.Vincent SD, et al. The zinc finger transcriptional repressor Blimp1/Prdm1 is dispensable for early axis formation but is required for specification of primordial germ cells in the mouse. Development. 2005;132:1315–1325. doi: 10.1242/dev.01711. [DOI] [PubMed] [Google Scholar]
- 5.Yamaji M, et al. Critical function of Prdm14 for the establishment of the germ cell lineage in mice. Nature genetics. 2008;40:1016–1022. doi: 10.1038/ng.186. [DOI] [PubMed] [Google Scholar]
- 6.Weber S, et al. Critical function of AP-2 gamma/TCFAP2C in mouse embryonic germ cell maintenance. Biology of reproduction. 2010;82:214–223. doi: 10.1095/biolreprod.109.078717. [DOI] [PubMed] [Google Scholar]
- 7.Johnson AD, Alberio R. Primordial germ cells: the first cell lineage or the last cells standing? Development. 2015;142:2730–2739. doi: 10.1242/dev.113993. [DOI] [PMC free article] [PubMed] [Google Scholar]
- 8.Extavour CG, Akam M. Mechanisms of germ cell specification across the metazoans: epigenesis and preformation. Development. 2003;130:5869–5884. doi: 10.1242/dev.00804. [DOI] [PubMed] [Google Scholar]
- 9.McLaren A. Primordial germ cells in the mouse. Developmental biology. 2003;262:1–15. doi: 10.1016/s0012-1606(03)00214-8. [DOI] [PubMed] [Google Scholar]
- 10.Surani MA, Hayashi K, Hajkova P. Genetic and epigenetic regulators of pluripotency. Cell. 2007;128:747–762. doi: 10.1016/j.cell.2007.02.010. [DOI] [PubMed] [Google Scholar]
- 11.Saitou M, Yamaji M. Primordial germ cells in mice. Cold Spring Harbor perspectives in biology. 2012;4 doi: 10.1101/cshperspect.a008375. [DOI] [PMC free article] [PubMed] [Google Scholar]
- 12.Hayashi K, Ohta H, Kurimoto K, Aramaki S, Saitou M. Reconstitution of the mouse germ cell specification pathway in culture by pluripotent stem cells. Cell. 2011;146:519–532. doi: 10.1016/j.cell.2011.06.052. [DOI] [PubMed] [Google Scholar]
- 13.Buecker C, et al. Reorganization of enhancer patterns in transition from naive to primed pluripotency. Cell stem cell. 2014;14:838–853. doi: 10.1016/j.stem.2014.04.003. [DOI] [PMC free article] [PubMed] [Google Scholar]
- 14.Yang SH, et al. Otx2 and Oct4 drive early enhancer activation during embryonic stem cell transition from naive pluripotency. Cell reports. 2014;7:1968–1981. doi: 10.1016/j.celrep.2014.05.037. [DOI] [PMC free article] [PubMed] [Google Scholar]
- 15.Acampora D, et al. Forebrain and midbrain regions are deleted in Otx2-/- mutants due to a defective anterior neuroectoderm specification during gastrulation. Development. 1995;121:3279–3290. doi: 10.1242/dev.121.10.3279. [DOI] [PubMed] [Google Scholar]
- 16.Ang SL, et al. A targeted mouse Otx2 mutation leads to severe defects in gastrulation and formation of axial mesoderm and to deletion of rostral brain. Development. 1996;122:243–252. doi: 10.1242/dev.122.1.243. [DOI] [PubMed] [Google Scholar]
- 17.Acampora D, Di Giovannantonio LG, Simeone A. Otx2 is an intrinsic determinant of the embryonic stem cell state and is required for transition to a stable epiblast stem cell condition. Development. 2013;140:43–55. doi: 10.1242/dev.085290. [DOI] [PubMed] [Google Scholar]
- 18.Acampora D, et al. Functional Antagonism between OTX2 and NANOG Specifies a Spectrum of Heterogeneous Identities in Embryonic Stem Cells. Stem cell reports. 2017;9:1642–1659. doi: 10.1016/j.stemcr.2017.09.019. [DOI] [PMC free article] [PubMed] [Google Scholar]
- 19.Nakaki F, et al. Induction of mouse germ-cell fate by transcription factors in vitro. Nature. 2013;501:222–226. doi: 10.1038/nature12417. [DOI] [PubMed] [Google Scholar]
- 20.Murakami K, et al. NANOG alone induces germ cells in primed epiblast in vitro by activation of enhancers. Nature. 2016;529:403–407. doi: 10.1038/nature16480. [DOI] [PMC free article] [PubMed] [Google Scholar]
- 21.Magnusdottir E, et al. A tripartite transcription factor network regulates primordial germ cell specification in mice. Nature cell biology. 2013;15:905–915. doi: 10.1038/ncb2798. [DOI] [PMC free article] [PubMed] [Google Scholar]
- 22.Smith A. Formative pluripotency: the executive phase in a developmental continuum. Development. 2017;144:365–373. doi: 10.1242/dev.142679. [DOI] [PMC free article] [PubMed] [Google Scholar]
- 23.Gunesdogan U, Surani MA. Developmental Competence for Primordial Germ Cell Fate. Current topics in developmental biology. 2016;117:471–496. doi: 10.1016/bs.ctdb.2015.11.007. [DOI] [PubMed] [Google Scholar]
- 24.Saitou M, Barton SC, Surani MA. A molecular programme for the specification of germ cell fate in mice. Nature. 2002;418:293–300. doi: 10.1038/nature00927. [DOI] [PubMed] [Google Scholar]
- 25.Yoshimizu T, et al. Germline-specific expression of the Oct-4/green fluorescent protein (GFP) transgene in mice. Development, growth & differentiation. 1999;41:675–684. doi: 10.1046/j.1440-169x.1999.00474.x. [DOI] [PubMed] [Google Scholar]
- 26.Zhang M, et al. Esrrb Complementation Rescues Development of Nanog-Null Germ Cells. Cell reports. 2018;22:332–339. doi: 10.1016/j.celrep.2017.12.060. [DOI] [PMC free article] [PubMed] [Google Scholar]
- 27.Aramaki S, et al. A mesodermal factor, T, specifies mouse germ cell fate by directly activating germline determinants. Developmental cell. 2013;27:516–529. doi: 10.1016/j.devcel.2013.11.001. [DOI] [PubMed] [Google Scholar]
- 28.Ben-Haim N, et al. The nodal precursor acting via activin receptors induces mesoderm by maintaining a source of its convertases and BMP4. Developmental cell. 2006;11:313–323. doi: 10.1016/j.devcel.2006.07.005. [DOI] [PubMed] [Google Scholar]
- 29.John SA, Garrett-Sinha LA. Blimp1: a conserved transcriptional repressor critical for differentiation of many tissues. Experimental cell research. 2009;315:1077–1084. doi: 10.1016/j.yexcr.2008.11.015. [DOI] [PubMed] [Google Scholar]
- 30.Kurimoto K, et al. Complex genome-wide transcription dynamics orchestrated by Blimp1 for the specification of the germ cell lineage in mice. Genes & development. 2008;22:1617–1635. doi: 10.1101/gad.1649908. [DOI] [PMC free article] [PubMed] [Google Scholar]
- 31.Hemmati-Brivanlou A, Melton D. Vertebrate embryonic cells will become nerve cells unless told otherwise. Cell. 1997;88:13–17. doi: 10.1016/s0092-8674(00)81853-x. [DOI] [PubMed] [Google Scholar]
- 32.Levine AJ, Brivanlou AH. Proposal of a model of mammalian neural induction. Developmental biology. 2007;308:247–256. doi: 10.1016/j.ydbio.2007.05.036. [DOI] [PMC free article] [PubMed] [Google Scholar]
- 33.Smith AG. Culture and differentiation of embryonic stem cells. Journal of tissue culture methods. 1991;13:89–94. doi: 10.1007/bf01666137. [DOI] [Google Scholar]
- 34.Zhang M, et al. Esrrb Complementation Rescues Development of Nanog -Null Germ Cells. Cell Reports. 2018;22:332–339. doi: 10.1016/j.celrep.2017.12.060. [DOI] [PMC free article] [PubMed] [Google Scholar]
- 35.Hayashi K, Saitou M. Generation of eggs from mouse embryonic stem cells and induced pluripotent stem cells. Nat Protoc. 2013;8:1513–1524. doi: 10.1038/nprot.2013.090. [DOI] [PubMed] [Google Scholar]
- 36.Lamprecht MR, Sabatini DM, Carpenter AE. CellProfiler: free, versatile software for automated biological image analysis. Biotechniques. 2007;42:71–75. doi: 10.2144/000112257. [DOI] [PubMed] [Google Scholar]
- 37.Gagliardi A, et al. A direct physical interaction between Nanog and Sox2 regulates embryonic stem cell self-renewal. The EMBO journal. 2013;32:2231–2247. doi: 10.1038/emboj.2013.161. [DOI] [PMC free article] [PubMed] [Google Scholar]
- 38.Schmittgen TD, Livak KJ. Analyzing real-time PCR data by the comparative C(T) method. Nat Protoc. 2008;3:1101–1108. doi: 10.1038/nprot.2008.73. [DOI] [PubMed] [Google Scholar]
- 39.Bronson RA, McLaren A. Transfer to the mouse oviduct of eggs with and without the zona pellucida. Journal of reproduction and fertility. 1970;22:129–137. doi: 10.1530/jrf.0.0220129. [DOI] [PubMed] [Google Scholar]
Associated Data
This section collects any data citations, data availability statements, or supplementary materials included in this article.


