

Abstract
In this study, we elucidate the changes in neural oscillatory processes that are induced by simple working memory tasks. A group of eight subjects took part in modified versions of the N-back and Sternberg working memory paradigms. Magnetoencephalography (MEG) data were recorded, and subsequently processed using beamformer based source imaging methodology. Our study shows statistically significant increases in θ oscillations during both N-back and Sternberg tasks. These oscillations were shown to originate in the medial frontal cortex, and further to scale with memory load. We have also shown that increases in θ oscillations are accompanied by decreases in β and γ band oscillations at the same spatial coordinate. These decreases were most prominent in the 20Hz – 40Hz frequency range, although spectral analysis showed that γ band power decrease extends up to at least 80Hz. β/γ power decrease also scales with memory load. Whilst θ increases were predominately observed in the medial frontal cortex, β/γ decreases were associated with other brain areas, including nodes of the default mode network (for the N-back task) and areas associated with language processing (for the Sternberg task). These observations are in agreement with intracranial EEG and fMRI studies. Finally, we have shown an intimate relationship between changes in β/γ band oscillatory power at spatially separate network nodes, implying that activity in these nodes is not reflective of uni-modal task driven changes in spatially separate brain regions, but rather represents correlated network activity. The utility of MEG as a non-invasive means to measure neural oscillatory modulation has been demonstrated and future studies employing this technology have the potential to gain a better understanding of neural oscillatory processes, their relationship to functional and effective connectivity, and their correspondence to BOLD fMRI.
Keywords: MEG, Network, theta, gamma, beamformer, oscillations, connectivity
Introduction
In various animal species, θ oscillations play a cardinal role in the recruitment of brain circuits for the purpose of processing information, but until relatively recently the role of θ oscillations during information processing in humans has remained largely unexplored (Tesche and Karhu, 2000; Kahana et al., 2001). Whereas in studies of rodents the major emphasis has been on hippocampal θ, intracerebral recordings reveal that in humans, activity during tasks such as spatial navigation, learning and memory occurs in widespread areas of neocortex (Caplan et al., 2001). Studies using MEG or EEG have demonstrated that θ oscillations arising from predominantly fronto-central sources are prominent during the maintenance phase of working memory (Jensen and Tesche, 2002; Onton et al., 2005). While some studies have reported that the amplitude of the oscillations increases with increasing memory load in at least some subjects (Jensen and Tesche, 2002) or some trials (Onton et al., 2005), not all studies have found such a relationship (Raghavachari et al., 2001; Payne and Kounios, 2009). Furthermore, larger θ synchronization during encoding has been found to predict successful memory retrieval (Klimesch et al., 2001).
Frontal θ oscillations have been linked with γ oscillations, which themselves are implicated strongly in cognitive processing. θ and γ oscillations have been measured using intracranial EEG (iEEG) in epileptic patients during a maze navigation task (Kahana et al., 1999). Successful recall in word memorisation tasks has been associated with coupling between the rhinal cortex and the hippocampus via 40 Hz γ oscillations (Fell et al., 2001) and with increased spectral power in both θ and γ bands (Burgess and Ali, 2002). Howard et al. (Howard et al., 2003) and Meltzer et al. (Meltzer et al., 2008) measured increases in γ activity with task difficulty using intracranial EEG. Moreover, Lisman and Idiart (Lisman and Idiart, 1995) have proposed a physiologically plausible mechanism for working memory (WM) in which memory items become active in each γ cycle within a θ cycle. In a recent study employing intracranial recording, (Axmacher et al., 2010) it has been shown that maintenance of an increasing number of items in working memory is associated with modulation of β/γ amplitude by θ activity in the hippocampus.
Neural oscillations are thought to play a central role in coordinating neural activity both in local networks (Gray et al., 1989; Womelsdorf et al., 2007) and over longer distances (von Stein et al., 2000). This network connectivity is thought to be the key to the way the human brain undertakes complex cognitive tasks. A great deal of evidence for the importance of brain networks comes from functional magnetic resonance imaging (fMRI). Here, temporal correlation between blood oxygenation level dependent (BOLD) timecourses extracted from distal brain regions is measured. Temporal correlation between areas, independent of a task, implies that brain activity in these regions is linked and this, in turn, suggests functional connectivity between those regions. It has been proposed that there is a default mode network (DMN) comprising brain areas associated with on-going ‘resting state’ brain function, these include medial frontal cortex, medial parietal cortex, and posterior parietal lobules. Numerous reports of BOLD fMRI measurements made in the resting state have shown functional connectivity between nodes of the DMN. Furthermore, fMRI experiments have shown task induced modulation of activity in the DMN; specifically, cognitive tasks induce negative BOLD changes, implying an attenuation of brain activity in the DMN during cognitive processing (Gusnard D.A. and Raichle, 2001) and that the DMN is most active during rest. This has fuelled a hypothesis that the DMN is associated with intrinsic, ongoing brain activity (e.g. introspection or daydreaming).
Despite a large fMRI literature and the established role of neural oscillations in mediating long range connectivity, there are relatively few reports of electrophysiological effects in the DMN. Recent papers by Laufs et al. (Laufs et al., 2003), and Mantini et al. (Mantini et al., 2007) have employed resting state concurrent EEG/fMRI measurements to show that neural oscillatory power correlates with BOLD in DMN. A recent MEG study (de Pasquale et al., 2009) has enabled independent elucidation of the spatial structure of DMN by applying a seed based correlation analysis to source space projected resting state MEG data. These reports have been amongst the first demonstrations that neural oscillations mediate the resting state network connectivity reported using fMRI. Reports of task induced change in neural oscillatory power in the DMN are also scarce. However, studies employing intracranial EEG to record local field potentials directly from the brain have begun to provide evidence that the task induced negative BOLD changes in DMN observed with fMRI reflect decreases in oscillatory power in the γ band. Intracerebral studies (Lachaux et al., 2008; Ossandon et al., 2009; Miller et al., 2009a; Jerbi et al., 2010; Ossandon et al., 2010) have shown that electrical activity in the γ band is reduced in the DMN nodes on initiation of an attention demanding task. This positive correlation between negative γ and negative BOLD activity is in strong agreement with a large body of evidence showing that task induced positive BOLD responses are related to increases in γ activity in other cortical regions (Logothetis et al., 2001; Singh, 2002; Brookes et al., 2005; Mukamel et al., 2005; Niessing et al., 2005; Lachaux et al., 2007; Muthukumaraswamy et al., 2009; Zumer et al., 2009).
The current study aims to use MEG to elucidate the neural oscillatory processes that are involved in working memory. We record MEG data in a group of 8 subjects during two separate, well characterised, working memory paradigms (modified N-back and Sternberg tasks). We test four specific hypotheses: 1) working memory paradigms will induce non-phase locked θ oscillations in the medial frontal cortex, the amplitude of which will scale with task difficulty; 2) increases in θ power will be accompanied by concomitant decreases in γ band power at the same medial frontal location, and that γ decrease will scale with task difficulty; 3) in agreement with intracranial EEG findings, decreases in γ band power on task initiation will not be limited to the medial frontal regions, but will be more widespread and found in brain areas that might interfere with the task, such as the nodes of the DMN; 4) distributed γ activity will exhibit network behaviour, meaning that single trials exhibiting low/high γ change at one network node, will exhibit similarly low/high γ change in the same trial at a separate network node.
Experimental Methods
Participants
Eight healthy volunteers (4 male and 4 female, age range 21-43) participated in the MEG N-back and Sternberg studies. The study was approved by the University of Nottingham Medical School Ethics Committee.
N-back and Sternberg WM Paradigms
The N-Back and Sternberg paradigms are shown schematically in Figure 1. In the N-back task a single trial comprised three phases in which letters were presented to the subject sequentially, one every 2s: in the ‘Two-Back’ phase the participant was asked to press a button (right index finger), when the current letter matched that presented 2 letters (4s) previously; in the ‘One-Back’ phase, the participant was asked to press the button when the current letter matched the previous letter; in the ‘Zero-Back’ phase the participant pressed the button when an ‘X’ was presented. Each phase lasted 32s during which a title screen (lasting 2s and stating which phase was to follow) was followed by 30s of the task. At the end of the three phases a 30s rest period was included making each trial 126s in duration. Twelve trials were presented and the phase order was randomised across trials. In the Sternberg task, each trial comprised 5 phases. Initially a blank screen was presented for 1.4s; following this a period of letter presentation was initiated (a single letter presented every 1.4s). Subjects were asked to hold those letters in short term memory for a maintenance period lasting 8s. After this a probe letter was presented and the subject was asked to press a button (right index finger) if the probe matched any of the previous letters. The trial concluded with a rest period, 8s in duration. There were three separate trial types (conditions) with the number of letters presented being varied (two, five or eight). Eighteen trials per condition were presented. Both the N-back and Sternberg tasks were controlled by ‘Presentation’ software (Neurobehavioral Systems). Instructions were given to participants before the experiment, and participants were allowed to practice outside the scanner until they were familiar with the task.
Figure 1.
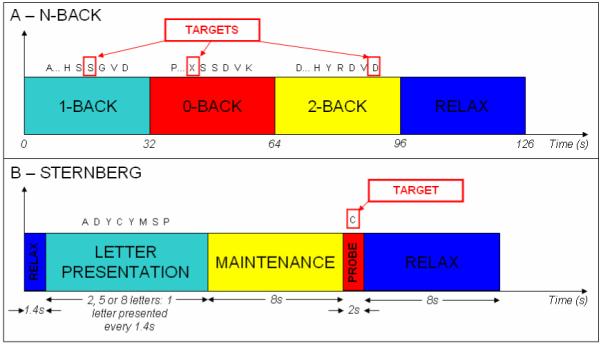
Schematic diagrams of A) The N-Back and B) the Sternberg tasks.
Data Acquisition
MEG data were acquired using a 275-channel CTF system (MISL, Coquitlam, Canada) in third order synthetic gradiometer configuration, with a sample rate of 600 Hz. The system is housed inside a magnetically shielded room and the paradigm was presented by projection through a waveguide onto a back projection screen located 30cm in front of the participant. Anatomical MR images were acquired (Philips 3T Achieva system running MPRAGE; 1mm isotropic resolution, 256×256×160 matrix, TR=8.1ms, TE=3.7ms, TI=960ms, shot interval=3s, flip angle=8° and SENSE factor 2). Prior to MEG acquisition, three electromagnetic coils were placed at three fiducial points on the participant’s head (nasion, left and right pre-auricular points) and digitisation of these fiducial points and the subjects head shape was carried out using a 3-D digitiser (Polhemus Isotrack). During MEG data acquisition, the location of the participant’s head within the MEG helmet was measured by energising these coils. The location of the MEG sensors was co-registered to the brain anatomy by matching the digitised head surface to the head surface extracted from the anatomical MR image.
Data Analysis
Initially, trials containing excessive noise were excluded, and baseline offsets were removed from channel level data on a trial by trial basis. Data were then analysed using an adaptive beamformer (Robinson and Vrba, 1998). Beamforming is a spatial filtering approach to MEG inverse modelling in which signals originating at a predetermined brain location are retained whilst signals originating elsewhere are suppressed. Output is based on a weighted sum of sensor measurements; weights are determined by minimisation of signal variance in a time-frequency window of interest with a constraint that variance originating at the location of interest is maintained. Weights are derived analytically using a forward field (a model of the fields measured in response to a unit current with known location/orientation) and an estimated channel-level covariance matrix. The output comprises a timecourse estimate of electrical activity at the location specified. Sequential application to all voxels yields a set of timecourses that can be further analysed to create volumetric images of change in electrical activity. The forward field was constructed based on a multi-sphere head model (Huang et al., 1999) and the derivation by Sarvas (Sarvas, 1987). MEG data were frequency filtered into bands of interest using a linear phase finite impulse response filter, implemented in the NUTMEG toolbox (http://nutmeg.berkeley.edu). Covariance estimates were created based on the unaveraged, frequency filtered dataset, ensuring optimal sensitivity to the effect of interest (Brookes et al., 2008). Covariance matrices were regularised as described previously (Robinson and Vrba, 1998). Weights were computed for a set of voxels on a regular 5mm grid spanning the entire brain. Source orientation for each voxel was based on a non-linear search for maximum variance.
Reconstructed time series for each voxel were Hilbert transformed to yield the analytic signal and the absolute value of the analytic signal was then computed to derive the envelope of changes in oscillatory amplitude – which we term the Hilbert envelope (Blackledge, 2003). This was averaged across trials. The spatial distribution of task related change in oscillatory activity was examined by comparing oscillatory amplitude in an active window, to that in a control window, on a voxel by voxel basis. For N-back, the active window was defined as the Two-Back phase while the control window was defined as the relax phase. For Sternberg, the active window was the maintenance period following the 8-letter presentation whilst the control window was the relax phase of the same condition. The mean amplitude of the Hilbert envelope during the active and control windows was computed and the difference between active and control normalised by a noise estimate yielding a pseudo-T-statistic. The statistical significance of brain regions exhibiting stimulus induced change in oscillatory power was assessed using a Monte-Carlo technique (Nichols and Holmes, 2002; Cheyne et al., 2003). For each voxel, 40 randomised pseudo-T-statistics were computed. These were calculated as described above, however on each iteration the active and control windows were randomly switched across trials. Randomised pseudo-T-statistics were computed for every voxel in the beamformer image. The significance value corresponding to the upper 5th percentile of the randomised pseudo-T-statistics for all voxels was then used to define a threshold for the beamformer images and thus identify voxels exhibiting statistically significant (p < 0.05) change in oscillatory amplitude. This was done on an individual subject basis. Finally, individual MR images, and corresponding beamformer images were co-registered to the standard brain using the fMRIB linear image registration tool (FLIRT) (www.fmrib.ox.ac.uk/fsl/flirt/). Thresholded images were overlaid and brain areas showing statistical significance across subjects were examined.
Having identified areas of interest using pseudo-T-statistical maps, further analysis of the time-frequency changes in brain oscillations, at locations of interest, were derived. The locations were derived based on pseudo-T-statistical images, with the same single MNI-coordinate being used for all subjects. For both tasks, MEG data were frequency filtered using band pass filters; 1Hz-4Hz, 4Hz-8Hz, 8Hz-13Hz, 13Hz-20Hz, 20Hz-25Hz, 25Hz-30Hz, 30Hz-40Hz, 40Hz-50Hz, 50Hz-60Hz, 60Hz-70Hz, and 70Hz-80Hz. Weights were constructed for locations of interest and the Hilbert envelope was derived for each band as described above. Resulting envelope signals were averaged across trials and concatenated in the frequency direction yielding a time-frequency (TF) spectrogram. In order to estimate the resting state spectrum, the amplitude of the Hilbert envelope in the relax phase was averaged across time and subtracted from the full spectrum, yielding a TF plot showing the difference with respect to the relax phase. This was done separately for the N-back and Sternberg paradigms. TF difference spectra were averaged across time for each phase of the task yielding a single difference spectrum per phase. Difference spectra were then averaged across subjects and the significance of changes in spectral amplitude assessed using a non-parametric Wilcoxon signed-rank test.
Finally, a trial by trial coupling metric was employed to interrogate the relationship between oscillatory amplitude change at different brain locations, or in different frequency bands. The average change in oscillatory power (with respect to the relax phase) was computed for a given frequency band and location, for every trial and for each subject. This resulted in either 96 (for N-back (8 subjects and 12 trials per subject)) or 144 (for Sternberg (8 subjects and 18 trials per subject)) independent measurements of oscillatory amplitude change. These measurements were made twice, either at two separate brain locations (A and B) within a single frequency band, or using two separate frequency bands (A and B) at a single location. Oscillatory amplitude change at A was plotted against equivalent change at B on a trial by trial basis. We then assessed the relationship between amplitude change across locations (or frequencies) on a trial by trial basis. Finally, to improve signal to noise and aid visualisation, groups of trials exhibiting similar power change at A were averaged together (groups of 12 being used for the N-back and Sternberg experiments).
Results
Subjects performed well in both the N-back and Sternberg tasks. In the N-back task, participants identified 99±1% of targets correctly for the zero-back phase, 98±2% of targets for the one-back phase and 91±8% of targets for the two-back phase. Reaction times increased with task difficulty being 460±40ms, 525±50ms and 612±65ms for zero-back, one-back and two-back respectively. In the Sternberg task participants identified 92±4% of targets correctly for 2 letter maintenance, 84±6% of targets for 5 letter maintenance and 75±7% of targets for 8 letter maintenance. Reaction times again increased with task difficulty being 865±30ms, 1035±30ms and 1100±30ms for 2, 5 and 8 letter maintenance respectively.
Figures 2A and B show pseudo-T-statistical maps depicting significant (p = 0.05) change in θ-power in a single subject for the N-back (A) and Sternberg (B) tasks. For N-back, a period of 2-back is contrasted with a period of rest whilst for Sternberg, the 8 letter maintenance period is contrasted with the rest period. The red overlay shows stimulus induced power increase whereas the blue overlay shows stimulus induced power decrease. Figure 2C shows common areas of significant change in θ power in 7 or more out of 8 subjects for the N-back task. Likewise, Figure 2D shows common areas of significant change in θ power in 5 or more out of 8 subjects for the Sternberg task. As predicted, a significant increase in frontal midline (fm) θ is observed for all 8 subjects in the N-back task. Results for Sternberg were similar, but less robust with only 6 out of 8 subjects showing overlapping significant increase in fmθ. The final two subjects exhibited no significant change in fmθ power in the Sternberg task.
Figure 2.

Spatial distribution of task induced changes in θ. A) Single subject N-back; B) Single subject Sternberg; C) Group N-back; D) Group Sternberg.
Figure 3 shows the oscillatory power change observed in medial frontal cortex across all frequencies. The location for cross-spectral analysis was derived independently for the N-back and Sternberg tasks, based on the functional images. The locations (equivalent for all subjects) were MNI(−2,36,32)mm for N-back and MNI(−6,46,36)mm for Sternberg, both coordinates are close to the frontal midline. Figure 3A shows the difference spectrum for the N-back task. On task initiation, a positive change in fmθ is observed, and accompanied by a concomitant decrease in oscillations in the high β and the γ frequency range. As the difficulty of the task (N) is increased, the amplitude of the change in θ oscillations is also increased; frontal θ amplitude varied between 0.10±0.03nAm 0.31±0.07nAm and 0.64±0.25nAm for the 0-back, 1-back and 2-back phases respectively. The differences between these measurements were statistically significant (p<0.05) across the subject group. The negative amplitude change in the β/γ (20Hz-40Hz) range was also dependent on task difficulty; β/γ change at the medial frontal location varied between 0.02±0.04nAm, −0.05±0.03nAm and −0.25±0.05nAm for the 0-back, 1-back and 2-back phases respectively and again this change was statistically significant (p<0.05). The relationship between the positive θ change and the negative change in the β/γ range is shown in Figure 3C. Figure 3E shows the TF spectra for the N-back task with prolonged changes in θ and β/γ oscillations apparent during task performance.
Figure 3.

Change in oscillatory power in the medial frontal lobe with respect to the resting phase: A and B show difference spectra for N-back and Sternberg respectively. C and D show the mean difference in spectral amplitude between maintenance and relax periods in the θ band plotted against the same measurement in the β/γ (20Hz – 40Hz) band. C and D show N-back and Sternberg results respectively. E shows TF difference spectra for the 3 N-back phases. F shows a TF spectrum for the 8-letter Sternberg task with the θ and high-β/low-γ Hilbert envelopes inset.
Figure 3B shows the difference spectrum for the Sternberg experiment. Despite the differences between the two tasks, a general similarity in the spectral distribution is observed with task induced increase in fmθ accompanied by negative changes in β and γ power. Once again the fmθ activity exhibits some modulation with task difficulty; the amplitude of θ oscillations was found to vary between 0.12±0.14nAm, 0.28±0.13nAm and 0.27±0.1nAm for the 2-letter, 5-letter and 8-letter maintenance respectively. Although this exhibits a similar trend to that observed in N-back, statistical significance across the subject group was not achieved. In agreement with N-back, β/γ modulation was most apparent for the more demanding of the tasks; β/γ change was found to be −0.05±0.04nAm, −0.07±0.4nAm and −0.18±0.05nAm for the 2-letter, 5-letter and 8-letter maintenance respectively. The relationship between the positive change in θ power and the decrease in β/γ power is shown in Figure 3D. Figure 3F shows the TF spectrum for the 8-letter Sternberg task. Again, θ increase and concomitant β/γ decrease are observed during the period in which subjects are expected to maintain the letters in memory.
Figure 4 shows results of our trial by trial coupling analysis, comparing the magnitude of spectral change in the θ band to that in the β/γ band (20-40Hz) in medial frontal cortex. Figure 4A shows the relationship for the N-back experiment; the upper panel shows all trials plotted individually whereas the lower panel shows trials grouped into sets of 12 (according to their θ power) and averaged. Notice that the difference between the three phases of the task is again observed with the 2-back (red) exhibiting a higher change in both θ and γ amplitude than either the 1-back or the 0-back. However, within a single phase there is no direct trial by trial correspondence between the magnitude of the θ band change and the magnitude of the β/γ band change. Figure 4B shows the equivalent result for the Sternberg experiment. Again the upper panel shows all trials plotted individually whereas the lower panel shows trials grouped into sets of 12 (according to their θ power) and averaged. As noted above, spectral changes were less robust across subjects for the Sternberg experiment compared to the N-back experiment and this is reflected in the plot. A trend can be observed with higher changes in θ and β/γ amplitude for the more demanding (8 letter maintenance) condition. However, in agreement with the N-back result, no direct correspondence is observed between the amplitude of θ changes and the amplitude of β/γ changes across trials.
Figure 4.
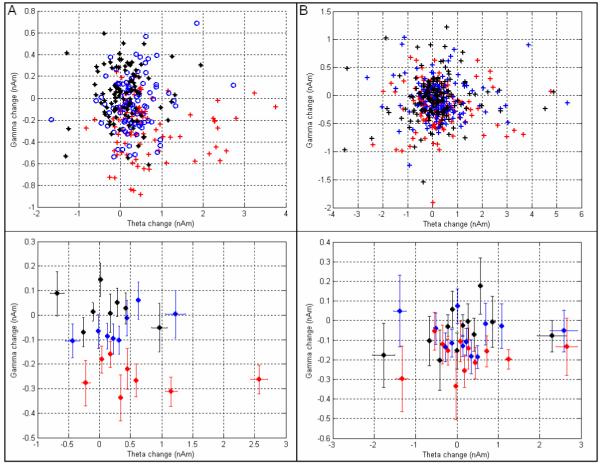
The relationship between the amplitude of θ and β/γ changes in the medial frontal cortex. A) N-back task. The red points show 2-back trials, the blue points show 1-back trials and the black points show 0-back trials. B) Sternberg task. The red points show 8 letter maintenance, the blue points show 5 letter maintenance and the black points show 2 letter maintenance. In both tasks the upper panels show the result for all trials; the lower panels show trials grouped into sets of 12 (according to θ power change) and averaged.
Figure 5 shows the spatial distribution of oscillatory power change in the β/γ range (20-40Hz for N-back and 15-40Hz for Sternberg based on difference spectra in Figure 3). In general the spatial signature of these β/γ changes was more variable across subjects than the equivalent results for θ. However, areas common to all subjects were observed and here, the blue overlay shows brain areas exhibiting significant task induced decrease in oscillatory power in 7 or more of our 8 participants. Figure 5A shows modulation for N-back with robust change in the medial frontal cortex accompanied by similar negative going changes in cingulate cortex, bilateral frontal operculum and the inferior parietal lobules. Figure 5B shows the equivalent spatial distribution for the Sternberg task. Here, power decreases in the medial frontal cortex are accompanied by bilateral frontal operculum, and language areas including left lateralised Wernicke’s area. The green overlay shows brain regions common to both tasks (i.e. significant in 7 or more participants in both the N-back and Sternberg tasks).
Figure 5.

Distribution of significant task induced changes in β and γ power. A) N-back; B) Sternberg. Green overlay shows areas common to both tasks. Note that the effects shown are all power decreases in the β/γ band. Whilst some positive effects were observed, they were not consistent on all subjects.
The relationship between β/γ oscillatory modulation in spatially separate brain areas was probed using our trial by trial coupling analysis. All of the brain areas selected for analysis were based on the images of β/γ change shown in Figure 5. Figure 6A shows results for the N-back experiment: the β/γ change in the medial frontal cortex plotted against the equivalent β/γ change in the left inferior parietal lobe. In the left hand plot, all trials are shown whereas in the right hand plot, trials are grouped into sets of 12. Likewise Figure 6B (also based on N-back) shows the β/γ change in the medial frontal cortex plotted against the β/γ change in the right inferior parietal lobe (Again, the left hand plot shows all trials; the right hand plot shows trials grouped into sets of 12). Trials representing the 2-back, 1-back and 0-back conditions are shown in red, blue and black respectively. Once again the differences between conditions are observed with the 2-back exhibiting a larger change than 1-back or 0-back at both locations. Most interestingly however, there is good correspondence between oscillatory amplitude change on a trial by trial basis, meaning that trials exhibiting high β/γ change in the medial frontal cortex in a single trial also exhibit a high β/γ change in the left and right inferior parietal lobules in the same trial. This is the case both within and across separate phases of the task. This correspondence implies that the brain areas identified by the functional images shown in Figure 5 are not simply uni-modal foci that respond individually to the task, but are intimately connected to form a network. It should be pointed out that in all computations of this type, care should be taken to ensure that these correlations are genuine, and do not result from correlated beamformer weighting parameters. In this case the correlation coefficient between beamformer weights in the 2 locations was explicitly computed; this value was found to be 0.04±0.10 for Figure 6A and −0.02±0.10 for Figure 6B. Such low correlation values imply that the close correspondence observed in the Figure is not due to inverse modelling artifact. Figure 6C shows β/γ change in medial frontal cortex plotted against β/γ change in Wernicke’s area for the Sternberg task. Trials representing the 8, 5 and 2 letter maintenance conditions are shown in red, blue and black respectively. In agreement with our N-back results, a close correspondence is observed implying network activity. For comparison, we show β/γ change in medial frontal cortex plotted against β/γ change in primary visual cortex for the Sternberg task. Primary visual cortex was not part of the network identified in Figure 5 and no correspondence was observed.
Figure 6.

Results of trial by trial coupling analysis between network nodes in the β/γ range. A) β/γ change in medial frontal cortex plotted against β/γ change in the left inferior parietal lobule for the N-back task. Significant linear modulation was observed both across phases of the task (r2 = 0.22; p = 3×10⁻¹⁷) and within single phases (e.g. 2 back; r2 = 0.18; p = 1.6×10⁻⁵). B) β/γ change in medial frontal cortex plotted against β/γ change in the right inferior parietal lobule, again for the N-back task. Significant linear modulation was observed (r2 = 0.1; p = 2×10⁻⁸ - all phases, r2 = 0.14; p = 0.0002 - 2-back). C) β/γ change in medial frontal cortex plotted against β/γ change in left lateralised language area for the Sternberg task ( r2 = 0.1; p = 3×10⁻¹² - all conditions, r2 = 0.16; p = 9×10⁻⁷ - 8-letter maintenance) D) β/γ change in medial frontal cortex plotted against β/γ change in primary visual cortex for the Sternberg task. Here, no significant modulation was observed ( r2 = 0.015; p = 0.01 - all conditions, r2 = 0.004; p = 0.44 - 8-letter maintenance). In all cases the left hand column shows the brain areas involved; the centre column shows the result for all trials; the right hand column shows trials grouped into sets of 12 (according to power change at the ACC) and averaged. All statistics are based on unaveraged data.
Finally, as shown above, neuro-electrical effects in both the θ and the β/γ frequency ranges were found to correlate with task difficulty. However there was no significant correlation with other behavioural results. Neither θ change nor β/γ change was found to be significantly altered in trials in which a correct answer was given, compared to trials in which an incorrect answer was given. However, in this study subjects made relatively few incorrect responses and so such analysis was made difficult due to insufficient trials. In addition, neither θ change nor β/γ change was found to correlate with subjects reaction time on a trial by trial basis.
Discussion
The brain’s oscillatory rhythms are believed to originate in the synchronous synaptic activity of a large number of neurons. These oscillations are thought to play a central role in the integration of brain activity across regions (Varela et al., 2001). Aberrant oscillatory activity has been observed in pathology (Schnitzler and Gross, 2005) and elucidation of the functional role played by oscillatory rhythms will be integral to our developing a complete understanding of brain electrodynamics. This study highlights the suitability of MEG as a non-invasive means to investigate changes in oscillatory activity during cognitive tasks. iEEG represents a gold standard in electrodynamic brain measurement and boasts an excellent signal to noise ratio. However, measurements are highly invasive, they lack whole brain coverage, and they are only performed on patients with potentially confounding neurological disorders. The signal to noise ratio of MEG is less than that of iEEG, particularly at high frequency. Further, the ill-posed inverse problem means that spatial resolution is limited. However MEG is non-invasive, enables whole brain coverage and MEG results are largely reflective of those obtained using iEEG (Dalal et al., 2009). Furthermore, unlike electric fields, magnetic fields are not distorted by inhomogeneous conductivity in the head. This, coupled with the high number of sensors (~300 in modern systems) and advanced source reconstruction algorithms give MEG a vastly improved spatial resolution compared to surface EEG measurements. This makes MEG the most attractive non-invasive means to measure neural oscillations and enables sufficient spatial specificity to characterise the spatio-temporal signature of the brain networks involved in cognitive processing.
Our study has demonstrated increased fmθ activity during the N-Back and Sternberg tasks. θ oscillations are known to be associated with both episodic and working memory (Sauseng et al., 2010). We show that θ power not only increased in the task condition with respect to rest, but also modulated with task difficulty. This is particularly apparent for the N-back task in which significant modulation in θ power was observed between task phases, with the two-back phase eliciting the highest response. These findings are consistent with a previous MEG study (Jensen and Tesche, 2002); with results from EEG studies (Gevins et al., 1997; Onton et al., 2005); and with a recent combined EEG/fMRI study (Michels et al., 2010) in which the contrast between θ activity during a high load and low load condition revealed significant differences in medial frontal cortex. In light of the evidence that BOLD in medial frontal cortex measured using fMRI is negatively correlated with memory load (Michels et al., 2010), our finding is consistent with the evidence from combined EEG/fMRI studies (Scheeringa et al., 2008; Michels et al., 2010) suggesting that θ is negatively correlated with BOLD signal in the medial frontal cortex. In contrast, a separate study (Raghavachari et al., 2001) observed that θ during retention was not modulated by memory load and instead reported that θ exhibited a ‘gating’ response at distributed neural sites, increasing to a stable level following the initiation of a memory trial and falling on the cessation of the final encoding stimulus. Payne and Kounios observed load-modulated effects in θ coherence between frontal and parietal sites but not in frontal θ power (Payne and Kounios, 2009). On balance, while there is considerable evidence that fmθ power increases with memory load during working memory retention, the circumstances necessary for producing this modulation and the most sensitive measure of this modulation remain to be fully determined.
We have also shown that β/γ activity, at the same medial frontal co-ordinate, decreased on task initiation. Power decreases in the β/γ range also modulated with task difficulty, with the largest decreases observed during the most demanding phases of both the N-back and the Sternberg tasks. Although these oscillatory power decreases were most prominent in the 20Hz-40Hz frequency band, it is worth noting that, in figure 3, modulation can be observed up to 80Hz implying a broad-band response. This has also been demonstrated in the motor cortex in recent work (Miller et al., 2009b) which, using invasive electrode recordings, proposed that activity is mediated not by γ oscillations in a specific band, but by a general shift in amplitude of broad-band power. It is noteworthy that in a combined EEG-fMRI study (Michels et al., 2010) observed positive correlations between γ and BOLD but these were predominantly in the vicinity of regions in lateral prefrontal cortex in which BOLD signal increases with increasing memory load.
Our results partially support a hypothesis that θ and β/γ oscillations are linked. Changes in θ and γ oscillatory amplitude were found at the same spatial coordinate and θ and γ amplitude were both found to modulate with working memory load. However, we did not find a relationship between trial by trial variation in θ and γ amplitude. This is likely to be due to the way in which a relationship was sought from our data. The proposal by Lisman and Idiart (Lisman and Idiart, 1995) that items held in working memory become active in each γ cycle within a θ cycle suggests that the relevant relationship might be a modulation of γ amplitude by θ phase. In a study employing intracranial recording (Axmacher et al., 2010), it was demonstrated that maintenance of an increasing number of items in working memory is associated with modulation of β/γ amplitude by θ phase in the hippocampus. Using intra-cerebral electrodes Canolty and colleagues (Canolty et al., 2006) found that θ phase modulated the amplitude of high frequency γ (above 80 Hz) in human neocortex, and furthermore that different behavioural task were associated with γ modulation in different regions. Using surface EEG recordings, Demiralp and colleagues demonstrated that the phase of event-related θ oscillations modulates the amplitude of γ oscillations at approximately 40 Hz in the occipital cortex during visual perception (Demiralp et al., 2007). Thus it is plausible that the interaction between θ and γ in medial frontal cortex during working memory entails the modulation of γ amplitude by θ phase and not a simple amplitude-amplitude coupling relationship. As yet it is unclear whether sufficient signal to noise is achievable in MEG to measure phase-amplitude coupling in relatively deep locations such as those integral to DMN. This remains an issue to be addressed in future studies.
Whilst positive changes in θ are seen predominantly in frontal areas, negative changes in the β/γ range are also observed in other brain regions. The spatial distribution of significant change in the β/γ band was more variable across subjects than the θ band modulation, however common areas in all subjects were observed in both tasks. For N-back, robust modulation occurred in medial frontal cortex, cingulate cortex, bilateral frontal operculum and the left and right parietal lobes. This spatial signature is, in part, indicative of the default mode network. There were similarities between the two tasks; the medial frontal cortex, bilateral frontal operculum and the left temporal and parietal lobe were observed in 7 out of 8 subjects for both tasks. However, the characteristic DMN signature, inclusive of cingulate cortex and posterior parietal lobules was not observed for the Sternberg task.
It is tempting to speculate that the decrease in oscillatory amplitude observed in both our N-back and Sternberg tasks is related to attenuation of activity in networks of brain areas that may interfere with the task. During both tasks there is suppression of activity in the frontal operculum bilaterally. Evidence from fMRI indicates that the frontal operculum plays a critical role in initiating control signals that engage executive processing networks in response to external stimuli (Sridharan et al., 2008). The observation of β/γ suppression in the frontal operculum suggests that activity in this region is suppressed during the maintenance of working memory to prevent re-orienting to distracting events. It has been proposed that the DMN is associated with on-going information processing and activity in this network attenuates during cognitive tasks. Previous studies (Meltzer et al., 2007; Scheeringa et al., 2008) using combined EEG/fMRI suggest that DMN activity is attenuated by θ oscillations insofar as an increase in fmθ power was associated with a decrease in BOLD in those areas. Our N-back results imply that activity in the DMN, which is mediated by oscillations in the β/γ frequency range is switched off on task initiation. This notion is supported by fMRI results showing negative BOLD changes in the DMN during cognitive tasks (Gusnard D.A. and Raichle, 2001). Our results are also supported by invasive electrophysiology results (Lachaux et al., 2008; Ossandon et al., 2009; Miller et al., 2009a; Jerbi et al., 2010; Ossandon et al., 2010) reporting decreases in oscillatory activity in the γ band on initiation of cognitive tasks in brain areas that may interfere with the task, in particular the default mode network. In our Sternberg experiment, the characteristic DMN signature was not apparent. However, this difference could be explained by fundamental differences between the tasks, which emphasise different cognitive processes. During N-Back, the participant needs to remember and retrieve letters throughout the task whilst during Sternberg, memory processes are to some degree demarcated. In the 2-Back phase, in addition to participants remembering a letter presented 4 s earlier, they also need to suppress the memory of a letter presented 2s earlier to ensure that it is not mistaken for a target. However, memory of this intervening letter can not be lost completely as it may itself become a target as the task continues. This implies that more than just working memory is required since such manipulation would require both WM and control, which implies more executive demand in N-back compared to Sternberg.
A recent study (de Pasquale et al., 2009) has shown significant correlation between the amplitude envelope of oscillatory activity at spatially separate nodes of the DMN in the resting state. This was one of the first studies to show an electrophysiological basis to resting state DMN connectivity thus supporting the idea that haemodynamic functional connectivity measurements are mediated by neural oscillations. Our results shown in Figure 6 suggest that the β/γ modulation observed in the brain regions implicated by our working memory paradigms is not reflective of uni-modal task driven changes in spatially separate brain regions, but rather represent correlated network activity. This supports the idea that network connectivity is mediated by neural oscillations. In particular our N-back results presented in figures 6A and 6B implicate network behaviour in the DMN during the task positive state. This result complements that of de Pasquale and colleagues in showing resting state DMN connectivity. Our trial by trial correlation metric is a simple and effective way to measure brain network activity. However, neither the precise mechanism of the electrical connectivity, nor the direction of information flow between networks nodes can be assessed. Coherence (Gross et al., 2001), imaginary coherence (Nolte et al., 2004), phase lag index (Stam et al., 2007) and synchronisation likelihood (Stam and van Dijk, 2002) all represent ways of measuring functional connectivity in MEG data, whilst Granger causality (Granger, 1969) and dynamic causal modelling (Friston et al., 2003; Chen et al., 2008) represent ways to measure effective connectivity. Future work may employ these methods to gain a better understanding of the nature of the network activity that we elucidate here.
In light of our primary hypotheses regarding fmθ and potentially correlated γ activity, we examined the full spectrum of activity only in the medial frontal region. As shown in figure 3, we did not observe substantial changes in the α band in this region. However, our analysis does not exclude the possibility that signals in the alpha band in other brain regions play an important role in working memory. It should be noted that several studies have reported load-dependent increases in alpha activity in posterior regions during working memory tasks (Jensen et al., 2002; Tuladhar et al., 2007; Zumer et al., 2009). However, an increase in alpha power with increasing load is not observed consistently. In a recent study of 18 participants, 9 exhibited load-related alpha power increases at EEG electrode Pz, while the other 9 exhibited alpha power decreases (Michels et al., 2008). The precise nature of interaction between the θ and β/γ effects that we report in the medial frontal cortex, and the alpha band effects reported in other literature therefore remains a topic for further investigation.
Finally, as stated above MEG relies on synchronous activity in cell assemblies, and it has been shown that at high frequencies, the degree of synchrony is significantly reduced (see e.g. (Dalal et al., 2009; Jerbi et al., 2009)). This means that in the high γ frequency band, MEG results can suffer from low SNR. Here we show that γ band effects, whilst maximal for the 30-40Hz band, extended up to 80Hz. In our N-back study, further analysis of 40Hz – 80Hz activity showed power loss during the 2-back phase compared to rest in the medial frontal cortex, cuneus, precuneus and posterior cingulate cortex. Such spatial structure implicates the DMN and is in agreement with intracranial EEG findings and our 20-40Hz analysis. However, these effects were significant in only 6 out of our 8 subjects. Further their spatial signature was somewhat confounded since at low SNR, the full width at half maximum of the point spread function of beamformer spatial filters is known to be increased anisotropically around true source locations. This confound of low SNR could be eliminated by the use of further experimental trials. Invasive studies are beginning to show that activity in the high γ band is an effective index of neural activity (Jerbi et al., 2009). Future studies employing MEG should therefore investigate carefully the SNR in this frequency range.
Conclusion
Our study has provided evidence for statistically significant increases in θ oscillations during both N-back and Sternberg working memory tasks. These oscillations were shown to originate in the medial frontal cortex, and further they scale with memory load. We have also shown that increases in θ oscillations are accompanied by decreases in β and γ band oscillations at the same spatial coordinate. These decreases were most prominent in the 20Hz – 40Hz frequency range, although spectral analysis showed that γ band power decrease extends up to 80Hz. β/γ power decrease also scales with memory load. Whilst θ increases were predominately observed in the medial frontal cortex, β/γ decreases were associated with other brain areas, including nodes of the default mode network (for the N-back task) and areas associated with language processing (for the Sternberg task). These observations are in agreement with intracranial EEG studies showing decreased γ band activity during cognitive tasks, and with fMRI studies showing negative BOLD in DMN during cognitive tasks. It is therefore tempting to speculate that brain activity in these regions, which is mediated by activity in the β/γ range, is being attenuated on task initiation. We have shown an intimate relationship between changes in β/γ band oscillatory power at spatially separate network nodes, implying that activity in these nodes is not reflective of uni-modal task driven changes in spatially separate brain regions, but rather represents correlated network activity. This work agrees with BOLD fMRI findings showing functional connectivity between DMN network nodes. Finally, the utility of MEG as a non-invasive means to measure neural oscillatory modulation has been demonstrated and future studies employing this technology have the potential to gain a better understanding of neural oscillatory processes, their relationship to functional and effective connectivity, and their correspondence to BOLD fMRI measurements.
Acknowledgements
We thank the Leverhulme Trust for an Early Career Fellowship awarded to MJB. We also gratefully acknowledge the Medical Research Council, the Wellcome trust, The University of Nottingham, NIH grants RO1 DC004855, DC006435, DC010145, NS067962, NS64060 and NSF grant BCS-0926196.
Appendix – Phase-locked vs. non-phase-locked θ
The time-frequency decomposition of an evoked potential shows a brief power increase at low frequencies, typically in the θ range. This occurs because a θ-band sinusoid can be fitted to the evoked response signal which means that non-phase locked θ band power increase can be mistaken for evoked activity. In the case of our N-back experiment where stimuli are repeated once every 2 seconds, it is highly possible that a prolonged increase in θ oscillations, as reported above in figure 3, could also represent a series of evoked responses and it is important to test the non-phase locked nature of such effects.
We assessed the possible contribution of phase-locked responses to our θ measurement by employing additional analysis. For measurement of non-phase locked θ power, raw MEG data are filtered into the 4Hz-8Hz band and projected into the brain. A timecourse of electrical activity is extracted from medial frontal cortex; these timecourses are then Hilbert transformed to obtain the Hilbert envelope and the envelope is averaged across trials. Such measures comprise both phase-locked and non-phase-locked power. In order to assess the phase-locked component, this process was repeated but the electrical timecourse was averaged prior to computation of the Hilbert envelope. Since non-phase-locked θ oscillations will be attenuated by averaging the raw timecourse, if averaging prior to envelope computation has no effect on the θ timecourse, it is likely that our θ response represents a phase-locked evoked response, and not non-phase-locked induced oscillations.
Figure A1A shows time-frequency difference spectra for the two-back phase of the task (with respect to the relax phase). In the left hand panel, timecourses are Hilbert transformed prior to averaging across trials. In the right hand panel, timecourses are averaged across trials prior Hilbert transformation. The attenuation of the θ band response afforded by averaging across trials is clear in the plot suggesting that the θ response observed in figure three comprises non-phase locked oscillations. Figure A1B shows difference spectra, averaged across time for the two-back phase. Whilst a similar trend is apparent, the attenuation of oscillatory power in the θ (and β/γ) bands with averaging is apparent.
Figure A1.
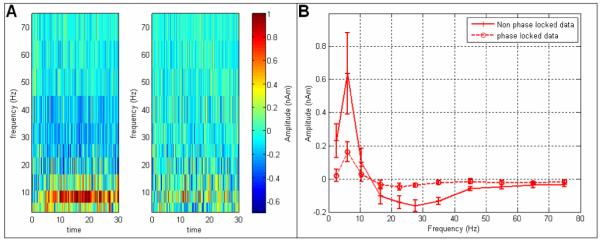
Phase locked vs non-phase locked θ power. A) Time-frequency difference spectra for the two-back phase of the task. In the left hand panel, timecourses are Hilbert transformed prior to averaging across trials. In the right hand panel, timecourses are averaged across trials prior Hilbert transformation. B) Difference spectra, averaged across time for the two-back phase of the task.
Nonetheless the similarity of the spectra shown in figure A1B raises the possibility that, since a θ-band sinusoid can be fitted to the evoked response signal, in many information processing tasks transient event-related oscillations contribute to evoked activity. This is consistent with published work (Basar et al., 2001) showing that transient oscillations govern many cognitive processes. It is possible that both the induced and evoked oscillations arise from overlapping neural circuits.
REFERENCES
- Axmacher N, Henseler MM, Jensen O, Weinreich I, Elger CE, Fell J. Cross-frequency coupling supports multi-item working memory in the human hippocampus. Proceedings of the National Academy of Science USA. 2010;107:3228–3233. doi: 10.1073/pnas.0911531107. [DOI] [PMC free article] [PubMed] [Google Scholar]
- Basar E, Basar-Eroglu C, Karakas S, Schurmann M. Gamma, alpha, delta, and theta oscillations govern cognitive processes. International Journal of Psychophysiology. 2001;39:241–248. doi: 10.1016/s0167-8760(00)00145-8. [DOI] [PubMed] [Google Scholar]
- Blackledge JM. Digital signal processing. Horwood Publishing; Chichester: 2003. [Google Scholar]
- Brookes MJ, Vrba J, Robinson SE, Stevenson CM, Peters AP, Barnes GR, Hillebrand A, Morris PG. Optimising experimental design for MEG beamformer imaging. NeuroImage. 2008;39:1788–1802. doi: 10.1016/j.neuroimage.2007.09.050. [DOI] [PubMed] [Google Scholar]
- Brookes MJ, Gibson AM, Hall SD, Furlong PL, Barnes GR, Hillebrand A, Singh KD, Holliday IE, Francis ST, Morris PG. GLM-beamformer method demonstrates stationary field, alpha ERD and gamma ERS co-localisation with fMRI BOLD response in visual cortex. Neuroimage. 2005;26:302–308. doi: 10.1016/j.neuroimage.2005.01.050. [DOI] [PubMed] [Google Scholar]
- Burgess AP, Ali L. Functional connectivity of gamma EEG activity is modulated at low frequency during conscious recollection. International Journal of Psychophysiology. 2002;46:91–100. doi: 10.1016/s0167-8760(02)00108-3. [DOI] [PubMed] [Google Scholar]
- Canolty RT, Edwards E, Dalal SS, Soltani M, Nagarajan SS, Kirsch HE, Berger MS, Barbaro NM, Knight RT. High Gamma Power Is Phase-Locked to Theta Oscillations in Human Neocortex. Science. 2006;313:1626–1628. doi: 10.1126/science.1128115. [DOI] [PMC free article] [PubMed] [Google Scholar]
- Caplan JB, Madsen JR, Raghavachari S, Kahana MJ. Distinct patterns of brain oscillations underlie two basic parameters of human maze learning. J Neurophysiol. 2001;86 doi: 10.1152/jn.2001.86.1.368. [DOI] [PubMed] [Google Scholar]
- Chen CC, Kiebel SJ, Friston KJ. Dynamic causal modelling of induced responses. NeuroImage. 2008;41:1293–1312. doi: 10.1016/j.neuroimage.2008.03.026. [DOI] [PubMed] [Google Scholar]
- Cheyne D, Gaetz W, Garnery L, Lachaux J-P, Ducorps A, Schwartz D, Varela F. Neuromagnetic imaging of corticaloscillations accompanying tactile stimulation. Cognitive Brain Research. 2003;17:599–611. doi: 10.1016/s0926-6410(03)00173-3. [DOI] [PubMed] [Google Scholar]
- Dalal SS, Baillet S, Adam C, Ducorps A, Schwartz D, Jerbi K, Bertrand O, Garnero L, Martinerie J, Lachaux J. Simultaneous MEG and intracranial EEG recordings during attentive reading. NeuroImage. 2009;45:1289–1304. doi: 10.1016/j.neuroimage.2009.01.017. [DOI] [PubMed] [Google Scholar]
- de Pasquale F, Della Penna S, Snyder AZ, Lewis C, Mantini D, Marzetti A, Belardinelli P, Ciancetta L, Pizzella V, Romani GL, Corbetta M. Temporal dynamics of spontaneous MEG activity in brain networks. Proceedings of the National Academy of Science USA. 2009;107:6040–6045. doi: 10.1073/pnas.0913863107. [DOI] [PMC free article] [PubMed] [Google Scholar]
- Demiralp T, Bayraktaroglu Z, Lenz D, Junge S, Busch NA, Maess B, Ergen M, Herrmann CS. Gamma amplitudes are coupled to theta phase in human EEG during visual perception. International Journal of Psychophysiology. 2007;64:24–30. doi: 10.1016/j.ijpsycho.2006.07.005. [DOI] [PubMed] [Google Scholar]
- Fell J, Klaver P, Lehnertz K, Grunwald T, Schaller C, Elger CE, Fernandez G. Human memory formation is accompanied by rhinal-hippocampal coupling and decoupling. Nature Neuroscience. 2001;4:1259–1264. doi: 10.1038/nn759. [DOI] [PubMed] [Google Scholar]
- Friston KJ, Harrison L, Penny W. Dynamic causal modelling. NeuroImage. 2003;19:1273–1302. doi: 10.1016/s1053-8119(03)00202-7. [DOI] [PubMed] [Google Scholar]
- Gevins A, Smith ME, McEvoy L, Yu D. High-resolution EEG mapping of cortical activation related to working memory: effects of task difficulty, type of processing, and practice. Cerebral Cortex. 1997;7:374–385. doi: 10.1093/cercor/7.4.374. [DOI] [PubMed] [Google Scholar]
- Granger CWJ. Investigating causal relations by econometric models and cross-spectral methods. Econometrica. 1969;37:424–438. [Google Scholar]
- Gray CM, Konig P, Engel AK, Singer W. Oscillatory responses in cat visual cortex exhibit intercolumnar synchronization which reflects global stimulus properties. Nature. 1989;338:334–337. doi: 10.1038/338334a0. [DOI] [PubMed] [Google Scholar]
- Gross J, Kujala J, Hamalainen M, Timmermann L, Schnitzler A, Salmelin R. Dynamic imaging of coherent sources: Studying neural interactions in the human brain. Proceedings of the National Academy of Science USA. 2001;98:694–699. doi: 10.1073/pnas.98.2.694. [DOI] [PMC free article] [PubMed] [Google Scholar]
- Gusnard DA, Raichle ME. Searching for a baseline: functional imaging and the resting human brain. Nature Reviews: Neuroscience. 2001;2:685–692. doi: 10.1038/35094500. [DOI] [PubMed] [Google Scholar]
- Howard MW, Rizzuto DS, Caplan JB, Madsen JR, Lisman J, Aschenbrenner-Scheibe R, Schilze-Bonhage A, Kahana MJ. Gamma oscillations correlate with working memory load in humans. Cerebral Cortex. 2003;13:1369–1374. doi: 10.1093/cercor/bhg084. [DOI] [PubMed] [Google Scholar]
- Huang MX, Mosher JC, Leahy RM. A sensor-weighted overlapping-sphere head model and exhaustive head model comparison for MEG. Physics in Medicine and Biology. 1999;44:423–440. doi: 10.1088/0031-9155/44/2/010. [DOI] [PubMed] [Google Scholar]
- Jensen O, Tesche CD. Frontal theta activity in humans increases with memory load in a working memory task. European Journal of Neuroscience. 2002:1395–1399. doi: 10.1046/j.1460-9568.2002.01975.x. [DOI] [PubMed] [Google Scholar]
- Jensen O, Gelfand J, Kounios J, Lisman JE. Oscillations in the alpha band (9-12 Hz) increase with memory load during retention in a short-term memory task. Cerebral Cortex. 2002;12:877–882. doi: 10.1093/cercor/12.8.877. [DOI] [PubMed] [Google Scholar]
- Jerbi K, Vidal JR, Ossandon T, Dalal SS, Jung J, Hoffmann D, Minotti L, Bertrand O, Kahane P, Lachaux JP. Exploring the electrophysiological correlates of the default□mode network with intracerebral EEG. Frontiers in Systems Neuroscience. 2010;4 doi: 10.3389/fnsys.2010.00027. [DOI] [PMC free article] [PubMed] [Google Scholar]
- Jerbi K, Ossandonn T, Hamame CM, Senova S, Dalal SS, Jung J, Minotti L, Bertrand O, Berthoz A, Kahane P, Lachaux J. Task-Related Gamma-Band Dynamics From an Intracerebral Perspective: Review and Implications for Surface EEG and MEG. Human Brain Mapping. 2009;30:1758–1771. doi: 10.1002/hbm.20750. [DOI] [PMC free article] [PubMed] [Google Scholar]
- Kahana MJ, Seelig D, Madsen JR. Theta returns. Curr Opin Neurobiol. 2001;11:739–744. doi: 10.1016/s0959-4388(01)00278-1. [DOI] [PubMed] [Google Scholar]
- Kahana MJ, Sekuler R, Caplan JB, Kirschen M, Madsen JR. Human theta oscillations exhibit task dependence during virtual maze navigation. Nature. 1999;399:781–784. doi: 10.1038/21645. [DOI] [PubMed] [Google Scholar]
- Klimesch W, Doppelmayr M, Yonelinas A, Kroll NE, Lazzara M, Rohm D, Gruber W. Theta synchronisation during episodic retrieval: neural correlates of conscious awareness. Brain Research - Cognitive Brain Research. 2001;12:33–38. doi: 10.1016/s0926-6410(01)00024-6. [DOI] [PubMed] [Google Scholar]
- Lachaux JP, Fonlupt P, Kahane P, Minotti L, Hoffmann D, Bertrand O, Baciu M. Relationship between task-related gamma oscillations and BOLD signal: new insights from combined fMRI and intracranial EEG. Human Brain Mapping. 2007;28:1368–1375. doi: 10.1002/hbm.20352. [DOI] [PMC free article] [PubMed] [Google Scholar]
- Lachaux JP, Jung J, Mainy N, Dreher JC, Bertran O, Baciu M, Minotti L, Hoffmann D, Kahane P. Silence Is Golden: Transient Neural Deactivation in the Prefrontal Cortex during Attentive Reading. Cerebral Cortex. 2008;18:443–450. doi: 10.1093/cercor/bhm085. [DOI] [PubMed] [Google Scholar]
- Laufs H, Kleinschmidt A, Beyerle A, Eger E, Salek-Haddadi A, Preibisch C, Krakow K. EEG-correlated fMRI of human alpha activity. Neuroimage. 2003;19:1463–1476. doi: 10.1016/s1053-8119(03)00286-6. [DOI] [PubMed] [Google Scholar]
- Lisman JE, Idiart MAP. Storgae of 7 +/− 2 short-term memories in oscillatory subcycles. Science. 1995;267:1512–1514. doi: 10.1126/science.7878473. [DOI] [PubMed] [Google Scholar]
- Logothetis NK, Pauls J, Augath M, Trinath T, Oeltermann A. Neurophysiological investigation of the basis of the fMRI signal. Nature. 2001;412:150–157. doi: 10.1038/35084005. [DOI] [PubMed] [Google Scholar]
- Mantini D, Perucci MG, Del Gratta C, Romani GL, Corbetta M. Electrophysiological signatures of resting state networks in the human brain. Proceedings of the national acedemy of science USA. 2007;104:13170–13175. doi: 10.1073/pnas.0700668104. [DOI] [PMC free article] [PubMed] [Google Scholar]
- Meltzer JA, Negishi M, Mayes LC, Constable RT. Individual differences in EEG theta and alpha dynamics during working memory correlate with fMRI responses across subjects. Clinical Neurophysiology. 2007;118:2419–2436. doi: 10.1016/j.clinph.2007.07.023. [DOI] [PMC free article] [PubMed] [Google Scholar]
- Meltzer JA, Zaveri HP, Goncharova II, Distasio MM, Papademetris X, Spencer SS, Spencer DD, Constable RT. Effects of working memory load on oscillatory power in human intracranial EEG. Cerebral Cortex. 2008;18:1843–1855. doi: 10.1093/cercor/bhm213. [DOI] [PMC free article] [PubMed] [Google Scholar]
- Michels L, Moazami-Goudarzi M, Jeanmonod D, Sarnthein J. EEG alpha distinguishes between cuneal and precuneal activation in working memory. Neuroimage. 2008;40:1296–1310. doi: 10.1016/j.neuroimage.2007.12.048. [DOI] [PubMed] [Google Scholar]
- Michels L, Bucher K, Luchinger R, Klaver P, Martin E, Jeanmonod D, Brandeis D. Simultaneous EEG-fMRI during a Working Memory Task: Modulations in Low and High Frequency Bands. PLoS One. 2010;5:e10298. doi: 10.1371/journal.pone.0010298. doi:10210.11371/journal.pone.0010298. [DOI] [PMC free article] [PubMed] [Google Scholar]
- Miller KJ, Weaver KE, Ojemann JG. Direct electrophysiological measurement of human default network areas. PNAS. 2009a;106:12174–12177. doi: 10.1073/pnas.0902071106. [DOI] [PMC free article] [PubMed] [Google Scholar]
- Miller KJ, Zanos S, Fetz EE, den Nijs M, Ojemann JG. Decoupling the cortical power spectrum reveals real-time representations of individual finger movements in humans. Journal of Neuroscience. 2009b;29:3132–3137. doi: 10.1523/JNEUROSCI.5506-08.2009. [DOI] [PMC free article] [PubMed] [Google Scholar]
- Mukamel R, Gelbard H, Arieli A, Hasson H, Fried I, Malach R. Coupling Between Neuronal Firing, Field Potentials, and fMRI in Human Auditory Cortex. Science. 2005;309:951–954. doi: 10.1126/science.1110913. [DOI] [PubMed] [Google Scholar]
- Muthukumaraswamy SD, Edden RAE, Jones DK, Swettenham JB, Singh KD. The level of GABAergic inhibition predicts peak gamma frequency and fMRI amplitude in humans. Proceedings of the National Academy of Sciences, USA. 2009;106:8356–8361. doi: 10.1073/pnas.0900728106. [DOI] [PMC free article] [PubMed] [Google Scholar]
- Nichols TE, Holmes AP. Non-parametric permutation tests for functional neuroimaging: a primer with examples. Human Brain Mapping. 2002;15:1–25. doi: 10.1002/hbm.1058. [DOI] [PMC free article] [PubMed] [Google Scholar]
- Niessing J, Ebisch B, Schmidt KE, Niessing M, Singer Q, Galuske RAW. Hemodynamic Signals Correlate Tightly with Synchronized Gamma Oscillations. Science. 2005;309:948–951. doi: 10.1126/science.1110948. [DOI] [PubMed] [Google Scholar]
- Nolte G, Bai O, Wheaton L, Mari Z, Vorbach S, Hallett M. Identifying true brain interaction from EEG data using the imaginary part of coherency. Clinical Neurophysiology. 2004;115:2292–2307. doi: 10.1016/j.clinph.2004.04.029. [DOI] [PubMed] [Google Scholar]
- Onton J, Delorme A, Makeig S. Frontal midline EEG dynamics during working memory. NeuroImage. 2005;27:341–356. doi: 10.1016/j.neuroimage.2005.04.014. [DOI] [PubMed] [Google Scholar]
- Ossandon T, Jerbi K, Bayle D, Bertrand O, Kahane P, Lachaux JP. Society for Neuroscience. Chicago: 2009. Task-related gamma band suppressions: A plausible electrophysiological correlate of the default-mode network? [Google Scholar]
- Ossandon T, Jerbi K, Vidal J, Bayle D, Bertrand O, Kahane P, Dalal SS, Lachaux J. Investigation of gamma activity suppression as an electrophysiological correlate of BOLD deactivation in the default-mode network; Front Neurosci Conference Abstract: Biomag 2010 - 17th International Conference on Biomagnetism; 2010; doi: 10.3389/conf.fnins.2010.06.00441. [Google Scholar]
- Payne L, Kounios J. Coherent oscillatory networks supporting short-term memory retention. Brain Research - Cognitive Brain Research. 2009;1247:126–132. doi: 10.1016/j.brainres.2008.09.095. [DOI] [PMC free article] [PubMed] [Google Scholar]
- Raghavachari S, Kahana MJ, Rizzuto DS, Caplan JB, Kirschen MP, Bourgeois B, Madsen JR, Lisman JE. Gating of human theta oscillations by a working memory task. Journal of Neuroscience. 2001;21:3175–3183. doi: 10.1523/JNEUROSCI.21-09-03175.2001. [DOI] [PMC free article] [PubMed] [Google Scholar]
- Robinson S, Vrba J. Functional Neuroimaging by synthetic aperture magnetometry. Tohoku University Press; Sendai: 1998. [Google Scholar]
- Sarvas J. Basic mathematical and electromagnetic concepts of the biomagnetic inverse problem. Physics in Medicine and Biology. 1987;32:11–22. doi: 10.1088/0031-9155/32/1/004. [DOI] [PubMed] [Google Scholar]
- Sauseng P, Griesmayr B, Freunberger R, Klimesch W. Control mechanisms in working memory: A possible function of EEG theta oscillations. Neuroscience and Biobehavioral Reviews. 2010;34:1015–1022. doi: 10.1016/j.neubiorev.2009.12.006. [DOI] [PubMed] [Google Scholar]
- Scheeringa R, Bastiaansen MCM, Petersson KM, Oostenveld R, Norris DG, Hagoort P. Frontal theta EEG activity correlates negatively with the default mode network in resting state. International Journal of Psychophysiology. 2008;67:242–251. doi: 10.1016/j.ijpsycho.2007.05.017. [DOI] [PubMed] [Google Scholar]
- Schnitzler A, Gross J. Normal and pathological oscillatory communication in the brain. Nature Reviews Neuroscience. 2005;6 doi: 10.1038/nrn1650. [DOI] [PubMed] [Google Scholar]
- Singh KD, Barnes GR, Hillebrand A, Forde EM, Williams AL. Task related changes in cortical synchrony are spatially coincident with the haemodynamic response. Neuroimage. 2002;16:103–114. doi: 10.1006/nimg.2001.1050. [DOI] [PubMed] [Google Scholar]
- Sridharan D, Levitin DJ, Menon V. A critical role for the right fronto-insular cortex in switching between central-executive and default-mode networks. PNAS. 2008:12569–12574. doi: 10.1073/pnas.0800005105. [DOI] [PMC free article] [PubMed] [Google Scholar]
- Stam CJ, van Dijk BJ. Synchronization likelihood: an unbiased measure of generalized synchronization in multivariate data sets. Physica D. 2002;163:236–251. [Google Scholar]
- Stam CJ, Nolte G, Daffertshofer A. Phase Lag Index: Assessment of Functional Connectivity From Multi Channel EEG and MEG With Diminished Bias From Common Sources. Human Brain Mapping. 2007;28:1178–1193. doi: 10.1002/hbm.20346. [DOI] [PMC free article] [PubMed] [Google Scholar]
- Tesche CD, Karhu J. Theta Oscillations Index Human Hippocampal Activation During a Working Memory Task. Proceedings of the National Academy of Science USA. 2000;97:919–924. doi: 10.1073/pnas.97.2.919. [DOI] [PMC free article] [PubMed] [Google Scholar]
- Tuladhar AN, Huurne N, Schoffelen JM, Maris E, Oostenveld R, Jensen O. Parieto-Occipital Sources Account for the Increase in Alpha Activity with Working Memory Load. Human Brain Mapping. 2007:785–792. doi: 10.1002/hbm.20306. [DOI] [PMC free article] [PubMed] [Google Scholar]
- Varela F, Lachaux J-P, Rodriguez E, Martinerie J. The brainweb: Phase synchronization and large-scale integration. Nature Reviews Neuroscience. 2001;2 doi: 10.1038/35067550. [DOI] [PubMed] [Google Scholar]
- von Stein A, Chiang C, Konig P. Top-down processing mediated by interareal synchronization. PNAS. 2000;97:14748–14753. doi: 10.1073/pnas.97.26.14748. [DOI] [PMC free article] [PubMed] [Google Scholar]
- Womelsdorf T, Schoffelen JM, Oostenveld R, Singer W, Desimone R, Engel AK, Fries P. Modulation of neuronal interactions through neuronal synchronization. Science. 2007;316:1609–1612. doi: 10.1126/science.1139597. [DOI] [PubMed] [Google Scholar]
- Zumer JM, Stevenson CM, Brookes MJ, Francis ST, Morris PG. Deconvolved fMRI correlates with source-localised MEG as a function of neural frequency oscillation. Neuroimage. 2009;49:1479–1489. [Google Scholar]