Abstract
Introduction:
One of the major challenges in cancer treatment is the lack of specific and accurate treatment in cancer. Data analysis can help to understand the underlying molecular mechanism that leads to better treatment. Increasing availability and reliability of DNA microarray data leads to increase the use of these data in a variety of cancers. This study aimed at applying and evaluating microarray data analyzing, identification of important pathways and gene network for medulloblastoma patients to improve treatment approaches especially target therapy.
Methods:
In the current study, Microarray gene expression data (GSE50161) were extracted from Geo datasets and then analyzed by the affylmGUI package to predict and investigate upregulated and downregulated genes in medulloblastoma. Then, the important pathways were determined by using software and gene enrichment analyses. Pathways visualization and network analyses were performed by Cytoscape.
Results:
A total number of 249 differentially expressed genes (DEGs) were identified in medulloblastoma compared to normal samples. Cell cycle, p53, and FoxO signaling pathways were indicated in medulloblastoma, and CDK1, CCNB1, CDK2, and WEE1 were identified as some of the important genes in the medulloblastoma.
Conclusion:
Identification of critical and specific pathway in any disease, in our case medulloblastoma, can lead us to better clinical management and accurate treatment and target therapy.
Keywords: Medulloblastoma, computational biology, differentially expressed genes, KEGG pathways-protein
Introduction
Medulloblastoma (MB) tumors classify as a embryonal tumors of central nervous system which occurs most frequently in children with the rate of 15-20% (Bloom et al., 1969; Northcott et al., 2012). They are commonly found in children between the ages of three and eight, with a higher occurrence in males (Rutkowski et al., 2010). Medulloblastoma patients indicate a low rate of survival and higher mortality (Armstrong et al., 2009; Edelstein et al., 2011). The exact etiology of medulloblastoma has not yet been determined in most cases, however, it seems that its pathogenesis factors include the following: Genetic factors, Head injury, N-nitroso compounds, electromagnetic field exposure and Race (Gilbertson, 2004). Remarkable genomic heterogeneity among medulloblastomas patients have been demonstrated by recent genome-wide profiling studies that provide evidence for the existence of molecular subclasses within medulloblastoma that shows different respond to treatment, in fact paying attention to these subclasses may lead to a better outcome in medulloblastoma treatment (Kool et al., 2012; Taylor et al., 2012). Recently, methods for treatment of patients with medulloblastoma are consist of the common methods using for any other cancers treatment, such as radiotherapy, chemotherapy, and surgery (Van Dyk et al., 1977; Cumberlin et al., 1979). But all of these methods do not provide targeted and accurate treatment for medulloblastoma also, these methods are followed by many other Side effects for patients. For these reasons, target therapy is considered as a today’s challenge and issue in aim to finding better treatment outcome for cancer. In this type of treatment, molecular targets are commonly used, such as genes, signaling pathways, and proteins (Kesari et al., 2005; Movafagh et al., 2007; He et al., 2017). Thus, identification and do a right action for treatment of patients in medulloblastoma can be effective and help to better treatment and a high survival rate (Rossi et al., 2008; Huse and Holland, 2010).
A medical researcher is interested in Bioinformatics methods and statistical analysis to predict and determine the underlying pathways and mechanisms and achieve distinct treatment for many diseases (Yeh et al., 2006; Huang et al., 2008a; Elbers et al., 2009). These biological mechanisms help physicians and drug designers to overcome health care problems and decrease the mortality level. In this regard, data analysis and its applications can be more effective, if used properly. Therefore the application of data analysis on medulloblastoma data sets, do the appropriate test and extract useful output can develop therapeutic methods.
One of the recent techniques in which many studies using is microarray data analysis, Gene set enrichment analysis (GSEA) and pathway analysis to recognize set of the most important genes, their ontology, and pathways in any disease pathogenesis, which can be used as a target for target therapy (Hong et al., 2009; Peng et al., 2010). Using these new technologies in medulloblastoma may play a pivotal role in the treatment processes and an effective therapeutic strategy.
Several Bioinformatics tools are proposed for microarray data analysis, GSEA and pathway analysis. Gene set enrichment analysis (GSEA) (also functional enrichment analysis) is a method to identify classes of genes or proteins that are over-represented in a large set of genes or proteins and may have an association with disease phenotypes. There are many tools for Functional GSEA study, including Broad Institute and FunRich (Pathan et al., 2015; Das and Bhattacharya, 2017).
Pathway analysis tools offer intuitive bioinformatics tools for the visualization, interpretation, and analysis of pathway in order to support basic research, genome analysis, modeling, systems biology, and education. There are several databases for a pathway analyzing including, PANTHER, Reactome, and KEGG (Zhong et al., 2010; Dabaghian et al., 2015).
Cytoscape is a powerful and popular software platform for both visualizing complex networks and integrating these with any type of attribute data. Its additional features are available as plugins. Plugins perform network and molecular profiling analyses, new layouts, additional file format support and connection with databases and searching in large networks. It customizes network data showing by using powerful visual styles. Cytoscape can analyze large network of approximately more than 100 thousand nodes by its rendering engine (Shannon et al., 2003; Cline et al., 2007; Kohl et al., 2011).
Regarding the importance and critical role of medulloblastoma and its treatment as well as the understanding the effective role of pathways, it seems essential to investigate the specific pathway and use the appropriate bioinformatics tool. This current study aimed at using bioinformatics tools to predict the important pathways in medulloblastoma that can hold a value for target based therapeutic means.
Materials and Methods
Microarray gene expression data analyses
Microarray gene expression data (GSE50161) of 22 medulloblastoma patients and 13 healthy individuals were extracted from NCBI Gene Expression Omnibus (GEO) database, which based on GPL570 ([HG-U133_Plus_2] Affymetrix Human Genome U133 Plus 2.0 Array, Affymetrix Inc, Denver, USA) and deposited by Donson et al., (2014) and Griesinger et al., (2013). This data was submitted in September 2013 and updated in January 2018. Gene expression profiles were generated from surgical tumor and normal brain samples (n=35) using Affymetrix HG-U133plus2 chips (Platform GPL570). This data was analyzed by the affylmGUI package in R program and created unnormalized data, then these data were normalized by Robust Multiarray Average (RMA) algorithm using the Affy package in Bioconductor (Wettenhall et al., 2006). |logFC| ≥1 and a P value <.05 were considered as threshold values. In this step, the normalized box plot was drowned to investigate samples differences and MA plot was used to approve sample normalization. Next, all normalized and appropriate data were analyzed by the linear method, that all result was demonstrated through the volcano plot and differential expression (logfc). Through this analyses, differentially expressed genes (DEGs) were determined and then genes were sorted for their p-value (a P-value of <0.05 was considered statistically significant) and log fold change (logfc greater than 4 and less than -4 was considered) to determine the specific genes in medulloblastoma tumors.
Construction of Protein-Protein Interaction (PPI) network
STRING (Search Tool for the Retrieval of Interacting Genes/Proteins) database compose of experimental data, computational prediction method, and using several classification systems including GO, KEGG, and Pfam to show protein-protein interaction network. The STRING visualizes protein networks and shows the biological relationships of these gene products. In the present research, protein interaction analysis was performed by using Cytoscape (STRING tool kit) to understand DEGs network (p<0.05 and coefficient=0.7 were significant) (Shannon et al., 2003; Szklarczyk et al., 2016).
Gene enrichment analysis
FunRich is a stand-alone software tool that is used for functional enrichment of the gene set. Also, FunRich (Version 3.1.3) can leverage the Gene Ontology (GO) to determine the biological processes, protein domains and cellular components represented in the gene profile. In this study, DEGs that their protein product was associated with each other, were selected and analyzed to investigate the function of DEGs. A p-value of < 0.05 was considered significant (Pathan et al., 2015).
Pathway analysis
The Database for Annotation, Visualization and Integrated Discovery (DAVID) is a bioinformatics tool to investigate the biological meaning behind a list of genes. BiNGO, a Cytoscape plugin, provides specific data to facilitate the interception of biological meaning of experimental data. For this step, we used data from STRING analysis, so that we select the genes that their protein products are associated with each other. Finally, their related pathways were indicated and visualized by using the DAVID database and BiNGO tool kit. In all analyses, a P-value of <0.05 was considered statistically significant (Movafagh et al., 2011; Huang et al., 2008b; Huang et al., 2008a).
Predictions of miRNA-target genes and their enrichment analysis
The regulatory elements miRNA of DEGs was extracted from validated miRNAs-target databases including miRTarBase and TarBase. Furthermore, the molecular functions of the target genes of miRNA were identified by using the FunRich software (Pathan et al., 2015; Khazaei Koohpar et al., 2015).
Results
Differentially Expressed Gene (DEGs) in medulloblastoma
All data were normalized and had suitable quality and value according to the q-q plot and box plot (Figure 1). Volcano plot was also designed to show expression changes (Figure 2). After data correction and normalization, a total of 21,051 genes was identified in 22 medulloblastoma samples.
Figure 1.
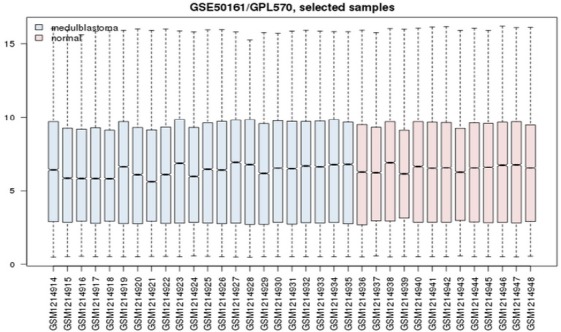
Box Plot of Samples Data. The lateral axis represents the names of samples, and the longitudinal axis represents the genes. Red represents normal samples and blue represents medulloblastoma samples.
Figure 2.
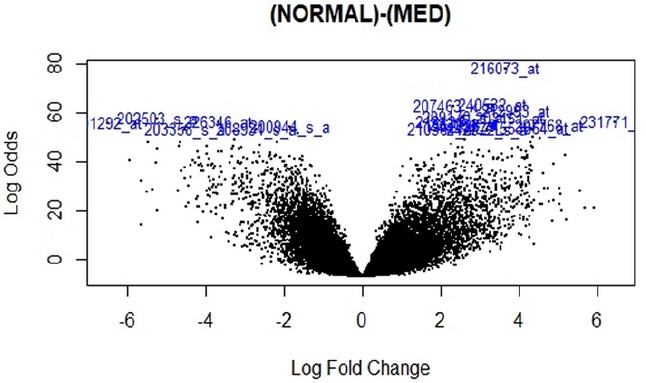
Volcano Plot of Genes Data. The blue represents both large magnitude fold-changes (x-axis) (logfc>10) and high statistical significance (-log10 of p-value, y-axis).
Based on the analysis, a total of 249 DEG compose of 145 genes had been expressed highly and about 104 genes had been shown to decrease expression in medulloblastoma. The p-value<0.05 was as a threshold value.
Protein network and gene enrichment analyses
Interaction analyses were shown 238 nodes, 51 edges, 0.429 average node degree and 0.106 Avg. Local clustering coefficient for DEGs in medulloblastoma (PPI enrichment p-value= 1.0e-16) (Figure 3). Approximately 53 proteins were found that they had interacted together.
Figure 3.
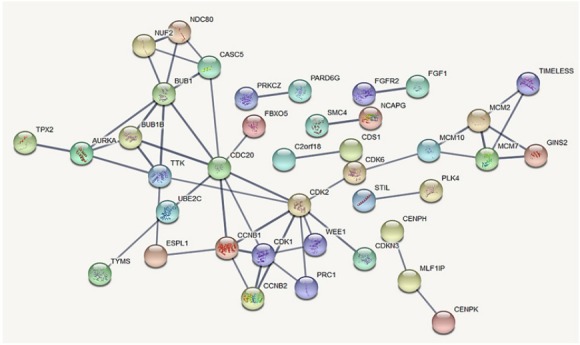
Protein-Protein Interaction of DEGs. The thickness of the edge indicates a strong interaction between the two proteins
FunRich arranged the DEGs that interact with each other according to STRING analysis, into two functional categories including, biological processes and cellular component. The parameters for interception of biological processes were indicated in Figure 4. The blue chart for a percentage of genes, the yellow chart for p-value=0.05 reference and the red chart for showing the p-value were determined. Overall, biological processes were included in the mitotic cell cycle, DNA replication, cell cycle checkpoint and mitotic M-M/G1 phases, in which 73.1% and 57.7% belong to the mitotic cell cycle (p<0.001) and DNA replication (p<0.001) (Figure 4). The gene expressions involved in mitotic cell cycle and DNA replication processes might play a significant role in the initiation and progression of medulloblastoma.
Figure 4.
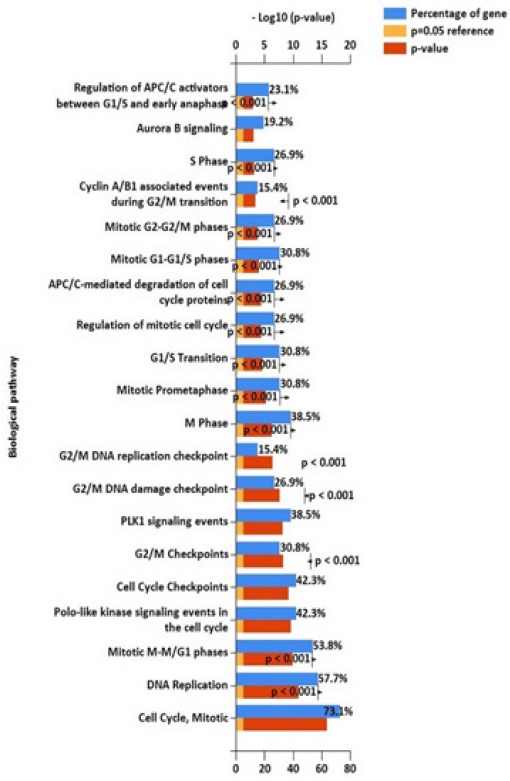
Biological Processes of DEGs. 73.1% of DEGs involve in cell cycle and 57.7% of DEGs play a role in DNA replication (p<0.001).
The 82.1% percent of the cellular component of DEGs was the nucleus (p-value=0.005) (Figure 5). 51.9 percentages of the genes had a coiled-coil domain which is found in oncoprotein and transcriptional factors (p-value=0.217). A significant domain in DEGs Mad3-BUB1 (p-value=0.003), which is crucial for preventing cell and play an important role in mitotic checkpoint.
Figure 5.
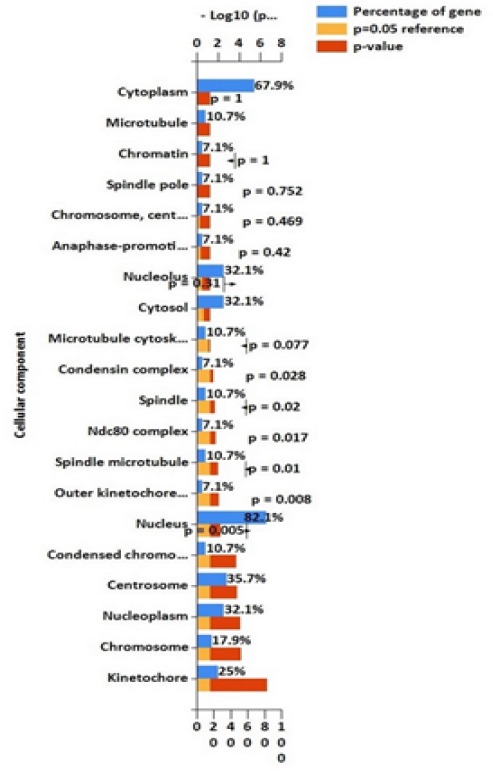
Cellular Component of DEGs. 82.1% of DEGs locate in the nucleus (p=0.008).
Pathway enrichment analyses
The significantly enriched pathways, by DEGs, included the cell cycle pathway, p53 signaling pathway, FoxO signaling pathway. Furthermore, cell cycle checkpoint and G2/M Checkpoints were enriched in the cell cycle pathway (Table 1) (Figure 6).
Table 1.
Enriched Pathways of DEGs. Cell cycle and p53 signaling pathways have the highest and significant fold enrichment
| Term | P-Value | Fold Enrichment | Bonferroni | Benjamini | FDR |
|---|---|---|---|---|---|
| Cell cycle | 1.79E-16 | 38.91535 | 6.88E-15 | 6.88E-15 | 1.89E-13 |
| p53 signaling pathway | 4.31E-04 | 24.54661 | 0.013265 | 0.003333 | 0.36938 |
| FoxO signaling pathway | 0.003282 | 12.17961 | 0.096898 | 0.020178 | 2.784925 |
| Viral carcinogenesis | 0.073799 | 6.232537 | 0.907131 | 0.327057 | 48.24269 |
| DNA replication | 0.08173 | 22.16013 | 0.928866 | 0.314494 | 51.929 |
†P.value<0.05
Figure 6.
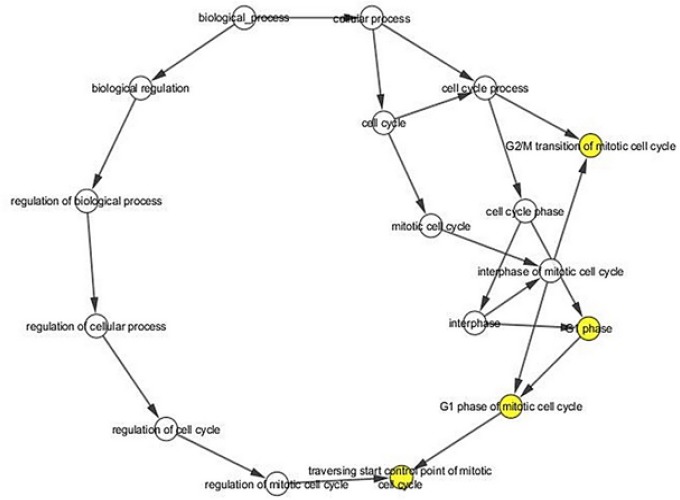
A network of Some of the Pathways. Each node indicates the Kyoto Encyclopedia of Genes and Genomes pathway item.
miRNAs of DEGs and their enrichment analysis
Most of the DEGs were regulated by hsa-miRNA-125a-5p, has-miRNA-125b-5p, hsa-miRNA-19a-3p and hsa-miRNA-19b-3p (Supplementary Table 1). The hsa-miRNA-125a-5p influenced DEGs played a role in transcription regulation. The hsa-miRNA-19a-3p targeted DEGs influenced cell proliferation and metastasis. The hsa-miRNA-19a-3p influenced lymph-node metastasis, liver metastasis and advanced stages in colorectal cancer. Gene enrichment analysis indicated that significant biological pathway for DEGs targeted against miRNAs were included, proteoglycan syndecan-mediated signaling, glypican pathway, beta 1 integrin cell surface interaction, VEGFR signaling and Erb-B receptor signaling network. Their significantly molecular functions were such as transcription factor activity, transcription regulator activity and transporter activity.
Discussion
According to data analyses, it was determined that this data had potential value for this study. In the present study, by using a combined approach of microarray data analysis- bioinformatics tools, we understand a total number of 249 DEGs, including 104 downregulated genes and 145 upregulated genes in medulloblastoma compared to normal brain samples. Our findings revealed that CDK1, CCNB1, CDK2, and WEE1 had strong interaction in the PPI network. Moreover, the cell cycle, p53 signaling pathway, and the FoxO signaling pathway were significantly enriched by DEGs.
Previous studies indicated that CDK1 plays an important role in neuroblastoma, an embryonal tumor, by coupling with CCNB1 to elevate tumor cell survival. Albanese et al suggested that VMY-1-103, a novel dansylated analog of purvalanol B, can disrupt metaphase progression by inhibiting CDK in medulloblastoma (Ringer et al., 2011). In addition, another study shown siRNA, MK-1775, could mediate knockdown of WEE1, a kinase known to participate in the G2/M cell cycle and checkpoint and DNA replication during S phase, to reduce medulloblastoma cell proliferation (Hirai et al., 2009). Furthermore, Matheson et al., (2016). indicated that inhibition of WEE1 by AZD1775 can induce apoptosis in medulloblastoma tumor cells. WEE1 plays a critical role in cell proliferation and growth and increased tumor progression and metastasis in medulloblastoma. The other experiment determined that WEE1 can be a potential therapeutic target for medulloblastoma (Moreira et al., 2016). Several studies have shown that both expressions of MYC and CCNB1 can be a strong prognosis biomarker to predict relapse in patients with medulloblastoma (Tamayo et al., 2011). Guessous et al., (2008) suggested that CDK2 kinase activity was involved in neuronal differentiation, cell proliferation and cell cycle progression in medulloblastoma. Therefore, our findings are consistent with previous results and introduce WEE1, CDK1, CDK2, and CCNB1 as key genes that associated with the development of medulloblastoma.
In the present study, it has been shown that significant amount of DEGs are associated with cell cycle and p53 signaling pathways. The BUB1 is a part of the cell cycle pathway and can regulate APC by controlling cell cycle checkpoint in medulloblastoma. Furthermore, miR-631 was downregulated in medulloblastoma, its downregulation may lead to cancer cell proliferation and invasion by regulating its target gene VEGFA in MB. Besides, FoxO is one of the important pathways in medulloblastoma, and absence of FoxO genes can induce cell cycle and cell proliferation. Srivastava et al., (2009) proposed that FOXO1, one of the FoxO genes, phosphorylated by Akt that results in cytoplasmic sequestration of FOXO1 and inhibition of cell death in the medulloblastoma cancer cell. This data shows that FOXO1 can play a role in medulloblastoma cell growth. Evidence showed that there is a cross-talk with p53 signaling pathways, therefore, FoxO can also play an inhibitory role in cell cycle and apoptosis. Since the cell cycle plays an important and mediatory role in the development of medulloblastoma (Dimitrova and Arcaro, 2015). Therefore, our results are consistent with those previous studies, and the cell cycle and p53 signaling pathway have a pivotal role in medulloblastoma progression and development.
In addition, based on this study, hsa-miRNA-125a-5p, has-miRNA-125b-5p, hsa-miRNA-19a-3p, and hsa-miRNA-19b-3p were frequently seen among DEGs that enriched in proteoglycan syndecan-mediated signaling, glypican pathway, beta 1 integrin cell surface interaction, VEGFR signaling, and Erb-B receptor signaling network. Proteoglycan syndecan-mediated signaling pathways play a role in cancer cell proliferation, invasion, and metastasis. Park et al., (2002) indicated that anti-sense of syndecan-2 can induce cell cycle arrest in G0/G1 with enhanced expression of p21, p27, and p53 in colon cancer. Some studies have shown that p53 mutation can upregulate VEGF and VEGFR expression (Wheler et al., 2016). Moreover, our studies are in line with previous research and approve them for medulloblastoma. Therefore, these miRNAs can arrest the cell cycle by inhibiting critical genes that play a role in essential pathways in the development of medulloblastoma.
In conclusion, WEE1, CDK1, CDK2, and CCNB1 may be a critical gene for medulloblastoma. In addition, cell cycle and p53 signaling pathway play a pivotal role in the invasion and progression of medulloblastoma from normal samples. Therefore, these pathways and genes can be a potential therapeutic target for target therapy in medulloblastoma. We also introduce several miRNAs that can use to target these critical genes and pathways.
Statement conflict of Interest
There is no conflict of interest.
Acknowledgments
This research study is based on thesis work of MSc Student.
References
- 1.Armstrong GT, Liu Q, Yasui Y, et al. Late mortality among 5-year survivors of childhood cancer:a summary from the childhood cancer survivor study. J Clin Oncol. 2009;27:2328. doi: 10.1200/JCO.2008.21.1425. [DOI] [PMC free article] [PubMed] [Google Scholar]
- 2.Bloom H, Wallace E, Henk J. The treatment and prognosis of medulloblastoma in children:a study of 82 verified cases. Am J Roentgenol. 1969;105:43–62. doi: 10.2214/ajr.105.1.43. [DOI] [PubMed] [Google Scholar]
- 3.Cline MS, Smoot M, Cerami E, et al. Integration of biological networks and gene expression data using Cytoscape. Nat Protoc. 2007;2:2366. doi: 10.1038/nprot.2007.324. [DOI] [PMC free article] [PubMed] [Google Scholar]
- 4.Cumberlin RL, Luk KH, Wara WM, et al. Medulloblastoma. Treatment results and effect on normal tissues. Cancer. 1979;43:1014–20. doi: 10.1002/1097-0142(197903)43:3<1014::aid-cncr2820430334>3.0.co;2-9. [DOI] [PubMed] [Google Scholar]
- 5.Das A, Bhattacharya S. Gene enrichment analysis–exploring functional relevance of genes obtained from high-throughput technologies. BAOJ Bioinfo. 2017;1:3. [Google Scholar]
- 6.Dimitrova V, Arcaro A. Targeting the PI3K/AKT/mTOR signaling pathway in medulloblastoma. Curr Mol Med. 2015;15:82–93. doi: 10.2174/1566524015666150114115427. [DOI] [PubMed] [Google Scholar]
- 7.Dabaghian FH, Hashemi M, Entezari M, et al. Effect of Cyperus rotundus on ischemia-induced brain damage and memory dysfunction in rats. Iran J Basic Med Sci. 2015;18:199–204. [PMC free article] [PubMed] [Google Scholar]
- 8.Donson AM, Kleinschmidt-DeMasters BK, Aisner DL, et al. Pediatric brainstem gangliogliomas show BRAF(V600E) mutation in a high percentage of cases. Brain Pathol. 2014;24:173–83. doi: 10.1111/bpa.12103. [DOI] [PMC free article] [PubMed] [Google Scholar]
- 9.Edelstein K, Spiegler BJ, Fung S, et al. Early aging in adult survivors of childhood medulloblastoma:long-term neurocognitive, functional, and physical outcomes. J Neurooncol. 2011;13:536–45. doi: 10.1093/neuonc/nor015. [DOI] [PMC free article] [PubMed] [Google Scholar]
- 10.Elbers CC, van Eijk KR, Franke L, et al. Using genome-wide pathway analysis to unravel the etiology of complex diseases. Genet Epidemiol. 2009;33:419–31. doi: 10.1002/gepi.20395. [DOI] [PubMed] [Google Scholar]
- 11.Gilbertson RJ. Medulloblastoma:signalling a change in treatment. Lancet Oncol. 2004;5:209–18. doi: 10.1016/S1470-2045(04)01424-X. [DOI] [PubMed] [Google Scholar]
- 12.Guessous F, Li Y, Abounader R. Signaling pathways in medulloblastoma. J Cell Physiol. 2008;217:577–83. doi: 10.1002/jcp.21542. [DOI] [PubMed] [Google Scholar]
- 13.He B, Yin J, Gong S, et al. Bioinformatics analysis of key genes and pathways for hepatocellular carcinoma transformed from cirrhosis. Medicine. 2017;96:e6938. doi: 10.1097/MD.0000000000006938. [DOI] [PMC free article] [PubMed] [Google Scholar]
- 14.Hirai H, Iwasawa Y, Okada M, et al. Small-molecule inhibition of We.e1 kinase by MK-1775 selectively sensitizes p53-deficient tumor cells to DNA-damaging agents. Mol Cancer Ther. 2009;8:2992–3000. doi: 10.1158/1535-7163.MCT-09-0463. [DOI] [PubMed] [Google Scholar]
- 15.Hong M-G, Pawitan Y, Magnusson PK, et al. Strategies and issues in the detection of pathway enrichment in genome-wide association studies. Hum Genet. 2009;126:289–301. doi: 10.1007/s00439-009-0676-z. [DOI] [PMC free article] [PubMed] [Google Scholar]
- 16.Huang DW, Sherman BT, Lempicki RA. Bioinformatics enrichment tools:paths toward the comprehensive functional analysis of large gene lists. Nucleic Acids Res. 2008a;37:1–13. doi: 10.1093/nar/gkn923. [DOI] [PMC free article] [PubMed] [Google Scholar]
- 17.Huang DW, Sherman BT, Lempicki RA. Systematic and integrative analysis of large gene lists using DAVID bioinformatics resources. Nat Protoc. 2008b;4:44. doi: 10.1038/nprot.2008.211. [DOI] [PubMed] [Google Scholar]
- 18.Huse JT, Holland EC. Targeting brain cancer:advances in the molecular pathology of malignant glioma and medulloblastoma. Nat Rev Cancer. 2010;10:319. doi: 10.1038/nrc2818. [DOI] [PubMed] [Google Scholar]
- 19.Khazaei Koohpar Z, Entezari M, Movafagh A, Hashemi M. Anticancer activity of curcumin on human breast adenocarcinoma:Role of Mcl-1 Gene. Iran J Cancer Prev. 2015;8:e2331. doi: 10.17795/ijcp2331. [DOI] [PMC free article] [PubMed] [Google Scholar]
- 20.Kesari S, Ramakrishna N, Sauvageot C, et al. Targeted molecular therapy of malignant gliomas. Curr Neurol Neurosci Rep. 2005;5:186–97. doi: 10.1007/s11910-005-0046-8. [DOI] [PubMed] [Google Scholar]
- 21.Kohl M, Wiese S, Warscheid B. In 'Data Mining in Proteomics'. Springer; 2011. Cytoscape:software for visualization and analysis of biological networks; pp. 291–303. [DOI] [PubMed] [Google Scholar]
- 22.Kool M, Korshunov A, Remke M, et al. Molecular subgroups of medulloblastoma:an international meta-analysis of transcriptome, genetic aberrations, and clinical data of WNT, SHH, Group 3, and Group 4 medulloblastomas. Acta Neuropathol. 2012;123:473–84. doi: 10.1007/s00401-012-0958-8. [DOI] [PMC free article] [PubMed] [Google Scholar]
- 23.Maere S, Heymans K, Kuiper M. BiNGO:a Cytoscape plugin to assess overrepresentation of gene ontology categories in biological networks. Bioinformatics. 2005;21:3448–9. doi: 10.1093/bioinformatics/bti551. [DOI] [PubMed] [Google Scholar]
- 24.Movafagh A, Mirfakhraei R, Mousavi-Jarrahi A. Frequent incidence of double minute chromosomes in cancers, with special up-to-date reference to leukemia. Asian Pac J Cancer Prev. 2011;12:3453–6. [PubMed] [Google Scholar]
- 25.Movafagh A, Maleki F, Fadaie S, AzarGashb E. Persistent unstable chromosomal aberrations in lymphocytes of radiotherapy workers after 1st mitotic division in Tehran Iran. Pak J Med Sci. 2007;23:254–8. [Google Scholar]
- 26.Northcott PA, Jones DT, Kool M, et al. Medulloblastomics:the end of the beginning. Nat Rev Cancer. 2012;12:818. doi: 10.1038/nrc3410. [DOI] [PMC free article] [PubMed] [Google Scholar]
- 27.Park H, Kim Y, Lim Y, et al. Syndecan-2 mediates adhesion and proliferation of colon carcinoma cells. J Biol Chem. 2002;277:29730–6. doi: 10.1074/jbc.M202435200. [DOI] [PubMed] [Google Scholar]
- 28.Pathan M, Keerthikumar S, Ang CS, et al. FunRich:An open access standalone functional enrichment and interaction network analysis tool. Proteomics. 2015;15:2597–601. doi: 10.1002/pmic.201400515. [DOI] [PubMed] [Google Scholar]
- 29.Peng G, Luo L, Siu H, et al. Gene and pathway-based second-wave analysis of genome-wide association studies. Eur J Hum Genet. 2010;18:111. doi: 10.1038/ejhg.2009.115. [DOI] [PMC free article] [PubMed] [Google Scholar]
- 30.Reigan P, Siegel D, Guo W, et al. A mechanistic and structural analysis of the inhibition of the 90-kDa heat shock protein by the benzoquinone and hydroquinone ansamycins. Mol Pharmacol. 2011;79:823–32. doi: 10.1124/mol.110.070086. [DOI] [PMC free article] [PubMed] [Google Scholar]
- 31.Ringer L, Sirajuddin P, Heckler M, et al. VMY-1-103 is a novel CDK inhibitor that disrupts chromosome organization and delays metaphase progression in medulloblastoma cells. Cancer Biol Ther. 2011;12:818–26. doi: 10.4161/cbt.12.9.17682. [DOI] [PMC free article] [PubMed] [Google Scholar]
- 32.Rossi A, Caracciolo V, Russo G, et al. Medulloblastoma:from molecular pathology to therapy. Clin Cancer Res. 2008;14:971–6. doi: 10.1158/1078-0432.CCR-07-2072. [DOI] [PMC free article] [PubMed] [Google Scholar]
- 33.Rutkowski S, von Hoff K, Emser A, et al. Survival and prognostic factors of early childhood medulloblastoma:an international meta-analysis. J Clin Oncol. 2010;28:4961–8. doi: 10.1200/JCO.2010.30.2299. [DOI] [PubMed] [Google Scholar]
- 34.Shannon P, Markiel A, Ozier O, et al. Cytoscape:a software environment for integrated models of biomolecular interaction networks. Genome Res. 2003;13:2498–504. doi: 10.1101/gr.1239303. [DOI] [PMC free article] [PubMed] [Google Scholar]
- 35.Srivastava VK, Yasruel Z, Nalbantoglu J. Impaired medulloblastoma cell survival following activation of the FOXO1 transcription factor. Int J Oncol. 2009;35:1045–51. doi: 10.3892/ijo_00000419. [DOI] [PubMed] [Google Scholar]
- 36.Szklarczyk D, Morris JH, Cook H, et al. The STRING database in 2017:quality-controlled protein–protein association networks, made broadly accessible. Nucleic Acids Res. 2016;45:362–8. doi: 10.1093/nar/gkw937. [DOI] [PMC free article] [PubMed] [Google Scholar]
- 37.Tamayo P, Cho Y-J, Tsherniak A, et al. Predicting relapse in patients with medulloblastoma by integrating evidence from clinical and genomic features. J Clin Oncol. 2011;29:1415. doi: 10.1200/JCO.2010.28.1675. [DOI] [PMC free article] [PubMed] [Google Scholar]
- 38.Taylor MD, Northcott PA, Korshunov A, et al. Molecular subgroups of medulloblastoma:the current consensus. Acta Neuropathol. 2012;123:465–72. doi: 10.1007/s00401-011-0922-z. [DOI] [PMC free article] [PubMed] [Google Scholar]
- 39.Van Dyk J, Jenkin RDT, Leung PM, et al. Medulloblastoma:treatment technique and radiation dosimetry. Int J Radiat Oncol Biol Phys. 1977;2:993–1005. doi: 10.1016/0360-3016(77)90202-4. [DOI] [PubMed] [Google Scholar]
- 40.Vibhakar R, Foltz G, Yoon JG, et al. Dickkopf-1 is an epigenetically silenced candidate tumor suppressor gene in medulloblastoma. Neuro Oncol. 2007;9:135–44. doi: 10.1215/15228517-2006-038. [DOI] [PMC free article] [PubMed] [Google Scholar]
- 41.Wettenhall JM, Simpson KM, Satterley K, et al. affylmGUI:a graphical user interface for linear modeling of single channel microarray data. Bioinformatics. 2006;22:897–9. doi: 10.1093/bioinformatics/btl025. [DOI] [PubMed] [Google Scholar]
- 42.Wheler JJ, Janku F, Naing A, et al. TP53 alterations correlate with response to VEGF/VEGFR inhibitors:implications for targeted therapeutics. Mol Cancer Ther. 2016;15:2475–85. doi: 10.1158/1535-7163.MCT-16-0196. [DOI] [PubMed] [Google Scholar]
- 43.Yeh C-S, Wang J-Y, Cheng T-L, et al. Fatty acid metabolism pathway play an important role in carcinogenesis of human colorectal cancers by Microarray-Bioinformatics analysis. Cancer Lett. 2006;233:297–308. doi: 10.1016/j.canlet.2005.03.050. [DOI] [PubMed] [Google Scholar]
- 44.Zhong H, Yang X, Kaplan LM, et al. Integrating pathway analysis and genetics of gene expression for genome-wide association studies. Am J Hum Genet. 2010;86:581–91. doi: 10.1016/j.ajhg.2010.02.020. [DOI] [PMC free article] [PubMed] [Google Scholar]


