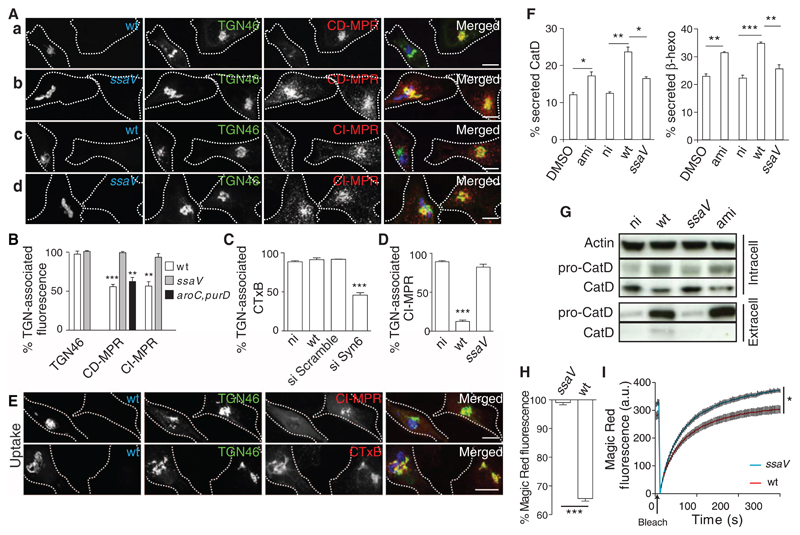
Fig 1. The SPI-2 T3SS interferes with Syn10-dependent retrograde trafficking of MPRs and reduces lysosome function.
(A and B) HeLa cells were infected for 14 hours with green fluorescent protein (GFP)–expressing wild-type (wt) (Aa and c) or ssaV mutant (Ab and d) Salmonella (blue) or (B) a replication-deficient aroC,purD mutant (23) that hasa functional SPI-2 T3SS (fig. S1C). Cells were immunolabeled for TGN46 (green) and CD-MPR (red) (a and b) or CI-MPR (red) (c and d). Scale bars, 10 μm. (B) Quantitation of mean fluorescent signals of TGN-associated TGN46 (24), CD-MPR, and CI-MPR, analyzed by three-dimensional (3D) confocal microscopy and normalized to signals in uninfected cells from the same sample. Error bars in all figures indicate SEM. (C to E) Plasma membrane–TGN transport assays. HeLa cells either were subjected to siRNA to deplete Syn6 or infected with wt or ssaV mutant Salmonella (blue in E) for 14 hours, then pulse-chased with either fluorescent CTxB [red in (E)] or CI-MPR antibody [red in (E)]. Fixed cells were immunolabeled for CI-MPR and TGN46 [green in (E)] or Rab6 (to identify the TGN in si Syn6– and si Scramble–treated cells), and TGN-associated CI-MPR or CTxB was quantified. Scale bars, 10 μm. (F and G) Rerouting of lysosomal enzymes. (F) HeLa cells were exposed to dimethyl sulfoxide (DMSO) or amiodarone (ami) [which redistributes MPRs (13)] and were not infected (ni) or infected with wt or ssaV mutant Salmonella for 14 hours. Secreted levels of cathepsin D (CatD) or β-hexosaminadase (β-hexo) are a percentage of total levels. (G) Intra- and extracellular proteins were analyzed by immunoblotting, using actin as a loading control. (H and I) Cathepsin B (CatB) activity was quantified by measuring fluorescent cleavage product of Magic Red-RR in living cells. (H) HeLa cells were infected for 14 hours with wt or ssaV mutant Salmonella and exposed to Magic Red-RR, and steady-state fluorescent product intensity was measured by flow cytometry. Bars represent the percentage of fluorescence of infected compared with uninfected cells in the same sample. (I) Cells as in (H) were photobleached and analyzed for new fluorescent product. Data were normalized to the mean fluorescence of uninfected cells. Vertical lines represent SEM for each of 100 time points. Statistically significant relationships are denoted (*P < 0.05; **P < 0.01; ***P < 0.005).

