Abstract
BACKGROUND. Pulmonary arterial hypertension (PAH) is a deadly disease of the small pulmonary vasculature with an increased prevalence of insulin resistance (IR). Insulin regulates both glucose and lipid homeostasis. We sought to quantify glucose- and lipid-related IR in human PAH, testing the hypothesis that lipoprotein indices are more sensitive indices of IR in PAH.
METHODS. Oral glucose tolerance testing in PAH patients and triglyceride-matched (TG-matched) controls and proteomic, metabolomics, and lipoprotein analyses were performed in PAH and controls. Results were validated in an external cohort and in explanted human PAH lungs.
RESULTS. PAH patients were similarly glucose intolerant or IR by glucose homeostasis metrics compared with control patients when matched for the metabolic syndrome. Using the insulin-sensitive lipoprotein index, TG/HDL ratio, PAH patients were more commonly IR than controls. Proteomic and metabolomic analysis demonstrated separation between PAH and controls, driven by differences in lipid species. We observed a significant increase in long-chain acylcarnitines, phosphatidylcholines, insulin metabolism–related proteins, and in oxidized LDL receptor 1 (OLR1) in PAH plasma in both a discovery and validation cohort. PAH patients had higher lipoprotein axis–related IR and lipoprotein-based inflammation scores compared with controls. PAH patient lung tissue showed enhanced OLR1 immunostaining within plexiform lesions and oxidized LDL accumulation within macrophages.
CONCLUSIONS. IR in PAH is characterized by alterations in lipid and lipoprotein homeostasis axes, manifest by elevated TG/HDL ratio, and elevated circulating medium- and long-chain acylcarnitines and lipoproteins. Oxidized LDL and its receptor OLR1 may play a role in a proinflammatory phenotype in PAH.
FUNDING. NIH DK096994, HL060906, UL1 RR024975-01, UL1 TR000445-06, DK020593, P01 HL108800-01A1, and UL1 TR002243; American Heart Association 13FTF16070002.
Keywords: Cardiology, Pulmonology
Keywords: Hypertension, Insulin, Proteomics
Insulin resistance in the lipid axis is common in pulmonary arterial hypertension and may promote pulmonary vascular disease
Introduction
Pulmonary arterial hypertension (PAH) is a life-limiting condition characterized by progressive vascular obliteration leading to right heart failure and ultimately death. Recent research has highlighted altered cellular and systemic metabolism as a key feature promoting pulmonary vascular disease and right heart failure in PAH (1–7). Diabetes mellitus and insulin resistance (IR) in PAH appear to be unrelated to obesity, suggesting a potential causal contribution (4, 7). Despite this recognition, little is known about the detailed metabolic characteristics of PAH, particularly its associations with altered lipid metabolism. We sought to extend our understanding of the pathophysiology of PAH by testing the hypothesis that defects in lipid and lipoprotein metabolism more sensitively define IR in PAH.
In rodent models and cell culture, PAH is associated with reduced mitochondrial function characterized by increased glycolysis and decreased fatty acid oxidation (2, 8, 9). Mitochondrial dysfunction, in multiple models, is a key driver of cell and tissue inflammation, and ultimately IR. Insulin-stimulated metabolism and signaling are evolutionarily conserved pathways involved in numerous homeostatic processes. Insulin action is fundamental in lipid and lipoprotein homeostasis by action in adipose tissue and the liver. IR increases lipolysis, and free fatty acid (FFA) delivery to the liver, where FFAs are cleared, reesterified, packaged on nascent apo-B particles, and secreted from the liver as very low-density lipoprotein (VLDL). Interactions of VLDL with cholesterol ester transfer protein lead to small, dense, oxidized LDL particles, dysfunctional and rapidly cleared HDL particles, and ultimately lower HDL cholesterol. Thus, lipoprotein IR is indicated by elevated VLDL (triglyceride)/HDL cholesterol ratio. IR is increasingly implicated in PAH; several rodent models of IR such as the ApoE–/– mouse have pulmonary hypertension (10–12) and IR is an early feature of a transgenic rodent model of heritable PAH with BMPR2 mutation (13, 14). In addition to atherogenic dyslipidemia, IR in the lipid axis is characterized by abnormal skeletal muscle lipid deposition (15–17). Increased cardiac and peripheral muscle lipid deposition are common in PAH (5, 18), but aside from reduced HDL (19), little is known about how IR impacts lipid and lipoprotein homeostasis in human patients with PAH. Further, whether this altered lipoprotein axis may reflect underlying PAH pathobiology or contribute to a proinflammatory lipoprotein vasculopathy is unknown.
Thus, we sought to fully define IR in humans with PAH, testing the hypothesis that defects in lipid metabolism related to IR would more sensitively define PAH than alterations in glucose homeostasis and may have pulmonary vascular effects. In order to rigorously control for metabolic background, we performed oral glucose tolerance testing (OGTT) in PAH patients and controls that were matched by plasma triglyceride (TG). In addition, we sought to more deeply define lipid dysregulation in PAH using metabolomics, lipidomics, and proteomics in human PAH patients. Our findings were validated in both an external cohort of PAH patients and controls and also in lung tissue of PAH patients and controls.
Results
OGTT.
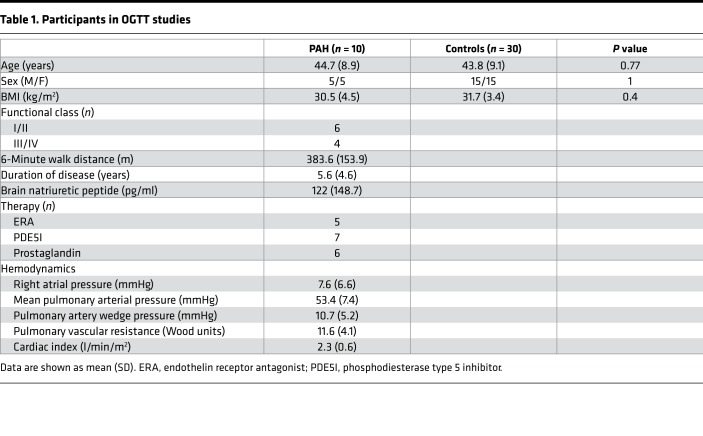
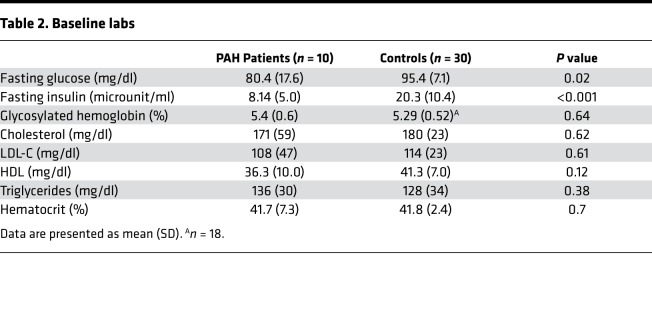
If IR in PAH is more accurately characterized by lipid dysregulation than glucose abnormalities, then matching PAH and controls by plasma TGs would be expected to show relatively less IR by glucose metrics in PAH and controls but more lipid-related abnormalities. Therefore, to differentiate from background obesity-related metabolic syndrome, we matched controls by age, sex, BMI, and fasting plasma TGs. Ten patients with either heritable PAH (HPAH) or idiopathic PAH (IPAH) (50% women, age 45 ± 9 years, BMI 31 ± 5) and no known diagnosis of diabetes mellitus underwent OGTT and were compared with 30 matched controls (Table 1). The PAH cohort had advanced disease with more than half on prostaglandin therapy and a mean disease duration of 5.6 ± 4.6 years. All PAH patients had fasting blood glucose below 125 mg/dl. Glycosylated hemoglobin and fasting lipid profiles were similar in the 2 groups (Table 2).
Table 1. Participants in OGTT studies.
Table 2. Baseline labs.
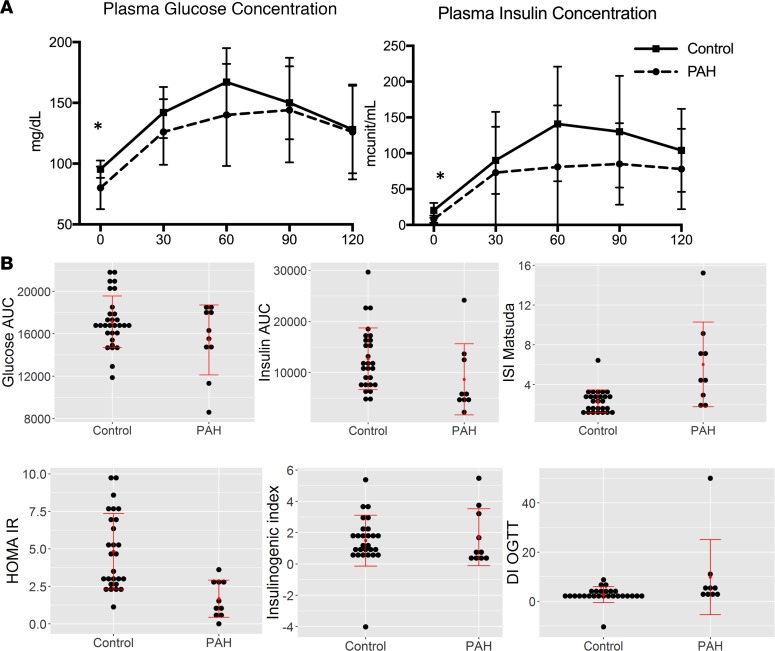
PAH patients had lower baseline plasma glucose and insulin levels compared with controls (P < 0.05 for both, Figure 1A). Further, the area under the curve for insulin was higher in controls than PAH patients (P < 0.05, Figure 1B), while the area under the curve for glucose was similar, suggesting that for a given glucose concentration, PAH patients were secreting less insulin and were more insulin sensitive. The Matsuda index was elevated in PAH patients, also consistent with less IR and lower baseline HOMA-IR (homeostatic model assessment–insulin resistance) in PAH patients compared with controls matched by TGs (Figure 1B, P = 0.002). When we performed a similar analysis, only matching controls by age, sex, and BMI, the data were similar (Supplemental Table 1 and Supplemental Figure 1).
Figure 1. Oral glucose tolerance testing in PAH and controls.
Results of oral glucose tolerance testing in PAH patients (n = 10) and age-, sex-, BMI-, and triglyceride-matched controls (n = 30). (A) Plasma glucose and insulin measured at 30-minute intervals in both groups. Both plasma glucose and insulin were lower at baseline compared with control in PAH patients. Mean ± SD presented. (B) Markers of insulin sensitivity show greater insulin sensitivity in PAH patients compared with controls and lower secretion of insulin in PAH compared with controls after the same glucose load. Data are presented as dot plots with central lines referring to mean and error bars SD. *P < 0.05 by Wilcoxon’s test. AUC, area under the curve; ISI, insulin-sensitivity index; HOMA-IR, homeostatic model assessment–insulin resistance; DI-OGTT, disposition index–oral glucose tolerance test.
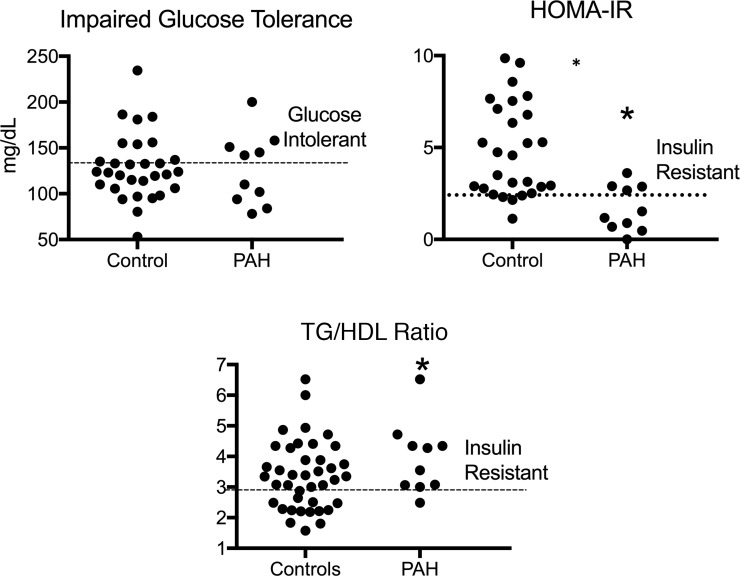
Using plasma glucose greater than 140 mg/dl at 2 hours to define impaired glucose tolerance, there was no difference in the prevalence of impaired glucose tolerance between PAH and controls (Figure 2, P = 0.11). Using a HOMA-IR definition of IR of greater than 2.60 (20), the control cohort had a higher prevalence of IR (P = 0.02). Neither of these metrics correlated to BMI in PAH patients (Supplemental Table 2).
Figure 2. Prevalence of glucose intolerance and insulin resistance by glucose-based and lipid-based metrics in PAH and controls.
Frequency of impaired glucose tolerance was similar in PAH and controls (5 out of 10 PAH and 7 out of 30 controls, P = 0.11). Using a HOMA-IR ≥2.4 as a marker of IR, 4 out of 10 PAH patients were IR and 21 out of 30 controls were IR (*P < 0.05); 9 out of 10 PAH patients had elevated TG/HDL ratios, consistent with IR, while 17 out of 30 controls had IR with this lipid-based metric (*P = 0.01). TG/HDL, triglyceride/high density lipoprotein ratio; HOMA-IR, homeostatic marker assessment-IR. n = 10 PAH, 30 controls. Wilcoxon’s test used for all comparisons.
In the general population, IR can also be characterized by alterations in plasma lipid concentrations, including the fasting TG/HDL ratio (4, 21). Elevation in FFAs and plasma lipids (5) is an important feature of metabolic defects in PAH. Using a TG/HDL ratio greater than 3.0 (22), 9 out of 10 patients met this lipid-based definition of IR (Supplemental Table 2 and Figure 2), compared with 17 out of 30 in the control population (P = 0.01), thereby demonstrating that PAH patients are more insulin sensitive than controls when assessed by glucose homeostatic metrics, while lipid-related IR was more common in PAH patients than controls. This may not represent functional tissue-level insulin resistance, but rather reflect a tendency to elaborate more adipose FFA and generate elevated VLDL concentrations at the lower ambient insulin concentrations.
Plasma proteomic and metabolomic analysis.
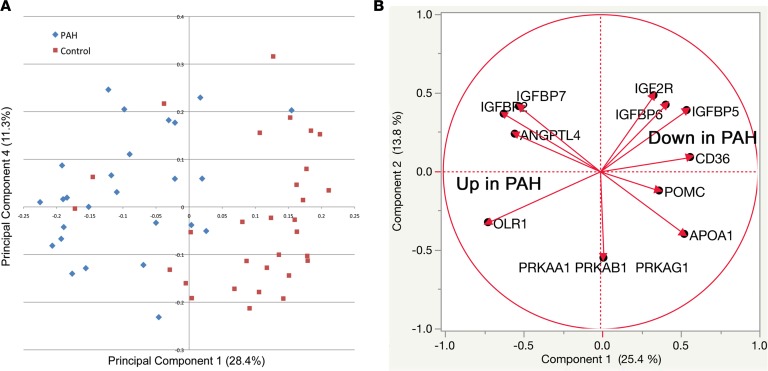
We next sought to perform a detailed characterization of metabolic changes associated with PAH using both plasma proteomics and metabolomics. We performed an aptamer-based proteomic assay to measure abundance of 1,139 proteins in our fasting plasma from PAH patients and controls (Figure 3 and Supplemental Table 3). By principal component analysis, PAH patients and controls were broadly separated by their plasma proteome (Figure 3A). We examined 40 different metabolic pathway proteins for differential expression between PAH and control and found that 11 were different, at P < 0.05 by unpaired t test (FDR = 2, Figure 3B). These differentially expressed proteins showed significant differences in insulin signaling (IGFBP6, IGF2R, IGFBP7, IGFBP2, pRKAA1, and ANGPTL4) and lipid signaling and transport (OLR1, APOA1, and CD36).
Figure 3. Proteomic analysis of PAH patients and controls shows broad separation and increased lipid metabolic proteins, reduced insulin signaling proteins.
We measured abundance of more than 1,100 proteins in the fasting plasma of PAH patients and age-, sex-, and BMI-matched controls. (A) By principal component analysis there was general separation of PAH patients compared with controls using abundance of proteins. (B) We focused on differentially expressed proteins associated with glucose and lipid metabolism. We found a general decrease in proteins associated with glucose homeostasis and increase in lipid metabolic proteins such as OLR1. n = 27 PAH, 30 controls.
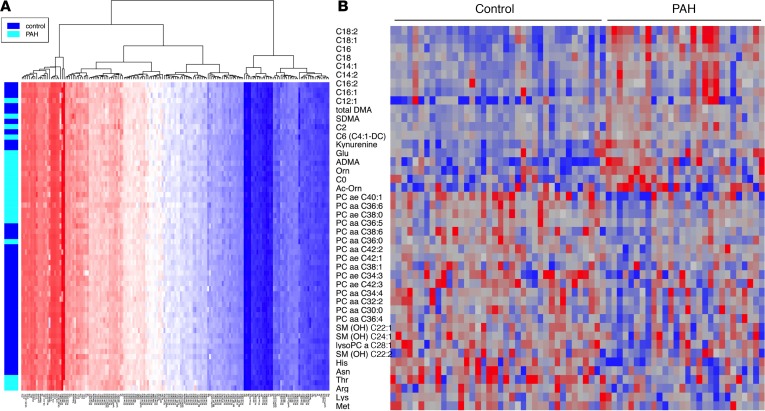
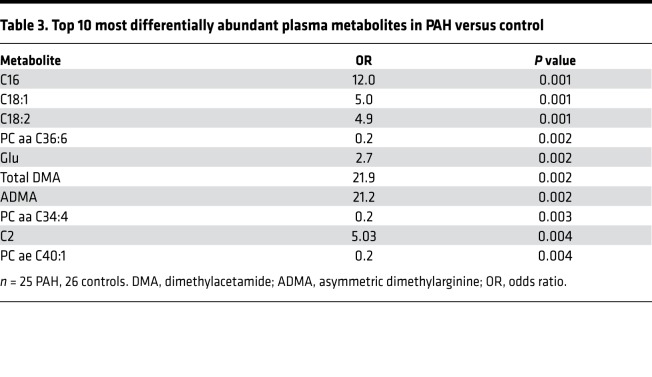
We also performed an unbiased analysis of 169 plasma metabolites using a mass-spectroscopy-based metabolomics assay on fasting plasma as above. We first performed a hierarchical clustering analysis focused on lipid metabolites (Figure 4A) and demonstrated that there was general separation in these 169 metabolites between PAH and control subjects. When we focused on those 44 metabolites that were significantly different after multiple comparison adjustment between PAH and control subjects, we found that the primary differences were lower abundance of phosphatidylcholine species, a major source of endothelial arachidonic acid (23), and higher abundance of medium- and long-chain acylcarnitines such that PAH patients had significantly higher palmitoylcarnitine (C16), octadecenoylcarnitine (C18:1), and octadecadienoylcarnitine (C18:2) (Figure 4B and Table 3; P = 0.001 for all). In total, 6 out of 10 of the most abundant lipid metabolites in the PAH cohort were long-chain acylcarnitines, while only 1 out of 10 was related to amino acid metabolism (glutamate) and none in glycolysis or glucose oxidation pathways.
Figure 4. Heatmap of 169 metabolites associated with lipid metabolism separates PAH from controls.
(A) Metabolomic cluster analysis of lipid metabolites shows that plasma lipids broadly separates PAH from controls. (B) We examined the entire metabolomics data set for differential expression between PAH and control and found that 44 were different at P < 0.05 (uncorrected) by unpaired 2-tailed t test (FDR = 9.4, 21%). Heatmap of these differentially expressed metabolites reveals that PAH exhibits overrepresentation of lipid metabolites compared with glucose-related metabolites. n = 25 PAH, 26 controls.
Table 3. Top 10 most differentially abundant plasma metabolites in PAH versus control.
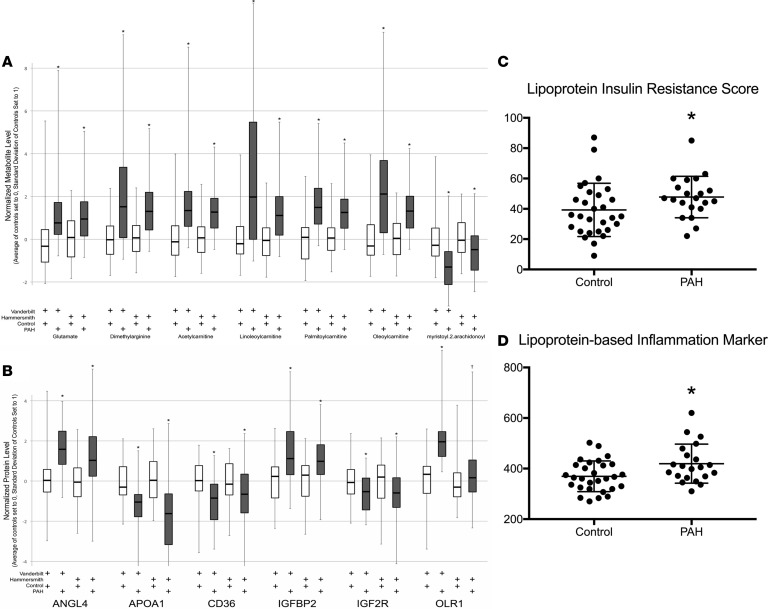
To strengthen our proteomics and metabolomics findings, we validated our data in a large international external cohort that had previously performed metabolomics and proteomics on a similar platform as our own samples (Hammersmith Campus, Imperial College) (24, 25). We found excellent agreement between the 2 cohorts (Vanderbilt University Medical Center and Hammersmith), with all selected metabolites highly significantly different in the Hammersmith cohort (Figure 5A, P < 0.0001). Our proteomics data were similarly replicated in the Hammersmith cohort (Figure 5B, P < 0.05 for all proteins).
Figure 5. Replication of metabolomic and proteomic data with detailed analysis of lipoproteins in PAH patients and controls.
(A) We validated selected metabolites in an international cohort with similar methodology. Our data replicated well in the Hammersmith cohort (n = 262 IPAH, 118 controls). *P < 0.0001 in all comparisons of PAH versus control. Each PAH was compared to the control from the same institution using a 2-tailed unpaired t test. (B) Proteomic data validation in the Hammersmith cohort. *P < 0.01, †P < 0.05. (C and D) Detailed analysis of plasma lipoproteins in PAH and controls and calculated (C) lipoprotein-based IR score and (D) lipoprotein-based inflammation core. Both were elevated in PAH compared with controls. Data presented as mean ± SD (n = 22 PAH, 28 controls). *P < 0.05 by unpaired 2-tailed t test (C and D).
Dyslipidemia in PAH.
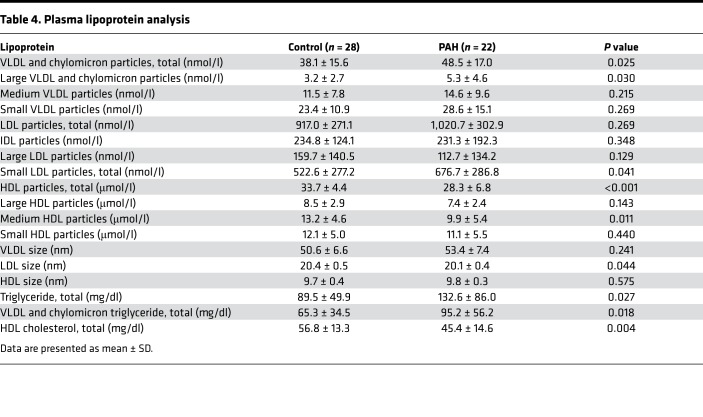
Dyslipidemia in IR states is also characterized by elevations in apolipoprotein B–containing lipoproteins, i.e., VLDL and depressed levels of HDL cholesterol (26). As our data demonstrated an increase in the TG/HDL ratio, we performed a more nuanced examination of lipoprotein profile in patients with PAH. We performed a detailed analysis of VLDL, chylomicron, LDL, and HDL particle concentrations in our fasting plasma cohort and also calculated a lipoprotein-based IR score and inflammation score (Table 4 and Figure 5, C and D). We found significant elevation in total VLDL and chylomicron particles (P = 0.03) driven by elevation in large VLDL and chylomicron particles (P = 0.03). Small LDL particles (P = 0.04), total TGs (P = 0.03) and VLDL and chylomicron calculated TGs (P = 0.02) were enriched in PAH versus controls. Alternatively, total HDL was strongly reduced in PAH versus controls (P < 0.001) and this was due to reductions in medium HDL particles (P = 0.01). These alterations in PAH patients closely resemble well-described dyslipidemia of IR in normal and obese cohorts (26, 27) and were associated with significant elevation in plasma lipoprotein IR score (LPIRS) (28–30) (Figure 5C; 32.3 ± 17.9 vs. 47.5 ± 13.4, P = 0.03) as well as a lipoprotein-based inflammation score (Figure 5D; 366.6 ± 59.7 vs. 420.8 ± 75.5, P = 0.02). In comparing the 9 PAH patients with an elevated LPIRS versus the 12 patients without, there were no significant differences in sex (Supplemental Table 4); however, patients with elevated LPIRS were younger (42.8 ± 7.8 vs. 53.3 ± 13.5 years, P = 0.04). Baseline pulmonary vascular resistance correlated weakly with LPIRS (Supplemental Figure 2; r = 0.42, P = 0.05), suggesting possible relevance to pulmonary vascular pathobiology.
Table 4. Plasma lipoprotein analysis.
Pulmonary vascular effects of proinflammatory lipid signaling.
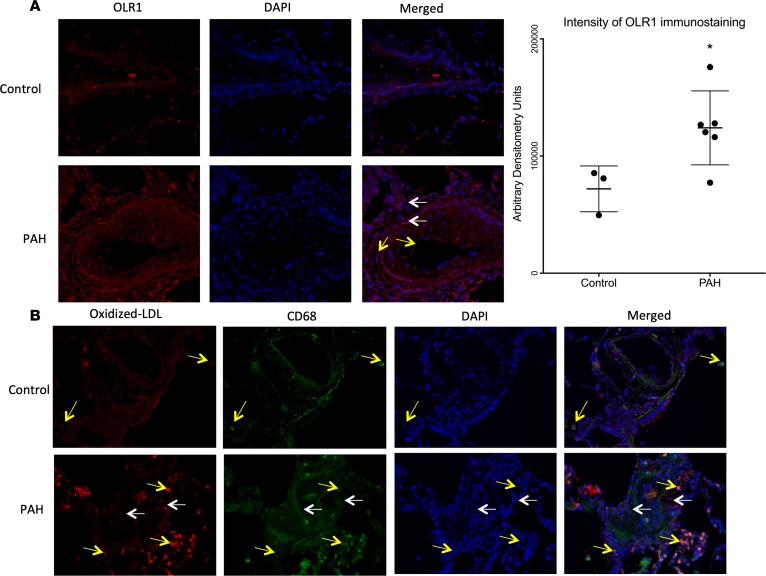
We next sought to determine the potential pulmonary vascular consequences of IR-associated dyslipidemia and elevated proinflammatory lipoproteins in PAH patients. Long-chain acylcarnitines are elevated in the PAH cohort in our unbiased analysis in discovery and replication cohorts. Long-chain fatty acids may predispose LDL particles to oxidation (31), which renders the lipoprotein proinflammatory and leads to its uptake by endothelial and other cells via oxidized LDL receptor 1 (OLR1). Our proteomic analysis identified OLR1 elevation in PAH patients. To test the hypothesis that proinflammatory lipoproteins in the circulation might contribute to pulmonary vascular pathology, we performed immunohistochemistry in explanted lungs from PAH patients and failed donors as controls. We found increased OLR1 in and around pulmonary vessels, especially in pulmonary artery smooth muscle cells and endothelial cells in PAH compared with controls (P < 0.05, Figure 6A). Because OLR1 promotes uptake of oxidized LDL, a proinflammatory mediator in the systemic circulation (32), we next stained for oxidized LDL. We found that oxidized LDL was present in the perivascular spaces of PAH patients, but not controls (Figure 6B) and that oxidized LDL colocalized with CD68, a macrophage marker. These data demonstrate upregulation of oxidized LDL receptor, oxidized LDL itself and accumulation within macrophages, which have been linked extensively to a proinflammatory pulmonary vascular axis (33).
Figure 6. Localization of OLR1, oxidized LDL, and CD68 in distal pulmonary arteries in PAH and control lung.
(A) OLR1 (red) is localized in pulmonary artery smooth muscle cells (white arrows) and endothelial cells (yellow arrows). Nuclei stained in blue (DAPI). Original magnification, ×200. Bar graph represents immunostaining intensity in arbitrary densitometric units. Data presented as mean ± SD (n = 3 control, 6 PAH). *P < 0.05 by unpaired, 2-tailed t test. (B) Oxidized LDL is in plexiform lesions (white arrows) and accumulates in CD68+ macrophages (yellow arrows). Green = oxidized LDL, red = macrophages, yellow = colocalized. Nuclei stained in DAPI (blue). Original magnification, ×400.
Discussion
In this series of experiments, we sought to fully define metabolic dysregulation in humans with PAH and explore the potential pathologic consequences of IR in PAH, testing the hypothesis that defects in lipid metabolism related to IR would more sensitively define PAH than alterations in glucose homeostasis. In order to test this hypothesis, we first performed OGTT in PAH and control patients matched for TGs as a way to control for presence of metabolic disease and hold constant one of the major variables regulated by insulin, plasma TG concentration. PAH patients did not display enhanced insulin secretion after a glucose load when compared with controls with similar burden of metabolic disease. Despite this matching, PAH patients had a higher TG/HDL ratio, indicating fundamental alterations in lipoprotein metabolism and suggesting IR in this axis. Further, the findings were similar when controls were not matched by plasma TG. We further explored IR characterized by lipid changes using unbiased proteomic and metabolomic analyses that confirmed overrepresentation of lipid metabolic changes, in particular long- and medium-chain acylcarnitines and these findings were strongly and consistently validated in the Hammersmith cohort. Lipoprotein profiling demonstrated that a lipid profile that is more common in IR than in control populations was present in PAH, particularly enhanced VLDL concentrations in PAH, which is a hallmark of IR (29). To determine if there may be pulmonary vascular implications for our plasma findings, in particular related to synthesis and metabolism of proinflammatory oxidized LDL, we performed immunohistochemistry that demonstrated increased staining for OLR1 and oxidized LDL itself in human PAH plexiform lesions. Further, oxidized LDL was enriched in cells staining positive for a macrophage marker, suggesting that oxidized LDL may play a role in the inflammatory phenotype of PAH. Taken together, our data demonstrate that a lipid-related IR pattern is highly prevalent in PAH and may contribute to pulmonary vascular disease.
There are multiple facets of IR including both altered glucose and lipid homeostasis. Lipid changes in IR are characterized by increased VLDL particles, higher abundance of plasma FFAs, and tissue lipid deposition (34). Our work is consistent with others that have demonstrated that PAH patients do not have abnormally elevated insulin secretion in response to a given glucose load and that about half of PAH patients have detectable alterations in glucose homeostasis (4, 7, 35). When matching by degree of metabolic syndrome using plasma TGs, our patients were not more IR by glucose and insulin metrics, in fact less so. It is therefore intriguing that we observed more lipid-related abnormalities in PAH in a pattern of IR, thereby yielding potentially novel metabolic insight into this disorder. Emerging literature suggests that lipids are abnormally metabolized in PAH patients, with elevated plasma FFAs (5), reduced HDL(19), ectopic lipid deposition in the skeletal muscle, and a possible cardiac lipotoxic phenotype (5, 36, 37). When using the standard TG/HDL ratio, 90% of our patients were IR, while only about half of the metabolic-syndrome-matched controls were (P < 0.05), which matched the frequency of IR using glucose and insulin-based metrics such as the HOMA-IR in controls. This abnormal ratio has previously been described by Zamanian et al. (4) and is primarily driven by reduced HDL, a finding that is conserved even when the patients and controls are not matched by plasma TG level. Our data show that lipid markers of IR identifies more PAH patients with IR than glucose- and insulin-based markers.
In addition to confirming the broad dysregulation in lipid metabolism, our metabolomic analyses lead to potentially new findings. Among the most differentially expressed metabolites were several phosphatidylcholine species (PC aa C36:6, PC aa C34:4, and PC ae C40:1; aa = diacyl, ae = acyl-alkyl), which were significantly reduced in PAH patients compared with controls. This may be of potential relevance to PAH, as phosphatidylcholines are the major phospholipid providing arachidonic acid for prostacyclin synthesis in stimulated endothelial cells (23). An imbalance in prostacyclin production through arachidonic acid metabolism is long described in PAH and may be at least in part affected by alterations in lipid metabolism related to IR (38).
As prior work by our group and others has suggested that IR is causal in the development of pulmonary vascular disease (10, 11, 13, 14), we sought to define biological relevance of our lipid-related findings. We explored lipoprotein-related inflammation as a link between our plasma findings and pulmonary vascular disease. Our proteomic, metabolomic, and lipoprotein analyses point to a potential mechanism for these observations involving proinflammatory lipoproteins and their receptors (29). OLR1 was highly enriched in PAH by plasma proteomic analysis and although oxidized LDL is a well-described mediator of systemic vascular inflammation and atherosclerosis (32, 39), little is known about oxidized LDL and its receptor in the pulmonary vasculature. We found both increased oxidized LDL and OLR1 in plexiform lesions of distal pulmonary arterioles of PAH patients compared with controls. The oxidized LDL appeared to be enriched in CD68+ cells, consistent with macrophages. Although atheromatous plaques have been described in the central pulmonary arteries of patients with PAH and chronic thromboembolic pulmonary hypertension (40, 41), proinflammatory lipids have not been reported in the distal vasculature within plexiform lesions, thought to be the key lesions of PAH. Our findings are in line with prior animal studies in chronic hypoxia that have suggested a role for oxidized LDL and its receptor in chronic hypoxic pulmonary hypertension (42, 43). Further study is needed to determine if and how oxidized LDL promotes inflammation via macrophages in PAH, as our data do not demonstrate causality, but this work suggests that the lipid metabolic findings may have biologic relevance to PAH and, moreover, that unbiased approaches to plasma metabolome and proteomic analyses may in combination point to relevant mechanisms of disease in PAH. Further, while statin therapy may not be effective in an unselected group of PAH patients (44), there may be subgroups that would benefit from a lipid-based intervention.
Our study has limitations. First, our small sample size may account for the reduced glucose and insulin in the PAH patients. However, our findings are similar to those of Heresi et al. (35), suggesting that this is not a sampling error. Second, fasting glucose and insulin concentrations were not elevated in PAH patients in our study, although TG/HDL ratio and lipoprotein-based IR metrics strongly suggested a pattern of insulin resistance that has been well defined in the literature (29, 45–47). Future studies using insulin clamp techniques would be required to directly measure insulin resistance in PAH. Our study design cannot demonstrate a causative role for oxidized LDL in PAH, but does suggest that there may be a proinflammatory phenotype in IR PAH patients that may involve oxidized LDL and its receptor. As we are studying human patients with established disease, defining the determinants of early pulmonary vascular disease are not feasible. It is possible that lipid metabolism, and our proteomic findings specifically, may be unrelated to IR and may be a feature of the disease mechanism; however, this is not supported by animal studies (10, 11, 13) or the preponderance and consistency of our data. PAH therapies are not known to be associated with altered lipid metabolism, and we have selected IPAH and HPAH patients to attempt to make the cohort as homogeneous as possible.
In conclusion, we have shown that PAH is more sensitively characterized by alterations in lipid metabolism, manifest by elevated TG/HDL ratio in a pattern of IR, elevated circulating medium- and long-chain fatty acids, and a proinflammatory lipoprotein pattern. There may be a potential role for oxidized LDL and its receptor in a proinflammatory phenotype in IPAH and HPAH.
Methods
OGTT cohort.
Patients with IPAH or HPAH followed at the Vanderbilt University Medical Center over a 2-year period, aged ≥18 years and without a known diagnosis of polycystic ovarian syndrome, diabetes mellitus, therapy with oral hypoglycemic or other diabetic therapy were eligible to participate. Control participants were selected from a database of volunteer OGTTs obtained at baseline as previously described (48, 49). Control participants were selected in a 1:3 ratio (case/control) matched for gender, race, BMI, and fasting TGs. OGTT was performed after drawing ≥8-hour fasting blood samples. A 75-g glucose solution was administered by study coordinators orally and plasma glucose and insulin concentrations were measured at 30, 60, 90, and 120 minutes. Impaired glucose tolerance was defined by a 2 hour glucose greater than 140 mg/dl (50). Glucose was measured by the glucose oxidase method (Yellow Springs Instruments) and insulin was measured by radioimmunoassay in the Vanderbilt Diabetes Center Hormone assay core lab as previously described (48, 49).
Fasting plasma cohort.
A separate cohort of fasting plasma was obtained from patients referred for clinically indicated right heart catheterization for evaluation of PAH as defined above. Age-, sex-, and BMI-matched healthy volunteers free from cardiovascular disease or diabetes mellitus provided fasting blood samples, but did not undergo right heart catheterization. As samples were collected over time and analyses performed at different time points, there are differences in the number of samples included in each analysis.
Validation cohort.
Metabolomic and proteomic analyses were performed on a cohort of PAH patients and matched controls as previously described (Hammersmith Campus, Imperial College) (24, 25). Proteomic and metabolomic data were log transformed, and then the average of controls set to zero and the standard deviation set to 1. Group comparisons were by 2-way ANOVA (disease status, cohort) with pairwise comparisons by post hoc tests.
Plasma metabolomic and proteomic analyses.
Fasting plasma was analyzed using electrospray ionization liquid chromatography–mass spectrometry (LC-MS) and MS/MS measurements using the AbsoluteIDQ p180 kit. Proteomics were performed using the SomaLogic aptamer-based assay. Please see supplemental material for full details.
LipoScience.
IR was further assessed using proton NMR spectroscopy to determine changes in VLDL, LDL, intermediate-density lipoprotein (IDL), and HDL particle size and concentrations at LipoScience, Inc. (28). Lipoprotein subclass particle concentrations were calculated by amplitudes of the spectroscopically distinct lipid methyl group signals emitted by the different lipoprotein subclasses, which were deconvoluted using the LipoProfile-3 algorithm. Lipoprotein-derived IR index (Lipo-IR) was derived from concentrations of large VLDL, small LDL, and large HDL plus particle size of VLDL, LDL, and HDL (29, 30).
Tissue immunohistochemistry.
Explanted lungs from PAH patients and failed donor controls were obtained and fixed, frozen, paraffin-embedded slides prepared. Details of tissue immunohistochemistry are in the supplemental material.
Statistics.
We used R function matchControls implemented in R package e1071 to find age-, sex-, BMI-, and fasting plasma TG-matched controls with PAH patients in the OGTT studies. Specifically, for each PAH patient his/her Euclidean distance with each potential control subject was calculated on a vector of age, sex, BMI, and fasting plasma TGs. The control subject with the minimum distance was chosen as the PAH patient’s control. Once a control was chosen, the subject was taken out of the pool of potential controls. The process was repeated 3 times so that 3 sets of 10 controls were identified. The PAH patients and controls were compared on the matching variables age, sex, BMI, and fasting plasma TGs using either Wilcoxon’s rank-sum test for continuous variables or Pearson’s χ2 test for categorical variables. For other variables of interest we conducted Wilcoxon’s rank-sum test for continuous variables or Pearson’s χ2 test for categorical variables to compare PAH patients and controls due to the relatively small sample size. Principal component analysis was used in proteomic data and 2-tailed, unpaired t test was used for lipoprotein studies. A P value of <0.05 was considered significant. Data are shown as mean ± SD unless otherwise noted. Statistical analyses were performed using Prism 5.0 software (Graph Pad Software), R 3.0.1, and Excel.
Study approvals.
All patients gave written informed consent (Vanderbilt University Medical Center IRBs 9401, 130712, and 140983) for OGTT and fasting-plasma cohorts.
Author contributions
ARH, JPF, J. West and ELB designed the research studies, acquired data, analyzed data, and drafted the manuscript. JML, CJR, SJH, and JHN acquired data, analyzed data, and drafted the manuscript. JPB and JC conducted experiments, designed research studies, and analyzed data. RF and QS analyzed data and drafted the manuscript. NF, RH, and LH acquired data. REG acquired data, analyzed data, and provided reagents. KDN designed the research study, analyzed data, and drafted the manuscript. MEP and IMR designed the research study and collected data. CAS, SS, J. Wharton and MRW acquired data and analyzed data. YS, FY, and CY analyzed data. MT acquired data, conducted experiments, and analyzed data.
Supplementary Material
Acknowledgments
This study was supported by NIH grants DK096994, HL060906, UL1 RR024975-01, UL1 TR000445-06, DK020593, P01 HL108800-01A1 (DRTC hormone core lab and Metabolic Physiology Shared Resource), and American Heart Association grant 13FTF16070002 (to ELB). This project was also supported by Clinical and Translational Science Award UL1 TR002243 from the National Center for Advancing Translational Sciences. The samples from Hammersmith Hospital were collected and analyzed through funding provided by the National Institute for Health Research (NIHR) and supported by the Imperial NIHR Clinical Research Facility. Its contents are solely the responsibility of the authors and do not necessarily represent official views of the National Center for Advancing Translational Sciences or the NIH.
Version 1. 01/10/2019
Electronic publication
Footnotes
Conflict of interest: ARH has served as a consultant to Actelion, Bayer, United Therapeutics, and Complexa. MEP has served as a consultant to Gilead. CJR has served as consultant to Actelion and United Therapeutics.
License: Copyright 2019, American Society for Clinical Investigation.
Reference information: JCI Insight. 2019;4(1):e123611. https://doi.org/10.1172/jci.insight.123611.
Contributor Information
James Carlson, Email: carlsoje@gmail.com.
Run Fan, Email: run.fan@vumc.org.
Niki Fortune, Email: niki.l.penner@vumc.org.
Robert E. Gerszten, Email: rgerszte@bidmc.harvard.edu.
Rezzan Hekmat, Email: rezzanh92@gmail.com.
John H. Newman, Email: john.newman@vumc.org.
Ivan M. Robbins, Email: ivan.robbins@vanderbilt.edu.
Quanhu Sheng, Email: quanhu.sheng.1@vumc.org.
Yu Shyr, Email: yu.shyr@Vanderbilt.Edu.
Susan Sumner, Email: susan_sumner@unc.edu.
Megha Talati, Email: megha.talati@vanderbilt.edu.
John Wharton, Email: j.wharton@imperial.ac.uk.
Fei Ye, Email: fei.ye@vumc.org.
Chang Yu, Email: chang.yu@vanderbilt.edu.
James West, Email: west.james@gmail.com.
References
- 1.Piao L, et al. FOXO1-mediated upregulation of pyruvate dehydrogenase kinase-4 (PDK4) decreases glucose oxidation and impairs right ventricular function in pulmonary hypertension: therapeutic benefits of dichloroacetate. J Mol Med. 2013;91(3):333–346. doi: 10.1007/s00109-012-0982-0. [DOI] [PMC free article] [PubMed] [Google Scholar]
- 2.Archer SL, Fang YH, Ryan JJ, Piao L. Metabolism and bioenergetics in the right ventricle and pulmonary vasculature in pulmonary hypertension. Pulm Circ. 2013;3(1):144–152. doi: 10.4103/2045-8932.109960. [DOI] [PMC free article] [PubMed] [Google Scholar]
- 3.Michelakis ED, et al. Dichloroacetate, a metabolic modulator, prevents and reverses chronic hypoxic pulmonary hypertension in rats: role of increased expression and activity of voltage-gated potassium channels. Circulation. 2002;105(2):244–250. doi: 10.1161/hc0202.101974. [DOI] [PubMed] [Google Scholar]
- 4.Zamanian RT, et al. Insulin resistance in pulmonary arterial hypertension. Eur Respir J. 2009;33(2):318–324. doi: 10.1183/09031936.00000508. [DOI] [PMC free article] [PubMed] [Google Scholar]
- 5.Brittain EL, et al. Fatty acid metabolic defects and right ventricular lipotoxicity in human pulmonary arterial hypertension. Circulation. 2016;133(20):1936–1944. doi: 10.1161/CIRCULATIONAHA.115.019351. [DOI] [PMC free article] [PubMed] [Google Scholar]
- 6.Benson L, et al. Impact of diabetes on survival and right ventricular compensation in pulmonary arterial hypertension. Pulm Circ. 2014;4(2):311–318. doi: 10.1086/675994. [DOI] [PMC free article] [PubMed] [Google Scholar]
- 7.Pugh ME, Robbins IM, Rice TW, West J, Newman JH, Hemnes AR. Unrecognized glucose intolerance is common in pulmonary arterial hypertension. J Heart Lung Transplant. 2011;30(8):904–911. doi: 10.1016/j.healun.2011.02.016. [DOI] [PMC free article] [PubMed] [Google Scholar]
- 8.Graham BB, et al. Severe pulmonary hypertension is associated with altered right ventricle metabolic substrate uptake. Am J Physiol Lung Cell Mol Physiol. 2015;309(5):L435–L440. doi: 10.1152/ajplung.00169.2015. [DOI] [PMC free article] [PubMed] [Google Scholar]
- 9.Fessel JP, et al. Metabolomic analysis of bone morphogenetic protein receptor type 2 mutations in human pulmonary endothelium reveals widespread metabolic reprogramming. Pulm Circ. 2012;2(2):201–213. doi: 10.4103/2045-8932.97606. [DOI] [PMC free article] [PubMed] [Google Scholar]
- 10.Hansmann G, et al. An antiproliferative BMP-2/PPARgamma/apoE axis in human and murine SMCs and its role in pulmonary hypertension. J Clin Invest. 2008;118(5):1846–1857. doi: 10.1172/JCI32503. [DOI] [PMC free article] [PubMed] [Google Scholar]
- 11.Hansmann G, et al. Pulmonary arterial hypertension is linked to insulin resistance and reversed by peroxisome proliferator-activated receptor-gamma activation. Circulation. 2007;115(10):1275–1284. doi: 10.1161/CIRCULATIONAHA.106.663120. [DOI] [PubMed] [Google Scholar]
- 12.Summer R, et al. Adiponectin deficiency: a model of pulmonary hypertension associated with pulmonary vascular disease. Am J Physiol Lung Cell Mol Physiol. 2009;297(3):L432–L438. doi: 10.1152/ajplung.90599.2008. [DOI] [PMC free article] [PubMed] [Google Scholar]
- 13.West J, et al. A potential role for insulin resistance in experimental pulmonary hypertension. Eur Respir J. 2013;41(4):861–871. doi: 10.1183/09031936.00030312. [DOI] [PMC free article] [PubMed] [Google Scholar]
- 14.Trammell AW, et al. Pulmonary vascular effect of insulin in a rodent model of pulmonary arterial hypertension. Pulm Circ. 2017;7(3):624–634. doi: 10.1086/689908. [DOI] [PMC free article] [PubMed] [Google Scholar]
- 15.Samuel VT, Shulman GI. Mechanisms for insulin resistance: common threads and missing links. Cell. 2012;148(5):852–871. doi: 10.1016/j.cell.2012.02.017. [DOI] [PMC free article] [PubMed] [Google Scholar]
- 16.Samuel VT, Petersen KF, Shulman GI. Lipid-induced insulin resistance: unravelling the mechanism. Lancet. 2010;375(9733):2267–2277. doi: 10.1016/S0140-6736(10)60408-4. [DOI] [PMC free article] [PubMed] [Google Scholar]
- 17.Huang RC, et al. Synergy between adiposity, insulin resistance, metabolic risk factors, and inflammation in adolescents. Diabetes Care. 2009;32(4):695–701. doi: 10.2337/dc08-1917. [DOI] [PMC free article] [PubMed] [Google Scholar]
- 18.Malenfant S, et al. Skeletal muscle proteomic signature and metabolic impairment in pulmonary hypertension. J Mol Med. 2015;93(5):573–584. doi: 10.1007/s00109-014-1244-0. [DOI] [PubMed] [Google Scholar]
- 19.Heresi GA, Aytekin M, Newman J, DiDonato J, Dweik RA. Plasma levels of high-density lipoprotein cholesterol and outcomes in pulmonary arterial hypertension. Am J Respir Crit Care Med. 2010;182(5):661–668. doi: 10.1164/rccm.201001-0007OC. [DOI] [PMC free article] [PubMed] [Google Scholar]
- 20.Ascaso JF, Pardo S, Real JT, Lorente RI, Priego A, Carmena R. Diagnosing insulin resistance by simple quantitative methods in subjects with normal glucose metabolism. Diabetes Care. 2003;26(12):3320–3325. doi: 10.2337/diacare.26.12.3320. [DOI] [PubMed] [Google Scholar]
- 21.Giannini C, et al. The triglyceride-to-HDL cholesterol ratio: association with insulin resistance in obese youths of different ethnic backgrounds. Diabetes Care. 2011;34(8):1869–1874. doi: 10.2337/dc10-2234. [DOI] [PMC free article] [PubMed] [Google Scholar]
- 22.Brehm A, Pfeiler G, Pacini G, Vierhapper H, Roden M. Relationship between serum lipoprotein ratios and insulin resistance in obesity. Clin Chem. 2004;50(12):2316–2322. doi: 10.1373/clinchem.2004.037556. [DOI] [PubMed] [Google Scholar]
- 23.Thomas JM, Hullin F, Chap H, Douste-Blazy L. Phosphatidylcholine is the major phospholipid providing arachidonic acid for prostacyclin synthesis in thrombin-stimulated human endothelial cells. Thromb Res. 1984;34(2):117–123. doi: 10.1016/0049-3848(84)90068-9. [DOI] [PubMed] [Google Scholar]
- 24.Rhodes CJ, et al. Plasma metabolomics implicates modified transfer RNAs and altered bioenergetics in the outcomes of pulmonary arterial hypertension. Circulation. 2017;135(5):460–475. doi: 10.1161/CIRCULATIONAHA.116.024602. [DOI] [PMC free article] [PubMed] [Google Scholar]
- 25.Rhodes CJ, et al. Plasma proteome analysis in patients with pulmonary arterial hypertension: an observational cohort study. Lancet Respir Med. 2017;5(9):717–726. doi: 10.1016/S2213-2600(17)30161-3. [DOI] [PMC free article] [PubMed] [Google Scholar]
- 26.Taskinen MR, Borén J. New insights into the pathophysiology of dyslipidemia in type 2 diabetes. Atherosclerosis. 2015;239(2):483–495. doi: 10.1016/j.atherosclerosis.2015.01.039. [DOI] [PubMed] [Google Scholar]
- 27.Ståhlman M, et al. Dyslipidemia, but not hyperglycemia and insulin resistance, is associated with marked alterations in the HDL lipidome in type 2 diabetic subjects in the DIWA cohort: impact on small HDL particles. Biochim Biophys Acta. 2013;1831(11):1609–1617. doi: 10.1016/j.bbalip.2013.07.009. [DOI] [PubMed] [Google Scholar]
- 28.Jeyarajah EJ, Cromwell WC, Otvos JD. Lipoprotein particle analysis by nuclear magnetic resonance spectroscopy. Clin Lab Med. 2006;26(4):847–870. doi: 10.1016/j.cll.2006.07.006. [DOI] [PubMed] [Google Scholar]
- 29.Shalaurova I, Connelly MA, Garvey WT, Otvos JD. Lipoprotein insulin resistance index: a lipoprotein particle-derived measure of insulin resistance. Metab Syndr Relat Disord. 2014;12(8):422–429. doi: 10.1089/met.2014.0050. [DOI] [PMC free article] [PubMed] [Google Scholar]
- 30.Frazier-Wood AC, Garvey WT, Dall T, Honigberg R, Pourfarzib R. Opportunities for using lipoprotein subclass profile by nuclear magnetic resonance spectroscopy in assessing insulin resistance and diabetes prediction. Metab Syndr Relat Disord. 2012;10(4):244–251. doi: 10.1089/met.2011.0148. [DOI] [PMC free article] [PubMed] [Google Scholar]
- 31.Steinberg D, Parthasarathy S, Carew TE, Khoo JC, Witztum JL. Beyond cholesterol. Modifications of low-density lipoprotein that increase its atherogenicity. N Engl J Med. 1989;320(14):915–924. doi: 10.1056/NEJM198904063201407. [DOI] [PubMed] [Google Scholar]
- 32.Xu XH, et al. Toll-like receptor-4 is expressed by macrophages in murine and human lipid-rich atherosclerotic plaques and upregulated by oxidized LDL. Circulation. 2001;104(25):3103–3108. doi: 10.1161/hc5001.100631. [DOI] [PubMed] [Google Scholar]
- 33.Rabinovitch M, Guignabert C, Humbert M, Nicolls MR. Inflammation and immunity in the pathogenesis of pulmonary arterial hypertension. Circ Res. 2014;115(1):165–175. doi: 10.1161/CIRCRESAHA.113.301141. [DOI] [PMC free article] [PubMed] [Google Scholar]
- 34.Shulman GI. Ectopic fat in insulin resistance, dyslipidemia, and cardiometabolic disease. N Engl J Med. 2014;371(23):2237–2238. doi: 10.1056/NEJMc1412427. [DOI] [PubMed] [Google Scholar]
- 35.Heresi GA, Malin SK, Barnes JW, Tian L, Kirwan JP, Dweik RA. Abnormal glucose metabolism and high-energy expenditure in idiopathic pulmonary arterial hypertension. Ann Am Thorac Soc. 2017;14(2):190–199. doi: 10.1513/AnnalsATS.201608-605OC. [DOI] [PMC free article] [PubMed] [Google Scholar]
- 36.Talati MH, et al. Mechanisms of lipid accumulation in the bone morphogenetic protein receptor type 2 mutant right ventricle. Am J Respir Crit Care Med. 2016;194(6):719–728. doi: 10.1164/rccm.201507-1444OC. [DOI] [PMC free article] [PubMed] [Google Scholar]
- 37.Hemnes AR, et al. Evidence for right ventricular lipotoxicity in heritable pulmonary arterial hypertension. Am J Respir Crit Care Med. 2014;189(3):325–334. doi: 10.1164/rccm.201306-1086OC. [DOI] [PMC free article] [PubMed] [Google Scholar]
- 38.Christman BW, et al. An imbalance between the excretion of thromboxane and prostacyclin metabolites in pulmonary hypertension. N Engl J Med. 1992;327(2):70–75. doi: 10.1056/NEJM199207093270202. [DOI] [PubMed] [Google Scholar]
- 39.Sigurdardottir V, Fagerberg B, Hulthe J. Circulating oxidized low-density lipoprotein (LDL) is associated with risk factors of the metabolic syndrome and LDL size in clinically healthy 58-year-old men (AIR study) J Intern Med. 2002;252(5):440–447. doi: 10.1046/j.1365-2796.2002.01054.x. [DOI] [PubMed] [Google Scholar]
- 40.Kao PN. Simvastatin treatment of pulmonary hypertension: an observational case series. Chest. 2005;127(4):1446–1452. doi: 10.1378/chest.127.4.1446. [DOI] [PubMed] [Google Scholar]
- 41.Arbustini E, et al. Plaque composition in plexogenic and thromboembolic pulmonary hypertension: the critical role of thrombotic material in pultaceous core formation. Heart. 2002;88(2):177–182. doi: 10.1136/heart.88.2.177. [DOI] [PMC free article] [PubMed] [Google Scholar]
- 42.Ogura S, et al. Oxidative stress augments pulmonary hypertension in chronically hypoxic mice overexpressing the oxidized LDL receptor. Am J Physiol Heart Circ Physiol. 2013;305(2):H155–H162. doi: 10.1152/ajpheart.00169.2012. [DOI] [PubMed] [Google Scholar]
- 43.Zhang W, et al. LOX-1 mediated phenotypic switching of pulmonary arterial smooth muscle cells contributes to hypoxic pulmonary hypertension. Eur J Pharmacol. 2018;818:84–95. doi: 10.1016/j.ejphar.2017.10.037. [DOI] [PubMed] [Google Scholar]
- 44.Kawut SM, et al. Randomized clinical trial of aspirin and simvastatin for pulmonary arterial hypertension: ASA-STAT. Circulation. 2011;123(25):2985–2993. doi: 10.1161/CIRCULATIONAHA.110.015693. [DOI] [PMC free article] [PubMed] [Google Scholar]
- 45.McLaughlin T, et al. Is there a simple way to identify insulin-resistant individuals at increased risk of cardiovascular disease? Am J Cardiol. 2005;96(3):399–404. doi: 10.1016/j.amjcard.2005.03.085. [DOI] [PubMed] [Google Scholar]
- 46.McLaughlin T, Abbasi F, Cheal K, Chu J, Lamendola C, Reaven G. Use of metabolic markers to identify overweight individuals who are insulin resistant. Ann Intern Med. 2003;139(10):802–809. doi: 10.7326/0003-4819-139-10-200311180-00007. [DOI] [PubMed] [Google Scholar]
- 47.Laws A, Reaven GM. Evidence for an independent relationship between insulin resistance and fasting plasma HDL-cholesterol, triglyceride and insulin concentrations. J Intern Med. 1992;231(1):25–30. doi: 10.1111/j.1365-2796.1992.tb00494.x. [DOI] [PubMed] [Google Scholar]
- 48.Ramirez CE, et al. Treatment with sildenafil improves insulin sensitivity in prediabetes: A randomized, controlled trial. J Clin Endocrinol Metab. 2015;100(12):4533–4540. doi: 10.1210/jc.2015-3415. [DOI] [PMC free article] [PubMed] [Google Scholar]
- 49.Shah SS, Ramirez CE, Powers AC, Yu C, Shibao CA, Luther JM. Hyperglycemic clamp-derived disposition index is negatively associated with metabolic syndrome severity in obese subjects. Metab Clin Exp. 2016;65(6):835–842. doi: 10.1016/j.metabol.2016.02.011. [DOI] [PMC free article] [PubMed] [Google Scholar]
- 50.American Diabetes Association. Standards of medical care in diabetes--2010. Diabetes Care. 2010;33 Suppl 1:S11–S61. doi: 10.2337/dc10-S011. [DOI] [PMC free article] [PubMed] [Google Scholar]
Associated Data
This section collects any data citations, data availability statements, or supplementary materials included in this article.


