Abstract
Background:
This is an immunohistologic study of gene expression between patients and controls.
This study aims to evaluate expression of the catalase gene in hypertrophied ligamentum flavum (LF) specimens obtained from patients with lumbar spinal canal stenosis (LSCS).
LSCS is one of the most common spinal disorders. It is well known that LF hypertrophy plays an important role in the onset of LSCS. Although degenerative changes, aging, and mechanical stress are all thought to contribute to hypertrophy and fibrosis of the LF, the precise pathogenesis of LF hypertrophy remains unknown. Previous genetic studies have tried to determine the mechanism of LF hypertrophy. However, the association between catalase gene expression and LF hypertrophy has not yet been explored.
Methods:
LF specimens were surgically obtained from 30 patients with spinal stenosis (LSCS group) and from 30 controls with lumbar disc herniation (LDH group). LF thickness was measured at the thickest point using calipers to an accuracy of 0.01 mm during surgical intervention. The extent of LF elastin degradation and fibrosis were graded (grades 0–4) by hematoxylin and eosin staining and Masson trichrome staining, respectively. The resulting LF measurements, histologic data, and immunohistologic results were then compared between the 2 groups.
Results:
The average LF thickness was significantly higher in the LSCS group than in the LDH group (5.99 and 2.95 mm, respectively, P = .004). Elastin degradation and fibrosis of the LF were significantly more severe in spinal stenosis samples than in the disc herniation samples (3.04 ± 0.50 vs 0.79 ± 0.60, P = .007; 3.01 ± 0.47 vs 0.66 ± 0.42, P = .009, respectively). Significantly lower expression of catalase was observed in the perivascular area of LF samples obtained from patients with LSCS compared with controls (61.80 ± 31.10 vs 152.80 ± 41.13, respectively, P = .009).
Conclusion:
Our findings suggest that decreased expression of catalase is associated with LF hypertrophy in patients with LSCS.
Keywords: catalase, elastin degradation, fibrosis, ligamentum flavum hypertrophy, lumbar spinal canal stenosis
1. Introduction
Lumbar spinal canal stenosis (LSCS) is one of the most common spinal disorders. It is well established that ligamentum flavum (LF) hypertrophy plays an important role in the genesis of LSCS. When the elastin-to-collagen ratio decreases in the LF, decreased elasticity and increased stiffness or fibrosis will occur.[1,2] This causes narrowing of the spinal canal that compresses the dural sac and nerve roots, resulting in symptoms even in the absence of a bulging annulus fibrosus, herniated nucleus pulposus, or osseous spur.[3] While hypertrophy and fibrosis of the LF are thought to occur due to degenerative changes secondary to the aging process and mechanical stress secondary to instability, the precise pathogenesis of LF hypertrophy remains unknown. Previous studies have reported increases in the expression and activity of various molecules in patients with spinal stenosis, including matrix metalloproteinases (MMPs), miR-155, transforming growth factor beta 1(TGF-β1), connective-tissue growth factor, bone morphogenetic protein, and inflammatory cytokines.[1,4,5] For example, Park et al[6] showed that increased expression of active MMPs (MMP-2 and MMP-13) by LF fibroblasts might relate to elastin degradation and fibrosis of the LF in patients who suffer from LSCS. Significantly higher values of both MMP-2 and MMP-13 were found in patients with spinal stenosis than in patients with disc herniation. Other studies have suggested that TGF-β1, which is synthesized by LF fibroblasts and increases collagen synthesis, is associated with hypertrophy.[4,7] Chen et al[3] explored the relationship between LF hypertrophy and miRNA expression and found that miR-155 was upregulated in patients with lumbar LF hypertrophy. They also reported that the expression level of miR-155 was correlated with thickness and degree of fibrosis of LF.
It is also likely that DNA damage and nucleobase instability contribute to LSCS. Oxidative stress, which results from an imbalance of prooxidant and antioxidant homeostasis, may lead to the production of high levels of reactive oxygen species (ROS).[8,9] High levels of ROS are known to cause damage to lipids, proteins, and DNA in human cells. In a previous study, Dechsupa et al[8] demonstrated that patients with LSCS had higher oxidative DNA damage in hypertrophic LF than in nonpathologic LF. Based on these findings, we predict an alteration of catalase gene expression in hypertrophied LF samples. Catalase is expressed in all major body organs, especially the liver, kidney, and erythrocytes and plays an essential role in cell defense against oxidative stress.[10] Therefore, we hypothesized that a lack of catalase enzyme, which catalyzes hydrogen peroxide into water and oxygen to protect organisms from free radicals, plays a role in LF hypertrophy. Free radicals are known to damage cells and tissues resulting in infection, mental decline, depressed immunity, joint diseases, heart diseases, and fibrosis of many tissues.[11] To the best of our knowledge, there are no previous studies on the association between catalase gene expression and LF hypertrophy.
2. Materials and methods
This retrospective study was conducted at the Department of Neurosurgery Clinic of the Medical Faculty of Kafkas University (Kars, Turkey) between 2013 and 2015. This study was approved by the relevant ethics committee and informed consent was obtained from all patients.
2.1. Participants
Participants comprised 30 patients who had undergone decompressive laminectomy due to LSCS at L4-L5 level (LSCS group) and 30 control patients with lumbar disc herniation (LDH group) and no evidence of LF hypertrophy on magnetic resonance imaging (MRI) (Figs. 1 and 2). Exclusion criteria were previous lumbar disc surgery, vertebrae fracture, any sign of infection, diabetes mellitus, tumors, or any malignancy. A spinal canal <10 mm was accepted as spinal canal stenosis.
Figure 1.
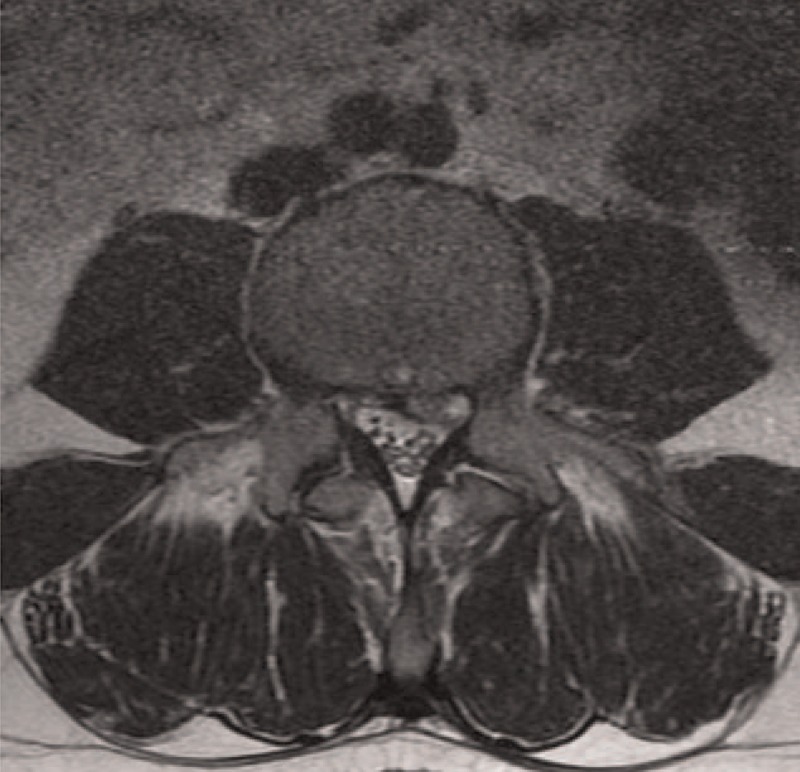
Preoperative magnetic resonance imaging of a patient operated due to lumbar disc herniation. Ligamentum flavum appears to have normal thickness. There is no other evidence of lumbar spinal canal stenosis.
Figure 2.
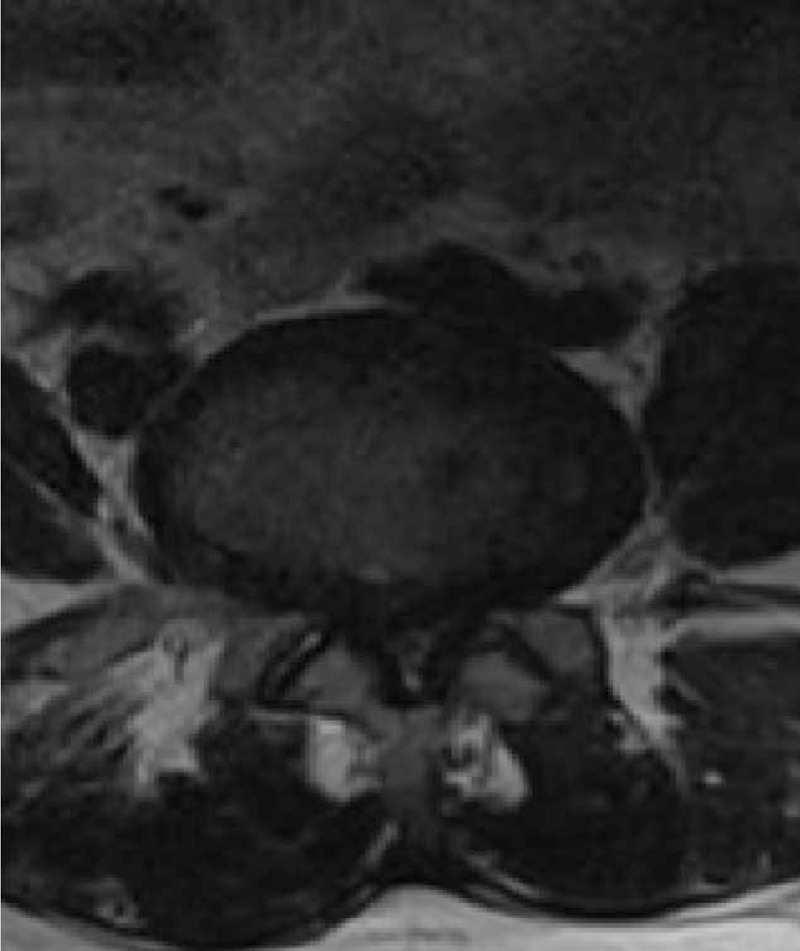
Preoperative magnetic resonance imaging of a patient with lumbar spinal canal stenosis and ligamentum flavum hypertrophy.
All surgeries were performed by the 1st author at Kafkas University Hospital. LSCS and LDH were confirmed on sagittal and axial T1- and T2-weighted MRIs by the authors of this study and 1 skilled radiologist. MRIs were performed on a SIEMENS MR AEREA (1.5 Tesla) scanner.
2.2. Sample collection and measurement of LF thickness
The LF samples were obtained during surgical intervention. We obtained the whole layer of LF samples from all patients. Epidural fat was removed from the LF specimens, and the thickest point was measured using calipers to an accuracy of 0.01 mm. LF thickness was measured at 2 different points, and the largest thickness was used for analysis.
2.3. Histologic analysis
Half of each specimen was fixed in 4% neutral formalin and decalcified with 20% ethylene diamine tetraaceticacid for 4 to 6 weeks. Next, the specimen was embedded in paraffin for histologic analysis. Masson trichrome staining was used to evaluate the degree of fibrosis, and hematoxylin and eosin staining was used to evaluate elastin degradation. Histologic analysis was performed independently by 2 pathologists.
2.4. Masson trichrome staining
The severity of LF fibrosis was graded according to the guidelines by Sairyo et al[12]: grade 0 indicates normal tissue, grade 1 indicates <25% fibrosis of the entire area, grade 2 indicates 25% to 50% fibrosis of the entire area, grade 3 indicates 50% to 75% fibrosis, and grade 4 indicates >75% fibrosis.
2.5. Hematoxylin and eosin staining
The degree of LF elastin degradation was also graded according to the guidelines by Sairyo et al[12]: grade 0 indicates normal tissue showing no elastin degradation region, grade 1 indicates <25% elastin degradation of the entire area, grade 2 indicates 25% to 50% elastin degradation, grade 3 indicates 50% to 75% elastin degradation, and grade 4 indicates >75% elastin degradation.
2.6. Immunohistologic analysis
For immunohistologic staining, consecutive sections were cut on a microtome, deparaffinized in xylene, and rehydrated in alcohol solution. Next, 100 mg of LF tissue was homogenized with fetal bovine serum at 3000 RPM (Tissue-Tearor, 985370-04; BioSpec Products, Inc. Bartlesville, OK) and then lyzed in lysis buffer (50 mM Tris-HCl, pH 7.5, 10 mM ethylene diamine tetra acetic acid, 50 mM NaCl, 0.02% NaN3, 1% Nonidet P-40, 0.25 mM dithiothreitol). After centrifugation at 1500 RPM at 4°C for 30 minutes, the supernatant was obtained. For the analysis of each sample, 30 μg protein was loaded on to a 12% sodium dodecyl sulfate-polyacrylamide gel. The protein concentration of the lyzed LF tissue was determined using a bicinchoninic acid protein assay reagent kit (Pierce BCA protein assay kit no 23225, Thermo Fisher Scientific, Waltham, MA; Pierce Company). After electrophoresis, proteins were transferred to a polyvinylidene difluoride membrane (Millipore, St Quentin, Yvelines, France) for 2 hours at 150 V using transfer buffer. After blocking the nonspecific binding sites overnight, membranes were incubated with purified rabbit polyclonal antibody specific to catalase (rabbit anti-catalase; Cortex Biochem, CR2157RP, San Leandro, California). Mouse antibody specific to glyceraldehyde-3-phosphate dehydrogenase (GAPDH) was used as an internal control for protein loading for all samples (GAPDH antibody (0411): sc-47724). The results were visualized using enhanced chemiluminescence (Amersham Life Sciences, Piscataway, NJ). Blots were quantified using an Imaging Densitometer GF670 and molecular analysis software (Bio-Rad, SAFC Bioscience, Sigma-Aldrich) 3× for each sample, and the average was used as the final density. The density is presented as the mean ± standard deviation (arbitrary units).
2.7. Statistical analysis
Categorical variables are presented as the mean value and range. The Mann–Whitney U test was used to evaluate differences in the degree of LF elastin degradation, fibrosis, and mean optical density (OD) between the 2 groups. A P-value <.05 was considered statistically significant. All data were analyzed using SPSS version 12 statistical analysis software (SPSS Inc, Chicago, IL).
3. Results
3.1. Demographic data
Participant characteristics are presented in Table 1. At the time of surgery, the average age in the LSCS group was 59.1 years (range, 34–79 years) and 44.05 years (range, 32–64 years) in the LDH group. The 2 groups did not differ significantly in terms of age (P = .850) or gender (P = .751).
Table 1.
Patients demographics and histologic findings.

3.2. Thickness of LF samples
The average LF thickness, measured during surgical intervention, was 5.99 mm (range, 4.5–7.02 mm) in the LSCS group and 2.95 mm (range, 1.98–3.2 mm) in the LDH group. The average LF thickness was significantly higher in the LSCS group (P = .004).
3.3. Elastin degradation and fibrosis of LF
In LDH (control) patients, the histologic images showed rich normal elastin fibers organized in a strictly parallel orderand regular arrangement (Fig. 3A). By contrast, in patients with LSCS, the grade of elastin degradation was very high with irregularly arranged elastic fibers shown by hematoxylin and eosin staining (Fig. 3B). The average grade of elastin degradation was significantly higher in specimens from patients with LSCS than from patients with LDH (3.04 ± 0.50 vs 0.79 ± 0.60, respectively, P = .007, Table 1).
Figure 3.
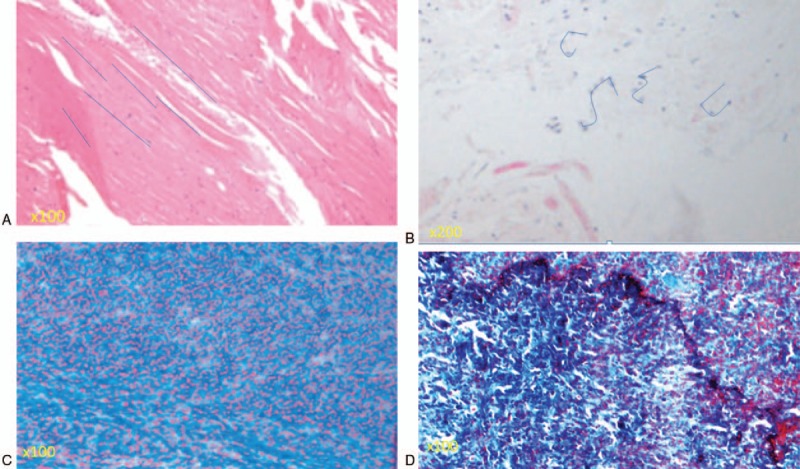
(A) Elastin fibers were organized in the regular arrangement in a patient who underwent surgery due to LDH. Rich normal elastin fibers (grade 0, elastin degradation) were organized in a strictly parallel arrangement, as indicated by the blue lines. (B) The grade of elastin degradation was very high (grade 4) in a patient who underwent surgery due to lumbar spinal canal stenosis (LSCS). An irregular arrangement of elastin fibers was seen, as indicated by the blue lines. (C) Most of the area was stained pink, indicating a normal, nonfibrotic state (grade 0 fibrosis by Masson trichrome staining). (D) A high grade of fibrosis of the ligamentum flavum in a patient who underwent surgery due to LSCS. Most of the area was stained blue, indicating that most of the area was fibrotic (grade 3 fibrosis by Masson trichrome staining).
In the LDH group, non fibrotic images were typically obtained (Fig. 3C). By contrast, large blue areas indicated massive fibrosis in images obtained from patients with LSCS (Fig. 3D). Further, the average grade of LF fibrosis was significantly higher in the LSCS group than in the LDH (control) group (3.01 ± 0.47 vs 0.66 ± 0.42, respectively, P = .009).
3.4. Catalase expression
Gelatin zymography of LF cell culture supernatant showed a sustained decrease in catalase activity in samples from patients with LSCS. In LF cell culture supernatant obtained from patients with LDH, higher catalase activity was observed (Fig. 4A) with standardization using GAPDH (Fig. 4B). The average OD was 61.80 ± 31.10 in the LSCS group and 152.80 ± 41.13 in the LDH group (Table 1, Fig. 5). The mean OD value was significantly lower in the LSCS group than in the LDH group (P = .009).
Figure 4.
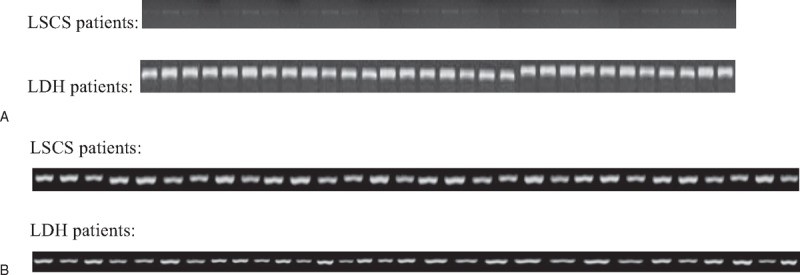
(A) Comparison of expression of the catalase enzyme. Standardization was performed using glyceraldehyde-3-phosphate dehydrogenase (GAPDH) for all samples. (B) GAPDH expressions of all samples.
Figure 5.
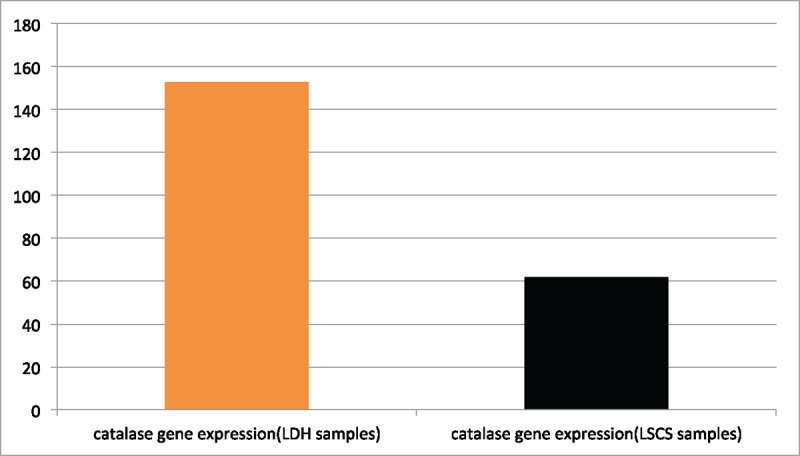
Mean density (arbitrary units). The mean density of the catalase gene was statistically lower in spinal stenosis samples than in disc herniation samples (P = .009).
4. Discussion
The LF covers the posterior and lateral walls of the spinal canal. As the LF thickens, the spinal canal begins to narrow and neural structures become trapped within the canal. In the present study, measurements made during surgery showed that the average LF thickness was significantly greater in patients with LSCS than in patients with LDH. We also demonstrated the presence of irregularly arranged, ruptured, swollen, and decreased elastic fibers as well as increased fibrosis in most areas of hypertrophied LF samples. Sairyo et al previously reported a positive relationship between LF thickness, loss of elasticity, and fibrosis score.[12] Our results are consistent with those of Sairyo et al, and our inclusion of a control group strengthens these findings.
In addition, we sought to determine what biochemical factor might be responsible for histologic changes and LSCS. The catalase enzyme is known to decrease the secretion of structural proteins like collagen and angiopoietin in various connective tissues in the body.[13] Previous studies have shown that overexpression of catalase prevents fibrosis.[14,15] Based on these findings, we hypothesized that a lack of catalase enzyme might play a role in LF hypertrophy. In the present study, we observed substantially lower catalase gene expression in the perivascular area of hypertrophic LF samples. Catalase is well known to protect cells against oxidative stress.[16,17] A previous study postulated that decreases in catalase activity cause abnormal epithelium repair.[14] According to another study, epithelial damage is associated with functional deficiency of catalase during the development of fibrosis.[11] Murthy et al reported that extracellular ROS increases matrix deposition and causes an increase in fibrosis in cells.[15] Also ROS are known as reactive chemical entities that broadly participate in cellular signaling, metabolism, survival, and apoptosis, and thus ROS modulate many physiologic and pathologic processes including cell growth, fibrosis, contraction/dilation, and inflammation.[18] Accordingly, our results suggest that a lack of catalase, which eliminates ROS, may be involved in the mechanism of LF hypertrophy and thus LSCS. This is the 1st study on the relationship between the catalase enzyme and LF hypertrophy and may suggest novel treatment strategies for LSCS.
5. Conclusion
The present study demonstrated that elastin degradation and increased fibrosis are closely related to LF hypertrophy, which is consistent with past studies. In addition, we reported a lack of catalase, which is an antioxidant enzyme, in patients with LSCS. We hope these novel findings have opened a door for future studies.
Author contributions
Conceptualization: Tayfun Çakir.
Data curation: Şeyho Cem Yücetaş.
Investigation: Tayfun Çakir.
Methodology: Şeyho Cem Yücetaş, Tayfun Çakir.
Resources: Tayfun Çakir.
Software: Tayfun Çakir.
Visualization: Tayfun Çakir.
Writing – original draft: Şeyho Cem Yücetaş, Tayfun Çakir.
Writing – review & editing: Tayfun Çakir.
Footnotes
Abbreviations: GAPDH = glyceraldehyde-3-phosphate dehydrogenase, LDH = lumbar disc herniation, LF = ligamentum flavum, LSCS = lumbar spinal canal stenosis, MMP = matrix metalloproteinase, MRI = magnetic resonance imaging, OD = optical density, ROS = reactive oxygen species, TGF-β1 = transforming growth factor beta 1.
The authors have no funding and conflicts of interest to disclose.
References
- [1].Park JB, Lee JK, Park SJ, et al. Hypertrophy of ligamentum flavum in lumbar spinal stenosis associated with increased proteinase inhibitor concentration. J Bone Joint Surg Am 2005;87:2750–7. [DOI] [PubMed] [Google Scholar]
- [2].Honsawek S, Poonpukdee J, Chalermpanpipat C, et al. Hypertrophy of the ligamentum flavum in lumbar spinal canal stenosis is associated with increased bFGF expression. Int Orthop 2013;37:1387–92. [DOI] [PMC free article] [PubMed] [Google Scholar]
- [3].Chen J, Liu Z, Zhong G, et al. Hypertrophy of ligamentum flavum in lumbar spine stenosis is associated with increased miR-155 level. Dis Markers 2014;2014:786543. [DOI] [PMC free article] [PubMed] [Google Scholar]
- [4].Nakatani T, Marui T, Hitora T, et al. Mechanical stretching force promotes collagen synthesis by cultured cells from human ligamentum flavum via transforming growth factor-beta1. J Orthop Res 2002;20:1380–6. [DOI] [PubMed] [Google Scholar]
- [5].Shafaq N, Suzuki A, Terai H, et al. Cellularity and cartilage matrix increased in hypertrophied ligamentum flavum: histopathological analysis focusing on the mechanical stress and bone morphogenetic protein signaling. J Spinal Disord Tech 2012;25:107–15. [DOI] [PubMed] [Google Scholar]
- [6].Park JB, Kong CG, Suhl KH, et al. The increased expression of matrix metalloproteinases associated with elastin degradation and fibrosis of the ligamentum flavum in patients with lumbar spinal stenosis. Clin Orthop Surg 2009;1:81–9. [DOI] [PMC free article] [PubMed] [Google Scholar]
- [7].Park JB, Chang H, Lee JK. Quantitative analysis of transforming growth factor-beta 1 in ligamentum flavum of lumbar spinal stenosis and disc herniation. Spine 2001;26:E492–5.11679833 [Google Scholar]
- [8].Dechsupa S, Yingsakmongkol W, Limthongkul W, et al. Relative telomere length and oxidative DNA damage in hypertrophic ligamentum flavum of lumbar spinal stenosis. Peer J 2018;9:e5381. [DOI] [PMC free article] [PubMed] [Google Scholar]
- [9].Lu F. Reactive oxygen species in cancer, too much or too little? Med Hypotheses 2007;69:1293–8. [DOI] [PubMed] [Google Scholar]
- [10].Glorieux C, Zamocky M, Sandoval JM, et al. Regulation of catalase expression in healthy and cancerous cells. Free Radic Biol Med 2015;87:84–97. [DOI] [PubMed] [Google Scholar]
- [11].Odajima N, Betsuyaku T, Nagai K, et al. The role of catalase in pulmonary fibrosis. Respir Res 2010;11:183. [DOI] [PMC free article] [PubMed] [Google Scholar]
- [12].Sairyo K, Biyani A, Goel VK, et al. Lumbar ligamentum flavum hypertrophy is due to accumulation of inflammation-related scar tissue. Spine (Phila Pa 1976) 2007;32:E340–7. [DOI] [PubMed] [Google Scholar]
- [13].Dong Y, Qu Y, Xu M, et al. Catalase ameliorates hepatic fibrosis by inhibition of hepatic stellate cells activation. Front Biosci (Landmark Ed) 2014;19:535–41. [DOI] [PubMed] [Google Scholar]
- [14].Shi Y, Lo C-S, Chenier I, et al. Overexpression of catalase prevents hypertension and tubulointerstitial fibrosis and normalization of renal angiotensin-converting enzyme-2 expression in Akita mice. Am J Physiol Renal Physiol 2013;304:F1335–46. [DOI] [PMC free article] [PubMed] [Google Scholar]
- [15].Murthy S, Adamcakova-Dodd A, Perry SS, et al. Modulation of reactive oxygen species by Rac1 or catalase prevents asbestos-induced pulmonary fibrosis. Am J Physiol Lung Cell Mol Physiol 2009;297:L846–55. [DOI] [PMC free article] [PubMed] [Google Scholar]
- [16].Heck DE, Shakarjian M, Kim HD, et al. Mechanisms of oxidant generation by catalase. Ann N Y Acad Sci 2010;1203:120–5. [DOI] [PMC free article] [PubMed] [Google Scholar]
- [17].Yamamoto K, Higashiura A, Hossain T, et al. Structural characterization of the catalytic site of a Nilaparvata lugens delta-class glutathione transferase. Arch Biochem Biophys 2015;566:36–42. [DOI] [PubMed] [Google Scholar]
- [18].Yamamoto N, Fukuda K, Matsushita T, et al. Cyclic tensile stretch stimulates the release of reactive oxygen species from osteoblast-like cells. Calcif Tissue Int 2005;76:433–8. [DOI] [PubMed] [Google Scholar]


