

Abstract
Over the last decade, advances in mobile technologies have enabled the development of intelligent systems that attempt to recognize and model a variety of health-related human behaviors. While automated dietary monitoring based on passive sensors has been an area of increasing research activity for many years, much less attention has been given to tracking fluid intake. In this work, we apply an adaptive segmentation technique on a continuous stream of inertial data captured with a practical, off-the-shelf wrist-mounted device to detect fluid intake gestures passively. We evaluated our approach in a study with 30 participants where 561 drinking instances were recorded. Using a leave-one-participant-out (LOPO), we were able to detect drinking episodes with 90.3% precision and 91.0% recall, demonstrating the generalizability of our approach. In addition to our proposed method, we also contribute an anonymized and labeled dataset of drinking and non-drinking gestures to encourage further work in the field.
Keywords: ACM proceedings, LATEX, text tagging
1. INTRODUCTION
A long-standing vision of human-centered intelligent systems has been of machines that can continuously sense, understand, anticipate, and react to human behaviors. While systems that can model the entire spectrum of human activities remain elusive, the mainstream adoption of sensor-laden smartphones and wearable devices has been instrumental in advancing the development of systems that can automatically detect and model health behaviors. An example of a critical health behavior is fluid consumption, i.e., drinking. As the predominant means of supplying water to the body, fluid consumption plays an important role in regulating hydration [23]. While drinking is often triggered by the sensation of thirst in healthy individuals, many people require assistance when it comes to fluid intake. For instance, older adults can be less sensitive to the need to drink, and thus carry lower amounts of water in the body [8]. As a result, seniors and older individuals tend to become more susceptible to dehydration and prone to conditions such as urinary tract infections, pneumonia, confusion, and disorientation. The need to manage fluid intake applies to many other health conditions as well such as chronic heart failure, overactive bladder and eating disorders [11, 12, 14]. Hemodialysis and urolithiasis patients, in particular, must pay increased attention to drinking behavior, and are often in need of interventions to regulate fluid consumption. While the former might often need to restrict drinking, as excessive fluid may exacerbate their condition and lead to mortality [25], the latter are advised to consume more fluid to prevent the recurrence of kidney stones [7]. Managing fluid consumption hinges on the ability to track how much one drinks and when. Traditional fluid intake monitoring approaches rely on subjective, self-report methods, such as 24-hour recalls and daily diaries. Unfortunately, these methods depend on the ability to recall past drinking events, and are prone to biases and memory recollection errors. Such drawbacks greatly increase the risk of false characterizations of fluid consumption, motivating the wearable computing community to develop objective drinking monitoring systems based on passive sensor data. In this paper, we describe a method for automated fluid intake monitoring that leverages inertial sensors in an off-the-shelf activity tracking wrist band. Our analytical approach, based on an adaptive segmentation technique, demonstrated not only promising performance in fluid intake detection but also proved to generalize well in a study with 30 participants. In the experiment, participants engaged in 19 different daily activities meant to simulate a wide range of real-world scenarios. Comparatively, prior research in the field using similar methods have been conducted with a significantly smaller number of participants [2]. The specific contributions of this work are:
A computational method for fluid intake detection based on adaptive windowing and segmentation leveraging the accelerometer sensor in an off-the-shelf activity tracking wristband.
An evaluation of the fluid intake classifier with a dataset compiled in a laboratory study (n=30) and comprised of a variety of realistic everyday activities and gestures (90.3% precision and 91.0% recall, leave-one-participant-out).
An anonymized and labeled dataset containing 3-axis accelerometer signals captured with a wrist-mounted device reflecting drinking and non-drinking behaviors.
2. RELATED WORK
An extensive body of work exists in the areas of automated dietary tracking and fluid intake monitoring. Recently, these have included hand-grasping posture recognition with depth cameras [9], and specialized sensors for tracking dietary-related sounds and specific body movements, e.g., jawbone. [10, 16, 26]. In the context of fluid intake, Mengistu et al. presented AutoHydrate, a microphone-based automated hydration monitoring system. Eight participants were recruited for the evaluation of the system, and drinking detection accuracy of 91.5% was obtained in a controlled lab setting. AutoDietary employed a similar sensing configuration and reported accuracy of 97.6% [5]. Despite these promising results, it is worth noting that the need for a microphone to be placed on the neck for collecting acoustic signal presents a significant challenge for the mainstream uptake of both AutoHydrate and AutoDietary. Given the ubiquity of smartphones and growing popularity of wearables, it is not surprising that much activity in dietary and fluid intake monitoring has made use of these types of devices. Bae et al. used built-in sensors in smartphones to detect the beginning of alcohol drinking events [3]. In the study, sensor data such as acceleration, location information, and communication logs were used to characterize drinking, non-drinking, and heavy drinking episodes. The researchers analyzed data from 30 young adults between 21 and 28 years old and obtained 96.6% accuracy for distinguishing these activity classes. Despite the promising results, the aim of this work was not to detect regular drinking activity throughout daily life. Instead, it narrowed its scope to alcohol drinking activity. The work that is most closely related to ours is the one by Amft et al. [2]. In this research, the authors also explored the possibility of recognizing drinking moments from wrist-mounted inertial sensors. Methodologically, the Mann-Whitney-Wilcoxon test was chosen for feature selection and the feature similarity search technique was picked for signal pattern modeling. Six participants and 560 drinking motion instances were captured in the study. Drinking motion spotting was obtained with average precision of 94% and recall of 84%. Despite these very encouraging results, this study involved a small number of participants and did not employ a consumer-grade wristband device such as many of the activity tracking wearables popular today; at the time the study took place, these wearable systems were not yet available. Therefore, the two key aims of our work in light of this prior work are to test whether a practical approach leveraging an off-the-shelf wearable produces equivalent performance results, and to evaluate whether said approach generalizes to a larger set of individuals.
3. MODELING FLUID INTAKE GESTURES
Over the past decades, an extensive body of work has been dedicated to gesture recognition [17, 19–21]. According to McNeil and Kendon, a gesture can be segmented in five phases, namely, preparation, pre-stroke hold, stroke, post-stroke hold, and retraction [17, 19]. Fluid intake activity also gives rise to a characteristic pattern that can be segmented into five phases as suggested by McNeil and Kendon (See Figure 1). A key characteristic of fluid intake is the set of motion patterns performed by the hand, wrist and arm during the act of drinking. In the general case where a fluid container (e.g., a cup or glass of water) is sitting on a table, these motion patterns include (1) grasping the container, (2) elevating it towards the mouth, (3) tilting the container such that the fluid flows into the mouth, (4) lowering the container back to its original position on the table, (5) and finally releasing it. When captured by inertial sensors placed on the wrist, these motion patterns constitute a stable behavior marker of fluid intake as shown in Figure 1. This is the case despite differences in the shape of the signal due to interpersonal variability, container shape, container size, fluid type, speed of intake, and other factors. Therefore, in this work, we model this drinking signature and use it as an indicator of fluid intake activity.
Figure 1:
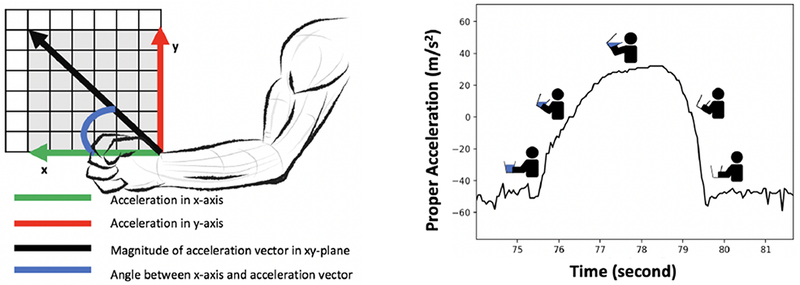
The raw and computed accelerometer signals we analyzed (left) and the pattern of a fluid intake gesture from beginning to end.
4. DATA COLLECTION
To computationally model drinking gestures from inertial sensor data and evaluate the performance of our approach, we conducted an IRB-approved human-subjects study. To encourage further research in the field, we are making the dataset we compiled from this study publicly available.
4.1. Participant Recruitment
Participants were recruited through the Penn State Study Finder service. Prospective participants (n = 56) completed a telephone screening to assess interest and determine eligibility. Eligible participants (n = 30) were 18 years or older, fluent in spoken English, owned a smartphone, had no limitations in standing, moving or picking up things without assistance, had no limitations that impacted their ability to drink, and were willing to complete the study procedures (e.g., being video recorded while filling out questionnaires, drinking water, interacting with another participant). Height and weight were measured using a wall-mounted stadiometer and digital scale. Demographic characteristics were measured via self-reports (e.g., age, sex, race, ethnicity, education). Two Wavelet Health wristbands were worn by each participant to capture inertial data at the left and right wrists. Accelerometer data was captured at a sample rate of 20 Hz.
4.2. Procedures
Participants were scheduled in dyads (i.e. 2 participants per session) and asked to wear loose clothing, to bring a meal to the session, and not to drink for 2 hours before the lab session. Following introductions, a research assistant described the study and participants provided written informed consent. One research assistant initiated recording with two wall-mounted video cameras in opposite corners of the room while the other research assistant measured each participants’ height and weight. Then, participants completed a baseline questionnaire assessing demographics. The research assistants then outfitted each participant with the Wavelet Health wristbands. Next, participants completed a scripted activity to sync the sensor and video data. The research assistant gave each participant several containers filled with water (i.e., a cup, water bottle, wine glass and coffee mug) with instructions to drink ad libitum throughout the protocol and to notify a research assistant if they needed more water. Participants were asked to take at least one sip from each container. The research assistant then placed all containers aside with the exception of the cup. For the first phase of the protocol, participants then watched three movie trailers while eating popcorn, engaged in a prompted discussion of the trailers (Have you seen any of these movies? Which movie would you want to see? What’s your favorite movie?), brushed their teeth and hair at a sink and mirror in the lab, and read magazines and answered a phone call from the researcher on their cell phone. Participants had a brief break to use the restroom outside the lab while a research assistant replaced the cup of water with a water bottle for the second phase of the protocol. Upon returning, participants copied a picture from paper onto a free standing dry erase board, copied that drawing onto a piece of paper, typed a note on their smartphone describing their drawing, took a photo of the drawing, and washed their hands at the sink in the lab. The research assistant replaced the water bottle with a wine glass for the third phase of the protocol. Participants ate the meal they brought, washed their hands, put a lab coat on over their clothing and buttoned the lab coat, put a scrub top over the lab coat, and removed both the scrub top and lab coat. The research assistant replaced the wine glass with a coffee mug for the final phase of the protocol. Participants folded laundry (towel, t-shirts), sat at a computer workstation to search for and browse their favorite news website, walked up and down the hallway and stairs outside the lab having a conversation with the experimenter, returned to the lab, played three games of catch using balls of various sizes, and sat to complete a free-writing exercise about the protocol as a whole. Participants wore the sensors throughout this protocol and the wall-mounted cameras recorded continuously.
5. ANALYTICAL METHOD
We processed the 3-axis accelerometer sensor signals using an activity recognition pipeline spanning multiple stages, from preprocessing and frame extraction to classification. Early in this pipeline we derived two additional time series based on the x and y accelerometer channels, as seen in Figure 1. One additional time series was obtained by taking the inverse tangent of the ratio of y-series to x-series (i.e. ). The other time series was generated by calculating the L2 norm (i.e. ). These signals provided information about the angular motion of wrist during drinking activity on the xy-plane.
5.1. Adaptive Segmentation
In time series-based activity recognition, a sliding window of fixed length is commonly used to extract frames from the underlying sensor signals. While this approach has been employed in many applications with success, it is often suboptimal since the duration of many relevant behaviors can be variable [15], such as with drinking activity (Figure 3). To circumvent this problem, we adopted the adaptive windowing approach proposed by Laguna et al. [18]. This allowed us to match frames to the exact duration of drinking instances. Our adaptive segmentation approach consisted of 4 steps. Firstly, we computed a z-score measure to standardize the input signal [1]. Secondly, we preset the window size length to 1-second with no overlap between adjacent frames. Next, the window size is expanded bidirectionally from the 1-second preset until the signal within the window meets a certain condition: the amplitude difference between the maximum value and the final values of the signal in the frame is greater than an amplitude threshold. In our study, the amplitude threshold was set to a z-score value of 1.5 based on heuristic evaluation. If the condition is met, the window expansion stops; otherwise, the window size expands by 0.5 seconds in each direction. If the condition is not met after 10 iterations, the window size is set back to 1 second. This algorithm is illustrated in (See Figure 2).
Figure 3:
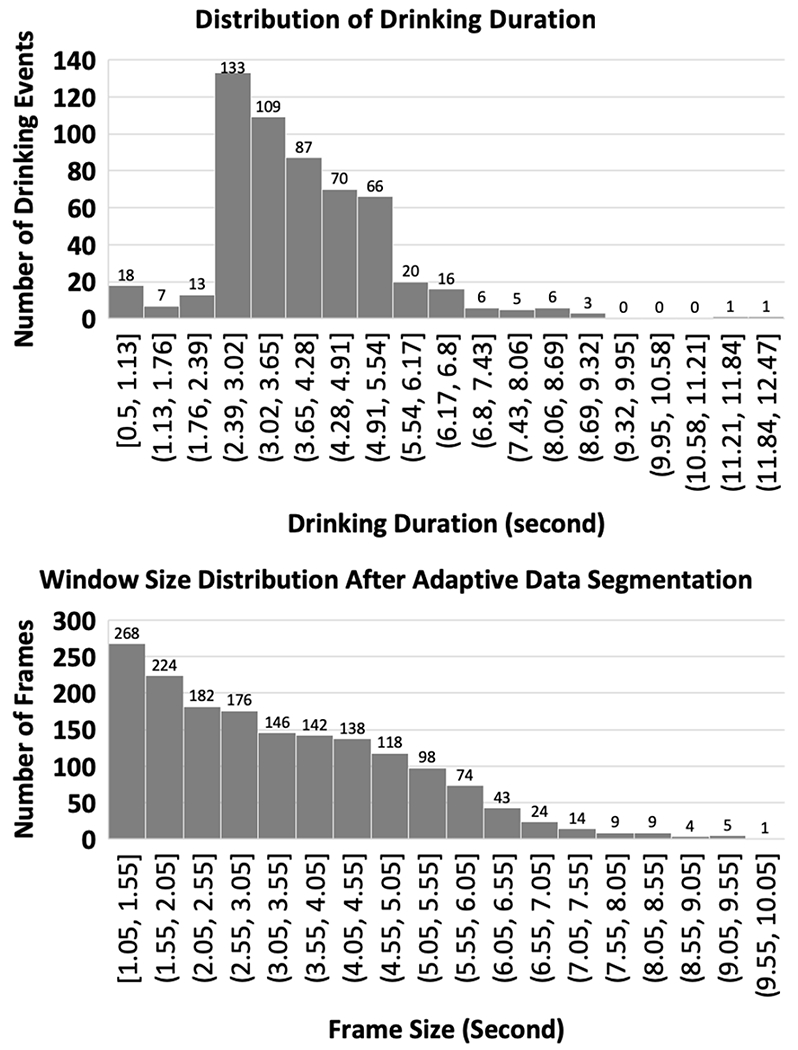
The top histogram shows the distribution of fluid intake gesture durations for all drinking instances from the lab study. The bottom histogram shows the distribution of expanded frames from a single participant after adaptive segmentation. Unexpanded frames (≤ 1 second ) are not shown
Figure 2:
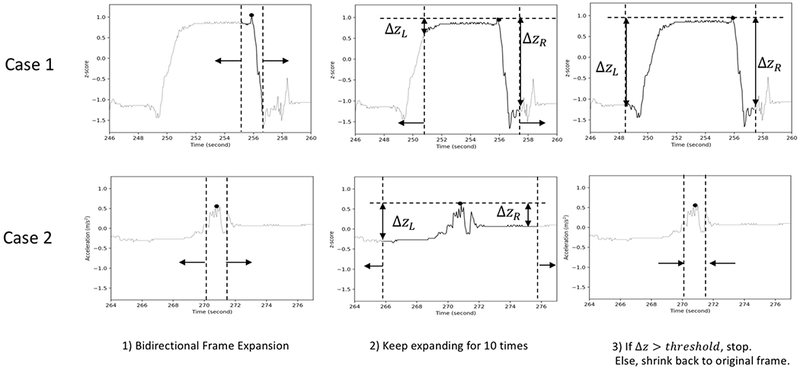
The figure shows segments of x-acceleration time series from the left hand. The space between two vertical dashed lines indicates frame size, and the horizontal dashed line indicates the maximum value from the original frame. Case 1 shows the expansion of frame for drinking signal where the frame size is expanded as a result of pattern-based segmentation. Case 2 shows a non-drinking signal whose frame size is unchanged at the end of pattern-based segmentation. Δz is is amplitude difference between the maximum value in the original frame and the boundary values of the frame. From the original 1-second window, frame size expands bidirectionally for 10 times with a step size of 0.5 second. If Δz is greater than the amplitude threshold, frame size remains expanded. Otherwise, frame size shrinks back to the original size.
5.2. Feature Extraction and Classification
To prepare data sets for training, we generated frames with a 1-second sliding window and we applied adaptive segmentation to better refine the frame lengths. Then, we extracted features from each frame. If the frame contained drinking, it was labeled as drinking. Otherwise, it was labeled non-drinking. Then, the features and labels from all training frames were input to the classifier.
We started by exploring simple features (e.g. minimum and maximum values, FFT features and etc.) and incrementally included more processed features (e.g. from cross-correlation and data fusion), comparing the performance of classifier. We utilized a total of 45 features for the analysis, itemized in Table 1.
Table 1:
Summary of features used in the analysis.
| Feature | Feature Description |
|---|---|
| 1-2 | maximum value of acceleration along the x and y-axis |
| 3-4 | minimum value of acceleration along the x and y-axis |
| 5-6 | skewness of acceleration along the x and y-axis |
| 7-8 | skewness of FFT of acceleration along the x and y-axis |
| 9-10 | kurtosis of FFT of acceleration along the x and y-axis |
| 11-12 | integral of FFT of acceleration along the x and y-axis from 0 Hz to 1.25 Hz |
| 13-14 | maximum of FFT of acceleration along the x and y-axis from 0 Hz to 1.25 Hz |
| 15-16 | integral of cross-correlated values of x and y acceleration with anormal distribution |
| 17-18 | mean of cross-correlated values for x and y acceleration |
| 19-20 | variance of cross-correlated values of x-acceleration and a normal distribution |
| 21-32 | maximum of cross-correlated values of x-acceleration and a normal distribution |
| 23-30 | amplitude difference between the end values and the maximum and the minimum |
| 31-34 | number of maximum and minimum values in x-acceleration and y-acceleration |
| 35-36 | maximum and minimum of inverse tangent of y-acceleration and x-acceleration |
| 37 | mean of inverse tangent of y-acceleration and x-acceleration |
| 38 | skewness ofinverse tangent of y-acceleration and x-acceleration |
| 39 | kurtosis ofinverse tangent of y-acceleration and x-acceleration |
| 40 | variance of inverse tangent of y-acceleration and x-acceleration |
| 41-42 | maximum and minimum acceleration magnitude in xy-plane |
| 43 | variance of acceleration magnitude in xy-plane |
| 44 | skewness ofacceleration magnitude in xy-plane |
| 45 | kurtosis of acceleration magnitude in xy-plane |
For classification, we considered several models and approaches including Hidden Markov Models (HMMs), nearest neighbor models (k-NN) and DTW. We obtained best results using the Random Forest (RF) learning algorithm [13] from the scikit-learn library [22]. RF has performed well in a number of gesture spotting applications [4, 24] and is particularly compelling because it does not require much parameterization to perform well. The measure of feature importance as calculated by “mean decrease impurity” [6] indicated that features 11, 13, 7 and 9 proved to be the most informative.
6. EVALUATION AND RESULTS
To reiterate, a key goal of our work is to demonstrate a generalizable method for detecting fluid intake. Towards this end, we evaluated our method using the Leave-One-Participant-Out (LOPO) crossvalidation performance metric, where data from 29 participants was used for training and the remaining participant’s data was used for testing, iteratively. Due to class imbalance, i.e., much larger number of non-drinking events compared to drinking events, we randomly sub-sampled the non-drinking frames such that the ratio of drinking frames to non-drinking frames was 1-to-70 (i.e., the number of non-drinking frames is 70 times greater than the number of drinking frames). Overall, we obtained an average precision of 90.3% and an average recall of 91.0% across the 30 participants. Figure 4 shows F-measures for each participant.
Figure 4:
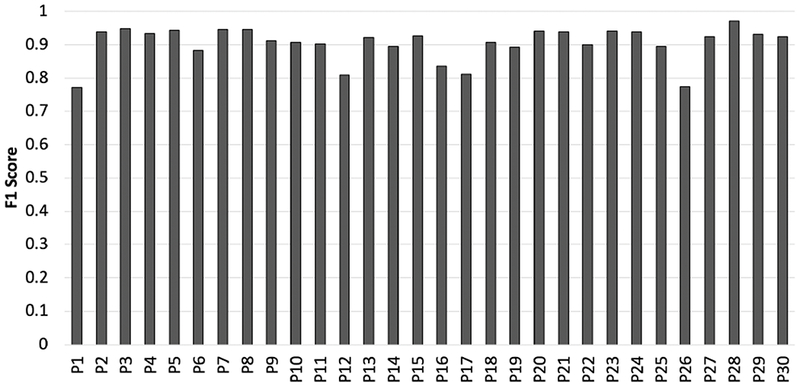
F1 score for participants from the lab study is shown in the figure. The majority of participants resulted in F1 score of 0.9 or greater.
7. DISCUSSION
7.1. Strength and Weakness
We used an off-the-shelf wristband to detect drinking activity. This approach provides several benefits over other fluid intake tracking methods. Firstly, our drinking detection algorithm can more easily scale. Secondly, our approach does not necessitate fluids to be directly consumed from a container as is the case in smart water bottles. Thus, users are not limited by the containers and can drink from a variety of containers of their choice. Lastly, wristbands are smaller in size and less obstructive compared with other drinking monitoring devices (e.g. neckbands or smart water bottles). Despite these strengths of our approach, we identified weaknesses in our approach. Since our approach heavily relies on the acceleration data, if drinking happens without using hands (e.g. drinking using a straw), drinking activity will not be detected. Also, given that many people usually put on a single wristband on their hands, drinking activities from the opposite hand might be hard to detect.
7.2. Adaptive Segmentation
The top histogram in Figure 3 shows the distribution of drinking periods, and the bottom histogram demonstrates expanded frames after adaptive segmentation. As can be seen in the bottom histogram, adaptive segmentation allows for the broad distribution of frames. This broad distribution provides our approach the versatility to the wide variability of drinking durations. While the expanded frames do not necessarily contain drinking signals, they are more likely to capture drinking signals than those that remain unexpanded because if the frames remain expanded, it means the frames satisfied the expansion condition. It is to be noted that for shorter frames, frame expansion may happen due to sudden motion (e.g. sudden movement of the wrist) even if the drinking signal is not present in the frame. Because of this false expansion, the frequency of expanded frames between 1.05 seconds and 2.55 seconds is high even if the frequency of drinking for the corresponding period is low(See Figure 3). However, as the signals contained in the erroneously expanded frames are not reflective of drinking, such frames are correctly classified as non-drinking. In our analysis, we compared the performance of the classifier before and after adaptive segmentation and observed significant improvement in precision and recall after adaptive segmentation.
8. CONCLUSION
We implemented and evaluated an approach for fluid intake detection leveraging wrist-mounted inertial sensors. Using adaptive window segmentation, we obtained promising results with a large number of participants, demonstrating the generalizability of the technique. Despite the need for further experiments in ecologically-valid settings, we are encouraged by our findings. This is particularly true because we believe our proposed method is not only practical but also scalable, as it does not require a specialized sensor or dedicated device like a smart water bottle. Instead, it makes use of inertial sensors in commodity devices such as smartwatches and activity bands, whose mainstream adoption continues to grow.
ACKNOWLEDGMENTS
This project was supported by the Penn State CTSI Grant (UL Tr000127) from the National Center for Advancing Translational Sciences, National Institutes of Health. The content is solely the responsibility of the authors and does not necessarily represent the official views of the NIH.
Footnotes
CCS CONCEPTS
• Human-centered computing → Empirical studies in ubiquitous and mobile computing • Applied computing → Health informatics
Contributor Information
Keum San Chun, The University of Texas at Austin, Austin, Texas, gmountk@utexas.edu.
Ashley B. Sanders, The Pennsylvania State University, University Park, Pennsylvania, abs63@psu.edu
Rebecca Adaimi, The University of Texas at Austin, Austin, Texas, rebecca.adaimi@utexas.edu.
Necole Streeper, The Pennsylvania State University, University Park, Pennsylvania, nstreeper@pennstatehealth.psu.edu.
David E. Conroy, The Pennsylvania State University, University Park, Pennsylvania, conroy@psu.edu
Edison Thomaz, The University of Texas at Austin, Austin, Texas, ethomaz@utexas.edu.
REFERENCES
- [1].Shalabi Luai Al, Shaaban Zyad, and Kasasbeh Basel. 2006. Data mining: A preprocessing engine. Journal of Computer Science 2, 9 (2006), 735–739. [Google Scholar]
- [2].Amft Oliver, Bannach David, Pirkl Gerald, Kreil Matthias, and Lukowicz Paul. 2010. Towards wearable sensing-based assessment of fluid intake. In Pervasive Computing and Communications Workshops (PERCOM Workshops), 2010 8th IEEE International Conference on IEEE, 298–303. [Google Scholar]
- [3].Bae Sangwon, Ferreira Denzil, Suffoletto Brian, Puyana Juan C, Kurtz Ryan, Chung Tammy, and Dey Anind K. 2017. Detecting Drinking Episodes in Young Adults Using Smartphone-based Sensors. Proceedings of the ACM on Interactive, Mobile, Wearable and Ubiquitous Technologies 1, 2 (2017), 5. [DOI] [PMC free article] [PubMed] [Google Scholar]
- [4].Bedri Abdelkareem, Li Richard, Haynes Malcolm, Kosaraju Raj Prateek, Grover Ishaan, Prioleau Temiloluwa, Beh Min Yan, Goel Mayank, Starner Thad, and Abowd Gregory. 2017. EarBit: Using Wearable Sensors to Detect Eating Episodes in Unconstrained Environments. Proceedings of the ACM on Interactive, Mobile, Wearable and Ubiquitous Technologies 1, 3 (2017), 37. [DOI] [PMC free article] [PubMed] [Google Scholar]
- [5].Bi Yin, Lv Mingsong, Song Chen, Xu Wenyao, Guan Nan, and Yi Wang. 2016. AutoDietary: A wearable acoustic sensor system for food intake recognition in daily life. IEEE Sensors Journal 16, 3 (2016), 806–816. [Google Scholar]
- [6].Breiman Leo. 2017. Classification and regression trees. Routledge. [Google Scholar]
- [7].Cheungpasitporn Wisit, Rossetti Sandro, Friend Keith, Erickson Stephen B, and Lieske John C. 2016. Treatment effect, adherence, and safety of high fluid intake for the prevention of incident and recurrent kidney stones: a systematic review and meta-analysis. Journal of nephrology 29, 2 (2016), 211–219. [DOI] [PMC free article] [PubMed] [Google Scholar]
- [8].Chidester June C and Spangler Alice A. 1997. Fluid intake in the institutionalized elderly. Journal of the American Dietetic Association 97, 1 (1997), 23–28. [DOI] [PubMed] [Google Scholar]
- [9].Chua Jia-Luen, Chang Yoong Choon, Jaward Mohamed Hisham, Parkkinen Jussi, and Wong Kok-Sheik. 2014. Vision-based hand grasping posture recognition in drinking activity. In Intelligent Signal Processing and Communication Systems (ISPACS), 2014 International Symposium on IEEE, 185–190. [Google Scholar]
- [10].Chun Keum San, Bhattacharya Sarnab, and Thomaz Edison. 2018. Detecting Eating Episodes by Tracking Jawbone Movements with a Non-Contact Wearable Sensor. Proceedings of the ACM on Interactive, Mobile, Wearable and Ubiquitous Technologies 2, 1 (2018), 4. [Google Scholar]
- [11].Hart Susan, Abraham Suzanne, Luscombe Georgina, and Russell Janice. 2005. Fluid intake in patients with eating disorders. International Journal of Eating Disorders 38, 1 (2005), 55–59. [DOI] [PubMed] [Google Scholar]
- [12].Hashim Hashim and Mousa Riyad Al. 2009. Management of fluid intake in patients with overactive bladder. Current urology reports 10, 6 (2009), 428. [DOI] [PubMed] [Google Scholar]
- [13].Ho Tin Kam. 1995. Random decision forests. In Document Analysis and Recognition, 1995., Proceedings of the Third International Conference on, Vol. 1 IEEE, 278–282. [Google Scholar]
- [14].Holst Marie, Stromberg Anna, Lindholm Maud, and Willenheimer Ronnie. 2008. Description of self-reported fluid intake and its effects on body weight, symptoms, quality of life and physical capacity in patients with stable chronic heart failure. Journal of clinical nursing 17, 17 (2008), 2318–2326. [DOI] [PubMed] [Google Scholar]
- [15].Huáżşnh Tâm, Blanke Ulf, and Schiele Bernt. 2007. Scalable recognition of daily activities with wearable sensors. In International Symposium on Location-and Context-Awareness Springer, 50–67. [Google Scholar]
- [16].Kalantarian H, Alshurafa N, and Sarrafzadeh M. 2014. A Wearable Nutrition Monitoring System. In Wearable and Implantable Body Sensor Networks (BSN), 2014 11th International Conference on 75–80. [Google Scholar]
- [17].Kendon Adam. 2004. Gesture: Visible action as utterance. Cambridge University Press. [Google Scholar]
- [18].Laguna Javier Ortiz Olaya Angel García, and Borrajo Daniel. 2011. A dynamic sliding window approach for activity recognition. In International Conference on User Modeling, Adaptation, and Personalization Springer, 219–230. [Google Scholar]
- [19].McNeill David. 1992. Hand and mind: What gestures reveal about thought. University of Chicago press. [Google Scholar]
- [20].Mousas Christos. 2017. Full-body locomotion reconstruction ofvirtual characters using a single inertial measurement unit. Sensors 17, 11 (2017), 2589. [DOI] [PMC free article] [PubMed] [Google Scholar]
- [21].Mousas Christos, Newbury Paul, and Anagnostopoulos Christos-Nikolaos. 2014. Analyzing and segmenting finger gestures in meaningful phases. In 2014 11th International Conference on Computer Graphics, Imaging and Visualization (CGIV) IEEE, 89–94. [Google Scholar]
- [22].Pedregosa F, Varoquaux G, Gramfort A, Michel V, Thirion B, Grisel O, Blondel M, Prettenhofer P, Weiss R, Dubourg V, Vanderplas J, Passos A, Cournapeau D, Brucher M, Perrot M, and Duchesnay E. 2011. Scikit-learn: Machine Learning in Python. Journal of Machine Learning Research 12 (2011), 2825–2830. [Google Scholar]
- [23].Sawka MN. 2005. Dietary reference intakes for water,potassium, sodium, chloride, and sulfate.
- [24].Thomaz Edison, Essa Irfan, and Abowd Gregory D. 2015. A practical approach for recognizing eating moments with wrist-mounted inertial sensing. In Proceedings of the 2015 ACM International Joint Conference on Pervasive and Ubiquitous Computing ACM, 1029–1040. [DOI] [PMC free article] [PubMed] [Google Scholar]
- [25].Wizemann Volker, Wabel Peter, Chamney Paul, Zaluska Wojciech, Moissl Ulrich, Rode Christiane, Teresa Malecka-Masalska, and Daniele Marcelli. 2009. The mortality risk of overhydration in haemodialysis patients. Nephrology Dialysis Transplantation 24, 5 (2009), 1574–1579. [DOI] [PMC free article] [PubMed] [Google Scholar]
- [26].Yatani Koji and Truong Khai N. 2012. BodyScope: a wearable acoustic sensor for activity recognition. UbiComp ‘12: Proceedings of the 2012 ACM Conference on Ubiquitous Computing (2012), 341–350. [Google Scholar]