

SUMMARY
Chromatin loops enable transcription factor-bound distal enhancers to interact with their target promoters to regulate transcriptional programs. Although developmental transcription factors, such as active forms of Notch, can directly stimulate transcription by activating enhancers, the effect of their oncogenic subversion on the 3-dimensional (3D) organization of cancer genomes is largely undetermined. By mapping chromatin looping genome-wide in Notch-dependent triple-negative breast cancer and B-cell lymphoma, we show that beyond the well-characterized role of Notch as an activator of distal enhancers, Notch regulates its direct target genes through instructing enhancer repositioning. Moreover, a large fraction of Notch-instructed regulatory loops forms highly interacting enhancer and promoter spatial clusters, termed “3D cliques”. Loss-and gain-of-function experiments show that Notch preferentially targets hyperconnected 3D cliques that regulate the expression of crucial proto-oncogenes. Our observations suggest that oncogenic hijacking of developmental transcription factors can dysregulate transcription through widespread effects on the spatial organization of cancer genomes.
Graphical Abstract
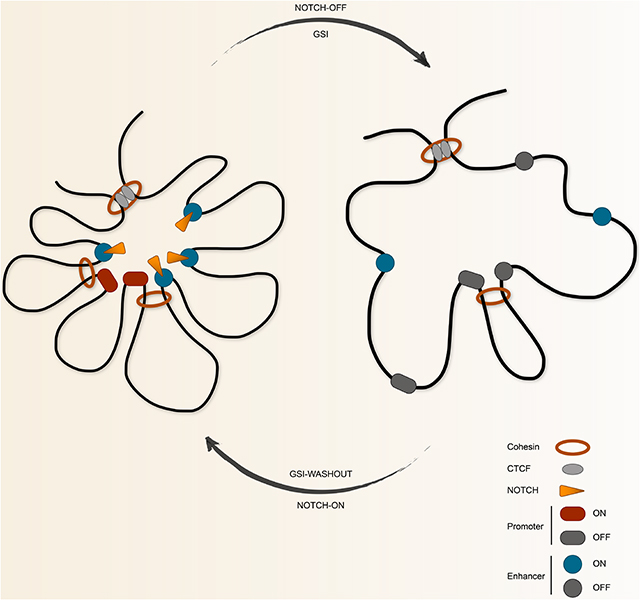
Petrovic and Zhou et al. map DNA looping dynamics in triple-negative breast cancer and B-cell lymphoma undergoing inhibition and reactivation of oncogenic Notch signaling and reveal that pre-existing and Notch-instructed loops coalesce enhancers and promoters to form highly interacting spatial clusters to regulate activity of key oncogenes such as MYC.
INTRODUCTION
Folding of chromatin into structural and regulatory loops is emerging as an important regulator of gene expression (Furlong and Levine, 2018; Hnisz et al., 2016a; Rowley and Corces, 2018). Chromatin misfolding due to genomic rearrangements or dysregulation of architectural proteins has been reported in cancer (Flavahan et al., 2016; Hnisz et al., 2016b; Katainen et al., 2015), yet chromatin-folding reorganization in response to oncogenic subversion of developmental transcription factors, a frequent class of oncogenic drivers, is not well understood. Notch transcription complexes control cellular development and tissue homeostasis and when dysregulated contribute to the pathogenesis of multiple malignancies (Aster et al., 2017). Here, we use Notch-dependent cancer cells to examine the role of oncogenic transcription factors on repositioning of distal regulatory elements.
Notch target genes play crucial oncogenic roles in several hematologic malignancies and solid tumors (Aster et al., 2017). Activating Notch mutations often disrupt the Notch negative regulatory region (NRR) or C-terminal PEST degron domain, producing ligand-independent release of the Notch intracellular domain (NICD) or an increase in NICD half-life, respectively. NICDs translocate to the nucleus and form Notch transcription complexes (NTCs) with the DNA- binding factor RBPJ and other co-factors. Oncogenic Notch recruits histone acetyltransferase p300 (Oswald et al., 2001), histone demethylase KDM1A (Mulligan et al., 2011) and components of the Mediator complex (Fryer et al., 2004) to Notch-responsive elements to regulate gene expression. In hematologic malignancies, Notch binding events are often associated with increased histone acetylation and activation of distal enhancers (Wang et al., 2014). Direct regulation of the proto-oncogene MYC in both B- and T-lymphoid malignancies by Notch-activated enhancers, which are located up to 1.5 Mb away from the MYC promoter, exemplifies Notch-dependent long-range gene regulation (Herranz et al., 2014; Ryan et al., 2017; Yashiro-Ohtani et al., 2014). Although looping of chromatin, which enables physical contact between Notch-bound enhancers and promoters, is essential for proper and selective gene expression, it remains unclear to what extent Notch influences long-range regulatory contacts.
Chromatin loops, juxtaposing transcription factor-bound distal enhancers with the promoters of target genes are facilitated by architectural proteins, including the DNA-binding insulator protein CCCTC-binding factor (CTCF) and cohesin (Rowley and Corces, 2018). Ring-shaped cohesin complexes are loaded at active enhancers and promoters to stabilize their physical interactions (Kagey et al., 2010). Enhancer-promoter loops are mostly constrained within higher-order genome organizational structures, variably referred to as contact domains, interaction domains, topologically associated domains (TADs), sub-TADs, loop domains, and insulated neighborhoods, the boundaries of which are occupied by cohesin complexes and CTCF (Dixon et al., 2012; Dowen et al., 2014; Nora et al., 2012). More recently, it was shown that the ubiquitous transcription factor YY1, in addition to a limited number of architectural proteins, binds to enhancers and facilitates their looping to promoters, suggesting that enhancer-promoter repositioning could be instructed by particular transcription factors bound at DNA elements engaged in transcriptional regulation (Weintraub et al., 2017).
Oncogenic Notch binds distal enhancers (Ryan et al., 2017; Wang et al., 2014), raising the question whether oncogenic Notch regulates transcription by instructing enhancer repositioning. To investigate the impact of oncogenic Notch on the 3D genome organization of cancer cells, we generated cohesin HiChIP and 1D epigenomic data sets in two Notch-dependent cancer types, triple-negative breast cancer (TNBC) and mantle cell lymphoma (MCL), in the Notch-on and -off states. We report here that Notch transcription complexes control their direct target genes through two distinct regulatory modes: either through existing loops or by facilitating new long-range regulatory interactions. This combination of pre-existing and Notch-instructed loops coalesce enhancers and promoters to form highly interacting clusters, termed “3D cliques”. In cancer cells, Notch preferentially activates enhancers and promotes looping interactions within highly connected 3D cliques that regulate key oncogenes. These observations suggest a general mechanism that oncogenic transcription factors can exploit to induce the transcriptional outputs of cancer cells.
RESULTS
Contact domains of Notch-mutated cells are lineage invariant
Protein-centric genome-wide chromatin conformation capture methods such as HiChIP, PLAC-seq and ChIA-PET were used to accurately map chromatin contact domains in multiple cell types (Dowen et al., 2014; Fang et al., 2016; Mumbach et al., 2016). Given that the cohesin complex is loaded at enhancer-promoter loops and is involved in CTCF-mediated interactions, we first performed HiChIP for the cohesin subunit SMC1 in MCL Rec-1 cells with an activating Notch mutation and used chromosome-wide insulation potential (Crane et al., 2015) to systematically identify high-confidence contact domain boundaries (Table S1). To validate the sensitivity and specificity of our SMC1 HiChIP, we compared contact domains in Rec-1 with those delineated by in situ Hi-C in EBV-transformed GM12878 lymphoblastoid B cell line (Rao et al., 2014). GM12878 expresses an EBV-encoded RBPJ-binding factor, EBNA2, that mimics Notch activities (Henkel et al., 1994), and its genome organization is similar to Rec-1 (Ryan et al., 2017). The Rec-1 contact domain boundaries identified using SMC1 HiChIP (~760 million sequenced reads, Table S1) were highly concordant with those identified by GM12878 in situ Hi-C (Rao et al., 2014) (~3 billion sequenced reads), both at the level of a single chromosome (Figure S1A) and genome-wide (p-value < 1E-15, Figure S1B). This level of concordance was similar to that observed when the GM12878 HiChIP (Mumbach et al., 2016) and in situ Hi-C were compared (p-value < 1E-04, Figure S1C). Furthermore, A/B compartments identified by GM12878 in situ Hi-C and SMC1 HiChIP were indistinguishable (p-value < 1E-15, Figure S1D) and showed a level of concordance similar to that of A/B compartments identified by two independent GM12878 in situ Hi-C experiments (data not shown). These results show that our SMC1 HiChIP data are of high quality and provide an efficient method to accurately delineate chromatin contact domains and compartments with ~4-fold lower sequencing depth than in situ Hi-C.
In addition to MCL, activating Notch mutations are frequent in TNBC (Choy et al., 2017; Stoeck et al., 2014). We performed SMC1 HiChIP in Notch-mutated TNBC HCC1599 and MB157 lines (Stoeck et al., 2014), analyzing more than 1.5 billion read pairs (Table S1). A sizable fraction of contact domains is enclosed by a structural chromatin loop with CTCF-bound and cohesin-occupied anchors (Rao et al., 2014). Examination of CTCF and cohesin binding events showed that these proteins co-occupy 81.4% of MB157 contact domain boundaries (p-value < 1E-15, Figure S1E). As expected for a high-quality data set, more than 85% of the CTCF-bound contact domain boundaries in MB157 had inward-oriented CTCF motifs (785 inward-oriented versus 2 outward-oriented, Figure S1F).
TNBC HCC1599 and MB157 contact domains showed highly similar organization, as exemplified by the chromosome 8 organization (Figure 1A and Table S1). Genome-wide, out of 4,767 and 4,847 contact domain boundaries identified in HCC1599 and MB157, respectively, 4,223 domain boundaries were common (p-value < 1E-15, Figure S1G). Furthermore, most contact domain boundaries were also shared by MCL Rec-1 and TNBC cells, as exemplified by genomic region on chromosome 8 containing the MYC locus (Figure 1B, 5 Kb genomic resolution). Genome-wide, nearly 70% of the identified contact domain boundaries were shared in these two different Notch-mutated cancer cell lineages (p-value < 1E-15, Figure 1C), consistent with the extent of concordance previously noted when other cell lineages were compared (Dixon et al., 2012; Rao et al., 2014). Thus, chromatin contact domains are largely lineage-independent organizational features of Notch-mutated cancer cell genomes.
Figure 1: Contact domains of Notch-mutated cells are lineage and Notch insensitive.

(A) MB157 (lower half) and HCC1599 (upper half) share contact domain boundaries at whole chr8 (left) and MYC locus (right). (B) TNBC MB157 (lower half) and MCL Rec-1 (upper half) share contact domain boundaries at MYC locus. Bottom red square: maximum interaction frequency. (C) Rec-1, HCC1599 and MB157 share significant number of domain boundaries (Fisher p-value < 1E-15). (D) RBPJ, SMC1 and CTCF occupancy on boundaries of 920 MB157 contact domains. (E) Contact domain boundaries at GRHL2 locus are enriched for RBPJ, CTCF and SMC1 bindings. Gray box: RBPJ, CTCF and SMC1 bindings at the boundaries. (F) 3,216 reproducible Notch-responsive elements with a significant decrease in Notch-off (GSI) vs Notch-on (GSI-washout) in MB157. (G) MB157 boundary insulation score is Notch invariant (Wilcoxon p-value > 0.15). Aggregated Notch occupancy (top) and Z-score interaction (bottom) centered around 1,003 Notch-bound (left) and matching number of Notch-unbound (right) boundaries. (H) MB157 contact domain boundaries at MYC locus are Notch invariant. Gray arrows: boundaries demarcated by local minimum insulation score. Z-score contact map: 25 Kb resolution.
Contact domains are insensitive to Notch signals
To test the effect of Notch binding on genome organization, we first performed RBPJ ChIP sequencing (ChIP-seq) in MB157. 19% of RBPJ binding events localized to domain boundaries (Figure S1H) and, conversely, 43% of CTCF-bound, cohesin-occupied boundaries showed significant RBPJ binding (p-value < 1E-15, Figures 1D and 1E). To determine if Notch binding influenced the insulation potential of contact domain boundaries, we performed a gamma-secretase inhibitor (GSI)-washout assay, which enables rapid Notch activation and loading of Notch onto chromatin, an event that also increases the RBPJ occupancy at regulatory sites (Wang et al., 2014). By comparing the Notch active (GSI-washout, Notch-on) and inactive (GSI, Notch-off) states in MB157, we identified 3,216 Notch-responsive elements with a significant and reproducible increase in NICD1 and RBPJ occupancy (Figure 1F, Table S2). However, Notch- and RBPJ-bound contact domain boundaries were, on average, unaffected by Notch activity, as shown by pile-up plots of interactions centered on contact domain boundaries (Figure 1G). This observation was confirmed by inspection of genomic-distance-adjusted chromatin interaction maps and insulation profiles of the MYC locus before and after Notch inhibition (Figure 1H). Measurements of Notch binding events in HCC1599 TNBC cells also showed that while Notch bound to many HCC1599 contact domain boundaries (Figures S1I and S1J), alterations in Notch activity did not impact contact domain integrity (Figures S1K and S1L). Moreover, the comparison of A/B compartments between Notch-on and -off conditions revealed that Notch inhibition did not reposition compartments from A-to-B or from B-to-A in MB157 and HCC1599 (Figures S1M and S1N). Together, these data suggest that contact domains and compartments are predominantly unaffected by Notch binding.
Chromatin states of contact domains in Notch-mutated cells are lineage-dependent
Contact domains generally restrict propagation of chromatin states along chromosomes (Dowen et al., 2014). In line with this prediction, contact domains in MB157 and HCC1599 were either enriched for active (H3K27ac and/or H3K4me1 -marked) or repressed (H3K27me3-marked) chromatin (Figures 2A, 2B, and S2A–D), with active contact domains containing, on average, twice the number of expressed genes as repressed domains. Repressed contact domains with higher H3K27me3 level were on average 1.37 Mb and larger than active contact domains whose average size was 0.92 Mb (Figures 2B and S2C). Overall, the chromatin states of 79% of contact domains were identical in MB157 and HCC1599 (p-value < 1E-15, Figure S2E). Analysis of active and repressed contact domains in Notch-mutated MCL (Figures S2F–H) and comparison with TNBC cells showed that on average 37% of contact domain chromatin states were lineage-specific (p-value < 1E-06, Figure 2C). Together, our data indicate that while contact domains are largely invariant in Notch-mutated MCL and TNBC, the chromatin signature within contact domains shows significant lineage specificity.
Figure 2. Notch sensitivity of interactions within TNBC active enhancer-marked contact domains.

(A) 1,621 MB157 contact domains with significant intradomain interactions are categorized into active or repressed by the differential H3K27ac and H3K27me3 total levels and sorted in descending order. (B) H3K27ac and H3K27me3 are insulated within contact domain boundaries demarcated by CTCF and SMC1 at CCNE1 locus in MB157. Red/blue dashed-line boxes: active/repressed domains. Gray boxes: CTCF and SMC1 bindings at the boundaries. (C) Comparison of TNBC (HCC1599 and MB157) and MCL (Rec-1) contact domains’ chromatin states. (D) MB157 contact domains exhibit significant Notch-sensitive intradomain interaction frequency (paired t-test p-value < 1E-15). Contact domains are ranked by total intradomain interaction changes. (E) The number of active/repressed MB157 contact domains per quartile of total differential intradomain interaction (Proportion test). (F, G) As (D) and (E) in HCC1599, respectively (paired t-test p-value < 1E-15).
Interactions within active enhancer-marked contact domains are Notch sensitive in TNBC
Intradomain interactions linking regulatory DNA elements, such as enhancers and promoters, are implicated in gene control (Kagey et al., 2010). To determine whether Notch signaling activity impacts intradomain interactions in TNBC, we first used 286 million unique read pairs of MB157 SMC1 HiChIP (Table S1) to identify high-resolution (~5 Kb) significant interactions. We relied on a statistical model that controls for both protein occupancy level and linear genomic distance between the connected DNA loop anchors (Phanstiel et al., 2015). This approach identified 265,216 significant cohesin-associated DNA interactions in MB157 supported by at least 4 read pairs. Unless stated otherwise, the high-confidence set of interacting loci (also referred to as significant interactions) was used for further quantitative analysis. We quantified significant interactions within contact domains in MB157 (see STAR Methods), and observed that after Notch inhibition 236 contact domains showed at least a 4-fold decrease in overall intradomain interactions (Figure 2D). These Notch-sensitive contact domains were significantly associated with active chromatin state (p-value < 1E-09, Figure 2E). To independently confirm this observation, we studied HCC1599, in which 472,073 significant cohesin-associated DNA interactions were identified. Similarly, Notch-sensitivity of intradomain interactions was observed preferentially within contact domains with high loads of active enhancer histone mark (p-value < 1E-15, Figures 2F and 2G). Together, these results show that in contrast to invariant contact domain boundaries, long-range intradomain chromatin loops with potential regulatory functions are Notch-sensitive in TNBC.
Notch activates TNBC distal enhancers
We next quantitated the direct effect of Notch on active enhancers in MB157 and HCC1599. On average, Notch binding events were 19 Kb away from the closest transcription start site (Figure S3A). H3K27ac histone mark was deposited at nearly 85% of the Notch-bound chromatin (p-value < 1E-15). Notch inhibition markedly decreased the H3K27ac levels of Notch-responsive elements in TNBC (Figure S3B). Importantly, this effect of Notch inhibition was not abrogated by ectopic expression of MYC (Figures S3C–E), a global amplifier of active gene expression and a known Notch target in T-ALL and MCL (Lin et al., 2012; Ryan et al., 2017; Wang et al., 2014). Moreover, the level of H3K4me1 histone mark (Figure S3B) and chromatin accessibility (Figure S3F) of Notch-responsive elements were largely insensitive to changes in Notch activity in TNBC lines. Together, these data suggest that Notch preferentially binds and activates primed TNBC distal enhancers independent of MYC.
Notch-instructed and preformed enhancer-promoter contacts regulate direct Notch target genes in TNBC
Regulatory DNA loops between promoters and distal enhancers are crucial for proper gene control (Hnisz et al., 2016a). We thus asked whether distal Notch-responsive elements (Figures S3A and S3B) that are likely to directly regulate TNBC transcriptional outputs also participate in Notch-sensitive intradomain interactions (Figures 2E and 2G). To this end, we first identified TNBC Notch-sensitive genes (i.e. Notch-upregulated genes) using RNA-seq in MB157 and HCC1599. Notch activation concordantly increased the expression of 2,038 genes in these two lines (Table S3). Differential gene expression analyses in T-ALL DND41 and MCL Rec-1 were performed to assess lineage-specificity of Notch-sensitive genes. 504 genes, including the well-characterized Notch targets MYC, HES1, and CR2 (Ryan et al., 2017; Stoeck et al., 2014), were positively regulated by Notch in all three Notch-mutated cancer types (Figure S3G, Table S3). Lineage-independent Notch-sensitive genes were enriched for known MYC targets and MYC-regulated biological processes (Figure S3H), suggesting that these genes predominantly belong to a MYC-driven expression program and are a secondary effect of Notch activation in these three Notch-mutated cancers. Overall, 204 Notch sensitive genes were specific to TNBC (Figure S3G, Table S3), including CCND1, KIT and SAT1, all of which have been implicated in TNBC (Choy et al., 2017; Kashiwagi et al., 2013). Furthermore, gene set enrichment analysis showed the TNBC-specific Notch target genes were enriched for genes associated with breast cancer and mammary epithelium biology (Figures S3G and S3I, Table S4). These data indicate the existence of a TNBC-specific Notch-driven transcription program, in line with the lineage-specificity of the TNBC contact domain chromatin state (Figure 2C).
We next assessed how Notch-dependent gene expression relates to TNBC 3D genome organization. Aligning the Notch-sensitive genes to the TNBC 3D genome landscape showed that these genes were preferentially associated with active contact domains with Notch-sensitive intradomain interactions (p-value < 1E-04, Figure 3A). Integrative analysis of Notch-binding events (Table S2), Notch-dependent enhancers (Table S5) and transcripts (Table S3), and high-confidence chromatin loops distinguished direct from indirect Notch targets and identified 215 and 386 direct Notch-upregulated genes (i.e. Notch-activated genes) in MB157 and HCC1599, respectively. In both TNBC lines, inhibition of Notch signaling markedly decreased H3K27ac levels at Notch-bound enhancers linked to Notch-activated genes (p-value < 1E-15, Figure 3B). We also observed a significant reduction in the frequency of long-range interactions between the Notch-bound DNA elements and their target promoters upon Notch inhibition (p-value < 1E-03, Figure 3C).
Figure 3. Activation of direct Notch target genes by Notch-instructed and preformed enhancer-promoter interactions in TNBC.

(A) The proportion of contact domains with Notch-sensitive gene depending on Notch-sensitivity of intradomain interaction in MB157 (left) and HCC1599 (right) (Fisher’s exact). (B) Differential H3K27ac at Notch-bound or -unbound distal enhancers of Notch-sensitive genes in MB157 (left) and HCC1599 (right) (Wilcoxon test). (C) Differential interaction frequency at Notch-bound or -unbound distal enhancers and Notch-sensitive gene promoters in MB157 (left) and HCC1599 (right) (Wilcoxon test). (D) Four possible Notch regulatory modes controlling Notch direct target genes by different combinations of Notch-bound and -instructed loops (ΔL), Notch-bound and -activated enhancers (ΔE), Notch-bound but Notch-insensitive loops (∅L), and Notch-bound but Notch-insensitive enhancers (∅E). (E, F) Differential expression of Notch-activated genes in MB157 (E) and HCC1599 (F) per mode in (D). (G) Notch inhibition significantly decreases the interaction frequency between MYC promoter and a 5’ enhancer in MB157. Top: H3K27ac and H3K27me3 at MYC locus labeled with matching pseudocolors for probes against MYC promoter (cyan), 5’ enhancer (yellow), and inactive 3’ element (magenta) for a 3-color DNA-FISH. Bottom: HiChIP-measured interaction frequency between MYC and 5’ enhancer probes (left) or 3’ probes (right) in Notch-on (DMSO) and Notch-off (GSI) conditions. (H) Distances between MYC promoter and enhancer significantly increased after Notch inhibition in MB157. Left: examples of cells and magnified images for 3-color, cyan-yellow, and cyan-magenta, from left to right, in Notch-on (DMSO) and Notch-off (GSI). Center: Distances between MYC promoter and the closest MYC enhancer probe in Notch-on (red, N=4,314) and Notch-off (blue, N=5,271). Mean +/− SD distance: 0.71 +/− 0.30 μm in Notch-on, 0.83 +/− 0.32 μm in Notch-off. Right: Distances between MYC promoter and the closest 3’ probe in Notch-on and Notch-off. Mean +/− SD distance: 1.0 +/− 0.32 μm in Notch-on, and 0.88 +/− 0.31 μm in Notch-off (Kolmogorov-Smirnov test). Blue: Hoechst. (I) Notch-instructed loops (ΔL) link Notch-insensitive enhancers (∅E) E1 and E2 to SOX9 and E3 to LINC00511 in MB157. Top: virtual 4C plots (v4C) from LINC00511 promoter viewpoint. Gray boxes: Notch-sensitive NICD1 and RBPJ, and Notch-insensitive H3K27ac. (J) Notch-instructed loops (ΔL) of shared Notch-activated enhancers (ΔE) enable spatial co-regulation of TMPRSS2 and RIPK4 in MB157. Top: v4C plots from the Notch-activated enhancers viewpoint. Gray box: Notch-sensitive NICD1, RBPJ, and H3K27ac. HiChIP arcs: normalized significant enhancer-promoter interactions in Notch-on (top, DMSO) and Notch-off (bottom, GSI) (Paired t-test).
We defined Notch-instructed loops as Notch-sensitive interactions connected to distal Notch-bound elements. To further dissect the mechanisms of direct gene activation by Notch, we considered four possible regulatory modes: (a) Notch-instructed loops (ΔL) linking Notch-activated enhancers (ΔE) to promoters; (b) Notch-instructed loops (ΔL) linking Notch-insensitive enhancers (∅E) to promoters; (c) Notch-insensitive (preformed) loops (∅L) linking Notch-activated enhancers (ΔE) to promoters; and (d) Notch-insensitive (preformed) loops (∅L) linking Notch-insens6itive active enhancers (∅E) to promoters (Figure 3D). Integrating the Notch-dependent regulatory loops, enhancers, and Notch-binding events in MB157 showed that the greatest increase in transcription between the Notch-off and -on states occurred in genes in which Notch both activated and repositioned the enhancers (mode a, p-value < 2E-03, Figure 3E). Similar observations were made in HCC1599 (mode a, p-value < 3E-02, Figure 3F). Although “mode a” was associated with a more pronounced effect on expression of direct Notch target genes, our analysis also identified a group of Notch-activated genes in which only loops (mode b) or enhancers (mode c) were Notch-dependent (Figure 3D). Finally, transcriptional outputs of another group of genes linked to Notch-insensitive enhancers through preformed loops were shown to only depend on distal Notch binding, suggesting that Notch functions as the final transcriptional trigger at these loci (mode d, Figures 3D–F and S3J).
We next closely scrutinized Notch-repositioned enhancer-promoters (Figure 3D modes a and b), a previously unrecognized mode of Notch-dependent gene regulation. The proto-oncogene MYC, a known direct Notch target in B- and T-lymphoid malignancies (Ryan et al., 2017; Yashiro-Ohtani et al., 2014), exemplifies genes with Notch-repositioned enhancer-promoter in TNBC (Figure 3G, also see Figure 5). To evaluate the Notch-dependency of enhancer-promoter contacts involving this critical proto-oncogene at single-cell resolution, we performed 3D DNA-fluorescence in situ hybridization (FISH) to study the spatial localization of three elements in MB157: 1) the MYC promoter; 2) a MYC enhancer located 451 Kb 5’ of the promoter that interacted with the promoter through a Notch-sensitive long-range interaction; and 3) a T-ALL-specific Notch-dependent MYC enhancer located 3’ of the promoter which was inactive in TNBC (Figure 3G). In concordance with the decrease in MYC promoter-enhancer interaction frequency detected by HiChIP (Figure 3G), DNA-FISH analysis showed that the MYC promoter and the MYC 5’ enhancer probes became significantly separated upon Notch inhibition (Figure 3H). Interestingly, we observed that the MYC promoter and the 3’ MYC probes became markedly closer after Notch inhibition (Figure 3H), a change that was also observed globally in TNBC genomes (Figures 2E and 2G). Critically, in both cases the DNA-FISH data agreed with changes seen in the HiChIP-measured contact frequencies (Figures 3G and 3H). Together, these data support the observation of Notch-instructed long-range interactions in TNBC as measured by SMC1 HiChIP.
Figure 5. MYC but not CCND1 Notch-activated distal enhancers cooperate to promote gene expression.

(A) Notch-instructed loops (ΔL) link Notch-activated enhancers (ΔE) to MYC in MB157. Gray boxes: Notch-sensitive NICD1, RBPJ, and H3K27ac. (B) MYC transcripts in Cas9-expressing MB157 transduced with control sgRNAs, sgRNAs targeting E1, E5 or both reveal cooperativity of Notch-sensitive E1 and E5 MYC enhancers. Mean ± SEM of n=3−7 independent experiments. (C) MYC protein in Cas9-expressing MB157 transduced with control sgRNAs or sgRNAs targeting MYC E1 and E5 enhancers. (D) Representative distribution (left) and average geometric mean fluorescent intensity (MFI) ± SD (right) of CellTrace Violet (CTV) dilution as in (C); n=3 biological replicates, representative of 3 independent experiments. (E) Mean ± SEM of relative cell growth rates of n=8−10 biological replicates from 2 independent experiments as in (C). (F) Notch-instructed loops (ΔL) link Notch-activated enhancers (ΔE) to CCND1 in MB157. Gray boxes: Notch-sensitive NICD1, RBPJ, and H3K27ac. (G) CCND1 transcripts in Cas9-expressing MB157 transduced with control sgRNAs, sgRNAs targeting E1, E2 or both reveal independence of Notch-sensitive E1 and E2 CCND1 enhancers. Mean ± SEM of n=3−5 independent experiments. (H) Cyclin D1 protein in Cas9-expressing MB157 transduced with control sgRNAs or sgRNAs simultaneously targeting CCND1 E1 and E2 enhancers. (I) Representative distribution (left) and average MFI ± SD (right) of CTV dilution as in (H); n=3 biological replicates, representative of 3 independent experiments. (J) Representative distribution (left) and average MFI ± SD (right) of EdU incorporation as in (H), n=3 biological replicates, representative of 2 independent experiments. t-test p-value: *p < 0.05, **p < 0.01, ***p < 1E-03. HiChIP arcs: normalized significant interactions among promoter and distal enhancers in Notch-on (top, DMSO) and Notch-off (bottom, GSI) (Paired t-test). v4C plots: from promoter viewpoint. TFRC: negative control.
We next examined genes which were activated by Notch-instructed interactions to Notch-insensitive enhancers (Figure 3D mode b), to further analyze this previously unappreciated mode of Notch-dependent gene regulation. Virtual 4C (v4C) analysis of the TNBC-specific long noncoding RNA (lncRNA) LINC00511 (Xu et al., 2017) showed gain of contacts between the promoter and Notch-insensitive 3’ enhancers E3 (Figure 3I). Normalized contact tracks showed that in addition to LINC00511, Notch binding significantly increased the frequency of contacts between anchors linking Notch-bound Notch-insensitive enhancers and the Notch-sensitive gene SOX9 (mode b, p-value < 1E-03, Figure 3I). The same mode of Notch regulation of LINC00511 and SOX9 also operated in HCC1599 (mode b, p-value = 2E-03, Figure S3K). Together, these data are consistent with the ability of Notch to facilitate repositioning of certain enhancers to activate direct Notch target genes, independent of changes in enhancer H3K27ac level.
In some instances, a common enhancer spatially co-regulates multiple genes through looping interactions with their promoters (Fanucchi et al., 2013). In MB157 and HCC1599, Notch activation promotes looping involved in spatial co-regulation of the kinase RIPK4 and the serine protease TMPRSS2 (Figures 3J and S3L), both of which are implicated in breast cancer pathogenesis (Huang et al., 2013; Luostari et al., 2014). Based on normalized contact tracks (Figures 3J and S3L), Notch activation significantly increased transcript abundance and contact frequency of RIPK4 and TMPRSS2 promoters to common Notch-bound and -activated enhancers, located 155 and 150 Kb away, respectively. Taken together, these results suggest that in addition to activating enhancers already in contact with promoters, Notch signaling can promote and strengthen interactions between subset of promoters and enhancers in TNBC.
Notch preferentially targets hyperconnected 3D regulatory cliques in TNBC
In addition to long-range enhancer-promoter loops, enhancer-enhancer and promoter-promoter interactions are implicated in gene control (Mumbach et al., 2017). To examine the higher-order structure of regulatory interactions in Notch-mutated TNBC, we integrated our connectivity maps and epigenomic data to annotate the regulatory loop anchors connecting enhancer or promoter elements (Table S6). Multiplicity of enhancer and promoter interactions were common in TNBC genomes, with each element on average connecting to 6 other regulatory elements (Figure S4A), as reported in other cell types (Furlong and Levine, 2018). Enhancer-promoter interactions accounted for only 30% of the interactions between regulatory elements in TNBC genomes (Figure 4A), also consistent with frequencies reported in other studies (Weintraub et al., 2017). Notably, only 30% of Notch-sensitive loops connected an enhancer to a promoter, while the majority linked pairs of enhancers (64%) (Figure 4A). In addition, 18% of interactions were between promoter pairs, in line with other reports suggesting the existence of regulatory promoter-promoter interactions (Li et al., 2012).
Figure 4. Notch targets hyperconnected 3D regulatory cliques in TNBC.

(A) The number of Notch-sensitive and -insensitive enhancer-enhancer (EE), enhancer-promoter (EP), promoter-promoter (PP) interactions in MB157 (left) and HCC1599 (right). (B) 3D clique total connectivity reveals two classes of interacting enhancers and promoters. MB157 (left) and HCC1599 (right) cliques are plotted in an ascending order of their total connectivity. Hyperconnected 3D cliques are defined as the ones above the elbow of the total connectivity ranking. Example hyperconnected 3D cliques are marked and named with their representative Notch-sensitive genes. (C) Asymmetric clique total connectivity in five randomly selected cliques from either below (left) or above (right) the elbow point of the MB157 curve in (B). (D) Circos plot of MB157 MYC clique. E1 to E5 mark super-enhancers within the MYC 5’ contact domain in descending linear genomic distance to MYC promoter. (E) Clique total connectivity with or without Notch-bound enhancers in MB157 (left) and HCC1599 (right) (Wilcoxon test). (F) The average ± SEM corrected percentage of Notch-sensitive loops per quartile of clique total connectivity distribution in MB157 (left) and HCC1599 (right) (Wilcoxon test). (G) The total connectivity of cliques containing Notch-activated genes in MB157 (left) and HCC1599 (right) per mode in Figure 3D. (H) Difference in total connectivity in three randomly selected cliques in MB157 associated with either Notch-insensitive enhancers and loops (∅E+∅L, left) or Notch-activated enhancers and Notch-instructed loops (ΔE+ΔL, right). (I) The average ± SEM corrected percentage of direct Notch-activated genes per quartile of clique total connectivity distribution in MB157 (left) and HCC1599 (right) (Wilcoxon test). (J) Difference in Notch-activated genes in three randomly selected cliques in either the first (left) or fourth (right) quartile of clique total connectivity distribution.
To globally model the higher-order structure of interactions involving Notch-sensitive regulatory loops, we used undirected graph mathematical abstraction, and algorithmically searched for groups of densely connected enhancers and promoters with high intra-group and sparse inter-group interactions (see STAR Methods). We called these groups of densely interconnected elements “3D cliques”. We observed a significant asymmetry in the 3D clique connectivity distributions (Figures 4B and 4C, Table S7), which were distinct from the accumulation of H3K27ac into super-enhancers on linear genomes (Figure S4B). Although 90% of 3D cliques contained less than 20 interactions, nearly 140 cliques were categorized as hyperconnected 3D cliques and had more than 100 interactions in either MB157 or HCC1599 (Figure 4B). The clique containing MYC was identified as a hyperconnected 3D clique, ranking among the top 11 most connected 3D cliques in both HCC1599 and MB157 (Figure 4B). Inspection of the MYC cliques in MB157 and HCC1599 showed that Notch significantly promoted up to 46% of their constituent enhancers and more than 30% of interactions among their promoters and enhancers (Figures 4D and S4C).
This observation led us to ask whether Notch preferentially targets highly connected cliques in TNBC. The Notch-bound cliques exhibited significantly more connectivity than cliques lacking Notch binding (p-value < 1E-15, Figures 4E and S4D). More connected cliques also contained significantly more Notch-sensitive loops (p-value < 1E-15, Figure 4F). Furthermore, promoters connecting to Notch-activated enhancers through Notch-instructed loops interacted with more enhancers on average (p-value < 1E-15, Figure S4E) and located within cliques with higher connectivity (p-value < 1E-02, Figures 4G and 4H). More importantly, the top 25% of the most connected cliques were enriched for direct Notch target genes relative to other cliques after correcting for clique connectivity (p-value < 1E-03, Figures 4I and 4J). Direct Notch-activated genes within hyperconnected 3D cliques, such as MYC (Figure 4D and S4C), were associated with processes and pathways important for TNBC pathobiology (Figure S4F, Table S4). Overall, these results suggest that oncogenic Notch activates not only large stretches of enhancers as reported (Wang et al., 2014), but also promotes regulatory DNA loops linking multiple distal enhancers to their target genes.
Perturbation of Notch-bound interacting enhancers reveals cooperativity in the MYC clique
Multiple enhancers are found in the several megabase region flanking MYC, but the entire list of transcription factors regulating MYC via these enhancers remains unknown (Schuijers et al., 2018). The MYC enhancers identified in Notch-mutated TNBC were also active in other TNBC lines but were inactive in non-TNBC cells (Figure S5A). The observations that several distinct Notch-bound enhancers located 5’ of the MYC promoter (Figures 4D and 5A) and organized into a hyperconnected 3D clique with frequent inter-enhancer interactions (Figures 4B, 4D, and S4C, Table S7) led us to ask whether MYC enhancers cooperatively regulate MYC expression in TNBC. Our data showed that among all the MYC enhancer pairs, the strongest RBPJ/NICD1 ChIP-seq signals and the largest Notch-dependent H3K27ac changes were observed in E1 and E5 enhancers (Figure 5A), located 451 and 65 Kb 5’ of the MYC promoter. Based on the HiChIP signal, Notch inhibition reduced the interaction frequency between the highly interacting E1 and E5 enhancer pair by ~4-fold (Figure S7E), which was comparable to the average reduction in the contact frequencies between the MYC promoter and its distal enhancers (Figure 5A).
To test the functional role of the E1 and E5 enhancers in MYC regulation, we used CRISPR/Cas9 genome editing (Figure S5C) to mutate the consensus RBPJ binding motifs in E1 and E5 (Figures 4D, 5A and S5C). Mutation of RBPJ binding sites at E1 or E5 resulted in a 15% or 25% decrease in MYC expression, respectively; while simultaneous targeting yielded more than a 50% reduction in MYC transcript abundance (Figure 5B) and greatly reduced MYC protein (Figure 5C). Dual targeting of these enhancers also suppressed cell proliferation (p-value < 1E-03, Figure 5D) and cell counts (p-value < 1E-03, Figure 5E). Overall, these data suggest that Notch increases MYC expression by promoting cooperative higher order interactions involving the E1 and E5 enhancers and the MYC promoter.
Notch-bound non-interacting enhancers independently regulate CCND1 transcription
Our data showed that Notch directly upregulates CCND1 transcripts in TNBC, as reported (Ronchini and Capobianco, 2001), but not in Notch-mutated MCL and T-ALL (Figure S3G). In MB157, the CCND1 promoter and associated enhancers were organized into a 3D clique of moderate connectivity (46 interactions), which was substantially smaller than the MYC clique (682 interactions) (Figure S5D, Table S7). Analysis of the CCND1 locus in MB157 demonstrated a 1.4-fold or greater reduction in contact frequency between the CCND1 promoter and Notch-responsive enhancers after Notch inhibition (p-value < 1E-09, Figures 5F and S5D). However, the enhancer-enhancer interaction frequency between the two strongest Notch-bound CCND1 enhancers, E1 and E2, was 12-fold lower than the interactions between the MYC E1 and E5 enhancers (Figures 5A and 5F). To test for cooperativity between the CCND1 E1 and E2 enhancers, we used CRISPR/Cas9 targeting (Figures 5F, S5E, and S5F). Single targeting of RBPJ motifs in the E1 and E2 enhancers led to 55% and 35% decreases in CCND1 expression, respectively (Figure 5G). However, simultaneous targeting of E1 and E2 did not show significant cooperative effects on CCND1 transcript abundance (Figure 5G). Nevertheless, we did observe significant effects of E1 and E2 dual targeting on Cyclin D1 protein (Figure 5H), cell proliferation (p-value < 1E-03, Figure 5I) and cell cycle progression (p-value < 1E-02, Figure 5J). Thus, like MYC, CCND1 is another proto-oncogene that is dysregulated in TNBC by Notch through Notch-sensitive looping interactions involving lineage-specific distal enhancers. Furthermore, our data hint that enhancer-enhancer interactions may influence the cooperativity between distal enhancers in transcriptional regulation.
TNBC Notch regulatory modes are generalizable to Notch-mutated MCL
The observation that Notch preferentially promoted or strengthened regulatory loops in highly connected 3D cliques of Notch-mutated TNBC led us to investigate whether the same relationships hold in Notch-mutated MCL. Using SMC1 HiChIP, we first measured long-range interactions between two previously characterized Notch-activated enhancers located 525 Kb and 433 Kb 5’ of the MYC promoter in MCL Rec-1 cells (Ryan et al., 2017). Analysis of Rec-1 SMC1 HiChIP showed that these two Notch-activated MYC enhancers (Figure S6A) interacted frequently (116.2 normalized reads) and Notch inhibition significantly reduced this interaction (p-value < 1E-15, Figure 6A). In line with these chromatin looping data and our analysis of Notch-activated MYC enhancers in TNBC, we conjectured that the two MCL-restricted Notch-activated enhancers cooperatively control MYC expression. This hypothesis was confirmed in our published work where use of CRISPR-Cas9-KRAB repressors showed that these two enhancers cooperate to regulate MYC in Rec-1 (Ryan et al., 2017).
Figure 6. Activation of direct Notch target genes in MCL by Notch-instructed and preformed enhancer-promoter interactions.

(A) Notch-instructed loops (ΔL) link Notch-activated enhancers (ΔE) to MYC in Rec-1. Top: v4C plots from MYC promoter viewpoint. Gray boxes: Notch-sensitive NICD1, RBPJ, and H3K27ac. HiChIP arcs: normalized significant interactions among promoter and enhancers in Notch-on (top, DMSO) and Notch-off (bottom, GSI) (Paired t-test). (B) Rec-1 contact domains exhibit significant Notch-sensitive overall intradomain interaction frequency (paired t-test p-value < 1E-15). Contact domains are ranked by total intradomain interaction changes. (C) The number of active/repressed Rec-1 contact domains per quartile of total differential intradomain interaction (Proportion test). (D) Differential expression of direct Notch-activated genes in Rec-1 per mode in Figure 3D. (E) Circos plot of Rec-1 MYC clique. (F) The average ± SEM corrected percentage of direct Notch-activated genes per quartile of clique total connectivity distribution in Rec-1 (Wilcoxon test).
To extend this analysis genome-wide, we first assessed the Notch sensitivity of intradomain interactions and their relationship to active and repressed chromatin in Rec-1. As in Notch-mutated TNBC (Figures 2D–G), Notch inhibition decreased the intradomain interaction frequencies of more than 130 contact domains by more than 4-fold (Figure 6B), and this reduction preferentially occurred in active chromatin domains (p-value < 1E-15, Figures 6B and 6C). In Rec-1, the integration of chromatin conformation, epigenomic, and transcriptomic data sets again showed that direct Notch target genes with the greatest increase in transcription were those with both Notch-activated and Notch-repositioned enhancers (p-value < 0.03, Figure 6D and Figure 3D mode a). In addition to MYC, LYN, a direct Notch target gene that is essential for B-cell receptor activity (Gauld and Cambier, 2004), also showed Notch-repositioned enhancers (p-value < 1E-15, Figure S6B and Figure 3D mode a). SH2B2, a gene coding for an adaptor protein with an important role in B-cell development and activation (Naudin et al., 2016), was regulated by Notch-instructed interactions between Notch-insensitive enhancers and the SH2B2 promoter (p-value < 1E-15, Figure S6C and Figure 3D mode b). Inspection of Rec-1 HiChIP data also identified Notch-instructed loops that permit spatial co-regulation of two genes from a shared Notch-activated enhancer (Figure S6D). Together, these data confirm that distinct Notch regulatory modes identified in TNBC also apply to Notch-mutated MCL.
Analysis of SMC1 HiChIP data revealed that the Rec-1 genome is also organized into 3D cliques consisting of densely interconnected enhancers and promoters. A significant asymmetry was also observed in the Rec-1 clique connectivity distribution, which was distinct from the super-enhancers in the Rec-1 linear genome (Figures S6E and S6F). Cliques with higher connectivity were enriched for direct Notch target genes, including MYC and genes involved in the B-cell signaling response and regulation (e.g. IL10RA, PAX5) (Figures 6E, S6E, and S6G). Further assessment of Rec-1 cliques showed significant enrichment for direct Notch target genes in highly connected 3D cliques with Notch-sensitive enhancers and looping interactions (p-value < 1E-06, Figures 6E and 6F). These direct Notch-activated genes were associated with processes and pathways with known roles in B cell biology and lymphomagenesis (Figure S6H, Table S4). Overall, these results suggest that Notch signaling controls not only MCL transcriptional enhancers, as reported (Ryan et al., 2017), but also facilitates enhancer-promoter repositioning in MCL cliques to regulate critical B cell pathways.
ncRNA activation associates with Notch-instructed loop anchors
To further elucidate how Notch binding events instruct enhancer repositioning, we assessed the impact of Notch signaling on accessibility and cohesin content of the TNBC Notch-responsive elements. Comparison of SMC1 ChIP-seq signals at Notch-responsive elements showed no significant difference in cohesin loading in the Notch-on and -off conditions (Figure S6I). While Notch inhibition had only a marginal impact on accessibility of Notch-responsive elements (Figure S3F), this effect was even more limited for Notch target genes linked by Notch-instructed loops to Notch-insensitive enhancers (Figure S6J and Figure 3D mode b), providing further evidence that the Notch-instructed enhancer repositioning facilitates the expression of this class of genes.
We next leveraged differential motif analysis to identify potential transcription factors present at loop anchors of Notch-repositioned enhancers in TNBC and MCL. Compared to other enhancers, the 500 base pair flanking sequences of the Notch binding sites at the Notch-repositioned enhancers were strongly enriched for the zinc-finger transcription factors SP1 and ZNF263 binding motifs (Figure S6K). Specifically, multiple SP1 and ZNF263 recognition sites were found in 90% of the sequences flanking Notch binding sites at the Notch-repositioned enhancers, compared to only 15% of Notch-unbound enhancers.
Given the proposed regulatory role of non-coding RNA transcripts (ncRNA) in enhancer-promoter interactions (Isoda et al., 2017), we next tested whether Notch-dependent activation of ncRNA increases the frequency of ncRNA-interacting loops. In both TNBC and MCL Notch-instructed loops, Notch inhibition markedly reduced the frequency of ncRNA-interacting loops compared to long-range interactions not spatially associated with ncRNAs (Figure S6L). Furthermore, the ratio of hyperconnected 3D cliques with at least one Notch-sensitive ncRNA was ~22-fold and ~10-fold higher than non-hyperconnected 3D cliques in TNBC HCC1599 and MB157, respectively (p-value < 1E-15). Similarly in MCL Rec-1, we observed 21-fold more hyperconnected 3D cliques with at least one Notch-sensitive ncRNA compared to non-hyperconnected 3D cliques. Overall, on average more than 70% of Notch-sensitive ncRNA were located in hyperconnected 3D cliques in MCL and TNBC. Taken together, these results suggest that other transcription factors such as SP1 and ZNF263 and Notch-sensitive ncRNAs participate in mechanisms that underline element-specific Notch-instructed enhancer repositioning.
Notch reactivation restores regulatory looping interactions
Our data revealed that Notch inhibition “decommissions” regulatory loops, leading to down-regulation of Notch target genes. If Notch-mediated regulatory loops are dynamically regulated by Notch, these loops should be restored following Notch reactivation by GSI-washout (Figure 7A). Analysis of SMC1 HiChIP following GSI-washout (Figure S7A), as expected, showed no change in contact domain boundaries (Figures S7B and S7C). However, long-range regulatory interactions, including enhancer-enhancer, enhancer-promoter and promoter-promoter interactions, were restored after Notch reactivation (p-value < 1E-15, Figure 7B). By contrast, ectopic expression of MYC, a protein which was implicated in chromatin decompaction (Kieffer-Kwon et al., 2017) and was identified as a direct Notch target gene (Figure 5), failed to protect Notch-instructed regulatory interactions from Notch inhibition in MB157 (Figures S7D). Specifically, Notch reactivation by GSI-washout recovered more than 75% of these interactions (p-value < 1E-15, Figure 7C), including looping interactions involving MYC and CCND1 (Figures 7D, S7E and S7F). Furthermore, Notch reactivation recovered 74% of the Notch-dependent chromatin loops in the MYC clique (Figure 7E). Together, these results support a model in which loading of Notch transcription complexes onto regulatory elements has widespread effects on looping interactions involving the genomes of Notch-mutated cells.
Figure 7. Notch reactivation restores regulatory interactions.

(A) Scheme showing transcriptional activity changes as a result of loop and enhancer deactivation and restoration upon Notch inhibition (GSI) and Notch recovery (GSI-washout), respectively. (B) Comparison of the frequency of Notch-instructed interactions among MB157 enhancers and promoters in Notch-on (DMSO), Notch-off (GSI) and Notch-recovery (GSI-washout) (Paired t-test). (C) Significant differential Notch-instructed enhancer-promoter interaction frequency in Notch-on vs Notch-off and Notch-recovery vs Notch-off (paired t-test p-value < 1E-15). (D, E) Notch recovery in MB157 rescues interactions at MYC locus (D) and clique (E). Top: v4C plots from promoter viewpoint. Gray boxes: MYC enhancers as in Figure 5. HiChIP arcs: normalized significant interactions (Paired t-test). Red lines: significantly decreased interactions in Notch inhibition and restored in Notch-recovery (log2 fold change > 0.5, enrichR FDR < 0.05).
DISCUSSION
Chromatin architecture dynamics in response to oncogenic transcription factors is not well understood. Here, we used the response to oncogenic subversion of Notch in TNBC and MCL, to examine the impact of aberrant transcription factor activity on long-range regulatory loops and the consequence of such changes on transcriptional outputs. Our chromatin conformation maps of Notch-mutated cells reveal that oncogenic Notch signaling differentially affects the 3D genome organization hierarchy. While chromatin contact domains are Notch-insensitive and largely conserved across these cancer types, we find that Notch-binding is selectively required for enhancer activation and repositioning, and is insufficient to determine regulatory loops and chromatin state dynamics. We thus propose that Notch relies on four distinct regulatory modes defined by different combinations of enhancer activation and/or repositioning to control its direct target genes, an observation that has implications for targeting “undruggable” proto-oncogenes that might be controlled by Notch-mediated long-range regulatory loops in Notch-addicted tumors.
Sequences in different contact domains interact, albeit at a much lower frequency, and may be important for proper gene control (Furlong and Levine, 2018). Our high-resolution regulatory connectivity maps identified complexities of localized and long-range enhancer and promoter sharing. By systematically delineating clusters of enhancers and promoters that converge through space in the regulatory interaction graph (i.e. 3D regulome) of Notch-mutated TNBC and MCL, we show that regulatory loops of Notch-mutated cells coalesce enhancers and promoters to form spatially interacting communities of regulatory elements, termed 3D cliques, that are organized independent of contact domains and are distinct from super-enhancers. We also find that oncogenic Notch preferentially promotes enhancers and DNA loops in hyperconnected 3D cliques. These findings suggest that the entire regulatory interaction map should be taken into consideration for enhancer editing, as cooperativity between enhancers to control gene expression may not solely depend on individual promoter interaction, but could depend on other factors such as connectivity among enhancers.
Our data also suggest that by targeting hyperconnected 3D cliques of key oncogenes such as MYC, Notch potentially uses a multiplicity of distal enhancers and enhancer-enhancer interactions to maximize Notch-driven pathogenic transcriptional outputs. These observations suggest that while the genomic loci with a high frequency of chromatin interactions are highly enriched for super-enhancers (Beagrie et al., 2017), several super-enhancers might spatially interact to control key oncogenes. Aggregation of enhancers distally located on a linear genome into Notch-sensitive 3D cliques raises the possibility that the formation of larger aggregates of regulatory elements in space might serve to raise the concentration of oncogenic Notch binding events to mobilize transcription apparatus and promote their aberrant aggregation and phase-separated nucleation (Boija et al., 2018). Hence, the observation of exceptionally large interacting Notch-sensitive 3D cliques of regulatory elements advocates in favor of testing the applicability of the nuclear condensate model for the Notch-mediated activation of key proto-oncogenes in the future. Together, our results implicate reorganization of regulatory loops as an instructive factor for implementing oncogenic transcription factor-driven gene expression.
STAR METHOD
CONTACT FOR REAGENT AND RESOURCE SHARING
Further information and request for reagents may be directed to and will be fulfilled by the lead contact, Robert B. Faryabi (faryabi@pennmedicine.upenn.edu).
EXPERIMENTAL MODEL AND SUBJECT DETAILS
The cell lines MB157, HCC1599 and HEK293T were obtained from the American Tissue Culture Collection (ATCC). DND41 cells were purchased form the Leibniz-Institute DSMZ-German Collection of Microorganisms and Cell Lines (DSMZ). Rec-1 cells were provided by Dr. Jon Aster and were verified by short tandem repeat (STR) profiling. Cell lines were regularly tested for mycoplasma.
HCC1599 (female), Rec-1 (male) and DND41 (male) cells were grown in RPMI 1640 (Corning, cat# 10-040-CM) supplemented with 10% fetal bovine serum (Thermo Fisher Scientific, cat# SH30070.03), 2 mM L-glutamine (Corning, cat# 25-005-CI), 100 U/mL and 100 μg/mL penicillin/streptomycin (Corning, cat# 30-002-CI), 100 mM nonessential amino acids (Gibco, cat# 11140-050), 1mM sodium pyruvate (Gibco, cat# 11360-070) and 0.1mM of 2-mercaptoethanol (Sigma, cat# M6250). MB157 (female) cells were grown in DMEM (Corning, cat# 10-013-CV) supplemented with 10% fetal bovine serum (Thermo Fisher Scientific, cat# SH30070.03) and 100 U/mL and 100 μg/mL penicillin/streptomycin (Corning, cat# 30-002-CI). When passaged cells were detached with 0.25% trypsin, EDTA-free (Gibco, cat# 15090-046) to avoid activation of Notch signaling. HEK293T cells were grown in DMEM (Corning, cat# 10-013-CV) supplemented with 10% fetal bovine serum (Thermo Fisher Scientific, cat# SH30070.03) and 100 U/mL and 100 μg/mL penicillin/streptomycin (Corning, cat# 30-002-CI).
All cell lines were grown at 37°C and 5% CO 2 and were used at a low passage number (<12).
METHODS DETAILS
GSI-Washout assay
For GSI washout studies of ChIP-seq, RNA-seq and ATAC-seq in MB157, HCC1599, Rec-1 and DND41 cells were treated with the GSI compound E (1 μM, Calbiochem cat# 565790) for 72 hours, washed, and then cultured for 5 hours in media containing 1μM GSI (mock washout) or DMSO (washout) as previously described (Wang et al., 2014, DOI: 10.1073/pnas.1315023111). For HiChIP recovery assay GSI was removed after 72 hours and cells were then recovered for 3 days. Following washout, cells were harvested from culture, cross-linked for ChIP-seq or HiChIP and frozen in −80°C for further use.
Lentiviral Packaging
Lentivirus was produced in HEK293T cells as previously described (Ryan et al., 2017, DOI: 10.1016/j.celrep.2017.09.066). Briefly, 4×10⁶ HEK293T cells were plated in 8mL DMEM media in 10 cm dishes a day before transfection. The lentiviral constructs, packaging plasmid (pCMVdelta) and envelope plasmid (VSV-G) were co-transfected using FuGene HD (Promega, cat# E2311). The cells were returned to the incubator for at least 6 hours before media was replaced. Viruses were harvested 48h post-transfection, snap-frozen, and stored at −80°C.
MYC and CCND1 enhancer knockdown
CRISPR/Cas9 system was used for knocking down MYC and CCND1 enhancers. Codon-optimized version of Cas9 carrying puromycin resistance gene and sgRNA vectors carrying GFP (LRG2.1) or mCherry (LRmCherry2.1) (Grevet et al., 2018, DOI:10.1126/science.aao0932) were used. sgRNAs targeting sequences were designed with the http://crispr.mit.edu/ platform to specifically target RBPJ motifs in MYC and CCND1 enhancers and were sub-cloned into LRG2.1 and LRmCherry2.1 vectors. For stable cell line generation MB157 cells were transduced with Cas9-puro lentiviral supernatants by spinfection at 2500 rpm for 90 min in the presence of 6 μg/mL polybrene at 28°C (Sigma-Aldrich, cat# H9268). Transduced cells were selected 4 days after spin infection with 4 μg/mL puromycin for 7 days, following the Cas9 mRNA examination. For targeting MYC enhancers MB157-Cas9 cells were subsequently transduced with lentiviruses produced with LRmCherry2.1 encoding g7 and g16 (E1), LRG2.1 encoding g23 and g3 (E5) or LRmCherry2.1 encoding g7 and g16 and LRG2.1 encoding g23 and g3 for dual targeting of MYC enhancers (E1 + E5). For targeting CCND1 enhancers MB157-Cas9 cells were subsequently transduced with lentiviruses produced with LRG2.1 encoding g2 (E1), LRmCherry2.1 encoding g6 (E2), or LRmCherry2.1 encoding g6 and LRG2.1 encoding g2 for dual targeting of CCND1 enhancers (E1 + E2). In control condition MB157-Cas9 cells were transduced with LRG2.1 or LRG2.1 and LRmCherry2.1. Cells were sorted on BD FACS Aria II using 100μm nozzle at 20 psi for expression of GFP, mCherry or both on day 4 and harvested for RNA extraction and Western blotting.
Quantitative RT-PCR
RNA was extracted with the QIAGEN RNeasy Plus Mini kit (cat# 74136) or Micro Kit (cat# 74034). cDNA was synthesized from RNA with the SuperScript III kit (Invitrogen, cat# 18080093). Transcripts were amplified with Power SYBR Green PCR Master Mix (Applied Biosystems, cat# 4367659), and quantitative PCR was performed on an Applied Biosystem ViiA 7 real-time PCR System. Relative expression level was calculated by the 2^−(ΔΔCt) method in comparison to EEF1A1 control. Statistics was calculated using a Student’s t test against the control condition. Primers were designed using Primer-BLAST software.
Western Blot
Western blotting was performed on whole cell lysates from sorted control and dual MYC or CCND1 enhancer targeted MB157 cells. Whole cell lysates were extracted with RIPA buffer (50mM Tris pH 8.0, 1mM EDTA, 150mM NaCl, 1% NP-40, 0.5% Na-deoxycholate, 0.1% SDS) supplemented with 10mM NaF, 1mM Na3VO4 and EDTA-free proteinase inhibitor cocktail cOmplete (Roche, cat# 11836170001) by standard Western blotting protocols. Antibodies used were MYC antibody [Y69] (Abcam, cat# ab32072), CCND1 antibody (DCS6) (CST, cat# 2926), α-tubulin [DM1A] (Abcam, cat# ab7291), and β-actin (Sigma, cat# A5316).
Cell proliferation assays
To measure cell growth, control cells and dual MYC enhancer targeted cells were sorted on BD Influx using 140 μm nozzle at 5.5 psi, and were re-plated in 3–5 replicates at equal density in 96 well plates. Luminescence was measured 24 hours after plating (day 0) and every 3 days for total 9 days with CellTiter Glo Luminescent Cell Viability Assay (Promega, cat# G7571) according to the manufacturer’s instructions. Statistics for cell growth changes were calculated using a Student’s t test against the control condition.
To measure CellTrace Violet (CTV) dilution in control and MYC or CCND1 enhancer knock down cells, 4 days after spinfection 2×10⁶ cells were stained with standard protocol from CellTrace Violet Cell Proliferation Kit for flow cytometry (Invitrogen, cat# C34557). Stained cells were analyzed 6 days post CTV incorporation. Freshly stained CTV cells and unstained cells were used for comparison. Cells were gated on live population using LIVE/DEAD Aqua (Life Technologies, cat# L34957) and GFP or mCherry and GFP positive cells were assayed for CTV dilution. Three replicates were performed for each condition. Mean fluorescence intensity (MFI) was calculated using geometric mean of the indicated fluorescence in FlowJo software v9.7.7 (TreeStar).
EdU incorporation assay
MB157 cells were spinfected with control sgRNAs or CCND1 (E1 and E2) targeted sgRNAs and 6 days post-spinfection cultured in the presence of 10μM EdU (Invitrogen, cat# C10424) for 24 hours. Cells were then harvested with 0.25% trypsin, EDTA-free (Gibco, cat# 15090-046), sorted and washed twice with 1× PBS (Corning, cat# 21031CV) and fixed by fixation/permeabilization kit (eBioscience, cat# 005223-56 and 005123-43) for 30 minutes. Fixed cells were washed twice with ice-cold 1× PBS and incubated for 30 minutes at RT with a solution containing 10mM Tris-HCL pH 8.5, 20mM CuSO4, 1.45 μg/mL of Alexa Fluor 647-Azide (Invitrogen, cat# A10277) and 135mM of ascorbic acid (Sigma-Aldrich, cat# 50-81-7). Cells were washed once with 1× PBS and Flow cytometry was performed on BD LSR II and FlowJo software v9.7.7 (TreeStar) was used for analysis. Three replicates were performed for each condition. Mean fluorescence intensity (MFI) was calculated using geometric mean of the indicated fluorescence in FlowJo software v9.7.7 (TreeStar).
RNA Sequencing
Strand-specific RNA-seq was performed on MB157, HCC1599 and DND41 cells. Poly-A selected RNA-seq for Rec-1 cells was done previously (Stoeck et al., 2014, DOI: 10.1158/2159-8290.CD-13-0830). Cells from GSI and washout conditions were washed with 1 × PBS (Corning, cat# 21031CV) and lysed with 350 μl RLT Plus buffer (Qiagen) supplemented with 2-mercaptoethanol (Sigma, cat# M6250), vortexed briefly, snap-frozen on dry ice, and stored at −80°C. Subsequently, total RNA was isolated using the RNeasy Plus Micro Kit (Qiagen, cat# 74034). RNA integrity numbers were determined using TapeStation 2200 (Agilent), and all samples used for RNA-seq library preparation had RIN numbers greater than 9.5. 800 ng of total RNA was used and libraries were prepared using the SMARTer Standard Total RNA Sample Prep Kit-HI Mammalian (Clontech, cat# 634873). Libraries were single-end sequenced (75 bp) on a NextSeq 550. Three biological replicates were performed in each cell line in GSI and washout conditions.
Chromatin Immunoprecipitation Sequencing
ChIP-seq was performed as previously described (Ryan et al., 2017, DOI: 10.1016/j.celrep.2017.09.066). Briefly, chromatin samples prepared from appropriate number of fixed cells (107 for histone modifications and 4 × 10⁷ for transcription factors) were sonicated and cleared with recombinant protein G-conjugated Agarose beads (Invitrogen, cat# 15920-010) and subsequently immunoprecipitated with antibodies recognizing Notch1 (Wang et al., 2014, DOI: 10.1073/pnas.1315023111), RBPJ (D10A4) (CST, cat# 5313), H3K27ac (Active Motif, cat# 39133), H3K27me3 (EMD Millipore cat# 07-449), H3K4me1 (Abcam, cat# ab8895), SMC1a (Bethyl, cat# A300-055A) and CTCF (EMD Millipore cat# 07-729). Antibody-chromatin complexes were captured with recombinant protein G-conjugated Agarose beads, washed with Low Salt Wash Buffer, High Salt Wash Buffer, LiCl Wash Buffer and TE buffer with 50mM NaCl and eluted. Input sample was prepared by the same approach without immunoprecipitation. After reversal of cross-linking, RNase (Roche, cat# 10109169001) and Proteinase K (Invitrogen, cat# 25530-049) treatments were performed and DNA was purified with QIAquick PCR Purification Kit (Qiagen, cat# 28106). Libraries were then prepared using the NEBNext Ultra II DNA library Prep Kit for Illumina (NEB, cat# E7645S). Two replicates were performed for each condition. Indexed libraries were validated for quality and size distribution using a TapeStation 2200 (Agilent). Single end sequencing (75 bp) or Paired-end sequencing (38 bp+38 bp) was performed on a NextSeq 550.
HiChIP
HiChIP was performed as described (Mumbach et al., 2016, DOI: 10.1038/nmeth.3999) using antibody against SMC1a (Bethyl, cat# A300-055A). Briefly, 2 × 10⁷ cells were crosslinked with 1% formaldehyde (Thermo Fisher Scientific, cat# 28908) for 10 min and subsequently quenched with 0.125M glycine (Invitrogen, cat# 15527-013). Chromatin was digested using MboI restriction enzyme (NEB, cat# R0147), followed by biotin incorporation with Biotin-14-dATP (Invitrogen, cat# 19524-016) in end-repair step, ligation, and sonication. Sheared chromatin was 4-fold diluted with ChIP dilution buffer (16.7mM Tris pH 7.5, 167mM NaCl, 1.2mM EDTA, 0.01% SDS, 1.1% Triton X-100) and cleared and then incubated with anti-SMC1 antibody at 4°C for overnight. Chromatin-antibody complexes were captured by Protein-A magnetic beads (Pierce, cat# 88846) and subsequently washed with Low Salt Wash Buffer, High Salt Wash Buffer, LiCl Wash Buffer and eluted. DNA was purified with MinElute PCR Purification Kit (Qiagen, cat# 28004) and quantified using Qubit dsDNA HS Assay Kit (Invitrogen, cat# Q32851). 50-150ng was used for capture with Dynabeads MyOne Streptavidin C-1 (Invitrogen, cat# 65001) and an appropriate amount of Tn5 enzyme (Illumina, cat# FC-121-1030) was added to captured DNA to generate sequencing library. Paired-end sequencing (38 bp+38 bp) was performed on a NextSeq 550.
Assay for Transposase-Accessible Chromatin (ATAC)
ATAC-seq was performed as previously described (Buenrostro et al., 2013, DOI: 10.1038/nmeth.2688). Briefly, 50,000 MB157 GSI-treated or GSI-washout cells were pelleted at 800 × g and washed with 50 μl of ice cold 1 × PBS (Corning, cat# 21031CV), followed by 2min treatment with 50μl lysis buffer (10 mM Tris-HCl, pH 7.4, 3 mM MgCl2, 10 mM NaCl, 0.1% NP-40 (Igepal CA-630). After pelleting nuclei, nuclei were resuspended in 50 μl of transposition buffer (25 μl of 2 × TD buffer, 22.5ul of molecular biology grade water and 2.5 μl Tn5 transposase (Illumina, cat# FC-121-1030) to tag the accessible chromatin for 45min at 37°C. Tagmented DNA was purified with MinElute Reaction Cleanup kit (Qiagen, cat# 28204) and amplified with 5 cycles. Additional number of PCR cycles was determined from the side reaction and ranged from 10-12 total cycles of PCR. Two replicates were performed for each condition. Libraries were purified using QiaQuick PCR purification kit (Qiagen, cat# 28106) and eluted in 20 μl EB buffer. Indexed libraries were assessed for nucleosome patterning on the TapeStation 2200 (Agilent) and paired-end sequenced (38bp+38bp) on NextSeq 550 (Illumina).
MYC transgene rescue of GSI-treated cells
For generation of doxycycline inducible MYC transgene expression, MB157 cells were transduced with pINDUCER-20-MYC (Ryan et al., 2017, DOI: 10.1016/j.celrep.2017.09.066) lentiviral supernatants by spinfection at 2500 rpm for 90 min in the presence of 6 μg/mL polybrene at 28°C. Transduced cells were selected 4 days after spin infection with 1.2 mg/mL G418 (Gibco, cat# 11811-023) for 10 days. MB157 cells stably transduced with pINDUCER-20-MYC were plated in media containing 1 μM GSI (Calbiochem cat# 565790) or DMSO, with or without 0.316 μg/ml doxycycline (Sigma, cat# D9891) for 3 days. 3 days following the treatment MYC transgene recovery was confirmed with qRT-PCR and Western Blot. These cells were expanded and cross-linked for ChIP-seq or HiChIP.
High-throughput 3D DNA-FISH
Generation of Oligopaint FISH probes
Oligopaint libraries were designed using the OligoMiner pipeline (Beliveau et al., 2018, DOI: 10.1073/pnas.1714530115). 50 nucleotide sequences with homology to the regions of interest were mined from the hg38 genome build using the default parameters of OligoMiner. Each probe library targeted a 50 Kb region of sequence.
Oligopaint FISH on slides
Cells were cytospun to poly-L-lysine-treated glass slides at 1200 rpm for 5 min. Cells were subsequently fixed for 10 minutes with 4% formaldehyde in PBS at room temperature (RT), followed by membrane permeabilization with 0.5% Triton X-100 in PBS for 15 minutes at RT. Cells were then washed in 2XSSCT/50% formamide (0.3M NaCl, 0.03M sodium citrate, 0.1% Tween-20) for 5min, pre-denatured in 2×SSCT/50% formamide at 92°C for 2.5 minutes, and then in 2×SSCT/50% formamide at 60°C for 20 minutes. 10 pmol of primary Oligopaint probes in hybridization buffer (10% dextran sulfate/2×SSCT/50% formamide/4% polyvinylsulfonic acid (PVSA)/1.4 mM dNTPs) were then added to the cells, covered with a coverslip, and sealed with rubber cement. Cells were denatured by placing slides on a heat block in a water bath set to 92°C for 2.5 minutes, after which slides were transferred to a humidified chamber and incubated overnight at 37°C. Approximately 16–18 hours later, coverslips were removed with a razor blade, and slides were washed in 2×SSCT at 60°C for 15 minutes, 2×SSCT at RT for 10 minutes, and 0.2×SSC at RT for 10 minutes. Secondary probes (10pmol/25μL) containing fluorophores were added to slides, again resuspended in hybridization buffer containing only 10% formamide, and covered with a coverslip sealed with rubber cement. Slides were incubated at room temperature for 2 hours in a humidified chamber, followed by washes in 2×SSCT at 60°C for 5 minutes, 2×SSCT at RT for 5 minutes, and 0.2×SSC at RT for 5 minutes. All slides were washed with Hoechst DNA stain (1:10,000 in PBS) for 5 minutes, followed by 2X 5 minute washes in PBS before mounting in Slowfade (Invitrogen, cat# 336936).
QUANTIFICATION AND STATISTICAL ANALYSIS:
The statistical significance of differences between measurements was determined by Wilcoxon rank sum using the R package, unless otherwise was stated. Statistical details of experiments can be found in the figure legends.
Definition of regulatory elements
The following definitions of regulatory elements were used throughout the manuscript. Promoters: Promoters were defined as ± 2.5 kilobases from the transcription start site (TSS) of each expressed gene. Enhancers: Enhancers were defined as H3K27ac peaks greater than 500bp excluding the ones overlapping with promoters. Super-enhancers: Super-enhancers were defined by implementing previously described methods (Whyte et al., 2013, DOI: 10.1016/j.cell.2013.03.035) in R and applying it to H3K27ac peaks.
Gene annotation
A total of 2,828,317 Ensembl transcripts in GRCh37.75 assembly were downloaded in gtf format. For each Ensembl gene id (ENSG), the longest transcript (ENST) was used to assign unique transcriptional start site and gene position. After exclusion of genes annotated as rRNA or on chromosome M, 57,209 gene annotations were used in RNA-seq analysis.
ChIP-seq data analysis
Alignment
Reads from all ChIP-seq experiments were trimmed with Trim Galore (version 0.4.1) with parameters -q 15 --phred33 --gzip --stringency 5 -e 0.1 --length 20. Trimmed reads were aligned to the Ensembl GRCh37.75 primary assembly including chromosome 1–22, chrX, chrY, chrM and contigs using BWA (version 0.7.13) (Li and Durbin, 2009, DOI: 10.1093/bioinformatics/btp324) with parameters bwa aln -q 5 -l 32 -k 2 -t 6 and paired-end reads were group with bwa sampe -P -o 1000000. Reads mapped to contigs, ENCODE blacklist and marked as duplicates by Picard (version 2.1.0) were discarded and the remaining reads were used in downstream analyses and visualization.
Transcription factor reproducible peak calling
Reproducible peaks in ChIP-seq replicates of transcription factors including NOTCH1, RBPJ, SMC1 and CTCF were identified following an implementation of ENCODE Irreproducible Discovery Rate (IDR) pipeline. Peaks in true replicates, pseudoreplicates and pooled samples were identified using MACS (version 2.0.9) (Zhang et al., 2008, DOI: 10.1186/gb-2008-9-9-r137) with parameters -p 1E-3 -g hs --nomodel --shiftsize=0.5*fragment_length --format=BAM -- bw=300 --keep-dup=1 and with corresponding input control. IDR cutoffs for true replicates, pseudoreplicates and pooled samples were 0.05, 0.05 and 0.005 respectively. Replicates with Np/Nt < 2 and N1/N2 < 2 were considered reproducible.
Definition of Notch binding
For MB157 and HCC1599, the union of NOTCH1 and RBPJ reproducible peaks in GSI-washout (WO) condition was defined as Notch binding sites. The reads of merged replicates for NOTCH1 and RBPJ in GSI and WO were filtered on such sites individually and quantified as raw binding strength. The enrichment of binding in WO versus GSI was calculated using ‘enrichR’ and ‘getQvalues’ from normr (version 1.6.0) R package using parameters treatment = WO.raw.binding, control = GSI.raw.binding, minP = 1, eps = 0.00001, iterations = 10, procs = 12. Bindings with FDR < 0.05 were considered GSI-sensitive, or Notch-responsive. For each binding site, if either NOTCH1 or RBPJ binding was Notch-responsive, the site was determined as “Notch-bound” or “Notch-responsive”. Genomic regions that do not overlap with any Notch binding site were determined “Notch-unbound”. For Rec-1, this analysis was done with only NOTCH1.
H3K27ac peak calling and differential analysis
Aligned reads of H3K27ac ChIP-seq replicates in GSI and GSI-washout (WO) conditions in MB157, HCC1599 and Rec-1 cells were merged with samtools (version 1.3) (Li et al., 2009, DOI: 10.1093/bioinformatics/btp352) ‘cat’ command for peak calling. Fragment length was estimated with HOMER (version 4.8) (Heinz et al., 2010, DOI: 10.1016/j.molcel.2010.05.004). Peaks were identified using MACS with parameters -q 1E-5 -g hs --nomodel -- shiftsize=0.5*fragment_length --format=BAM --bw=300 --keep-dup=1 and with corresponding input control. In each merged library, peak-filtered H3K27ac signal was quantified and normalized to FPKM. Log2 fold change of H3K27ac load was calculated as log2 FPKM of WO versus GSI. Significance of change was determined by using ‘enrichR’ and ‘getQvalues’ functions from normr R package using parameters treatment = WO.raw.h3k27ac, control = GSI.raw.h3k27ac, minP = 1, eps = 0.00001, iterations = 10, procs = 12. The criteria for differential H3K27ac peaks were log2 fold change > 0.5 or < −0.5 and FDR < 1E-10. Differential peaks with positive log2 fold change were considered Notch-sensitive and the Notch-bound subset was considered Notch-activated.
Aligned reads of H3K27ac ChIP-seq replicates in GSI -dox and GSI +dox conditions in pINDUCER-20-MYC transduced MB157 cells were quantified individually over the coordinates of peaks identified in parental MB157 GSI-washout H3K27ac ChIP-seq and normalized to FPKM. Log2 fold change of H3K27ac load was calculated as log2 averaged FPKM of replicates of GSI +dox versus GSI -dox. Significance of change was determined using unnormalized quantification as input to ‘DESeq’ function from DESeq2 R package (Love et al., 2014, DOI: 10.1186/s13059-014-0550-8) with parameters test = “Wald”, betaPrior = F, fitType = “parametric”. P-values were adjusted for multiple hypothesis testing using FDR. The criteria for differential H3K27ac peaks were log2 fold change > 0.5 or < −0.5 and FDR < 1E-10.
ATAC-seq data analysis
Reads from ATAC-seq experiments were aligned with the same procedure as ChIP-seq described above. Peaks in each sample were identified using MACS with parameters -p 1E-5 --nomodel --nolambda --format=BAM -g hs --bw=300 --keep-dup=1. To determine the change in accessibility on Notch binding sites, aligned reads of each ATAC-seq sample were quantified on Notch binding sites defined above and normalized to FPKM. Log2 fold change of accessibility was calculated as log2 averaged FPKM on replicates of WO versus GSI. Significance of change was determined using unnormalized quantification as input to ‘DESeq’ function from DESeq2 R package with parameters test = “Wald”, betaPrior = F, fitType = “parametric”. P-values were adjusted for multiple hypothesis testing using FDR. The criteria for differentially accessible Notch bindings were log2 fold change > 1 or < −1 and FDR < 0.01.
Motif Analysis
MEME-FIMO (Bailey et al., 2015, DOI: 10.1093/nar/gkv416) and RBPJ position probability matrices RBP-Jkappa_transfac_M01111 and RBP-Jkappa_transfac_M01112 from ENCODE (http://compbio.mit.edu/encode-motifs) and RBPJ motif from Wang et al. (Wang et al., 2014, DOI: 10.1073/pnas.1315023111) was used to search for Notch-transcription complex binding motif in the sequences at the Notch-bound sites defined by ChIP-seq analysis using a p value threshold of 1E-3.
MEME-FIMO and JASPAR human core database of transcription factor motifs (Sandelin et al., 2004, DOI: 10.1093/nar/gkh012) was used to search for bHLH and zinc-finger family transcription factor motifs enriched within 1000 bp repeat-masked (http://www.repeatmasker.org/) sequences centered at Notch-bound sites at the Notch-instructed loop anchors. Subsequently, permutation testing was used to demonstrate the significance of the observed transcription factor motif at these sequences. In summary, for each cell line, the null distribution model of Notch-bound sites at the Notch-instructed loops (foreground) was constructed from the sequences at H3K27ac peaks that did not overlap with Notch-bound sites (background). For each iteration, a randomized set of coordinates matching the properties of foreground was generated from background using bedtools (version 2.25.0) (Quinlan and Hall, 2010, DOI: 10.1093/bioinformatics/btq033) ‘shuffle’ command. This process was repeated 1000 times and the number of times each of the observed motifs detected in the random sequences was recorded. Using these values, sampling p-values of motifs expressed in each cell line were calculated with R function ‘prop.test’ and ranked. For each cell line, the criteria for motif enrichment were occurrence in at least 90% of foreground sequences and p-value ranked in the top 20.
RNA-seq data analysis
RNA-seq data was aligned to Ensembl GRCh37.75 primary assembly including chromosome 1–22, chrX, chrY, chrM and contigs using STAR (version 2.5) (Dobin et al., 2013, DOI: 10.1093/bioinformatics/bts635) with parameters --outFilterIntronMotifs RemoveNoncanonicalUnannotated --alignIntronMax 100000 --outSAMstrandField intronMotif --outSAMunmapped Within --chimSegmentMin 25 --chimJunctionOverhangMin 25. Strand-specific read counts were quantified using Subread (version 1.5.1) featureCounts with parameters -t exon -g gene_id -s 1 -T 6 and used as input to differential gene expression analysis. Read counts were normalized to reads per million per kilobase (RPKM) for each gene. Expressed genes were determined as genes with > 1 RPKM in at least 4 out of 6 samples.
Differential gene expression analysis in WO versus GSI condition triplicates was performed using DEseq2 with parameters test = “Wald”, betaPrior = F, fitType = “parametric”. In MB157 and HCC1599, genes that showed log2 fold change > 0.5 or < −0.5 with FDR < 0.05 were considered differentially expressed. Genes down-regulated upon GSI-treatment, i.e. log2 fold change > 0.5 were considered Notch-sensitive or Notch-upregulated genes. Notch-sensitive genes in both MB157 and HCC1599 were considered TNBC Notch-sensitive genes in Figure S3G. In Rec-1 and DND41, the analyses were the same except the log2 fold change cutoff for differential expression was +/− 0.2.
The union of Notch-sensitive genes in TNBC, Rec-1 and DND41 were used to generate the transcription heatmap in Figure S3G. K-means clustering with k = 15 on log2 fold change was done with R function kmeans with parameters iter.max=100000, nstart=100. For visualization, log2 fold change with absolute value < 0.1 was set to 0. The clusters were rearranged to emphasize expression patterns shared or unique to each cell type with ‘pheatmap’ visualization package in R.
Expressed genes in MB157, Rec-1 and DND41 were ranked by log2 fold change and used to conduct gene-set enrichment analysis (GSEA) (Subramanian et al., 2005, DOI: 10.1073/pnas.0506580102) in Figure S3H with 100,000 permutations against the combined gene set HALLMARK_MYC_targets_V1 and HALLMARK_MYC_targets_V2 from Molecular Signatures Database (MSigDB, version 6.1) (Liberzon et al., 2015, DOI: 10.1016/j.cels.2015.12.004). Visualization was done in R.
HiChIP data analysis
Significant interaction calling
Raw reads for each HiChIP sample were processed with HiC-Pro (version v2.5.0) (Servant et al., 2015, DOI: 10.1186/s13059-015-0831-x) to obtain putative interactions with default parameters except LIGATION_SITE = GATCGATC and GENOME_FRAGMENT generated for MboI restriction enzyme. Valid pairs (VI), self-circle (SC) and dangling-end (DE) interactions in cis were used as input for significant interaction calling in ‘.bedpe’ format. Mango (version 1.2.0) (Phanstiel et al., 2015, DOI: 10.1093/bioinformatics/btv336) step 4 identified putative significant interaction anchors by MACS peak calling with MACS_qvalue = 0.05 and MACS_shiftsize = 75. Mango step 5 identified significant interactions with default parameters except maxinteractingdist = 2000000 and MHT = found. Only significant interactions with PETs >= 4 were used in the following analyses. Sequencing depth and library summary generated by HiC-Pro can be found in Table S1. For each library, each significant interaction was normalized to contacts per hundred million, i.e. divided by the number of interactions in the Mango input .bedpe file and timed 1E8.
Contact domain identification
The valid pairs (allValidPairs file) from HiC-Pro were used to generate .hic file using Juicer tools (version 1.7.6) (Durand et al., 2016, DOI: 10.1016/j.cels.2016.07.002) ‘pre’ command. Interaction matrices with 25 Kb bin size and Vanilla coverage square root (VC_SQRT) normalization were generated for each chromosome using Juicer tools ‘dump’ command. Continuous putative contact domain boundaries in DMSO and GSI conditions were identified using insulation score (version 1.0.0) (Crane et al., 2015, DOI: 10.1038/nature14450) with parameters -is 500000 -ids 200000 -im mean -bmoe 3 -nt 0.1 -v. Overlap of domain boundaries in Figures 1C, S1B, S1C and S1G were determined by bedtools ‘intersect’ command. Starting from the first boundary on every chromosome, each two consecutive boundaries constitute one contact domain. Shared contact domains were defined as domains with both boundaries overlapping determined by bedtools ‘pairToPair’ command.
Compartment analysis
The eigenvector of each chromosome of each sample was generated from the .hic file using Juicer tools ‘eigenvector’ command with VC_SQRT normalization at 1 Mb resolution. To compare the first principal component (PC1) between two samples, Pearson correlation of PC1 per chromosome was calculated. If the correlation was negative, the signs of the PC1 values of this chromosome in one sample were flipped.
Transcription factor binding on domain boundaries
The distance of each CTCF, SMC1, RBPJ and NOTCH1 ChIP-seq peak to the closest domain boundary was calculated in terms of 25 Kb bins. Binding events within +/− 3 bins of boundaries were considered on the boundaries. The orientations of CTCF motifs on CTCF peaks were determined by MEME Suite function ‘fimo’ with p-value 1E-3 and JASPAR CTCF motif CTCF_jaspar_MA0139.1. In the case of multiple motifs on either side of the boundaries of one domain, the hierarchy of CTCF motif orientation is: if the two boundaries have at least one pair of +/− motifs, the domain was determined to have convergent CTCF motifs on its boundaries; else if at least one pair of +/+ motifs, both forward; else if at least one pair of −/− motifs, both reverse; otherwise divergent motifs. The heatmap in Figure 1D was generated with 920 domains with CTCF and SMC1 ChIP-seq peak on both of their boundaries. The left and right boundaries of each domain were centered at the CTCF peak summit, extended +/− 2 Kb and binned every 50bp. Normalized CTCF, SMC1 and RBPJ ChIP-seq intensity were quantified and normalized with custom Perl script. Heatmap was sorted by row sum of RBPJ intensity and visualized with pheatmap R package.
Contact domains chromatin activity
For each sample, the number of significant interactions within each contact domain was quantified and contact domains with lowest 25% significant interaction counts, lowest 5% size and top 5% size were discarded. The remaining contact domains were classified for their chromatin state. To generate the heatmap in Figures 2A, S2B and S2F, each contact domain was extended +/− 20% of its size and scaled to 0 – 100% and divided into 100 bins. H3K27ac, H3K4me1 and H3K27me3 ChIP-seq signals were quantified within each bin using HOMER (version 4.8) (Heinz et al., 2010, DOI: 10.1016/j.molcel.2010.05.004) annotatePeaks.pl with parameters hg19 -size given -hist 100 -ghist. An activity score was defined for each contact domain as the sum of H3K27ac signal minus the sum of H3K27me3 signal. A contact domain’s chromatin state was set to active if its activity score was positive, and repressed otherwise.
Intradomain interaction analysis
A significant contact was considered intradomain if its start and end were both within the boundaries of a contact domain. The significant interactions within each contact domain were quantified by bedtools intersect and the normalized interactions were summed up. To generate Figures 2E, 2G and 6C, intradomain interaction log2 fold change DMSO versus GSI was calculated, ranked in ascending order and divided into quartiles. The number of active/repressed domains in each quartile was counted and plotted as stacked barplot with R ggplot2 (version 2.2.1). To generate the heatmap in Figures 2D, 2F and 6B, each contact domain was extended +/− 20% of its size, scaled to 0 – 100%, divided into 100 bins and quantified over the intradomain significant interactions. Domains were sorted by log2 fold change in descending order and visualized with pheatmap.
Regulatory interaction analysis
Significant interactions were classified into enhancer-enhancer (EE), enhancer-promoter (EP) and promoter-promoter (PP) interactions based on the presence of enhancers and promoters at the summit of the two anchors +/− 5 Kb. For each EE/EP/PP interaction in a sample, the normalized supporting significant contacts were summed up as interaction strength. Log2 fold change was calculated as log2 DMSO vs GSI of normalized interactions. Significance of fold change was determined by using ‘enrichR’ and ‘getQvalues’ functions from normr R package using parameters treatment = DMSO.raw.interaction, control = GSI.raw.interaction, minP = 1, eps = 0.00001, iterations = 10, procs = 12. The criteria for differential contact in MB157 were log2 fold change > 0.5 or < −0.5 and FDR < 1E-10. For HCC1599 and Rec-1, the criteria were the same except FDR < 0.05. Differential interactions with positive fold change were considered Notch-sensitive and the subset with Notch-bound enhancer at the anchor(s) was considered Notch-instructed.
Figure 3 used EP interactions of Notch-sensitive genes. Genes without symbols, small nucleolar RNAs (snoRNAs), microRNA, small nuclear RNAs (snRNA) and misc_RNA were excluded. In Figures 3E and 3F, direct Notch-activated genes were defined as Notch-sensitive genes associated with Notch-activated/insensitive enhancers through Notch-instructed/insensitive loops. The number of Notch-activated enhancers and Notch-instructed loops were calculated for direct Notch target genes. Notch direct target genes regulation mode was determined with the following procedure: if a gene had at least one Notch-instructed loop connecting a Notch-activated enhancer, it was considered as ΔE + ΔL (mode a); else if a gene had at least one Notch-instructed loop, it was considered as ∅E + ΔL (mode b); else if a gene had at least one Notch-activated enhancer, it was considered as ΔE + ∅L (mode c); otherwise considered as ∅E + ∅L (mode d).
To assess regulatory loop recovery upon GSI-washout (WO) in MB157, the set of regulatory interactions determined in DMSO and GSI conditions were quantified and normalized over WO significant interactions. Log2 fold change was calculated as log2 WO vs GSI of normalized interactions. Significance of change was determined by using ‘enrichR’ and ‘getQvalues’ functions from normr R package using parameters treatment = WO.raw.interaction, control = GSI.raw.interaction, minP = 1, eps = 0.00001, iterations = 10, procs = 12. The criteria for recovered contact were log2 fold change > 0.5 or < −0.5 and FDR < 0.05. In Figure 7B, the normalized intensity of Notch-sensitive EE/EP/PP interactions were visualized with ‘geom_boxplot’ in ggplot2 R package. In Figure 7C, the EP interactions involving direct Notch-activated genes with Notch-instructed loops were sorted by log2 fold change of DMSO vs GSI and the normalized intensity was visualized with pheatmap R package.
To assess regulatory loop recovery upon MYC rescue in MB157, the set of regulatory interactions determined in DMSO and GSI conditions in parental MB157 were quantified and normalized over significant interactions identified in GSI −dox and GSI +dox conditions in MB157-pIND-MYC line. Log2 fold change was calculated as log2 +dox vs −dox of normalized interactions. Significance of change was determined by using ‘enrichR’ and ‘getQvalues’ functions from normr R package using parameters treatment = +dox.raw.interaction, control = −dox.raw.interaction, minP = 1, eps = 0.00001, iterations = 10, procs = 12. The criteria for recovered contact were log2 fold change > 0.5 or < −0.5 and FDR < 0.05.
3D Clique analysis
An undirect graph (Diestel, R. Graph theory, Springer, 1997) of regulatory interactions was constructed for each cell line where each vertex was an enhancer or a promoter and each edge was a significant enhancer-enhancer, enhancer-promoter, or promoter-promoter interaction. “3D Cliques” were defined by spectral clustering (Blondel et al., 2008, DOI:10.1088/1742-5468/2008/10/P10008) of the regulatory graph interactions using cluster_louvain function in igraph R package with default parameters. A 3D clique connectivity was defined as the number of edges connecting vertices within the clique. In Figures 4B and S6E, the connectivity of cliques was ranked in ascending order and plotted against the rank. The cutoff for hyperconnected 3D cliques was set to the elbow of the curve and a tangent line at the cutoff was shown. In Figure 4E, a 3D clique was “Notch-bound” if any enhancer node in the 3D clique was Notch-bound.
In Figure 4F, the number of Notch-sensitive edges in each 3D clique was normalized by the total number of Notch-sensitive edges. 3D cliques were ranked in the ascending order of their connectivity and divided into quartiles. The average number and standard error of mean of normalized Notch-instructed edges per 3D clique per quartile was calculated and visualized with geom_bar from ggplot2 R package. Figure 4G focused on 3D cliques containing direct Notch targets. The presence of each mode of regulation in each 3D clique was numerated and normalized by the total presence of each mode. 3D cliques were classified based on the most frequent mode and their total connectivity was visualized with geom_boxplot from ggplot2 R package. Three 3D cliques with mode d (∅E + ∅L) and three 3D cliques with mode a (ΔE + ΔL) were randomly selected and visualized with R ‘plot’ function in Figure 4H. In Figure 4I, 3D cliques were in the ascending order of their connectivity and divided into quartiles. The average number and standard error of mean of direct Notch targets per 3D clique per quartile was calculated and normalized by the total number of direct Notch targets. Three 3D cliques in the first and fourth size quartile were selected and visualized with R ‘plot’ function in Figure 4J. 3D cliques associated with selected genes were extracted and visualized with R ‘plot’ function in Figures 4D, S4C, S4E, 6E, and S6G.
Loop anchor Non-coding RNA analysis
The biotype of each gene was annotated with ‘getBM’ function in biomaRt R package (v2.28.0). Non-coding RNA were identified based on biotypes including “lincRNA”, “antisense”, “sense overlapping”, “sense intronic”, “snoRNA”, “miRNA”, “snRNA”, “misc RNA”, “pseudogene”, “processed pseudogene”, “unprocessed pseudogene”, “transcribed unprocessed pseudogene”, “transcribed processed pseudogene”, “3prime overlapping ncrna”, “polymorphic pseudogene”, “unitary pseudogene”, “nonstop decay”. The overlap between non-coding RNA and regulatory loop anchors were determined by bedtools ‘intersect’. Notch-instructed loops in each cell line with at least one Notch-bound site and non-coding RNA on the same anchor were compared with Notch-instructed loops without non-coding RNA on either anchor.
Sequencing data visualization
ChIP-seq and RNA-seq tracks
Bedgraph of reads normalized to reads per million (RPM) from ChIP-seq and RNA-seq were generated with bedtools genomecov. Selected genomic loci were visualized with R package Sushi (version 1.18.0) (Phanstiel et al., 2014, DOI: 10.1093/bioinformatics/btu379) function ‘plotBedgraph’. Genome-wide uploadable bigWig files were generated with UCSC tools (version 329) (Kent et al., 2010, DOI: 10.1093/bioinformatics/btq351) ‘bedGraphToBigWig’.
Significant contact
The raw significant contacts identified above in .mango format were converted to tabix format as instructed by WashU EpiGenome Browser (version 46.1) (Zhou and Wang, 2012, DOI: 10.1002/0471250953.bi1010s40) and can be uploaded in ‘Interaction’ mode. Normalized EE/EP/PP interactions at selected loci were visualized with R package Sushi function ‘plotBedpe’.
Contact maps of various resolution
Juicebox (version 1.0) (Durand et al., 2016, DOI: 10.1016/j.cels.2015.07.012) was used to visualize .hic files. To compare contact map of the same loci in two cell lines at 500 Kb, 25 Kb and 5 Kb resolutions in Figures 1A, 1B and S1A, Vanilla coverage square root (VC_SQRT) normalization and view mode ‘observed vs control’ were used.
Z-scored contact map
To emphasize the boundaries identified by insulation score, z-score transformation on 25 Kb-resolution VC_SQRT normalized contact map was applied per chromosome per sample as described (Crane et al., 2015, DOI: 10.1038/nature14450) using R function loessFit with parameters iter = 100, span = 0.02. Selected loci on transformed maps were visualized using R package Sushi function ‘plotHic’. To generate pile-up z-scored contact map in Figure 1G, S1K and S7B, the boundaries with or without Notch binding were centered at the boundary and extended +/− 500 Kb (20 × 25 Kb bins). Z-scored contact maps of the selected range were averaged and visualized using R package Sushi function ‘plotHic’.
Virtual 4C plots
Contact matrices of 5 Kb resolution and VC_SQRT normalization were generated from .hic files using Juicer tools ‘dump’ command. The bin containing the TSS of the gene of interest was determined as “viewpoint” as in 4C experiment. To visualize interactions of surrounding region to the viewpoint, the row of the viewpoint in the contact matrix with the columns within selected range were plotted as a line with R package ggplot2.
DNA-FISH imaging and analysis
Prepared cells were imaged on a Lecia SPE using a 63× HCX PL APO CS 1.4 NA oil immersion objective with pixels of 76 × 76 nm and z spacing of 420 nm. We obtained stacks representing 10 μm in total axial thickness. Image analysis was performed as described (Little et al., 2013, DOI: 10.1016/j.cell.2013.07.025). Briefly, raw images were processed with a Difference-of-Gaussians filter with inner and outer Gaussian parameters of 1.2 and 2.2 pixels, respectively, requiring true objects to be detected at the same xy location on at least 4 consecutive slices, which facilitates separation of true objects from imaging noise. The brightest of the multiple images of the same object was located along each z column and the corresponding z slice used as the z coordinate. Centroid positions in xy on the z slice containing the brightest image were found by fitting a 2D elliptical Gaussian. Euclidian distances between nearest neighbors in each pair of channels were then calculated.
Supplementary Material
Table S2. Notch transcription complex ChIP-seq peaks. Related to Figure 1.
Table S3. Differential Gene Expression in TNBC cell lines. Related to Figure 3.
Table S4. Pathways associated with Notch-activated genes: specific in TNBC, in TNBC hyperconnected cliques, in Rec-1 hyperconnected cliques. Related to Figure 3, 4 and 6.
Table S5. Notch-sensitive H3K27ac ChIP-seq peak annotation. Related to Figure 3.
Table S6. Annotation of regulatory loop anchors. Related to Figure 4.
Table S7. 3D clique connectivity. Related to Figure 4.
Highlights.
Oncogenic Notch repositions enhancers but not contact domains and compartments.
Notch-instructed and preformed loops control direct Notch target gene expression.
Enhancer and promoter elements spatially converge into regulatory 3D cliques.
Notch preferentially targets hyperconnected 3D cliques to regulate key oncogenes.
ACKNOWLEDGMENTS
We thank Shelley Berger and E. John Wherry for their support. This work was supported by LLS-5456-17 (to J.P.); T32-CA009140 (to G.W.S.); R25-HL084665 (to Z.Z.); R01-HL145754 and a Sloan Research Fellowship award (to G.V.); R35-CA220340 (to. S.C.B.); a Penn Epigenetics Institute pilot award (to R.B.F. and W.S.P.); an Abramson Cancer Center Cooper award, an Abramson Family Cancer Research Institute investigator award, an Institution for Translational Medicine and Therapeutics TAPITMAT award, a Concern Foundation Conquer Cancer Now award, and Susan G. Komen CCR185472448 (to R.B.F.); and R01-CA215518 (to W.S.P.).
Footnotes
Publisher's Disclaimer: This is a PDF file of an unedited manuscript that has been accepted for publication. As a service to our customers we are providing this early version of the manuscript. The manuscript will undergo copyediting, typesetting, and review of the resulting proof before it is published in its final citable form. Please note that during the production process errors may be discovered which could affect the content, and all legal disclaimers that apply to the journal pertain.
DATA AND SOFTWARE AVAILABILITY
The accession number for the ChIP-seq, RNA-seq and ATAC-seq reported in this study is NCBI GEO: GSE116876. Original imaging and western blot data used to generate any figure panels have been deposited at Mendeley: (DOI: 10.17632/ch9zcn8rbn.1).
Declaration of Interest:
S.C.B. is a consultant for IFM therapeutics, Ayala Pharmaceuticals, and funded by the Novartis-DFCI. Other authors declare no competing interests.
References:
- Aster JC, Pear WS, and Blacklow SC (2017). The Varied Roles of Notch in Cancer. Annu Rev Pathol 12, 245–275. [DOI] [PMC free article] [PubMed] [Google Scholar]
- Beagrie RA, Scialdone A, Schueler M, Kraemer DC, Chotalia M, Xie SQ, Barbieri M, de Santiago I, Lavitas LM, Branco MR, et al. (2017). Complex multi-enhancer contacts captured by genome architecture mapping. Nature 543, 519–524. [DOI] [PMC free article] [PubMed] [Google Scholar]
- Boija A, Klein IA, Sabari BR, Dall’Agnese A, Coffey EL, Zamudio AV, Li CH, Shrinivas K, Manteiga JC, Hannett NM, et al. (2018). Transcription Factors Activate Genes through the Phase-Separation Capacity of Their Activation Domains. Cell 175, 1–14. [DOI] [PMC free article] [PubMed] [Google Scholar]
- Choy L, Hagenbeek TJ, Solon M, French D, Finkle D, Shelton A, Venook R, Brauer MJ, and Siebel CW (2017). Constitutive NOTCH3 Signaling Promotes the Growth of Basal Breast Cancers. Cancer Res 77, 1439–1452. [DOI] [PubMed] [Google Scholar]
- Crane E, Bian Q, McCord RP, Lajoie BR, Wheeler BS, Ralston EJ, Uzawa S, Dekker J, and Meyer BJ (2015). Condensin-driven remodelling of X chromosome topology during dosage compensation. Nature 523, 240–244. [DOI] [PMC free article] [PubMed] [Google Scholar]
- Dixon JR, Selvaraj S, Yue F, Kim A, Li Y, Shen Y, Hu M, Liu JS, and Ren B (2012). Topological domains in mammalian genomes identified by analysis of chromatin interactions. Nature 485, 376–380. [DOI] [PMC free article] [PubMed] [Google Scholar]
- Dowen JM, Fan ZP, Hnisz D, Ren G, Abraham BJ, Zhang LN, Weintraub AS, Schuijers J, Lee TI, Zhao K, et al. (2014). Control of cell identity genes occurs in insulated neighborhoods in mammalian chromosomes. Cell 159, 374–387. [DOI] [PMC free article] [PubMed] [Google Scholar]
- Fang R, Yu M, Li G, Chee S, Liu T, Schmitt AD, and Ren B (2016). Mapping of long-range chromatin interactions by proximity ligation-assisted ChIP-seq. Cell Res 26, 1345–1348. [DOI] [PMC free article] [PubMed] [Google Scholar]
- Fanucchi S, Shibayama Y, Burd S, Weinberg MS, and Mhlanga MM (2013). Chromosomal contact permits transcription between coregulated genes. Cell 155, 606–620. [DOI] [PubMed] [Google Scholar]
- Flavahan WA, Drier Y, Liau BB, Gillespie SM, Venteicher AS, Stemmer-Rachamimov AO, Suva ML, and Bernstein BE (2016). Insulator dysfunction and oncogene activation in IDH mutant gliomas. Nature 529, 110–114. [DOI] [PMC free article] [PubMed] [Google Scholar]
- Fryer CJ, White JB, and Jones KA (2004). Mastermind recruits CycC:CDK8 to phosphorylate the Notch ICD and coordinate activation with turnover. Mol Cell 16, 509–520. [DOI] [PubMed] [Google Scholar]
- Furlong EEM, and Levine M (2018). Developmental enhancers and chromosome topology. Science 361, 1341–1345. [DOI] [PMC free article] [PubMed] [Google Scholar]
- Gauld SB, and Cambier JC (2004). Src-family kinases in B-cell development and signaling. Oncogene 23, 8001–8006. [DOI] [PubMed] [Google Scholar]
- Henkel T, Ling PD, Hayward SD, and Peterson MG (1994). Mediation of Epstein-Barr virus EBNA2 transactivation by recombination signal-binding protein J kappa. Science 265, 92–95. [DOI] [PubMed] [Google Scholar]
- Herranz D, Ambesi-Impiombato A, Palomero T, Schnell SA, Belver L, Wendorff AA, Xu L, Castillo-Martin M, Llobet-Navas D, Cordon-Cardo C, et al. (2014). A NOTCH1-driven MYC enhancer promotes T cell development, transformation and acute lymphoblastic leukemia. Nat Med 20, 1130–1137. [DOI] [PMC free article] [PubMed] [Google Scholar]
- Hnisz D, Day DS, and Young RA (2016a). Insulated Neighborhoods: Structural and Functional Units of Mammalian Gene Control. Cell 167, 1188–1200. [DOI] [PMC free article] [PubMed] [Google Scholar]
- Hnisz D, Weintraub AS, Day DS, Valton AL, Bak RO, Li CH, Goldmann J, Lajoie BR, Fan ZP, Sigova AA, et al. (2016b). Activation of proto-oncogenes by disruption of chromosome neighborhoods. Science 351, 1454–1458. [DOI] [PMC free article] [PubMed] [Google Scholar]
- Huang X, McGann JC, Liu BY, Hannoush RN, Lill JR, Pham V, Newton K, Kakunda M, Liu J, Yu C, et al. (2013). Phosphorylation of Dishevelled by protein kinase RIPK4 regulates Wnt signaling. Science 339, 1441–1445. [DOI] [PMC free article] [PubMed] [Google Scholar]
- Isoda T, Moore AJ, He Z, Chandra V, Aida M, Denholtz M, Piet van Hamburg J, Fisch KM, Chang AN, Fahl SP, et al. (2017). Non-coding Transcription Instructs Chromatin Folding and Compartmentalization to Dictate Enhancer-Promoter Communication and T Cell Fate. Cell 171, 103–119. [DOI] [PMC free article] [PubMed] [Google Scholar]
- Kagey MH, Newman JJ, Bilodeau S, Zhan Y, Orlando DA, van Berkum NL, Ebmeier CC, Goossens J, Rahl PB, Levine SS, et al. (2010). Mediator and cohesin connect gene expression and chromatin architecture. Nature 467, 430–435. [DOI] [PMC free article] [PubMed] [Google Scholar]
- Kashiwagi S, Yashiro M, Takashima T, Aomatsu N, Kawajiri H, Ogawa Y, Onoda N, Ishikawa T, Wakasa K, and Hirakawa K (2013). c-Kit expression as a prognostic molecular marker in patients with basal-like breast cancer. Br J Surg 100, 490–496. [DOI] [PubMed] [Google Scholar]
- Katainen R, Dave K, Pitkanen E, Palin K, Kivioja T, Valimaki N, Gylfe AE, Ristolainen H, Hanninen UA, Cajuso T, et al. (2015). CTCF/cohesin-binding sites are frequently mutated in cancer. Nat Genet 47, 818–821. [DOI] [PubMed] [Google Scholar]
- Kieffer-Kwon KR, Nimura K, Rao SSP, Xu J, Jung S, Pekowska A, Dose M, Stevens E, Mathe E, Dong P, et al. (2017). Myc Regulates Chromatin Decompaction and Nuclear Architecture during B Cell Activation. Mol Cell 67, 566–578. [DOI] [PMC free article] [PubMed] [Google Scholar]
- Li G, Ruan X, Auerbach RK, Sandhu KS, Zheng M, Wang P, Poh HM, Goh Y, Lim J, Zhang J, et al. (2012). Extensive promoter-centered chromatin interactions provide a topological basis for transcription regulation. Cell 148, 84–98. [DOI] [PMC free article] [PubMed] [Google Scholar]
- Lin CY, Loven J, Rahl PB, Paranal RM, Burge CB, Bradner JE, Lee TI, and Young RA (2012). Transcriptional amplification in tumor cells with elevated c-Myc. Cell 151, 56–67. [DOI] [PMC free article] [PubMed] [Google Scholar]
- Luostari K, Hartikainen JM, Tengstrom M, Palvimo JJ, Kataja V, Mannermaa A, and Kosma VM (2014). Type II transmembrane serine protease gene variants associate with breast cancer. PLoS One 9, e102519. [DOI] [PMC free article] [PubMed] [Google Scholar]
- Mulligan P, Yang F, Di Stefano L, Ji JY, Ouyang J, Nishikawa JL, Toiber D, Kulkarni M, Wang Q, Najafi-Shoushtari SH, et al. (2011). A SIRT1-LSD1 corepressor complex regulates Notch target gene expression and development. Mol Cell 42, 689–699. [DOI] [PMC free article] [PubMed] [Google Scholar]
- Mumbach MR, Rubin AJ, Flynn RA, Dai C, Khavari PA, Greenleaf WJ, and Chang HY (2016). HiChIP: efficient and sensitive analysis of protein-directed genome architecture. Nat Methods 13, 919–922. [DOI] [PMC free article] [PubMed] [Google Scholar]
- Mumbach MR, Satpathy AT, Boyle EA, Dai C, Gowen BG, Cho SW, Nguyen ML, Rubin AJ, Granja JM, Kazane KR, et al. (2017). Enhancer connectome in primary human cells identifies target genes of disease-associated DNA elements. Nat Genet 49, 1602–1612. [DOI] [PMC free article] [PubMed] [Google Scholar]
- Naudin C, Chevalier C, and Roche S (2016). The role of small adaptor proteins in the control of oncogenic signalingr driven by tyrosine kinases in human cancer. Oncotarget 7, 11033–11055. [DOI] [PMC free article] [PubMed] [Google Scholar]
- Nora EP, Lajoie BR, Schulz EG, Giorgetti L, Okamoto I, Servant N, Piolot T, van Berkum NL, Meisig J, Sedat J, et al. (2012). Spatial partitioning of the regulatory landscape of the X-inactivation centre. Nature 485, 381–385. [DOI] [PMC free article] [PubMed] [Google Scholar]
- Oswald F, Tauber B, Dobner T, Bourteele S, Kostezka U, Adler G, Liptay S, and Schmid RM (2001). p300 acts as a transcriptional coactivator for mammalian Notch-1. Mol Cell Biol 21, 7761–7774. [DOI] [PMC free article] [PubMed] [Google Scholar]
- Phanstiel DH, Boyle AP, Heidari N, and Snyder MP (2015). Mango: a bias-correcting ChIA-PET analysis pipeline. Bioinformatics 31, 3092–3098. [DOI] [PMC free article] [PubMed] [Google Scholar]
- Rao SS, Huntley MH, Durand NC, Stamenova EK, Bochkov ID, Robinson JT, Sanborn AL, Machol I, Omer AD, Lander ES, et al. (2014). A 3D map of the human genome at kilobase resolution reveals principles of chromatin looping. Cell 159, 1665–1680. [DOI] [PMC free article] [PubMed] [Google Scholar]
- Ronchini C, and Capobianco AJ (2001). Induction of cyclin D1 transcription and CDK2 activity by Notch(ic): implication for cell cycle disruption in transformation by Notch(ic). Mol Cell Biol 21, 5925–5934. [DOI] [PMC free article] [PubMed] [Google Scholar]
- Rowley MJ, and Corces VG (2018). Organizational principles of 3D genome architecture. Nat Rev Genet 19, 789–800. [DOI] [PMC free article] [PubMed] [Google Scholar]
- Ryan RJH, Petrovic J, Rausch DM, Zhou Y, Lareau CA, Kluk MJ, Christie AL, Lee WY, Tarjan DR, Guo B, et al. (2017). A B Cell Regulome Links Notch to Downstream Oncogenic Pathways in Small B Cell Lymphomas. Cell Rep 21, 784–797. [DOI] [PMC free article] [PubMed] [Google Scholar]
- Schuijers J, Manteiga JC, Weintraub AS, Day DS, Zamudio AV, Hnisz D, Lee TI, and Young RA (2018). Transcriptional Dysregulation of MYC Reveals Common Enhancer-Docking Mechanism. Cell Rep 23, 349–360. [DOI] [PMC free article] [PubMed] [Google Scholar]
- Stoeck A, Lejnine S, Truong A, Pan L, Wang H, Zang C, Yuan J, Ware C, MacLean J, Garrett-Engele PW, et al. (2014). Discovery of biomarkers predictive of GSI response in triple-negative breast cancer and adenoid cystic carcinoma. Cancer Discov 4, 1154–1167. [DOI] [PMC free article] [PubMed] [Google Scholar]
- Wang H, Zang C, Taing L, Arnett KL, Wong YJ, Pear WS, Blacklow SC, Liu XS, and Aster JC (2014). NOTCH1-RBPJ complexes drive target gene expression through dynamic interactions with superenhancers. Proc Natl Acad Sci U S A 111, 705–710. [DOI] [PMC free article] [PubMed] [Google Scholar]
- Weintraub AS, Li CH, Zamudio AV, Sigova AA, Hannett NM, Day DS, Abraham BJ, Cohen MA, Nabet B, Buckley DL, et al. (2017). YY1 Is a Structural Regulator of Enhancer-Promoter Loops. Cell 171, 1573–1588. [DOI] [PMC free article] [PubMed] [Google Scholar]
- Xu S, Kong D, Chen Q, Ping Y, and Pang D (2017). Oncogenic long noncoding RNA landscape in breast cancer. Mol Cancer 16, 129. [DOI] [PMC free article] [PubMed] [Google Scholar]
- Yashiro-Ohtani Y, Wang H, Zang C, Arnett KL, Bailis W, Ho Y, Knoechel B, Lanauze C, Louis L, Forsyth KS, et al. (2014). Long-range enhancer activity determines Myc sensitivity to Notch inhibitors in T cell leukemia. Proc Natl Acad Sci U S A 111, E4946–4953. [DOI] [PMC free article] [PubMed] [Google Scholar]
Associated Data
This section collects any data citations, data availability statements, or supplementary materials included in this article.
Supplementary Materials
Table S2. Notch transcription complex ChIP-seq peaks. Related to Figure 1.
Table S3. Differential Gene Expression in TNBC cell lines. Related to Figure 3.
Table S4. Pathways associated with Notch-activated genes: specific in TNBC, in TNBC hyperconnected cliques, in Rec-1 hyperconnected cliques. Related to Figure 3, 4 and 6.
Table S5. Notch-sensitive H3K27ac ChIP-seq peak annotation. Related to Figure 3.
Table S6. Annotation of regulatory loop anchors. Related to Figure 4.
Table S7. 3D clique connectivity. Related to Figure 4.