

SUMMARY
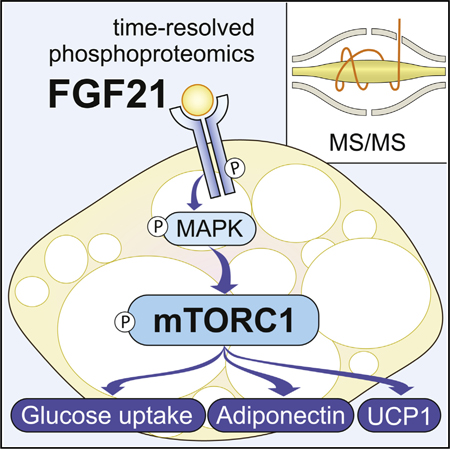
FGF21 improves the metabolic profile of obese animals through its actions on adipocytes. To elucidate the signaling network responsible for mediating these effects, we quantified dynamic changes in the adipocyte phosphoproteome following acute exposure to FGF21. FGF21 regulated a network of 821 phosphosites on 542 proteins. A major FGF21-regulated signaling node was mTORC1/S6K. In contrast to insulin, FGF21 activated mTORC1 via MAPK rather than through the canonical PI3K/AKT pathway. Activation of mTORC1/S6K by FGF21 was surprising because this is thought to contribute to deleterious metabolic effects such as obesity and insulin resistance. Rather, mTORC1 mediated many of the beneficial actions of FGF21 in vitro, including UCP1 and FGF21 induction, increased adiponectin secretion, and enhanced glucose uptake without any adverse effects on insulin action. This study provides a global view of FGF21 signaling and suggests that mTORC1 may act to facilitate FGF21-mediated health benefits in vivo.
Graphical Abstract
In Brief
FGF21 signaling in adipose stimulates weight loss and insulin sensitivity during obesity. Minard et al. examine the FGF21-regulated adipocyte phosphorylation network and identify mTORC1 as a key mediator of FGF21 actions, including browning, glucose uptake, and adiponectin secretion.
INTRODUCTION
Fibroblast growth factor 21 (FGF21) extends lifespan and exerts numerous health benefits, including improved insulin sensitivity and reduced adiposity and hepatic steatosis (Kharitonenkov et al., 2005, 2007; Zhang et al., 2012). FGF21 mediates its effects by stimulating fibroblast growth factor receptor (FGFR) 1/2 in complex with the coreceptor β-klotho (Ogawa et al., 2007). Knockout of FGFR1 or β-klotho in adipocytes, or knockout of β-klotho in CNS, prevents FGF21-mediated improvements in insulin sensitivity and reductions in adiposity (Adams et al., 2012; Bookout et al., 2013; Ding et al., 2012; Owen et al., 2014), while inhibition of β-klotho in the liver prevents FGF21-mediated reduction in hepatic steatosis (Gong et al., 2016). Antibody-mediated activation of FGFR1c-β-klotho, which activates FGF21 signaling in adipocytes without detectable effects in liver or CNS, recapitulates the beneficial metabolic actions of FGF21 (Kolumam et al., 2015). This suggests that FGF21 signaling in adipocytes is crucial for FGF21’s actions. In adipocytes, FGF21 stimulates browning, adiponectin secretion, and glucose uptake (Fisher et al., 2012; Holland et al., 2013; Lin et al., 2013), and these effects are thought to underpin the beneficial effects of FGF21.
Although much is known about FGF21 actions, there are major gaps in our understanding of the mechanisms underlying these effects. In particular, the intracellular signaling pathways that coordinate FGF21’s effects are unclear. Given that protein phosphorylation networks process hormonal inputs into metabolic responses (Humphrey et al., 2015b), we therefore sought to quantify the phosphoproteome of adipocytes acutely stimulated with FGF21 to provide a systems view of the signaling networks underlying the cellular response to this hormone.
RESULTS AND DISCUSSION
FGF21-Regulated Phosphorylation in Adipocytes
To map the FGF21 signaling network in adipocytes, 3T3-L1 adipocytes underwent stable isotope labeling by amino acids in cell culture (SILAC) (Ong et al., 2002). Triple SILAC-labeled cells were stimulated with FGF21 to generate a time series spanning 30 s to 30 min (Olsen et al., 2006). Phosphopeptides were enriched, and the phosphoproteome was analyzed by quantitative mass spectrometry (MS) in biological triplicates (Figure 1A). In total, we identified 15,687 phosphorylation sites on 4,583 distinct proteins, and 11,706 of these (median localization probability 0.994) were accurately localized to a single residue (Class 1 sites, localization probability ≥ 0.75) (Figure 1A). A previous study quantified 1,186 phosphosites and identified 130 sites regulated by FGF21 (Muise et al., 2013). Of the phosphorylation sites quantified across all time points (6,582 Class 1 sites) in our study, FGF21 significantly regulated 12.5% (821) by <0.67-fold or >1.5-fold (adjusted [adj.] p < 0.05) (Figure 1A), greatly expanding the known FGF21 signaling network in adipocytes. FGF21 signaling was initiated by tyrosine phosphorylation of FGFR1, closely followed by phosphorylation of ERK1 and 2 (Figure 1B). Following these events, the number of significantly FGF21-regulated phosphosites increased from just a few at 2 min to >550 after 5 min (Figure 1C).
Figure 1. Phosphoproteomic Analysis of FGF21 Reveals mTORC1 Is a Major Signaling Node.

(A) Experimental design of the FGF21 phosphoproteome. SILAC-labeled 3T3-L1 adipocytes were serum starved for 1.5 hr and treated with FGF21 over a time course. Proteins were extracted and digested with trypsin. Peptides were fractionated by SCX chromatography, and phosphopeptides were enriched using TiO2 chromatography. Phosphopeptide fractions were analyzed by MS. The number of phosphorylated proteins and phosphosites identified, quantified, and FGF21 regulated (adj. p < 0.05, fold change < 0.67 or fold change > 1.5) are shown.
(B) FGF21-mediated phosphorylation of FGFR1 (Y653, Y654) and MAPK1 (T183, Y185).
(C) Number of significantly regulated phosphosites at each time point (adj. p < 0.05, fold change < 0.67 or fold change > 1.5).
(D) Phosphorylation profile of the kinase activation site (blue) and substrates (yellow).
(E) Sequence logos for phosphorylation sites that were FGF21 regulated at 2 and 5 min.
(F) Mice were intraperitoneally injected with FGF21, and white adipose tissue was collected at indicated time points. Fat was immunoblotted for indicated proteins and stained for total protein by Sypro Ruby as a loading control. Immunoblots were quantified and normalized to total protein and average maximal response (n = 6, mean ± SEM, one-way ANOVA, *p < 0.01).
We next searched for kinases that propagate FGF21 signaling downstream of ERK. In response to FGF21, 56 kinases were phosphorylated, 13 of which were phosphorylated on known activation sites. To identify activated kinases, we applied clustering and directional analysis to the temporal profiles of kinase substrates in our phosphoproteomics data (Domanova et al., 2016; Yang et al., 2014). Kinases with enhanced activity in the FGF21-regulated phosphoproteome included ERK1/2, mTORC1, S6K, AKT, CHEK, PKA, and CDK2 (Figure S1).
mTORC1 and S6K Activation Are Prominent Features of FGF21 Signaling in Adipocytes
mTORC1 activates S6K, and these kinases are widely regarded as important regulators of metabolism (Dibble and Cantley, 2015). Our phosphoproteomics data suggest that mTORC1 and S6K are key nodes in FGF21 signaling. The mTORC1 substrate and activation site of S6K1 (S444/427) was the third most highly phosphorylated kinase activation site (4.5- and 2.6-fold change at 5 min) after ERK2 T183/Y185 (13.7- and 8.0-fold change at 5 min) and FGFR1 Y653/Y654 (9.2-fold change at 2 min). In addition, at the peak of mTORC1 and S6K activity (5–30 min), FGF21 signaling activity became markedly amplified, and there was an enrichment of substrates containing mTOR, ERK, and S6K minimal consensus motifs (Figures 1C–1E). To confirm activation of mTORC1/S6K by FGF21 in vivo, we injected mice with FGF21 and removed adipose tissue at different times. Phosphorylation of ERK at its activation site (T183/Y185) was increased at 5 min, and mTORC1/S6K activity was elevated after 30 min, as assessed by phosphorylation of the S6K substrate 40S ribosomal protein S6 (RPS6) (S235/S236) (Figure 1F). Another study reported that chronic FGF21 administration (10 days) in mice inhibits mTORC1 activity in the liver (Gong et al., 2016). This may therefore reflect the development of FGF21 resistance in the liver under these conditions or differential signaling in these cell types.
Intersection of FGF21 and Insulin Signaling Networks
mTORC1 and S6K are also central to insulin signaling. However, as part of this network, they have been found to form part of a negative feedback loop that triggers insulin resistance and increased adiposity (Copps and White, 2012; Hsu et al., 2011; Um et al., 2004; Yu et al., 2011). A comparison of the FGF21 and insulin phosphoproteomes (Humphrey et al., 2013) revealed that FGF21 signaling was in general slower than insulin but that 28% of FGF21-regulated phosphosites seen after 20 min of stimulation were also regulated by insulin after 20 min (Figure 2A), suggesting a convergence of later signaling events. Using a kinase perturbation analysis (KinasePA, http://rp-www.cs.usyd.edu.au/~yangpy/software/KinasePA.html) (Yang et al., 2016), we found that at these time points, insulin and FGF21 most strongly regulated the substrates of S6K, followed by ERK2, ERK1, RSK, and Akt (Figure 2B). However, Akt was more robustly activated by insulin, and when a manually curated subset of higher-confidence Akt substrates was used for this analysis, this difference was even greater (Figure 2B). These data suggest that in adipocytes, FGF21 and insulin share the mTORC1 and S6K network branches but may be differentiated by the robust early activation of Akt that occurs with insulin.
Figure 2. Comparison of MAPK, Akt, and mTORC1 Signaling in Response to FGF21 and Insulin.

(A) Comparison of FGF21 (23 nM) and insulin (100 nM) phosphoproteomes (Humphrey et al., 2013) after 30 and 20 min of stimulation, respectively. The Venn diagram indicates overlap of significantly regulated phosphorylation sites (adj. p < 0.05, fold change < 0.67 or fold change > 1.5).
(B) KinasePA. The x and y axes show calculated Stouffer’s statistics for FGF21- and insulin-stimulated kinase activation, respectively. The open circle (AKT) indicates a manually curated substrate list used for KinasePA analysis.
(C) 3T3-L1 adipocytes were serum starved and then treated with 0.5 nM insulin or 23 nM FGF21 for indicated times. Cell lysates were immunoblotted for the ERK activation site (ERK1 T183/Y185), Akt substrates (PRAS40 T246 and AS160 T642), and an indicator of mTORC1 activation (S6 S235/S236). Immunoblots were quantified and scaled (n = 3, mean ± SEM).
(D–F) 3T3-L1 adipocytes were serum starved for 1.5 hr, pretreated with 500 nM rapamycin for 30 min where indicated, and then treated with 10 nM insulin or 23 nM FGF21. (D) Glucose uptake was assessed by uptake of [3H]2DOG (n = 6 for FGF21, n = 9 for insulin, mean ± SEM, one-way ANOVA, *p < 0.01 versus basal). (E) Lipolysis was assessed via release of glycerol into culture media after stimulation with the indicated dose of isoproterenol. Data were normalized to the maximum basal value (n = 3, mean ± SEM, two-way ANOVA, *p < 0.01 versus respective basal at the same isoproterenol dose). (F) Protein synthesis was assessed by incorporation of [3H]leucine into protein. Data are normalized to the maximal value (n = 3, mean ± SEM, one-way ANOVA, *p < 0.01).
(G) 3T3-L1 adipocytes were serum starved, treated with Akt inhibitors (MK2206) or MAPK inhibitor (U0126) for 30 min, and then treated with 23 nM FGF21 for 30 min. Cell lysates were immunoblotted with indicated antibodies. Immunoblots were quantified and normalized to tubulin (loading control) and FGF21-treated cells. (n = 3, mean ± SEM, one-sample t test, *p < 0.01).
FGF21 Weakly Activates Akt but Robustly Activates MAPK
We next compared the effects of FGF21 on the Akt and mitogen-activated protein kinase (MAPK) pathways with a physiological dose of insulin (0.5 nM) (Winzell and Ahrén, 2004). FGF21 had a transient and minor effect on Akt signaling compared to the physiological dose of insulin, whereas its stimulation of the MAPK pathway was 11-fold more potent than that observed with insulin (Figure 2C). Hence, this shows that the effects of FGF21 on MAPK are highly specific, and under physiological conditions, insulin may have a relatively minor effect on MAPK signaling in adipocytes.
Next, we examined whether the modest activation of Akt by FGF21 was biologically relevant. In contrast to insulin (10 nM), acute FGF21 treatment had no significant effect on glucose uptake or lipolysis (Figures 2D and 2E), two Akt-dependent processes (Tan et al., 2015). In contrast, protein synthesis, which is largely an mTORC1-mediated process, was stimulated by both FGF21 and insulin, and this was blocked by the mTORC1 inhibitor rapamycin (Figure 2F). Collectively, these data indicate that FGF21 and insulin elicit distinct actions in adipocytes, partly because of differential signaling through Akt and MAPK.
FGF21 Activates mTORC1 via MAPK
The insulin receptor, like most tyrosine kinase receptors, activates mTORC1 through PI3K/Akt, whereas others, such as the epidermal growth factor (EGF) receptor, use the MAPK pathway (Carriere et al., 2011; Ma et al., 2005). To determine whether FGF21-stimulated mTORC1 activity was MAPK or Akt dependent, we incubated cells with specific inhibitors of either Akt (MK-2206) or MEK (U0126), the kinase immediately upstream of ERK (Figure 2G). Only the MEK inhibitor prevented FGF21-mediated RPS6 and S6K phosphorylation, demonstrating that mTORC1 activation by FGF21 is dependent on MAPK, and not Akt, activity (Figure 2G).
FGF21-Induced mTORC1 Activation Does Not Lead to Insulin Resistance
It has been suggested that hyperinsulinemia induces insulin resistance via negative feedback pathways involving phosphorylation of insulin receptor substrate (IRS) proteins (Shah and Hunter, 2006; Shah et al., 2004; Um et al., 2004). However, some studies have questioned the relevance of serine/threonine (Ser/Thr) IRS phosphorylation in mediating insulin resistance (Hoehn et al., 2008). FGF21 stimulated IRS1 and IRS2 phosphorylation on sites previously implicated in insulin resistance, including S302, S307, and S522, on IRS1 (Figure 3A) (Shah and Hunter, 2006). To determine whether this might induce insulin resistance, adipocytes were incubated with FGF21 (23 nM) for 16 hr. However, in contrast to chronic insulin treatment, which significantly impaired insulin-stimulated glucose uptake, chronic treatment with FGF21 had no significant impact on insulin action (Figure 3B). We also cotreated cells with FGF21 and insulin to investigate whether FGF21 could overcome the inhibitory effect of chronic insulin exposure. FGF21 did not improve insulin sensitivity in cells exposed to chronic insulin (Figure 3B). Rather FGF21 increased basal glucose uptake, likely due to increased GLUT1 expression (Palfreyman et al., 1992). These findings indicate that FGF21- mediated Ser/Thr IRS phosphorylation does not cause insulin resistance in adipocytes.
Figure 3. mTORC1 Mediates the Beneficial Actions of FGF21 in Adipocytes.

(A) FGF21-regulated phosphorylation sites are depicted on IRS1 and IRS2 (adj. p < 0.05, fold change > 1.5 at any time point). The y axis represents log2 FC after 30 min of FGF21 stimulation (n = 3, mean ± SEM).
(B) 3T3-L1 adipocytes were treated with 10 nM insulin, 23 nM FGF21, or both for 16 hr, serum starved for 2 hr, and then assayed for glucose uptake without (basal) or with (10 nM) insulin for 30 min (n = 5, mean ± SEM, two-way ANOVA, *p < 0.01 versus insulin-stimulated control). Bottom: insulin-sensitive glucose uptake (∆ insulin-basal) is shown. Data are normalized to control (n = 5, mean ± SEM, one-sample t test, *p < 0.01).
(C–F) 3T3-L1 adipocytes (C) or subcutaneous adipocytes differentiated in vitro (D–F) were treated for 16 hr with 23 nM FGF21, 10 nM insulin, 500 nM rapamycin (R), or 10 μM U0126 (U). (C) Cells were serum starved and glucose uptake was assessed using [3H]2DOG (n = 3). (D) Adiponectin secreted into cell culture media was detected by immunoblotting, and immunoblots were quantified and normalized to basal (n = 4). (E and F) FGF21 and UCP1 mRNAs were determined and normalized to basal (n = 8 for control and FGF21-treated cells, n = 5 for insulin-treated cells). Data presented are mean ± SEM. *p < 0.05 by two-way ANOVA versus FGF21-treated cells. #p < 0.01 one-way ANOVA versus untreated cells or for (D) one sample t test. NS, non-significant.
mTORC1 Mediates FGF21-Induced Glucose Uptake, Adiponectin Secretion, and UCP1 Expression
Next, we questioned whether mTORC1 may mediate the beneficial actions of FGF21. FGF21 is thought to induce weight loss and insulin sensitivity by stimulating glucose uptake, browning, and adiponectin secretion in adipocytes. To investigate whether these actions are mediated by mTORC1 and MAPK, we inhibited these kinases with rapamycin or U0126, respectively. Prolonged rapamycin treatment can also inhibit mTORC2. However, it is unlikely that this accounts for the effects of rapamycin on FGF21 action in adipocytes, because there was no significant increase in mTORC2 activity with FGF21, as demonstrated by measurement of Akt phosphorylation at the mTORC2 site S473 (Figure S2). Thus, rapamycin treatment likely reflects a selective effect on mTORC1.
Treatment of adipocytes with FGF21 for 16 hr increased glucose uptake by 3-fold, and this was blocked with either rapamycin or U0126 (Figure 3C). To assess browning and adiponectin secretion, we used primary adipocytes, which were differentiated from a stromal vascular fraction (SVF) isolated from mouse subcutaneous adipose tissue. Primary adipocytes incubated with FGF21 for 16 hr increased adiponectin secretion by 40%, and this was inhibited by rapamycin (Figure 3D), while inhibition by U0126 was variable. Next we measured UCP1 mRNA levels as an index of adipocyte browning. Both rapamycin and U0126 inhibited FGF21-induced UCP1 expression (Figure 3E). In the same cells, FGF21 also induced FGF21 gene expression, and this was rapamycin sensitive (Figure 3F). Incubation of adipocytes with U0126 increased FGF21 expression in the absence of FGF21 treatment. Collectively, these data demonstrate that activation of mTORC1 is required for the metabolically beneficial effects of FGF21, specifically glucose uptake, browning, and adiponectin secretion in adipocytes, and to stimulate an autocrine feedback loop through increased FGF21 expression. Consistent with our findings, several studies have found that mTORC1 mediates upregulation of UCP1 and adipocyte browning in response to either cold exposure or β-adrenergic agonists (Liu et al., 2016; Tran et al., 2016) and hyper-activation of mTORC1 in liver and muscle increases circulating FGF21 and weight loss (Cornu et al., 2014; Guridi et al., 2015).
This raises the question of whether other hormones that activate mTORC1 (Figure 2B), most notably insulin, could mimic the effects of FGF21 in adipocytes. Chronic incubation of adipocytes with insulin also induced UCP1 mRNA expression, but it did not significantly increase FGF21 mRNA expression (Figures 3E and 3F). These data suggest that stimuli aside from FGF21 that activate mTORC1 may also upregulate genes associated with adipocyte browning. We therefore predict that insulin and mTORC1 may upregulate FGF21 and UCP1 to restrain obesity. FGF21 actions may also be enhanced during obesity by high basal mTORC1 activity, and it would be of major interest for future studies to investigate whether mTORC1 mediates FGF21’s whole-body effects, such as weight loss and insulin sensitivity in vivo.
FGF21 Signaling Network
Here we performed an unbiased systems analysis of FGF21 signaling. Our data reveal that activation of the FGFR1/βKlotho complex triggers receptor tyrosine auto-phosphorylation, followed by activation of the MAPK pathway and subsequent mTORC1/S6K pathway activity (Figure 4). The mTORC1/S6K pathway leads to adiponectin secretion, glucose uptake, and UCP1 and FGF21 expression (Figures 3C–3F). Transcriptional regulation is key for these events; FGF21 upregulates not only UCP1 and FGF21 mRNA but also adiponectin and GLUT1 mRNA (Ge et al., 2011; Lin et al., 2013). In support of a major effect of FGF21 on transcription, many transcriptional regulators were phosphorylated in response to FGF21 in our phosphoproteomics data (Figure 4). These include CRTC2, a CREB coactivator that stimulates PGC1α transcription and mitochondrial biogenesis (Wu et al., 2006); MORC2a, which is required for differentiation of 3T3-L1 preadipocytes and for expression of genes involved in de novo lipogenesis (Sánchez-Solana et al., 2014); and NR3C1, a glucocorticoid receptor that regulates the expression of GLUT1 (Sakoda et al., 2000). These data are valuable resources for identifying key effectors of FGF21 action.
Figure 4. FGF21 Signaling Network in Adipocytes.

FGF21 binding to the FGFR1/βKlotho complex triggers receptor auto-phosphorylation and subsequent activation of the MAPK pathway and then the mTORC1/S6K pathway. The Akt pathway is only weakly stimulated in response to FGF21. The mTORC1/S6K pathway next stimulates adiponectin secretion, glucose uptake, and UCP1 and FGF21 expression. Regulation of transcription is key for these events. FGF21 signals to many transcription factors.
Our findings that mTORC1 is involved in metabolic processes that are implicated in reversing insulin resistance during FGF21 treatment contrast with its proposed role in hyperinsulinemia. By comparing our data with previous phosphoproteomics studies performed in different metabolic tissues and contexts, it is becoming increasingly clear that cells recruit only a specific subset of kinases that integrate and process signals by hormones or stimuli to determine distinct metabolic outputs (Hoffman et al., 2015; Humphrey et al., 2015a; Lundby et al., 2013). Our data demonstrate the importance of systems-wide analysis of signaling networks in determining how cells process inputs to determine biological outcomes. These data provide insights into the mechanism of FGF21 actions and have implications for treatments designed to improve metabolic disorders, including the use of rapamycin as a health-promoting agent.
EXPERIMENTAL PROCEDURES
For complete details, see the Supplemental Experimental Procedures.
Animals
Mice were fed a standard lab chow diet and group-housed on a 12 hr light/dark cycle with free access to food and water. At 12 weeks of age, mice were injected intraperitoneally with either FGF21 (10 mg/kg) or saline as vehicle control. Mouse experiments were approved by The University of Sydney Animal Ethics Committee.
FGF21 Phosphoproteomics Analysis
3T3-L1 adipocytes underwent SILAC, were serum starved, and were treated with 23 nM FGF21 for 30 s, 2 min, 5 min, and 30 min. Peptides were digested with trypsin (Promega), fractionated by strong cation exchange (SCX), and enriched for phosphopeptides by TiO2. Labeled peptides were analyzed by MS, and raw files were processed in MaxQuant.
Cell Assays
Preadipocytes from the SVF were isolated from white subcutaneous fat tissue from 8- to 10-week-old C57BL/6 mice (Sugii et al., 2011). To assess 2-deoxyglucose (2DOG) uptake, cells were incubated in glucose-free Krebs Ringer buffer (KRP), stimulated with 10 nM insulin for 15 min, exposed to 0.25 mCi/L [3H]-labeled 2-deoxyglucose ([3H]2DOG) (PerkinElmer) in 50 μM unlabeled 2DOG for 5 min, and radioactivity assessed in cell lysates. To assess lipolysis, cells were incubated in KRP supplemented with 3.5% free fatty acid BSA (Sigma-Aldrich). Cells were treated with or without isoproterenol, insulin, or FGF21 for 1 hr as indicated. Aliquots of media were assayed for glycerol content using Sigma glycerol reagent. To assess protein synthesis, adipocytes were incubated in leucine-free DMEM (Sigma-Aldrich) supplemented with [3H]-labeled leucine ([3H]leucine) (5 μCi/mL) (PerkinElmer) and FGF21 or insulin for 1 hr. Protein was precipitated from cell homogenates with 10% trichloroacetic acid (TCA) and radioactivity assessed in TCA-insoluble fractions of cell homogenates. All measurements were normalized to protein concentrations.
Statistical Analysis
The t tests or ANOVAs were performed, as indicated, in GraphPad Prism v.6.01 for Windows. Statistical analysis of proteomics data is described in detail in the Supplemental Experimental Procedures.
Supplementary Material
Highlights.
FGF21 regulates 821 phosphosites on 542 proteins in adipocytes
FGF21 activates mTORC1 and S6K independently of AKT via MAPK
FGF21-induced mTORC1 activation was not associated with insulin resistance
Rapamycin inhibits FGF21-induced UCP1, glucose uptake, and adiponectin secretion
ACKNOWLEDGMENTS
We thank Birgitte Andersen from Novo Nordisk for providing FGF21, Paul Cohen and Bruce Spiegleman for advice on culturing subcutaneous adipocytes, Aimin Xu for providing reagents, Yvonne Ng for assistance with experiments on subcutaneous adipocytes, and Kristen Thomas for help with mouse experiments. This study was supported by National Health and Medical Research Council (NHMRC) project grants GNT1047067 and GNT1061122 to D.E.J. and GNT1068469 to J.S. The contents of the published material are solely the responsibility of the individual authors and do not reflect the view of NHMRC. D.E.J. is an NHMRC senior principal research fellow, B.L.P. is an NHMRC early career fellow, and A.Y.M. is supported by an Australian Post- graduate Award scholarship.
Footnotes
ACCESSION NUMBERS
The accession number for the raw and processed data reported in this paper is proteomeXchange: PXD003631.
SUPPLEMENTAL INFORMATION
Supplemental information includes Supplemental Experimental Procedures, two figures, and two tables, and can be found with this article online at http://dx.doi.org/10.1016/j.celrep.2016.08.086.
REFERENCES
- Adams AC, Yang C, Coskun T, Cheng CC, Gimeno RE, Luo Y, and Kharitonenkov A (2012). The breadth of FGF21’s metabolic actions are governed by FGFR1 in adipose tissue. Mol. Metab 2, 31–37. [DOI] [PMC free article] [PubMed] [Google Scholar]
- Bookout AL, de Groot MH, Owen BM, Lee S, Gautron L, Lawrence HL, Ding X, Elmquist JK, Takahashi JS, Mangelsdorf DJ, and Kliewer SA (2013). FGF21 regulates metabolism and circadian behavior by acting on the nervous system. Nat. Med 19, 1147–1152. [DOI] [PMC free article] [PubMed] [Google Scholar]
- Carriere A, Romeo Y, Acosta-Jaquez HA, Moreau J, Bonneil E, Thibault P, Fingar DC, and Roux PP (2011). ERK1/2 phosphorylate Raptor to promote Ras-dependent activation of mTOR complex 1 (mTORC1). J. Biol. Chem 286, 567–577. [DOI] [PMC free article] [PubMed] [Google Scholar]
- Copps KD, and White MF (2012). Regulation of insulin sensitivity by serine/threonine phosphorylation of insulin receptor substrate proteins IRS1 and IRS2. Diabetologia 55, 2565–2582. [DOI] [PMC free article] [PubMed] [Google Scholar]
- Cornu M, Oppliger W, Albert V, Robitaille AM, Trapani F, Quagliata L, Fuhrer T, Sauer U, Terracciano L, and Hall MN (2014). Hepatic mTORC1 controls locomotor activity, body temperature, and lipid metabolism through FGF21. Proc. Natl. Acad. Sci. USA 111, 11592–11599. [DOI] [PMC free article] [PubMed] [Google Scholar]
- Dibble CC, and Cantley LC (2015). Regulation of mTORC1 by PI3K signaling. Trends Cell Biol 25, 545–555. [DOI] [PMC free article] [PubMed] [Google Scholar]
- Ding X, Boney-Montoya J, Owen BM, Bookout AL, Coate KC, Mangelsdorf DJ, and Kliewer SA (2012). bKlotho is required for fibroblast growth factor 21 effects on growth and metabolism. Cell Metab 16, 387–393. [DOI] [PMC free article] [PubMed] [Google Scholar]
- Domanova W, Krycer J, Chaudhuri R, Yang P, Vafaee F, Fazakerley D, Humphrey S, James D, and Kuncic Z (2016). Unraveling kinase activation dynamics using kinase-substrate relationships from temporal large-scale phosphoproteomics studies. PLoS ONE 11, e0157763. [DOI] [PMC free article] [PubMed] [Google Scholar]
- Fisher FM, Kleiner S, Douris N, Fox EC, Mepani RJ, Verdeguer F, Wu J, Kharitonenkov A, Flier JS, Maratos-Flier E, and Spiegelman BM (2012). FGF21 regulates PGC-1a and browning of white adipose tissues in adaptive thermogenesis. Genes Dev 26, 271–281. [DOI] [PMC free article] [PubMed] [Google Scholar]
- Ge X, Chen C, Hui X, Wang Y, Lam KS, and Xu A (2011). Fibroblast growth factor 21 induces glucose transporter-1 expression through activation of the serum response factor/Ets-like protein-1 in adipocytes. J. Biol. Chem 286, 34533–34541. [DOI] [PMC free article] [PubMed] [Google Scholar]
- Gong Q, Hu Z, Zhang F, Cui A, Chen X, Jiang H, Gao J, Chen X, Han Y, Liang Q, et al. (2016). Fibroblast growth factor 21 improves hepatic insulin sensitivity by inhibiting mammalian target of rapamycin complex 1 in mice. Hepatology 64, 425–438. [DOI] [PMC free article] [PubMed] [Google Scholar]
- Guridi M, Tintignac LA, Lin S, Kupr B, Castets P, and Rüegg MA (2015). Activation of mTORC1 in skeletal muscle regulates whole-body metabolism through FGF21. Sci. Signal 8, ra113. [DOI] [PubMed] [Google Scholar]
- Hoehn KL, Hohnen-Behrens C, Cederberg A, Wu LE, Turner N, Yuasa T, Ebina Y, and James DE (2008). IRS1-independent defects define major nodes of insulin resistance. Cell Metab 7, 421–433. [DOI] [PMC free article] [PubMed] [Google Scholar]
- Hoffman NJ, Parker BL, Chaudhuri R, Fisher-Wellman KH, Kleinert M, Humphrey SJ, Yang P, Holliday M, Trefely S, Fazakerley DJ, et al. (2015). Global phosphoproteomic analysis of human skeletal muscle reveals a network of exercise-regulated kinases and AMPK substrates. Cell Metab 22, 922–935. [DOI] [PMC free article] [PubMed] [Google Scholar]
- Holland WL, Adams AC, Brozinick JT, Bui HH, Miyauchi Y, Kusminski CM, Bauer SM, Wade M, Singhal E, Cheng CC, et al. (2013). An FGF21- adiponectin-ceramide axis controls energy expenditure and insulin action in mice. Cell Metab 17, 790–797. [DOI] [PMC free article] [PubMed] [Google Scholar]
- Hsu PP, Kang SA, Rameseder J, Zhang Y, Ottina KA, Lim D, Peterson TR, Choi Y, Gray NS, Yaffe MB, et al. (2011). The mTOR-regulated phosphoproteome reveals a mechanism of mTORC1-mediated inhibition of growth factor signaling. Science 332, 1317–1322. [DOI] [PMC free article] [PubMed] [Google Scholar]
- Humphrey SJ, Yang G, Yang P, Fazakerley DJ, Stöckli J, Yang JY, and James DE (2013). Dynamic adipocyte phosphoproteome reveals that Akt directly regulates mTORC2. Cell Metab 17, 1009–1020. [DOI] [PMC free article] [PubMed] [Google Scholar]
- Humphrey SJ, Azimifar SB, and Mann M (2015a). High-throughput phosphoproteomics reveals in vivo insulin signaling dynamics. Nat. Biotechnol 33, 990–995. [DOI] [PubMed] [Google Scholar]
- Humphrey SJ, James DE, and Mann M (2015b). Protein phosphorylation: a major switch mechanism for metabolic regulation. Trends Endocrinol. Metab 26, 676–687. [DOI] [PubMed] [Google Scholar]
- Kharitonenkov A, Shiyanova TL, Koester A, Ford AM, Micanovic R, Galbreath EJ, Sandusky GE, Hammond LJ, Moyers JS, Owens RA, et al. (2005). FGF-21 as a novel metabolic regulator. J. Clin. Invest 115, 1627–1635. [DOI] [PMC free article] [PubMed] [Google Scholar]
- Kharitonenkov A, Wroblewski VJ, Koester A, Chen YF, Clutinger CK, Tigno XT, Hansen BC, Shanafelt AB, and Etgen GJ (2007). The metabolic state of diabetic monkeys is regulated by fibroblast growth factor-21. Endocrinology 148, 774–781. [DOI] [PubMed] [Google Scholar]
- Kolumam G, Chen MZ, Tong R, Zavala-Solorio J, Kates L, van Bruggen N, Ross J, Wyatt SK, Gandham VD, Carano RA, et al. (2015). Sustained brown fat stimulation and insulin sensitization by a humanized bispecific antibody agonist for fibroblast growth factor receptor 1/bKlotho complex. EBioMedicine 2, 730–743. [DOI] [PMC free article] [PubMed] [Google Scholar]
- Lin Z, Tian H, Lam KS, Lin S, Hoo RC, Konishi M, Itoh N, Wang Y, Bornstein SR, Xu A, and Li X (2013). Adiponectin mediates the metabolic effects of FGF21 on glucose homeostasis and insulin sensitivity in mice. Cell Metab 17, 779–789. [DOI] [PubMed] [Google Scholar]
- Liu D, Bordicchia M, Zhang C, Fang H, Wei W, Li JL, Guilherme A, Guntur K, Czech MP, and Collins S (2016). Activation of mTORC1 is essential for β-adrenergic stimulation of adipose browning. J. Clin. Invest 126, 1704–1716. [DOI] [PMC free article] [PubMed] [Google Scholar]
- Lundby A, Andersen MN, Steffensen AB, Horn H, Kelstrup CD, Francavilla C, Jensen LJ, Schmitt N, Thomsen MB, and Olsen JV (2013). In vivo phosphoproteomics analysis reveals the cardiac targets of β-adrenergic receptor signaling. Sci. Signal 6, rs11. [DOI] [PubMed] [Google Scholar]
- Ma L, Chen Z, Erdjument-Bromage H, Tempst P, and Pandolfi PP (2005). Phosphorylation and functional inactivation of TSC2 by Erk implications for tuberous sclerosis and cancer pathogenesis. Cell 121, 179–193. [DOI] [PubMed] [Google Scholar]
- Muise ES, Souza S, Chi A, Tan Y, Zhao X, Liu F, Dallas-Yang Q, Wu M, Sarr T, Zhu L, et al. (2013). Downstream signaling pathways in mouse adipose tissues following acute in vivo administration of fibroblast growth fac- tor 21. PLoS ONE 8, e73011. [DOI] [PMC free article] [PubMed] [Google Scholar]
- Ogawa Y, Kurosu H, Yamamoto M, Nandi A, Rosenblatt KP, Goetz R, Eliseenkova AV, Mohammadi M, and Kuro-o M (2007). BetaKlotho is required for metabolic activity of fibroblast growth factor 21. Proc. Natl. Acad. Sci. USA 104, 7432–7437. [DOI] [PMC free article] [PubMed] [Google Scholar]
- Olsen JV, Blagoev B, Gnad F, Macek B, Kumar C, Mortensen P, and Mann M (2006). Global, in vivo, and site-specific phosphorylation dynamics in signaling networks. Cell 127, 635–648. [DOI] [PubMed] [Google Scholar]
- Ong SE, Blagoev B, Kratchmarova I, Kristensen DB, Steen H, Pandey A, and Mann M (2002). Stable isotope labeling by amino acids in cell culture, SILAC, as a simple and accurate approach to expression proteomics. Mol. Cell. Proteomics 1, 376–386. [DOI] [PubMed] [Google Scholar]
- Owen BM, Ding X, Morgan DA, Coate KC, Bookout AL, Rahmouni K, Kliewer SA, and Mangelsdorf DJ (2014). FGF21 acts centrally to induce sympathetic nerve activity, energy expenditure, and weight loss. Cell Metab 20, 670–677. [DOI] [PMC free article] [PubMed] [Google Scholar]
- Palfreyman RW, Clark AE, Denton RM, Holman GD, and Kozka IJ (1992). Kinetic resolution of the separate GLUT1 and GLUT4 glucose transport activities in 3T3-L1 cells. Biochem. J 284, 275–282. [DOI] [PMC free article] [PubMed] [Google Scholar]
- Sakoda H, Ogihara T, Anai M, Funaki M, Inukai K, Katagiri H, Fukushima Y, Onishi Y, Ono H, Fujishiro M, et al. (2000). Dexamethasone-induced insulin resistance in 3T3-L1 adipocytes is due to inhibition of glucose transport rather than insulin signal transduction. Diabetes 49, 1700–1708. [DOI] [PubMed] [Google Scholar]
- Sánchez-Solana B, Li DQ, and Kumar R (2014). Cytosolic functions of MORC2 in lipogenesis and adipogenesis. Biochim. Biophys. Acta 1843, 316–326. [DOI] [PMC free article] [PubMed] [Google Scholar]
- Shah OJ, and Hunter T (2006). Turnover of the active fraction of IRS1 involves raptor-mTOR- and S6K1-dependent serine phosphorylation in cell culture models of tuberous sclerosis. Mol. Cell. Biol 26, 6425–6434. [DOI] [PMC free article] [PubMed] [Google Scholar]
- Shah OJ, Wang Z, and Hunter T (2004). Inappropriate activation of the TSC/Rheb/mTOR/S6K cassette induces IRS1/2 depletion, insulin resistance, and cell survival deficiencies. Curr. Biol 14, 1650–1656. [DOI] [PubMed] [Google Scholar]
- Sugii S, Kida Y, Berggren WT, and Evans RM (2011). Feeder-dependent and feeder-independent iPS cell derivation from human and mouse adipose stem cells. Nat. Protoc 6, 346–358. [DOI] [PMC free article] [PubMed] [Google Scholar]
- Tan SX, Fisher-Wellman KH, Fazakerley DJ, Ng Y, Pant H, Li J, Meoli CC, Coster AC, Stöckli J, and James DE (2015). Selective insulin resistance in adipocytes. J. Biol. Chem 290, 11337–11348. [DOI] [PMC free article] [PubMed] [Google Scholar]
- Tran CM, Mukherjee S, Ye L, Frederick DW, Kissig M, Davis JG, Lamming DW, Seale P, and Baur JA (2016). Rapamycin blocks induction of the thermogenic program in white adipose tissue. Diabetes 65, 927–941. [DOI] [PMC free article] [PubMed] [Google Scholar]
- Um SH, Frigerio F, Watanabe M, Picard F, Joaquin M, Sticker M, Fumagalli S, Allegrini PR, Kozma SC, Auwerx J, and Thomas G (2004). Absence of S6K1 protects against age- and diet-induced obesity while enhancing insulin sensitivity. Nature 431, 200–205. [DOI] [PubMed] [Google Scholar]
- Winzell MS, and Ahrén B (2004). The high-fat diet-fed mouse: a model for studying mechanisms and treatment of impaired glucose tolerance and type 2 diabetes. Diabetes 53 (Suppl 3), S215–S219. [DOI] [PubMed] [Google Scholar]
- Wu Z, Huang X, Feng Y, Handschin C, Feng Y, Gullicksen PS, Bare O, Labow M, Spiegelman B, and Stevenson SC (2006). Transducer of regulated CREB-binding proteins (TORCs) induce PGC-1alpha transcription and mitochondrial biogenesis in muscle cells. Proc. Natl. Acad. Sci. USA 103, 14379–14384. [DOI] [PMC free article] [PubMed] [Google Scholar]
- Yang P, Patrick E, Tan SX, Fazakerley DJ, Burchfield J, Gribben C, Prior MJ, James DE, and Hwa Yang Y (2014). Direction pathway analysis of large-scale proteomics data reveals novel features of the insulin action pathway. Bioinformatics 30, 808–814. [DOI] [PMC free article] [PubMed] [Google Scholar]
- Yang P, Patrick E, Humphrey SJ, Ghazanfar S, James DE, Jothi R, and Yang JY (2016). KinasePA: Phosphoproteomics data annotation using hypothesis driven kinase perturbation analysis. Proteomics 16, 1868–1871. [DOI] [PMC free article] [PubMed] [Google Scholar]
- Yu Y, Yoon SO, Poulogiannis G, Yang Q, Ma XM, Villén J, Kubica N, Hoffman GR, Cantley LC, Gygi SP, and Blenis J (2011). Phosphoproteomic analysis identifies Grb10 as an mTORC1 substrate that negatively regulates insulin signaling. Science 332, 1322–1326. [DOI] [PMC free article] [PubMed] [Google Scholar]
- Zhang Y, Xie Y, Berglund ED, Coate KC, He TT, Katafuchi T, Xiao G, Potthoff MJ, Wei W, Wan Y, et al. (2012). The starvation hormone, fibroblast growth factor-21, extends lifespan in mice. eLife 1, e00065. [DOI] [PMC free article] [PubMed] [Google Scholar]
Associated Data
This section collects any data citations, data availability statements, or supplementary materials included in this article.