

Abstract
Background
Vitamin D deficiency is often reported in people with chronic liver diseases. Therefore, improving vitamin D status could have a beneficial effect on people with chronic liver diseases.
Objectives
To assess the beneficial and harmful effects of vitamin D supplementation in people with chronic liver diseases.
Search methods
We searched The Cochrane Hepato‐Biliary Group Controlled Trials Register, Cochrane Central Register of Controlled Trials (CENTRAL), MEDLINE, Embase, Science Citation Index Expanded, and Conference Proceedings Citation Index ‐ Science. We also searched databases of ongoing trials and the World Health Organization International Clinical Trials Registry Platform. We scanned bibliographies of relevant publications and asked experts and pharmaceutical companies for additional trials. All searches were up to January 2017.
Selection criteria
Randomised clinical trials that compared vitamin D at any dose, duration, and route of administration versus placebo or no intervention in adults with chronic liver diseases. Vitamin D could have been administered as supplemental vitamin D (vitamin D3 (cholecalciferol) or vitamin D2 (ergocalciferol)), or an active form of vitamin D (1α‐hydroxyvitamin D (alfacalcidol), 25‐hydroxyvitamin D (calcidiol), or 1,25‐dihydroxyvitamin D (calcitriol)).
Data collection and analysis
We used standard methodological procedures expected by The Cochrane Collaboration. We contacted authors of the trials to ask for missing information. We conducted random‐effects and fixed‐effect meta‐analyses. For dichotomous outcomes, we calculated risk ratios (RRs), and for continuous outcomes, we calculated mean differences (MD), both with 95% confidence intervals (CI) and Trial Sequential Analyses‐adjusted CIs. We calculated Peto odds ratio (OR) for rare events. We considered risk of bias in domains to assess the risk of systematic errors. We conducted Trial Sequential Analyses to control the risk of random errors. We assessed the quality of the evidence with GRADE.
Main results
We included 15 randomised clinical trials with 1034 participants randomised. All trials had a parallel group design. Nine trials were conducted in high‐income countries and six trials in middle‐income countries. All trials were at high risk of bias. Six trials included participants with chronic hepatitis C, four trials included participants with liver cirrhosis, four trials included participants with non‐alcoholic fatty liver disease, and one trial included liver transplant recipients. All included trials reported the baseline vitamin D status of participants. Participants in six trials had baseline 25‐hydroxyvitamin D levels at or above vitamin D adequacy (20 ng/mL), while participants in the remaining nine trials were vitamin D insufficient (less than 20 ng/mL). All trials administered vitamin D orally. Mean duration of vitamin D supplementation was 0.5 years and follow‐up was 0.6 years. Eleven trials (831 participants; 40% women; mean age 52 years) tested vitamin D3, one trial (18 men; mean age 61 years) with three intervention groups tested vitamin D2 and 25‐dihydroxyvitamin D in separate groups, and three trials (185 participants; 55% women; mean age 55 years) tested 1,25‐dihydroxyvitamin D. Seven trials used placebo, and eight trials used no intervention in the control group.
The effect of vitamin D on all‐cause mortality at the end of follow‐up is uncertain because the results were imprecise (Peto OR 0.70, 95% CI 0.09 to 5.38; I2 = 32%; 15 trials; 1034 participants; very low quality evidence). Trial Sequential Analysis on all‐cause mortality was performed based on a mortality rate in the control group of 10%, a relative risk reduction of 28% in the experimental intervention group, a type I error of 2.5%, and type II error of 10% (90% power). There was no diversity. The required information size was 6396 participants. The cumulative Z‐curve did not cross the trial sequential monitoring boundary for benefit or harm after the 15th trial, and the Trial Sequential Analyses‐adjusted CI was 0.00 to 2534.
The effect of vitamin D on liver‐related mortality (RR 1.62, 95% CI 0.08 to 34.66; 1 trial; 18 participants) and on serious adverse events such as hypercalcaemia (RR 5.00, 95% CI 0.25 to 100.8; 1 trial; 76 participants), myocardial infarction (RR 0.75, 95% CI 0.08 to 6.81; 2 trials; 86 participants), and thyroiditis (RR 0.33 95% CI 0.01 to 7.91; 1 trial; 68 participants) is uncertain because the results were imprecise. The evidence on all these outcomes is of very low quality. The effect of vitamin D3 on non‐serious adverse events such as glossitis (RR 3.70, 95% CI 0.16 to 87.6; 1 trial; 65 participants; very low quality of evidence) is uncertain because the result was imprecise.
Due to few data, we did not conduct Trial Sequential Analysis on liver‐related mortality, and serious and non‐serious adverse events.
We found no data on liver‐related morbidity and health‐related quality of life in the randomised trials included in this review.
Authors' conclusions
We are uncertain as to whether vitamin D supplements in the form of vitamin D3, vitamin D2, 1,25‐dihydroxyvitamin D, or 25‐dihydroxyvitamin D have important effect on all‐cause mortality, liver‐related mortality, or on serious or non‐serious adverse events because the results were imprecise. There is no evidence on the effect of vitamin D supplementation on liver‐related morbidity and health‐related quality of life. Our conclusions are based on few trials with an insufficient number of participants and on lack of data on clinically important outcomes. In addition, the analysed trials are at high risk of bias with significant intertrial heterogeneity. The overall quality of evidence is very low.
Plain language summary
Vitamin D supplementation for chronic liver diseases
Review question
Is vitamin D supplementation beneficial or harmful for people with chronic liver diseases?
Background
The available evidence on vitamin D and chronic liver diseases is inconclusive. Many observational studies (a study of a group of people where the researcher has no control of treatments and conditions because of ethical concerns or logistical constraints) suggest that chronic liver diseases are associated with low vitamin D levels in the blood. Therefore, improving vitamin D levels could have beneficial effects on chronic liver diseases. Results of randomised clinical trials (trials where people are randomly assigned into one of two or more treatment groups) testing the effect of vitamin D supplementation for chronic liver diseases are contradictory. The aim of this systematic review (a summary of results of available healthcare trials) was to analyse the benefits and harms of the different forms of vitamin D in people with chronic liver diseases.
Study characteristics
Fifteen trials provided data for this review; 1034 adult participants were randomly assigned to vitamin D compared with placebo or no treatment. Nine trials were conducted in high‐income countries, and six trials in middle‐income countries. All trials were at high risk of bias (that is overestimation of benefits and underestimation of harms). The age range of the participants was 18 years to 84 years and on average 42% were women. Six trials included participants with chronic hepatitis C, four trials included participants with liver cirrhosis, four trials included participants with non‐alcoholic fatty liver disease, and one trial included liver transplant recipients. Most of included trials reported the baseline vitamin D status of participants. Vitamin D administration lasted on average six months and most trials used the cholecalciferol (vitamin D3) form.
Funding
Six trials appeared to be free of industry sponsorship or other type of for‐profit support that may bias the results of the trials. Eight trials may not have been free of for‐profit bias as they did not provide any information on clinical trial support or sponsorship. One trial was funded by industry.
Key results
This review suggests that vitamin D has no beneficial or harmful effects on chronic liver diseases. However, there were too few trials on the individual diagnosis of chronic liver diseases and there were too few participants in the individual trials as well as in our meta‐analysis. Therefore, neither benefits nor harms can be excluded.
Quality of the evidence
All trials were judged to be at high risk of bias (that is, possibly an overestimation of benefits and underestimation of harms).
Currentness of evidence
This evidence is up to date as of January 2017.
Summary of findings
Summary of findings for the main comparison. Vitamin D compared to placebo or no intervention for chronic liver diseases in adults.
| Vitamin D compared to placebo or no intervention for chronic liver diseases in adults | ||||||
| Patient or population: adults with chronic liver diseases. Setting: inpatients and outpatients from Austria, China, Egypt, Iran, Israel, Italy, Japan, USA. Intervention: vitamin D Comparison: placebo or no intervention | ||||||
| Outcomes | Anticipated absolute effects* (95% CI) | Relative effect (95% CI) | № of participants (trials) | Quality of the evidence (GRADE) | Comments | |
| Risk with placebo or no intervention | Risk with vitamin D | |||||
| All‐cause mortality at the end of follow‐up Follow‐up: 0.1 to 1.4, mean 0.6 years |
Study population | OR 0.70 (0.09 to 5.38) | 1034 (15 RCTs) | ⊕⊝⊝⊝ Very low1,2,3 | Trial Sequential Analyses‐adjusted CI was 0.00 to 2534. | |
| 4 per 1.000 | 3 per 1.000 (0 to 21) | |||||
| Liver‐related mortality Follow‐up: mean 1 year |
Study population | RR 1.62 (0.08 to 34.66) | 18 (1 RCT) | ⊕⊝⊝⊝ Very low1,3 | Due to few data, we did not conduct Trial Sequential Analysis which would only have revealed larger imprecision. | |
| 0 per 1.000 | 0 per 1.000 (0 to 0) | |||||
| Serious adverse events ‐ hypercalcaemia Follow‐up: mean 1 year |
Study population | RR 5.00 (0.25 to 100.80) | 76 (1 RCT) | ⊕⊝⊝⊝ Very low1,3 | Due to few data, we did not conduct Trial Sequential Analysis which would only have revealed larger imprecision. | |
| 0 per 1.000 | 0 per 1.000 (0 to 0) | |||||
| Serious adverse events ‐ myocardial infarction Follow‐up: 0.2 to 1, mean 0.6 years |
Study population | RR 0.75 (0.08 to 6.81) | 86 (2 RCTs) | ⊕⊝⊝⊝ Very low1,3 | Due to few data, we did not conduct Trial Sequential Analysis which would only have revealed larger imprecision. | |
| 25 per 1.000 | 19 per 1.000 (2 to 170) | |||||
| Serious adverse events ‐ thyroiditis Follow‐up: mean 0.2 years |
Study population | RR 0.33 (0.01 to 7.91) | 68 (1 RCT) | ⊕⊝⊝⊝ Very low1,3 | Due to few data, we did not conduct Trial Sequential Analysis which would only have revealed larger imprecision. | |
| 29 per 1.000 | 10 per 1.000 (0 to 233) | |||||
| Failure of sustained virological response Follow‐up: 0.3 to 1.4, mean 0.9 years |
Study population | RR 0.59 (0.28 to 1.21) | 422 (5 RCTs) | ⊕⊝⊝⊝ Very low 1,2,3,6 |
The trial sequential monitoring boundary is ignored due to little information use (0.6%). | |
| 465 per 1.000 | 275 per 1.000 (130 to 563) | |||||
| Acute cellular rejection in liver transplant recipients Follow‐up: mean 0.08 years |
Study population | RR 0.33 (0.04 to 2.62) | 75 (1 RCT) | ⊕⊝⊝⊝ Very low 1,3,7 |
The trial sequential monitoring boundary is ignored due to little information use (0.84%). | |
| 120 per 1.000 | 40 per 1.000 (5 to 314) | |||||
| *The risk in the intervention group (and its 95% confidence interval) is based on the assumed risk in the comparison group and the relative effect of the intervention (and its 95% CI). CI: Confidence interval; RR: Risk ratio; RCT: randomised clinical trial; OR: Odds ratio. | ||||||
GRADE Working Group grades of evidence
| ||||||
1 Downgraded one level due to risk of bias: all trials were at high risk of bias. 2 Downgraded one level due to inconsistency of evidence: intertrial heterogeneity was significant. 3 Downgraded one level due to imprecision of evidence: Trial Sequential Analysis of vitamin D trials shows that we had insufficient information. 4 Downgraded one level due to indirectness of evidence: rapid virological response is a surrogate outcome. 5 Downgraded one level due to indirectness of evidence: early virological response is a surrogate outcome. 6 Downgraded one level due to indirectness of evidence: sustained virological response is a surrogate outcome. 7 Downgraded one level due to indirectness of evidence: acute cellular rejection is a surrogate outcome.
Background
Vitamin D is either synthesised in the skin (vitamin D3 (cholecalciferol)) or is obtained from dietary sources (vitamin D3 or vitamin D2 (ergocalciferol)). Vitamin D3 and D2 do not have biological activity. Both forms are metabolised within the liver to 25‐hydroxyvitamin D (calcidiol) and within the kidneys to the biologically active form known as 1,25‐dihydroxyvitamin D (calcitriol), which functions as a steroid‐like hormone (Wesley Pike 2005). The effects of 1,25‐dihydroxyvitamin D are mediated by its binding to vitamin D receptors in the cells (Wesley Pike 2005). Renal production of 1,25‐dihydroxyvitamin D is regulated by parathyroid hormone levels, by serum calcium and phosphorus levels, and by the phosphaturic hormone fibroblast growth factor‐23 (Kovesdy 2013).
Description of the condition
Vitamin D status is determined by the measurement of the serum 25‐hydroxyvitamin D level which is functional indicator of vitamin D status (Lips 2004; Dawson‐Hughes 2005; Bischoff‐Ferrari 2009). A number of methods are used to measure vitamin D status (radioimmunoassay, high performance/pressure liquid chromatography (HPLC), liquid chromatography‐tandem mass spectrometry (LC‐MS/MS), and more recently chemiluminescent immunoassay (CLIA) (Atef 2017). The accuracy of these methods vary significantly. HPLC and LC‐MS/MS can measure vitamin D2 and D3 independently and has been considered as the gold standard (Hollis 2008). Optimal sun exposure and dietary intake are related to optimal vitamin D status. The US Institute of Medicine recommended target serum 25‐hydroxyvitamin D levels of 20 ng/mL (50 nmol/L) (IOM 2011). Based on the systematic review prepared by the US Institute of Medicine, there are insufficient data to determine the safe upper limit of serum 25‐hydroxyvitamin D levels (IOM 2011). However, serum 25‐hydroxyvitamin D concentrations above 50 ng/mL (125 nmol/L) were considered potentially harmful (IOM 2011). The International Osteoporosis Foundation and the Endocrine Society Task Force recommend a target serum 25‐hydroxyvitamin D level of 30 ng/mL (75 nmol/L) (Dawson‐Hughes 2010; Holick 2011). The worldwide prevalence of suboptimal vitamin D status is estimated to be high (Lips 2010; van Schoor 2011; Hilger 2014). The major causes of vitamin D deficiency are insufficient exposure to sunlight, decreased dietary intake, skin pigmentation, obesity, and advanced age (Lips 2006; Holick 2007; Tsiaras 2011; SACN 2016). One systematic review of prospective and intervention studies that assessed the effect of vitamin D status on non‐skeletal outcomes suggested that low vitamin D status in a wide spectrum of diseases may be a marker of ill health (Autier 2014).
Vitamin D undergoes important biotransformation in the liver. The liver also plays a critical role in the inactivation of vitamin D. Because vitamin D is metabolised by the liver, abnormal vitamin D metabolism might be expected to be associated with chronic liver diseases. Vitamin D deficiency has been frequently reported in people with chronic liver diseases (Arteh 2010; Malham 2011; Kitson 2012; Lim 2012; Stokes 2013; Skaaby 2014). There is evidence that low vitamin D status is associated with increased mortality in chronic liver diseases (Putz‐Bankuti 2012; Wang 2013; Stokes 2014; Finkelmeier 2015; Paternostro 2017).
Description of the intervention
Vitamin D could be administered as supplemental vitamin D (vitamin D3 (cholecalciferol) or vitamin D2 (ergocalciferol)) or as an active form of vitamin D (1α‐hydroxyvitamin D (alfacalcidol), 25‐hydroxyvitamin D (calcidiol), or 1,25‐dihydroxyvitamin D (calcitriol)). Vitamin D supplementation prevents osteoporosis and osteomalacia (Lips 2006). It is speculated that vitamin D supplementation may confer benefits beyond the skeletal system, including chronic liver diseases (Davis 2007; Kitson 2012; Han 2013; Elangovan 2017).
How the intervention might work
There is the evidence that vitamin D supplementation may have beneficial effects on bone disorders in people with chronic liver diseases (Guañabens 2010; Luxon 2011). However, vitamin D supplementation has been suggested as a potential therapeutic in people with chronic hepatitis B infection (Farnik 2013; Mahamid 2013), chronic hepatitis C infection (Petta 2010; Gutierrez 2011; Bitetto 2012; Cacopardo 2012; Cholongitas 2012; Luong 2012), autoimmune hepatitis (Luong 2013a), non‐alcoholic fatty liver disease (Geier 2011; Eliades 2013; Kwok 2013; Eliades 2015), primary biliary cirrhosis (Li 2013; Luong 2013b), alcoholic cirrhosis (Trépo 2013; Konstantakis 2016), and hepatocellular carcinoma (Chiang 2011; Lange 2013). It is presently unclear how vitamin D exerts its postulated beneficial effects apart from maybe correcting vitamin D levels in the serum to something looking more normal (Zittermann 2014).
Why it is important to do this review
Observational studies reported a high prevalence of vitamin D insufficiency across a spectrum of chronic liver diseases (Arteh 2010; Lim 2012; Han 2013; Finkelmeier 2014). However, the available evidence on the benefits and harms of vitamin D supplementation in people with chronic liver diseases is insufficient and inconsistent. Meta‐analyses of observational and interventional studies in people with hepatitis C virus infection found contradictory results (Villar 2013; Kitson 2014). Results of our systematic reviews indicate that vitamin D3 supplementation may prolong life span in adults (Bjelakovic 2014a), and it does not seem to have an effect on cancer occurrence (Bjelakovic 2014b).
Objectives
To assess the beneficial and harmful effects of vitamin D supplementation in people with chronic liver diseases.
Methods
Criteria for considering studies for this review
Types of studies
Randomised clinical trials, irrespective of blinding, publication status, or language. We also considered quasi‐randomised and observational studies for inclusion if identified during our searches to identify data on harm. We are aware that this will focus more on possible beneficial effects and less on possible harms.
Types of participants
Adults (aged 18 years or over) who were diagnosed with a chronic liver disease.
Types of interventions
Experimental
Vitamin D at any dose and for any duration, administered as monotherapy or in combination with calcium. The route of administration could be enteral or parenteral. Vitamin D could be administered as supplemental vitamin D (vitamin D3 (cholecalciferol) or vitamin D2 (ergocalciferol)) or as an active form of vitamin D (1α‐hydroxyvitamin D (alfacalcidol), 25‐hydroxyvitamin D (calcidiol), or 1,25‐dihydroxyvitamin D (calcitriol)).
Control
Placebo (identical in appearance and smell) or no intervention.
Concomitant interventions were allowed if used equally in all intervention groups.
Types of outcome measures
Primary outcomes
All‐cause mortality.
Liver‐related mortality.
Serious adverse events. Depending on the availability of data, we attempted to classify adverse events as serious or non‐serious. Serious adverse events were defined as any outward medical occurrence that was life threatening; resulted in death, or persistent or significant disability; or any medical event that may have jeopardised the person; or required intervention to prevent it (ICH‐GCP 1997). We considered all other adverse events as non‐serious (see Secondary outcomes below).
Secondary outcomes
Liver‐related morbidity (gastrointestinal bleeding, hepatic encephalopathy, hepatorenal syndrome, ascites, jaundice, liver cancer).
Health‐related quality of life (any valid continuous outcome scale used by the trialists).
Non‐serious adverse events.
Exploratory outcomes
Failure of virological response at week four (rapid virological response), at week 12 (early virological response), and six months after treatment (sustained virological response) (e.g. without clearance of hepatitis B virus DNA (HBV‐DNA) or hepatitis B virus ribonucleic acid (HCV‐RNA) from serum).
Acute cellular rejection in liver transplant recipients.
Vitamin D status.
Bone mineral density.
Biochemical indices (aspartate aminotransferase, alanine aminotransferase, alkaline phosphatase, gamma glutamyl transpeptidase, albumin, bilirubin, triglyceride, cholesterol, and calcium).
Covariates, effect modifiers, and confounders
We recorded any possible covariates, effect modifiers, and confounders such as dosage and form of vitamin D, dosing schedule, duration of supplementation, duration of follow‐up, mean age, risk of bias, calcium coadministration, other medications, compliance, and attrition.
Timing of outcome measurement
We applied no restrictions regarding duration of the intervention or length of follow‐up. We assessed outcome data at the end of the trial follow‐up period.
Search methods for identification of studies
Electronic searches
We used the following sources for the identification of trials:
The Cochrane Hepato‐Biliary Group Controlled Trials Register (Gluud 2017);
Cochrane Central Register of Controlled Trials (CENTRAL) in the Cochrane Library (2016, Issue 11);
MEDLINE (OvidSP; 1946 to January 2017);
Embase (OvidSP; 1974 to January 2017);
Science Citation Index Expanded and Conference Proceedings Citation Index ‐ Science (Web of Science; 1900 to January 2017) (Royle 2003).
We also searched ClinicalTrials.gov (www.clinicaltrials.gov/) and the World Health Organization International Clinical Trials Registry Platform (www.who.int/ictrp/en/)). For detailed search strategies, see Appendix 1. There were no language limitations.
Searching other resources
We contacted experts and main manufacturers of vitamin D to ask for unpublished randomised trials. We identified additional trials by searching the reference lists of included trials and systematic reviews, meta‐analyses, and health technology assessment reports.
Data collection and analysis
One review author (GB) performed the electronic searches. Three review authors (GB, DN, and MB) independently participated in the manual searches and identified trials eligible for inclusion from the search results.
Selection of studies
To determine the studies to be assessed further, two review authors (GB and DN) independently scanned the abstract, title, or both sections of every record retrieved. We investigated all potentially relevant articles as full text. One review author (GB) listed the excluded studies with the reason for exclusion. When a discrepancy occurred in the trial selection extraction, we consulted one review author (CG) to reach consensus. If resolving disagreement was not possible, we added the article to those 'awaiting assessment', and we contacted the trial authors for clarification. We also contacted trial authors when the information we needed was not to be found in the published trial reports.. Inter‐rater agreement for trial selection was measured using the Kappa statistic (Cohen 1960). Agreement between the review authors was very good (Kappa = 0.85). We included an adapted PRISMA flow diagram of study selection (Moher 2009).
Data extraction and management
For studies that fulfilled the inclusion criteria, three review authors (GB, DN, and MB) independently extracted relevant population, intervention characteristics, and risk of bias components using standard data extraction templates. We identified duplicate publications. Disagreements were resolved by discussion, or when required by consultation with another review author (CG).
Dealing with duplicate publications and companion papers
In the case of duplicate publications and companion papers of a primary study, we maximised our yield of information by simultaneous evaluation of all available data.
Assessment of risk of bias in included studies
Two review authors (GB and DN) independently assessed the risk of bias of each included trial according to the recommendations in the Cochrane Handbook for Systematic Reviews of Interventions (Higgins 2011), the Cochrane Hepato‐Biliary Group Module (Gluud 2017), and methodological studies (Schulz 1995; Moher 1998; Kjaergard 2001; Wood 2008; Savović 2012a; Savović 2012b; Lundh 2017). We used the following definitions in the assessment of risk of bias.
Allocation sequence generation
Low risk of bias: sequence generation performed using computer random number generation or a random number table. Drawing lots, tossing a coin, shuffling cards, and throwing dice were adequate if an independent person not otherwise involved in the study performed them.
Unclear risk of bias: method of sequence generation not mentioned.
High risk of bias: sequence generation method was not random. We included such studies only for assessment of harms.
Allocation concealment
Low risk of bias: the participant allocations could not have been foreseen in advance of, or during, enrolment. A central and independent randomisation unit controlled allocation. Investigators were unaware of allocation sequence (e.g. if allocation sequence was hidden in sequentially numbered, opaque, and sealed envelopes).
Unclear risk of bias: method used to conceal the allocation not mentioned so intervention allocations may have been foreseen before, or during, enrolment.
High risk of bias: likely that the investigators who assigned the participants knew the allocation sequence. We included such studies only for assessment of harms
Blinding of participants and personnel
Low risk of bias: any of the following: no blinding or incomplete blinding, but we judged that the outcome was not likely to be influenced by lack of blinding; or blinding of participants and key study personnel ensured, and it was unlikely that the blinding could have been broken.
Unclear risk of bias: any of the following: insufficient information to permit judgement of 'low risk' or 'high risk'; or the trial did not address this outcome.
High risk of bias: any of the following: no blinding or incomplete blinding, and the outcome was likely to be influenced by lack of blinding; or blinding of key study participants and personnel attempted, but likely that the blinding could have been broken, and the outcome was likely to be influenced by lack of blinding.
Blinded outcome assessment
Low risk of bias: any of the following: no blinding of outcome assessment, but we judged that the outcome measurement was not likely to be influenced by lack of blinding; or blinding of outcome assessment ensured, and unlikely that the blinding could have been broken.
Unclear risk of bias: any of the following: insufficient information to permit judgement of 'low risk' or 'high risk'; or the trial did not address this outcome.
High risk of bias: any of the following: no blinding of outcome assessment, and the outcome measurement was likely to be influenced by lack of blinding; or blinding of outcome assessment, but likely that the blinding could have been broken, and the outcome measurement was likely to be influenced by lack of blinding.
Incomplete outcome data
Low risk of bias: missing data were unlikely to make treatment effects depart from plausible values. The study used sufficient methods, such as multiple imputation, to handle missing data.
Unclear risk of bias: there was insufficient information to assess whether missing data in combination with the method used to handle missing data were likely to induce bias on the results.
High risk of bias: the results were likely to be biased due to missing data.
Selective outcome reporting
Low risk of bias: the trial reported all predefined outcomes. If the original trial protocol was available, the outcomes should have been those called for in that protocol. If the trial protocol was obtained from a trial registry (e.g. www.clinicaltrials.gov), the outcomes sought should have been those enumerated in the original protocol if the trial protocol was registered before or at the time that the trial was begun. If the trial protocol was registered after the trial was begun, we did not consider those outcomes to be reliable.
Unclear risk of bias: the study authors did not report all predefined outcomes fully, or it was unclear whether the study authors recorded data on these outcomes.
High risk of bias: the study authors did not report one or more of the predefined outcomes.
For‐profit bias
Low risk of bias: the trial appeared to be free of industry sponsorship or other type of for‐profit support that could manipulate the trial design, conductance, or trial results.
Unclear risk of bias: the trial may or may not have been free of for‐profit bias as the trial did not provide any information on clinical trial support or sponsorship.
High risk of bias: the trial was sponsored by industry or received other type of for‐profit support.
Other bias
Low risk of bias: the trial appeared to be free of other components (e.g. academic bias) that could put it at risk of bias.
Unclear risk of bias: the trial may or may not have been free of other components that could put it at risk of bias.
High risk of bias: there were other factors in the trial that could put it at risk of bias (e.g. authors had conducted trials on the same topic).
Overall risk of bias
We judged trials to be at overall low risk of bias if we assessed them at 'low risk of bias' in all bias risk domains. We judged trials to be at high risk of bias if we assessed them as having an unclear risk of bias or a high risk of bias in one or more of the bias risk domains. We based our primary conclusions on the outcome results of our primary outcomes with low risk of bias.
Measures of treatment effect
Dichotomous outcomes
For dichotomous outcomes, we calculated and presented risk ratios (RR) with 95% and Trial Sequential Analysis‐adjusted confidence intervals (CI). We calculated and presented Peto odds ratio (OR) for rare events.
Continuous outcomes
For continuous outcomes, we calculated and presented mean differences (MD) with 95% CI and Trial Sequential Analysis‐adjusted CI.
Unit of analysis issues
Trial participants as randomised per intervention group. In the trials with parallel group design with more than two intervention groups and additional therapy, we compared the vitamin D arm alone versus placebo or no intervention group. In the trials with parallel group design with more than two intervention groups and without additional therapy, we compared the combined vitamin D groups versus placebo or no intervention group.
Dealing with missing data
We tried to obtain relevant missing data from authors whenever we lacked important numerical data such as number of screened or randomised participants, or lack of data regarding the performance of intention‐to‐treat (ITT) analyses, or data on as‐treated or per‐protocol participant analyses to perform our analyses appropriately. We investigated attrition rates (e.g. dropouts, losses to follow‐up, and withdrawals) and critically appraised issues of missing data (e.g. last observation carried forward and imputation methods).
Regarding the primary outcomes, we included trial participants with incomplete or missing data in sensitivity analyses by imputing them according to the following scenarios (Hollis 1999).
Extreme‐case analysis favouring the experimental intervention ('best‐worse' case scenario: none of the dropouts/participants lost from the experimental arm, but all the dropouts/participants lost from the control arm experienced the outcome, including all randomised participants in the denominator.
Extreme‐case analysis favouring the control ('worst‐best' case scenario): all dropouts/participants lost from the experimental arm, but none from the control arm experienced the outcome, including all randomised participants in the denominator.
Assessment of heterogeneity
We identified heterogeneity by visual inspection of the forest plots, by using a standard Chi² test and a significance level of α = 0.1, in view of the low power of such tests. We specifically examined heterogeneity using the I² statistic (Higgins 2002), where I² values of 50% or more indicated a substantial level of heterogeneity (Higgins 2003). For heterogeneity adjustment of the required information size in the trials sequential analyses, we used diversity (D2 ), as I² statistic used for this purpose consistently underestimates the required information size (Wetterslev 2009).
When we found heterogeneity, we attempted to determine the potential reasons for it by examining the individual trial and subgroup characteristics.
Assessment of reporting biases
We used funnel plots in an exploratory data analysis to assess the potential existence of bias in small trials. There are several explanations for the asymmetry of a funnel plot, including true heterogeneity of effect with respect to trial size, poor methodological design of small trials, and publication bias.
We performed adjusted rank correlation (Begg 1994) and a regression asymmetry test (Egger 1997) for detection of bias. We considered a P value less than 0.10 as significant in these analyses.
Data synthesis
Meta‐analysis
We performed statistical analyses according to the statistical guidelines referenced in the Cochrane Handbook for Systematic Reviews of Interventions (Higgins 2011).
For the statistical analyses, we used Review Manager 5 (RevMan 2014), Trial Sequential Analysis version 0.9.5.10 beta (TSA 2017), STATA 8.2 (STATA Corp, College Station, TX), and Sigma Stat 3.0 (SPSS Inc, Chicago, IL). We analysed the data using both fixed‐effect (DeMets 1987) and random‐effects (DerSimonian 1986) model meta‐analyses. If there were statistically significant discrepancies in the results (e.g. one model giving a significant intervention effect and the other model giving no significant intervention effect), we reported the more conservative point estimate of the two (Jakobsen 2014). The more conservative point estimate is the estimate closest to zero effect. If the two‐point estimates were equal, we used the estimate with the widest CI as our main result of the two analyses. We considered a P value of 0.025 or less, two‐tailed, as statistically significant if the required information size was reached due to our three primary outcomes (Jakobsen 2014). We used an eight‐step procedure to assess whether the thresholds for significance were crossed (Jakobsen 2014). For dichotomous outcomes, we calculated RRs, and for continuous outcomes we calculated MD. For all association measures, we used 95% CIs and Trial Sequential Analysis‐adjusted CIs. We performed the analyses using the ITT principle, including all randomised participants irrespective of completeness of data. Participants with missing data were included in the analyses using a carry forward of the last observed response. Accordingly, participants who had been lost to follow‐up were counted as being alive.
Review Manager 5 does not include trials with zero events in both intervention groups when calculating RR (RevMan 2014). To account for trials with zero events, we repeated meta‐analyses of dichotomous data using Peto OR. The influence of trials with zero events in the treatment, control, or both groups was also assessed by recalculating the random‐effects model meta‐analyses with 0.01 as the empirical continuity correction (Sweeting 2004; Bradburn 2007) using Trial Sequential Analysis version 0.9.5.10 beta (TSA 2017).
We compared the intervention effects in subgroups of trials using the method described by Borenstein and colleagues (Borenstein 2009) and implemented in Review Manager 5 for all types of meta‐analyses.
Trial Sequential Analysis
We examined apparently significant beneficial and harmful intervention effects (potential type I errors) and neutral intervention effects (potential type II errors) with Trial Sequential Analysis to evaluate if these effects could be caused by random errors (Brok 2008; Wetterslev 2008; Brok 2009; Thorlund 2009; Wetterslev 2009; Thorlund 2011a; Thorlund 2011b; TSA 2017; Wetterslev 2017).
We used Trial Sequential Analysis because cumulative meta‐analyses are at risk of producing random errors due to sparse data and repetitive testing of the accumulating data (Wetterslev 2008). To control random errors, we calculated the required information size (i.e. the number of participants needed in a meta‐analysis to detect or reject a certain intervention effect) (Wetterslev 2008). The required information size calculation should account for the diversity present in the meta‐analysis (Wetterslev 2008; Wetterslev 2009).
In our Trial Sequential Analysis, the diversity‐adjusted required information size was based on the event proportion in the control group; assumption of a plausible relative risk reduction of 28%; a risk of type I error of 2.5%; a risk of type II error of 10%; and the observed diversity of the included trials in the meta‐analysis (Wetterslev 2009; Wetterslev 2017). The underlying assumption of Trial Sequential Analysis is that testing for significance may be performed each time a new trial is added to the meta‐analysis. We added the trials according to the year of publication, and if more than one trial was published in a year, we added trials alphabetically according to the last name of the first author.
On the basis of the diversity‐adjusted required information size, we constructed trial sequential monitoring boundaries (Thorlund 2011a). These boundaries determined the statistical inference one may draw regarding the cumulative meta‐analysis that has not reached the required information size. If the cumulative Z‐curve crosses the trial sequential monitoring boundary for benefit or harm before the diversity‐adjusted required information size is reached, firm evidence may perhaps be established and further trials may be superfluous. In contrast, if the boundary is not surpassed, it is most probably necessary to continue doing trials to detect or reject a certain intervention effect. That can be determined by assessing if the cumulative Z‐curve crosses the trial sequential monitoring boundaries for futility.
A more detailed description of Trial Sequential Analysis can be found at www.ctu.dk/tsa/ (Thorlund 2011a) and in Wetterslev 2017.
Subgroup analysis and investigation of heterogeneity
We performed subgroup analyses primarily if one of the primary outcome measures demonstrated a statistically significant difference between the intervention groups.
We performed the following subgroup analyses:
trials at low risk of bias compared to trials at high risk of bias;
vitamin D3 compared to placebo or no intervention;
vitamin D2 compared to placebo or no intervention;
25‐dihydroxyvitamin D compared to placebo or no intervention;
1,25‐dihydroxyvitamin D compared to placebo or no intervention.
Sensitivity analysis
See Dealing with missing data.
'Summary of findings' table
We created 'Summary of findings' tables using GRADEpro (GRADEpro). We used the GRADE approach which appraises the quality of a body of evidence based on the extent to which one can be confident that an estimate of effect or association reflects the item being assessed. The quality of a body of evidence considers within‐study risk of bias, indirectness of the evidence (population, intervention, control, outcomes), unexplained heterogeneity or inconsistency of results (including problems with subgroup analyses); imprecision of results (wide CIs as evaluated with our Trial Sequential Analyses) (Jakobsen 2014), and risk of publication bias (Balshem 2011; Guyatt 2011a; Guyatt 2011b; Guyatt 2011c; Guyatt 2011d; Guyatt 2011e; Guyatt 2011f; Guyatt 2011g; Guyatt 2011h; Guyatt 2013a; Guyatt 2013b; Guyatt 2013c; Mustafa 2013).
These grades are defined as follows.
High quality: this research provides a very good indication of the likely effect; the likelihood that the effect will be substantially different is low.
Moderate quality: this research provides a good indication of the likely effect; the likelihood that the effect will be substantially different is moderate.
Low quality: this research provides some indication of the likely effect; however, the likelihood that it will be substantially different is high.
Very low quality: this research does not provide a reliable indication of the likely effect; the likelihood that the effect will be substantially different is very high.
Results
Description of studies
Results of the search
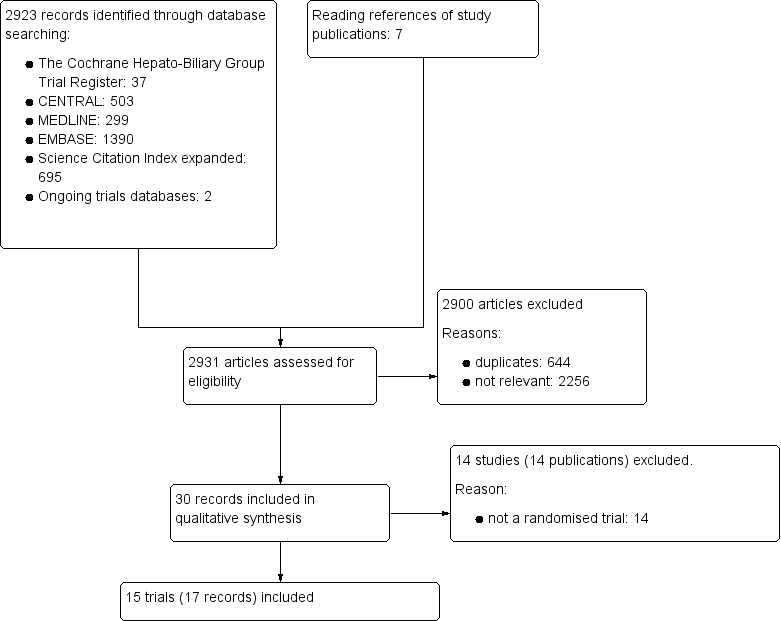
We identified 2931 references of possible interest through searching The Cochrane Hepato‐Biliary Group Controlled Trials Register (37 references), the Cochrane Central Register of Controlled Trials in the Cochrane Library (503 references), MEDLINE (299 references), Embase (1390 references), Science Citation Index Expanded (695), and reference lists (seven references). We identified an additional two ongoing trials through searching databases of ongoing trials. We will include data from the ongoing trials in updates of this review. We excluded 644 duplicates and 2256 clearly irrelevant references through reading the abstracts. Accordingly, we retrieved 30 references for further assessment. Of these, we excluded 14 references because they were not randomised trials. In total, 15 randomised trials described in 17 references fulfilled our inclusion criteria (Figure 1). Details of the trials are shown in the Characteristics of included studies table; Table 2; Table 3; and Table 4.
1.
Study flow diagram
1. Characteristics of included trials (I).
| Study ID | Protocol | Design | Groups | Bias risk | Blinding | Participants (n) | Women (%) | Mean age (years) |
| Abu‐Mouch 2011 | Yes | Parallel | 2 | High | NI | 72 | 44 | 47 |
| Atsukawa 2016 | No | Parallel | 2 | High | NI | 115 | 50 | 64 |
| Barchetta 2016 | Yes | Parallel | 2 | High | PL | 65 | 35 | 59 |
| Esmat 2015 | No | Parallel | 2 | High | NI | 101 | 25 | 40 |
| Foroughi 2016 | Yes | Parallel | 2 | High | PL | 60 | 52 | 48 |
| Lorvand Amiri 2016 | Yes | Parallel | 3 | High | PL | 120 | 38 | 41 |
| Mobarhan 1984 | No | Parallel | 3 | High | NI | 18 | 0 | 61 |
| Nimer 2012 | No | Parallel | 2 | High | NI | 50 | 58 | 47 |
| Pilz 2016 | Yes | Parallel | 2 | High | PL | 36 | 25 | 61 |
| Sharifi 2014 | No | Parallel | 2 | High | PL | 60 | 51 | 60 |
| Shiomi 1999a | No | Parallel | 2 | High | NI | 76 | 66 | 61 |
| Shiomi 1999b | No | Parallel | 2 | High | NI | 34 | 100 | 56 |
| Vosoghinia 2016 | Yes | Parallel | 2 | High | NI | 68 | 13 | 42 |
| Xing 2013 | No | Parallel | 3 | High | PL | 75 | 17 | 48 |
| Yokoyama 2014 | No | Parallel | 2 | High | NI | 84 | 49 | 59 |
n: number of participants; NI: no intervention; PL: placebo.
2. Characteristics of included trials (II).
| Study ID | Participants | Outcome measures | Sponsor | Country |
| Abu‐Mouch 2011 | Chronic hepatitis C genotype 1 | Sustained virological response | No information | Israel |
| Atsukawa 2016 | Chronic hepatitis C genotype 1 | Sustained virological response | No information | Japan |
| Barchetta 2016 | NAFLD | Liver steatosis, liver function | No | Italy |
| Esmat 2015 | Chronic hepatitis C genotype 4 | Sustained virological response | No information | Egypt |
| Foroughi 2016 | NAFLD | Liver steatosis, liver function | No | Iran |
| Lorvand Amiri 2016 | NAFLD | Liver function, body fat | No | Iran |
| Mobarhan 1984 | Liver cirrhosis | Bone mineral density | Yes | USA |
| Nimer 2012 | Chronic hepatitis C genotype 2 or 3 | Sustained virological response | No information | Israel |
| Pilz 2016 | Liver cirrhosis | Vitamin D status, liver function | No | Austria |
| Sharifi 2014 | NAFLD | Liver function, insulin resistance index | No | Iran |
| Shiomi 1999a | Liver cirrhosis | Bone mineral density | No information | Japan |
| Shiomi 1999b | Primary biliary cirrhosis | Bone mineral density | No information | Japan |
| Vosoghinia 2016 | Chronic hepatitis C genotype 1,2,3,4 | Early virological response | No | Iran |
| Xing 2013 | Liver transplant recipients | Acute cellular rejection rate | No | China |
| Yokoyama 2014 | Chronic hepatitis C genotype 1 | Sustained virological response | No information | Japan |
NAFLD: non‐alcoholic fatty liver disease.
3. Characteristics of included studies (III).
| Study ID | Vitamin | Calcium (mg) | Regimen* | Treatment (weeks) | Follow‐up (weeks) | Cointervention | |||
| D3 (IU) | D2 (IU) | 25(OH)D (IU) | 1,25(OH)2D (µg) | ||||||
| Abu‐Mouch 2011 | 2000 | ‐ | ‐ | ‐ | ‐ | Daily | 48 | 72 | PEG‐INF, RBV |
| Atsukawa 2016 | 2000 | ‐ | ‐ | ‐ | ‐ | Daily | 16 | 16 | PEG‐INF, RBV, SP |
| Barchetta 2016 | 2000 | ‐ | ‐ | ‐ | ‐ | Daily | 24 | 24 | ‐ |
| Esmat 2015 | 2143 | ‐ | ‐ | ‐ | ‐ | Weekly | 48 | 72 | PEG‐INF, RBV |
| Foroughi 2016 | 7143 | ‐ | ‐ | ‐ | ‐ | Weekly | 10 | 10 | ‐ |
| Lorvand Amiri 2016 | 1000 | ‐ | ‐ | ‐ | 500 | Daily | 10 | 12 | ‐ |
| Mobarhan 1984 | ‐ | 17,857 | 2400 | ‐ | ‐ | Daily | 52 | 52 | ‐ |
| Nimer 2012 | 2000 | ‐ | ‐ | ‐ | ‐ | Daily | 24 | 48 | PEG‐INF, RBV |
| Pilz 2016 | 2800 | ‐ | ‐ | ‐ | ‐ | Daily | 8 | 8 | ‐ |
| Sharifi 2014 | 3571 | ‐ | ‐ | ‐ | ‐ | Twice a week | 16 | 16 | ‐ |
| Shiomi 1999a | ‐ | ‐ | ‐ | 1 | ‐ | Daily | 52 | 52 | ‐ |
| Shiomi 1999b | ‐ | ‐ | ‐ | 1 | ‐ | Daily | 52 | 52 | ‐ |
| Vosoghinia 2016 | 1600 | ‐ | ‐ | ‐ | ‐ | Daily | 12 | 12 | PEG‐INF, RBV |
| Xing 2013 | ‐ | ‐ | ‐ | 0.25 | 1000 | Daily | 4 | 4 | ‐ |
| Yokoyama 2014 | 1000 | ‐ | ‐ | ‐ | ‐ | Daily | 16 | 24 | PEG‐INF, RBV |
* Vitamin D was administered orally in all trials. 1,25(OH)2D: calcitriol; 25(OH)D: calcidiol; PEG‐INF: pegylated‐interferon; RBV: ribavirin; SP: simeprevir.
Included studies
All 15 included trials used a parallel‐group design with two (Shiomi 1999a; Shiomi 1999b; Abu‐Mouch 2011; Nimer 2012; Sharifi 2014; Yokoyama 2014; Esmat 2015; Atsukawa 2016; Barchetta 2016; Foroughi 2016; Pilz 2016: Vosoghinia 2016) or three intervention groups (Mobarhan 1984; Xing 2013; Lorvand Amiri 2016). The trials were published from 1984 to 2016 (Table 2).
The trials were conducted in Africa (Esmat 2015), Asia (Shiomi 1999a; Shiomi 1999b; Abu‐Mouch 2011; Nimer 2012; Xing 2013; Sharifi 2014; Yokoyama 2014; Atsukawa 2016, Foroughi 2016; Lorvand Amiri 2016; Vosoghinia 2016), Europe (Barchetta 2016; Pilz 2016), and North America (Mobarhan 1984). Nine trials were conducted in high‐income countries (Mobarhan 1984; Shiomi 1999a; Shiomi 1999b; Abu‐Mouch 2011; Nimer 2012; Yokoyama 2014; Atsukawa 2016; Barchetta 2016; Pilz 2016), and six trials in middle‐income countries (Xing 2013; Sharifi 2014; Esmat 2015; Foroughi 2016; Lorvand Amiri 2016; Vosoghinia 2016) (Table 3).
Participants
A total of 1034 participants were randomly assigned in the 15 trials. The number of participants in each trial ranged from 18 to 120 (median 68). The mean age of participants was 53 years (range 18 years to 84 years). The mean proportion of women was 42% (Table 2).
Six trials included participants with chronic hepatitis C (Abu‐Mouch 2011; Nimer 2012; Yokoyama 2014; Esmat 2015; Atsukawa 2016; Vosoghinia 2016), four trials included participants with liver cirrhosis (Mobarhan 1984; Shiomi 1999a; Shiomi 1999b; Pilz 2016), four trials included participants with non‐alcoholic fatty liver disease (Sharifi 2014; Barchetta 2016; Foroughi 2016; Lorvand Amiri 2016), and one trial included liver transplant recipients (Xing 2013) (Table 3).
All included trials reported the baseline vitamin D status of participants based on serum 25‐hydroxyvitamin D levels. Participants in six trials had baseline 25‐hydroxyvitamin D levels at or above vitamin D adequacy (20 ng/mL) (Abu‐Mouch 2011; Nimer 2012; Yokoyama 2014; Atsukawa 2016; Foroughi 2016; Vosoghinia 2016). Participants in the remaining nine trials had baseline 25‐hydroxyvitamin D levels considered vitamin D insufficient (less than 20 ng/mL) (Mobarhan 1984; Shiomi 1999a; Shiomi 1999b; Xing 2013; Sharifi 2014; Esmat 2015; Barchetta 2016; Lorvand Amiri 2016; Pilz 2016).
Experimental interventions
Vitamin D3 (cholecalciferol)
Vitamin D was administered as vitamin D3 (cholecalciferol) in 10 trials ((831 participants; 40% women; mean age 52 years) (Abu‐Mouch 2011; Nimer 2012; Sharifi 2014; Yokoyama 2014; Esmat 2015; Atsukawa 2016; Barchetta 2016; Foroughi 2016; Lorvand Amiri 2016; Pilz 2016; Vosoghinia 2016). Vitamin D3 was tested orally in all trials. Vitamin D3 was administered daily in eight trials (Abu‐Mouch 2011; Nimer 2012; Yokoyama 2014; Atsukawa 2016; Barchetta 2016; Pilz 2016; Lorvand Amiri 2016; Vosoghinia 2016), weekly in two trials (Esmat 2015; Foroughi 2016), and twice a week in one trial (Sharifi 2014). Mean daily dose of the vitamin D3 was 2478 international units (IU). The duration of supplementation in trials using vitamin D3 was 8 to 48 weeks (mean 21 weeks), and the length of the follow‐up period was from 8 to 72 weeks (mean 29 weeks) (Table 4).
Vitamin D2 (ergocalciferol)
Vitamin D was administered as vitamin D2 (ergocalciferol) in one trial (18 participants; 0% women; mean age 52 years) (Mobarhan 1984). Vitamin D2 was tested in a dose of 50,000 IU, orally, two or three times weekly for one year (Mobarhan 1984) (Table 4).
1,25‐dihydroxyvitamin D (calcitriol)
Vitamin D was administered as 1,25‐dihydroxyvitamin D in three trials (185 participants; 55% women; mean age 55 years) (Shiomi 1999a; Shiomi 1999b; Xing 2013). 1,25‐dihydroxyvitamin D was tested singly, orally, and daily in two trials (Shiomi 1999a; Shiomi 1999b). One trial administered 1,25‐dihydroxyvitamin D combined with calcium (Xing 2013). The dose of 1,25‐dihydroxyvitamin D was 1.0 μg in two trials (Shiomi 1999a; Shiomi 1999b), and 0.25 μg in one trial (Xing 2013). The duration of supplementation and follow‐up in trials using 1,25‐dihydroxyvitamin D was one month to one year (mean 0.7 years) (Table 4).
25‐hydroxyvitamin D (calcidiol)
Vitamin D was administered as 25‐hydroxyvitamin D in one trial (18 participants; 0% women; mean age 52 years) (Mobarhan 1984). 25‐hydroxyvitamin D was tested at a dose of 800 IU/day to 2000 IU/day, orally, for one year (Table 4).
Control interventions
Seven trials used placebo (Xing 2013; Sharifi 2014; Esmat 2015; Barchetta 2016; Foroughi 2016; Lorvand Amiri 2016; Pilz 2016), and eight trials used no intervention in the control group (Mobarhan 1984; Shiomi 1999a; Shiomi 1999b; Abu‐Mouch 2011; Nimer 2012; Yokoyama 2014; Atsukawa 2016; Vosoghinia 2016) (Table 2).
Cointerventions
Five trials used pegylated‐interferon and ribavirin combined with vitamin D3 in the intervention groups versus no intervention (Abu‐Mouch 2011; Nimer 2012; Yokoyama 2014; Esmat 2015; Vosoghinia 2016). One trial used pegylated‐interferon, ribavirin, and simeprevir (direct‐acting antiviral agent) combined with vitamin D3 in the intervention group versus no intervention (Atsukawa 2016). One trial with three intervention groups administered 1,25‐dihydroxyvitamin D combined with calcium gluconate in one intervention group, and calcium gluconate in another intervention group (Xing 2013). Thus, we compared the 1,25‐dihydroxyvitamin D plus calcium gluconate group versus the calcium gluconate group and placebo group combined. Another trial with three intervention groups used vitamin D3 singly in one of the intervention groups, vitamin D3 combined with calcium carbonate in another intervention group, and placebo in a third intervention group (Lorvand Amiri 2016) (Table 4). Thus, we compared the first two groups together versus the placebo group.
A detailed description of the characteristics of included studies is presented in the Characteristics of included studies table; Table 2; Table 3; and Table 4.
Excluded studies
A detailed description of the characteristics of excluded studies is presented in the Characteristics of excluded studies table.
Risk of bias in included studies
All trials were at high risk of bias (had unclear or high risk of bias control in one or more domains assessed) (Figure 2; Figure 3; Table 2). Inspection of the funnel plot did not suggest potential bias (asymmetry) (Figure 4). The adjusted‐rank correlation test (P = 0.34) and a regression asymmetry test (P = 0.48) found no significant evidence of bias.
2.
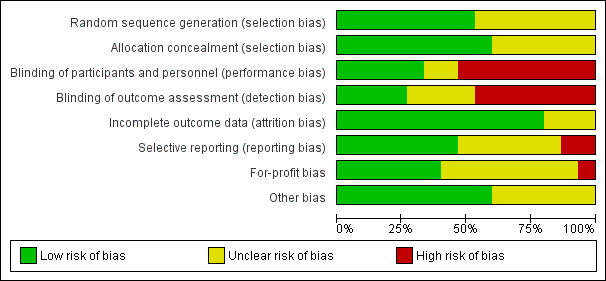
Risk of bias graph: review authors' judgements about each risk of bias item presented as percentages across all included studies.
3.
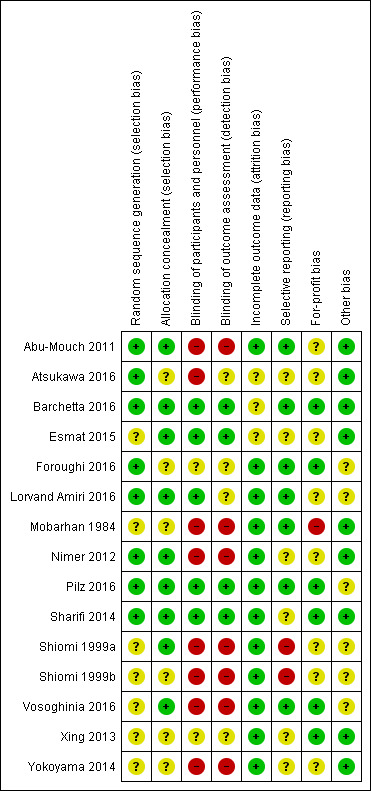
Risk of bias summary: review authors' judgements about each risk of bias item for each included study.
4.
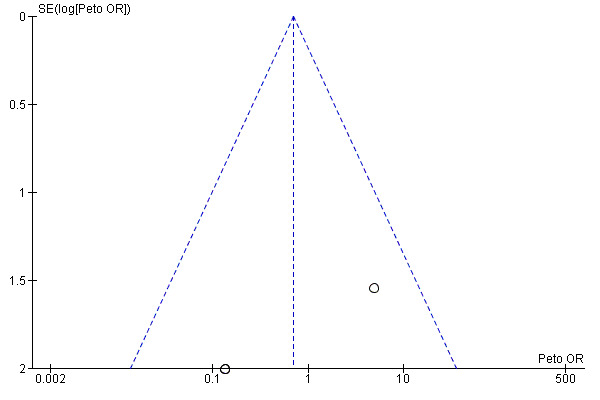
Funnel plot of comparison: 1 Vitamin D versus placebo or no intervention, outcome: 1.1 All‐cause mortality.
Allocation
Eight trials described the generation of allocation sequence adequately (Abu‐Mouch 2011; Nimer 2012; Sharifi 2014; Atsukawa 2016; Barchetta 2016; Foroughi 2016; Lorvand Amiri 2016; Pilz 2016). The remaining seven trials were described as being randomised, but the method used for sequence generation was not described or was insufficiently described.
Nine trials described the method used to conceal allocation adequately (Shiomi 1999a; Abu‐Mouch 2011; Nimer 2012; Sharifi 2014; Esmat 2015; Barchetta 2016; Lorvand Amiri 2016; Pilz 2016; Vosoghinia 2016). The remaining six trials were described as being randomised, but the method used for allocation concealment was not described or was insufficiently described.
Blinding
Five trials performed and adequately described the blinding of participants and personnel (Sharifi 2014; Esmat 2015; Barchetta 2016; Lorvand Amiri 2016; Pilz 2016). Eight trials did not blind participants and personnel (Mobarhan 1984; Shiomi 1999a; Shiomi 1999b; Abu‐Mouch 2011; Nimer 2012; Yokoyama 2014; Atsukawa 2016; Vosoghinia 2016), while in two trials the method used for blinding of participants and personnel was not described or was insufficiently described (Xing 2013; Foroughi 2016).
Four trials performed and adequately described the blinding of outcome assessors (Sharifi 2014; Esmat 2015; Barchetta 2016; Pilz 2016). The method for blinding of outcome assessors for the remaining 11 trials was not described or was insufficiently described.
Incomplete outcome data
Twelve trials adequately addressed incomplete outcome data (Mobarhan 1984; Shiomi 1999a; Shiomi 1999b; Abu‐Mouch 2011; Nimer 2012; Xing 2013; Yokoyama 2014; Sharifi 2014; Foroughi 2016; Lorvand Amiri 2016; Pilz 2016; Vosoghinia 2016). In three trials, the information was insufficient to allow assessment of whether missing data in combination with the method used to handle missing data were likely to induce bias on the effect estimate (Esmat 2015; Atsukawa 2016; Barchetta 2016).
Selective reporting
Seven trials reported the outcomes stated in their respective protocols (Mobarhan 1984; Abu‐Mouch 2011; Barchetta 2016; Foroughi 2016; Lorvand Amiri 2016; Pilz 2016; Vosoghinia 2016). It was unclear whether the other six trials reported all predefined and clinically relevant and reasonably expected outcomes (Nimer 2012; Xing 2013; Yokoyama 2014; Sharifi 2014; Esmat 2015; Atsukawa 2016). The study authors did not report all predefined outcomes fully in two trials (Shiomi 1999a; Shiomi 1999b).
For‐profit bias
Six trials reported how they were funded and appeared to be free of industry sponsorship or other type of for‐profit support that may bias the results of the trials (Xing 2013; Sharifi 2014; Barchetta 2016; Foroughi 2016; Pilz 2016; Vosoghinia 2016). Eight trials may not have been free of for‐profit bias as they did not provide any information on clinical trial support or sponsorship (Shiomi 1999a; Shiomi 1999b; Abu‐Mouch 2011; Nimer 2012; Yokoyama 2014; Esmat 2015; Atsukawa 2016; Lorvand Amiri 2016). One trial was funded by industry (Mobarhan 1984) (Table 3).
Other potential sources of bias
We did not identify any certain signs of academic bias or other potential sources of bias in nine trials (Mobarhan 1984; Abu‐Mouch 2011; Nimer 2012; Xing 2013; Sharifi 2014; Yokoyama 2014; Esmat 2015; Atsukawa 2016; Barchetta 2016). Six trials may or may not have been free of other components that could put them at risk of bias (Shiomi 1999a; Shiomi 1999b; Foroughi 2016; Lorvand Amiri 2016; Pilz 2016; Vosoghinia 2016).
Effects of interventions
See: Table 1
Primary outcomes
All‐cause mortality
We are uncertain as to whether vitamin D has an effect on all‐cause mortality at end of follow‐up because the results were imprecise (Peto OR 0.69, 95% CI 0.09 to 5.40; I2 = 66%; 15 trials; 1034 participants; Analysis 1.1).
1.1. Analysis.
Comparison 1 Vitamin D versus placebo or no intervention, Outcome 1 All‐cause mortality.
Trial Sequential Analysis on mortality in the 15 vitamin D trials was performed based on a mortality rate in the control group of 10%, a relative risk reduction (RRR) of 28% in the intervention group, a type I error of 2.5%, and type II error of 10% (90% power). There was no diversity. The required information size was 6396 participants. The cumulative Z‐curve did not cross the trial sequential monitoring boundary for benefit or harm, and did not enter the trial sequential monitoring area for futility (Figure 5). The Trial Sequential Analysis‐adjusted CI was 0.00 to 2534.2.
5.

Trial Sequential Analysis on all‐cause mortality up to 1.4‐year follow‐up in 15 vitamin D trials, based on mortality rate in the control group of 10%, a relative risk reduction of 28% in the intervention group, a type I error of 2.5%, and type II error of 10% (90% power). There was no diversity. The required information size was 6396 participants. The cumulative Z‐curve (blue line) did not cross the trial sequential monitoring boundary for benefit or harm (red inward sloping lines) and did not enter the trial sequential monitoring area for futility (inner‐wedge with red outward sloping lines).
Sensitivity analyses taking attrition into consideration
In six trials, there were no losses to follow‐up (Shiomi 1999a; Shiomi 1999b; Abu‐Mouch 2011; Nimer 2012; Xing 2013; Foroughi 2016). In the remaining nine included trials, authors reported the exact numbers of participants with missing outcomes in the intervention and control groups. A total of 30 out of 518 (5.8%) participants had missing outcomes in the vitamin D group versus 30 of 516 (5.8%) participants in the control group.
'Best‐worst' case scenario
When we assumed that all participants lost to follow‐up in the experimental intervention group survived and all those with missing outcomes in the control intervention group died, vitamin D supplementation significantly decreased mortality (Peto OR 0.11, 95% CI 0.05 to 0.24; P < 0.00001; I2 = 0%; 1034 participants; 15 trials; Analysis 1.2).
1.2. Analysis.
Comparison 1 Vitamin D versus placebo or no intervention, Outcome 2 All‐cause mortality ('best‐worst' case and 'worst‐best' case scenarios).
'Worst‐best' case scenario
When we assumed that all participants lost to follow‐up in the experimental intervention group died and all those with missing outcomes in the control intervention group survived, vitamin D supplementation significantly increased mortality (Peto OR 7.80, 95% CI 3.67 to 16.57; P < 0.00001; I2 = 0%; 1034 participants; 15 trials; Analysis 1.2).
Liver‐related mortality
We are uncertain as to whether vitamin D has an important effect on liver‐related mortality because the result was imprecise (RR 1.62, 95% CI 0.08 to 34.7; 1 trial; 18 participants; Analysis 1.3). Due to few data, we did not conduct Trial Sequential Analysis which would only have revealed larger imprecision.
1.3. Analysis.
Comparison 1 Vitamin D versus placebo or no intervention, Outcome 3 Liver‐related mortality.
Serious adverse events
We are uncertain as to whether the active form of vitamin D, 1,25‐dihydroxyvitamin D, has an important effect on hypercalcaemia because the result was imprecise (RR 5.00, 95% CI 0.25 to 100.8; 1 trial; 76 participants; Analysis 1.4). We are also uncertain as to whether vitamin D has an important effect on myocardial infarction (RR 0.75, 95% CI 0.08 to 6.81; 2 trials; 86 participants; Analysis 1.4) or thyroiditis (RR 0.33, 95% CI 0.01 to 7.91; 1 trial; 68 participants; Analysis 1.4) because the results were imprecise. Due to few data, we did not conduct Trial Sequential Analysis which would only have revealed larger imprecision.
1.4. Analysis.
Comparison 1 Vitamin D versus placebo or no intervention, Outcome 4 Serious adverse events.
Secondary outcomes
Liver‐related morbidity
We found no data on liver‐related morbidity.
Health‐related quality of life
We found no data on health‐related quality of life.
Non‐serious adverse events
We are uncertain as to whether vitamin D3 has an important effect on glossitis because the results were imprecise (RR 3.70, 95% CI 0.16 to 87.58; 1 trial; 65 participants; Analysis 1.5).
1.5. Analysis.
Comparison 1 Vitamin D versus placebo or no intervention, Outcome 5 Non‐serious adverse events.
There were several reported non‐serious adverse events in people with chronic hepatitis C treated with combination of vitamin D and pegylated‐interferon and ribavirin. These were similar in both groups and consistent with typical interferon‐ribavirin‐induced systemic symptoms such as nausea, headache, insomnia, chills, myalgia, pyrexia, pruritus, mild neutropenia, mild thrombocytopenia, and mild anaemia (Abu‐Mouch 2011; Nimer 2012; Yokoyama 2014; Esmat 2015; Atsukawa 2016).
Exploratory outcomes
Rapid virological response in people with chronic viral hepatitis C
We are uncertain as to whether vitamin D3 has an important effect on rapid virological response in people with chronic hepatitis C because the results were imprecise (RR 0.70, 95% CI 0.52 to 0.94, I2 = 0%; 2 trials; 187 participants; Analysis 1.6).
1.6. Analysis.
Comparison 1 Vitamin D versus placebo or no intervention, Outcome 6 Failure of rapid virological response.
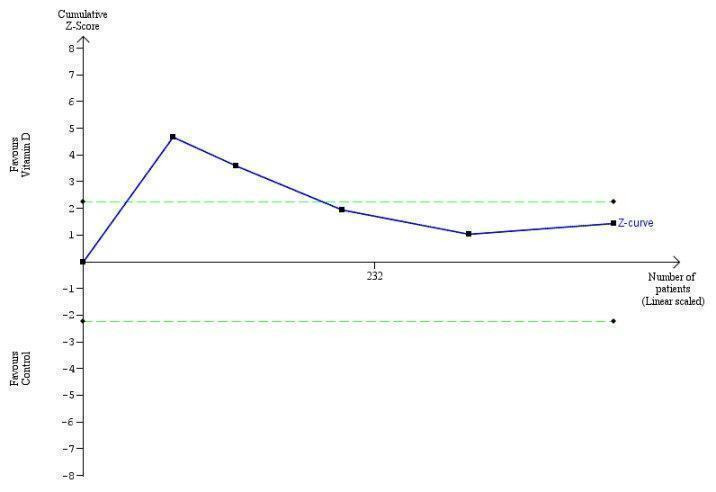
Trial Sequential Analysis on rapid virological response in the two vitamin D trials was performed based on a mortality rate in the control group of 5%, a relative risk reduction (RRR) of 30% in the intervention group, a type I error of 2.5%, and type II error of 10% (90% power). There was no diversity. The required information size was 11958 participants. The cumulative Z‐curve crossed the conventional monitoring boundary for benefit. The trial sequential monitoring boundary is ignored due to little information use (1.56%) (Figure 6).
6.
Trial Sequential Analysis on rapid virological response in the two vitamin D trials was performed based on a mortality rate in the control group of 5%, a relative risk reduction (RRR) of 30% in the intervention group, a type I error of 2.5%, and type II error of 10% (90% power). There was no diversity. The required information size was 11958 participants. The cumulative Z‐curve crossed the conventional monitoring boundary for benefit. The trial sequential monitoring boundary is ignored due to little information use (1.56%).
Early virological response in people with chronic viral hepatitis C
We are uncertain as to whether the vitamin D3 has an important effect on early virological response in people with chronic hepatitis C because the results were imprecise (RR 0.10, 95% CI 0.03 to 0.33; 2 trials; 140 participants; Analysis 1.7).
1.7. Analysis.
Comparison 1 Vitamin D versus placebo or no intervention, Outcome 7 Failure of early virological response.
Trial Sequential Analysis on early virological response in the two vitamin D trials was performed based on a mortality rate in the control group of 5%, a relative risk reduction (RRR) of 30% in the intervention group, a type I error of 2.5%, and type II error of 10% (90% power). There was no diversity. The required information size was 11958 participants. The cumulative Z‐curve crossed the conventional monitoring boundary for benefit. The trial sequential monitoring boundary is ignored due to little information use (1.17%) (Figure 7).
7.
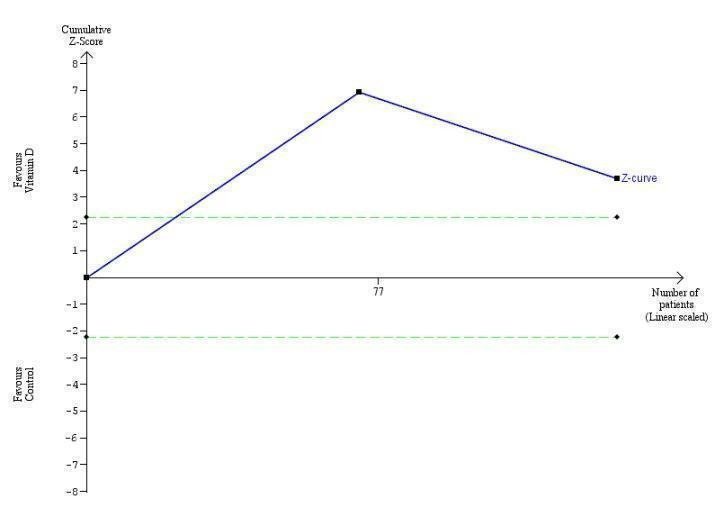
Trial Sequential Analysis on early virological response in the two vitamin D trials was performed based on a mortality rate in the control group of 5%, a relative risk reduction (RRR) of 30% in the intervention group, a type I error of 2.5%, and type II error of 10% (90% power). There was no diversity. The required information size was 11958 participants. The cumulative Z‐curve crossed the conventional monitoring boundary for benefit. The trial sequential monitoring boundary is ignored due to little information use (1.17%).
Sustained virological response in people with chronic viral hepatitis C
Vitamin D3 had no significant effect on sustained virological response in people with chronic hepatitis C (RR 0.59, 95% CI 0.28 to 1.21, I2 = 84%; 5 trials; 422 participants; Analysis 1.8).
1.8. Analysis.
Comparison 1 Vitamin D versus placebo or no intervention, Outcome 8 Failure of sustained virological response.
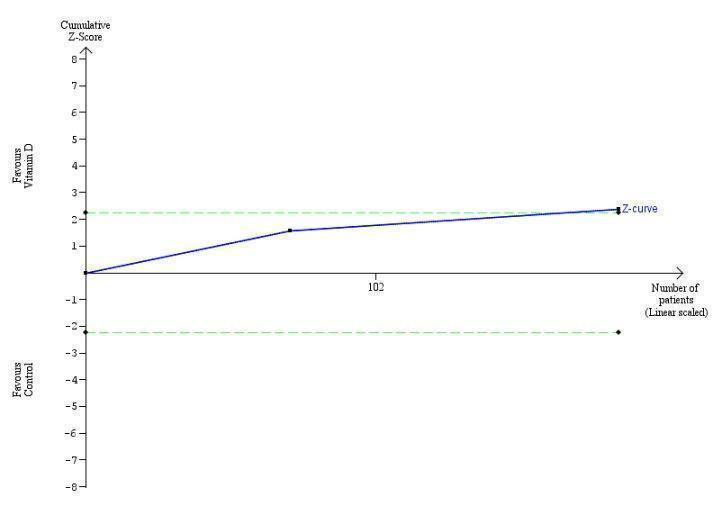
Trial Sequential Analysis on sustained virological response in the five vitamin D trials was performed based on a mortality rate in the control group of 5%, a relative risk reduction (RRR) of 30% in the intervention group, a type I error of 2.5%, and type II error of 10% (90% power). There was no diversity. The required information size was 69798 participants. The trial sequential monitoring boundary is ignored due to little information use (0.6%) (Figure 8).
8.
Trial Sequential Analysis on sustained virological response in the five vitamin D trials was performed based on a mortality rate in the control group of 5%, a relative risk reduction (RRR) of 30% in the intervention group, a type I error of 2.5%, and type II error of 10% (90% power). There was no diversity. The required information size was 69798 participants. The trial sequential monitoring boundary is ignored due to little information use (0.45%).
Acute cellular rejection in liver transplant recipients
We are uncertain as to whether the 1,25‐dihydroxyvitamin D has an important effect on acute cellular rejection in liver transplant recipients because the results were imprecise (RR 0.33, 95% CI 0.04 to 2.62; 1 trial; 75 participants; Analysis 1.9).
1.9. Analysis.
Comparison 1 Vitamin D versus placebo or no intervention, Outcome 9 Acute cellular rejection in liver transplant recipients.
Trial Sequential Analysis on rapid acute cellular rejection in the one vitamin D trial was performed based on a mortality rate in the control group of 5%, a relative risk reduction (RRR) of 30% in the intervention group, a type I error of 2.5%, and type II error of 10% (90% power). There was no diversity. The required information size was 8979 participants. The cumulative Z‐curve did not cross the conventional monitoring boundary. The trial sequential monitoring boundary is ignored due to little information use (0.84%) (Figure 9).
9.
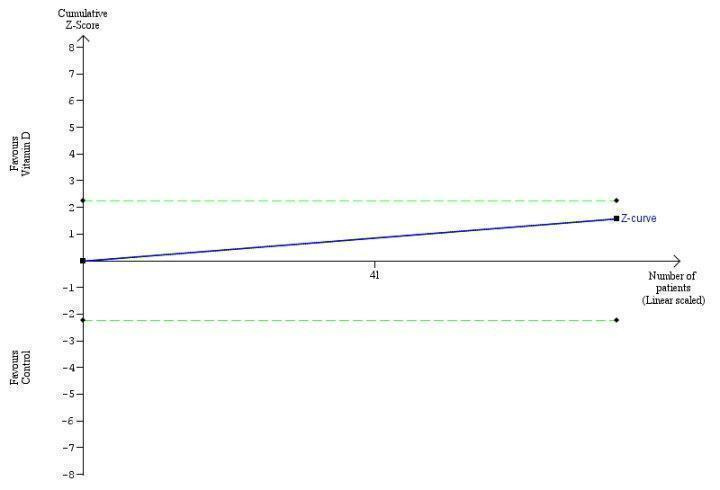
Trial Sequential Analysis on acute cellular rejection in the one vitamin D trial was performed based on a mortality rate in the control group of 5%, a relative risk reduction (RRR) of 30% in the intervention group, a type I error of 2.5%, and type II error of 10% (90% power). There was no diversity. The required information size was 11958 participants. The cumulative Z‐curve did not cross the conventional monitoring boundary. The trial sequential monitoring boundary is ignored due to little information use (0.84%).
Vitamin D status
Vitamin D supplementation significantly increased vitamin D status of participants in the intervention group (MD 17.24 ng/mL, 95% CI 12.5 to 22.0, I2 = 94%; 6 trials; 424 participants; Analysis 1.10).
1.10. Analysis.
Comparison 1 Vitamin D versus placebo or no intervention, Outcome 10 Vitamin D status (ng/mL).
Bone mineral density
We were unable to extract relevant data from the included trials.
Biochemical indices
Vitamin D had no significant effect on activity of aspartate aminotransferase (MD ‐1.40 IU/L, 95% CI ‐2.88 to 0.08; I2 = 62%; 6 trials; 313 participants); and activity of alanine aminotransferase (MD ‐0.52 IU/L, 95% CI ‐5.10 to 4.06, I2 = 91%; 6 trials; 313 participants) (Analysis 1.11). We are uncertain as to whether vitamin D has an important effect on the following biochemical indices because the results were imprecise: serum activity of alkaline phosphatase (MD 7.39 IU/L, 95% CI ‐39.89 to 54.67; I2 = 96%; 2 trials; 96 participants); serum activity of gamma‐glutamyl transpeptidase (MD 3.64 IU/L, 95% CI 0.33 to 6.96; I2 = 0%; 2 trials; 101 participants); serum concentration of albumin (MD ‐0.10 g/L, 95% CI ‐0.40 to 0.20, I2 = 0%; 2 trials, 48 participants); serum concentration of bilirubin (MD 0.38 mg/dL, 95% CI 0.21 to 0.55, I2 = 0%; 2 trials; 48 participants); serum concentration of triglyceride (MD 23.69 mg/dL, 95% CI ‐13.90 to 61.27, I2 = 95%; 2 trials; 115 participants); serum concentration of cholesterol (MD 2.75 mg/dL, 95% CI ‐4.75 to 10.25; 1 trial; 55 participants); and serum concentration of calcium (MD 2.01 mg/dL, 95% CI ‐0.53 to 4.56, I2 = 97%; 2 trials; 72 participants (Analysis 1.11).
1.11. Analysis.
Comparison 1 Vitamin D versus placebo or no intervention, Outcome 11 Biochemical indices.
Summary of Findings
'Table 1 presents our findings on the outcomes: all‐cause mortality with mean follow‐up of 0.6 years; liver‐related mortality with a mean follow‐up of one year; serious adverse events such as hypercalcaemia (mean follow‐up of one year), myocardial infarction (mean follow‐up of mean 0.6 years), thyroiditis (mean follow‐up of 0.2 years), failure of sustained virological response (mean follow‐up of mean 0.9 years), glossitis (mean follow‐up of 0.5 years), acute cellular rejection in liver transplant recipients (mean follow‐up of 0.08 years). The quality of the evidence of the presented outcomes is very low.
Discussion
Summary of main results
We are uncertain as to whether vitamin D supplements in the form of vitamin D3, vitamin D2, 1,25‐dihydroxyvitamin D, or 25‐dihydroxyvitamin D have significant effect on all‐cause mortality, liver‐related mortality, or serious or non‐serious adverse events because the results were imprecise. Neither did vitamin D seem beneficial in increasing the number of people with sustained virological response or decreasing the number of people with acute cellular rejection in liver transplant recipients. Analyses of three trials in people with chronic hepatitis C suggested that we are uncertain as to whether vitamin D3 might be beneficial in increasing the number of people with rapid and early virological response because the results were imprecise (Abu‐Mouch 2011; Atsukawa 2016; Vosoghinia 2016). Vitamin D status of participants with chronic liver diseases was significantly increased after supplementation with vitamin D. We found no significant changes in biochemical indices after supplementation. There was insufficient evidence on the effect of vitamin D supplementation on liver‐related morbidity and health‐related quality of life in people with chronic liver diseases.
The results of our systematic review should be interpreted with great caution because all included trials were at high risk of bias. Due to the small number of included trials and selective outcome reporting, we were unable to conduct subgroup analyses according to the different forms of vitamin D. The number of people and outcome data were insufficient which adds to our risk of making both type I and type II errors due to paucity of data (Keus 2010). Our Trial Sequential Analysis CI revealed that we have insufficient information for making valid conclusions.
Although vitamin D deficiency is considered common in people with a variety of liver diseases (Chen 2014; Iruzubieta 2014; Elangovan 2017), we found no convincing evidence that vitamin D supplementation has therapeutic impact in chronic liver diseases.
Overall completeness and applicability of evidence
Our published protocol described our plan to analyse the effect of vitamin D on chronic liver diseases in randomised trials in adults (Bjelakovic 2015). We included all eligible randomised trials up to January 2017. We found only a small number of randomised trials with a small number of participants. All trials were at high risk of bias. We found significant statistical heterogeneity in some of our analyses. This decreases the precision and power of our analyses (Higgins 2011; Turner 2013). Our analyses revealed that outcome reporting was missing on approximately 6% of trial participants. Accordingly, our 'best‐worst case' and 'worst‐best case' analyses revealed that our results were compatible with both a large beneficial effect and a large detrimental effect of vitamin D on mortality. Although these extreme sensitivity analyses are unlikely analyses, they reveal how missing participants can substantially change our findings of great benefit into a null effect or maybe even harm. Therefore, we advise critical application of our findings.
Quality of the evidence
Our review followed the overall plan of a published, peer‐reviewed Cochrane protocol (Bjelakovic 2015). We were unable to find earlier meta‐analyses of trials of vitamin D on chronic liver diseases in the literature. We conducted a thorough review in accordance with Cochrane methodology (Higgins 2011) and implemented findings of methodological studies (Schulz 1995; Moher 1998; Kjaergard 2001; Wood 2008; Savović 2012a; Savović 2012b; Lundh 2017).
We repeatedly searched several databases and contacted authors of trials and industry producing vitamin D supplements. Therefore, we believe that we have not overlooked important randomised clinical trials. As stated below, we may have missed trials only reported to regulatory authorities. However, such trials are often neutral or negative. We found no significant evidence of publication bias (Johnson 2007). However, only about every second trial is reported (Gluud 2008), so we cannot exclude reporting biases. We have also performed Trial Sequential Analysis, based on the estimation of the diversity‐adjusted required information size to avoid an undue risk of random errors in a cumulative meta‐analysis and to prevent premature statements of superiority of vitamin D or of lack of effect (Brok 2008; Wetterslev 2008; Brok 2009; Thorlund 2009; Wetterslev 2009; Thorlund 2011a; Thorlund 2011b; TSA 2017; Wetterslev 2017).
We used GRADE to construct a 'Summary of findings' table. The GRADE assessments showed that the quality if the evidence was very low for all‐cause mortality, liver‐related mortality, serious adverse events (hypercalcaemia, myocardial infarction, thyroiditis), failure of sustained virological response, glossitis, or acute cellular rejection in liver transplant recipients. We applied the results of Trial Sequential Analysis for rating imprecision. If there was insufficient evidence to reach a conclusion, that is, if the Trial Sequential Analysis indicated that the required information size had not been reached, we downgraded the quality of the evidence. We also used risk of attrition bias for rating imprecision, significant between‐trial heterogeneity for rating inconsistency, and design errors for rating indirectness.
Potential biases in the review process
Certain limitations of this review warrant consideration. As with all systematic reviews, our findings and interpretations are limited by the quality and quantity of available evidence on the effects of vitamin D on chronic liver diseases. Despite extensive speculations in the literature and a number of epidemiological studies that claimed possible beneficial effects of vitamin D in people with chronic liver diseases, only few randomised trials assessed such effects. The duration of supplementation and duration of follow‐up were short in some of the included trials. This may make it difficult to detect any effects, beneficial or harmful. All 15 included trials were at high risk of bias. Instead of reporting clinical outcomes, most of the trials based their analysis on surrogate outcomes. Many of the included trials were not adequately powered. These factors corrupt the validity of our results (Schulz 1995; Moher 1998; Kjaergard 2001; Wood 2008; Savović 2012a; Savović 2012b). Adverse events were insufficiently reported. It has been pointed out that adverse events are very often neglected in randomised trials (Ioannidis 2009). In a number of trials in people with chronic hepatitis C, vitamin D was administered in combination with pegylated‐interferon and ribavirin, which made it difficult to judge its beneficial or harmful effects, or to which intervention one should assign any of the observed adverse events. Significant between‐trial heterogeneity was present in some of our meta‐analyses. This may emphasise the inconsistency of our findings and may additionally question our review findings.
Most of included trials used vitamin D3, three trials tested 1,25‐dihydroxyvitamin D, one trial tested vitamin D2, and one trial tested 25‐dihydroxyvitamin D. We were unable to perform subgroup analyses comparing different forms of vitamin D used for supplementation.
We did not search files of regulatory agencies such as Food and Drug Administration and European Medicine Agency. This may bias our selection of trials. We did not conduct searches after observational studies on harms. This may bias our findings towards benefits of the interventions with less focus on harms (Storebø 2015).
Different types of bias can influence the results of our meta‐analyses including selective reporting of some results in trial publications (Chan 2004; Williamson 2005; Furukawa 2007). Outcome reporting in the included trials was insufficient and inconsistent. There are several possible explanations for selective reporting of outcomes in randomised trials. Trials in which the outcome was not reported may not have measured outcomes of interest. Researchers may not have reported unexpected results or results may have not satisfied sponsors (Lesser 2007). Pharmaceutical companies provided vitamin D in one of the 15 included trials. This number may be higher because this information was not available in seven trials. It could be that researchers have selectively omitted to report some of the outcomes. We are well aware of the difficulties in collecting data on outcomes in clinical trials that focus on safety and efficacy evaluations. The worst result of outcome reporting bias and suppression of some significant or non‐significant findings could be the use of harmful interventions. The results of meta‐analyses may underestimate the true effects of interventions when there is exaggerated outcome reporting bias. One would wish that results of randomised clinical trials are reported in greater details (Nordic Trial Alliance 2015). In some of the trials, instead of full reporting, we found partial or qualitative reporting. The huge human efforts of investigators and the high cost of randomised clinical trials should be justified with more rigour in their reporting. In spite of the large investment in the reviewed trials, a number of questions remain unanswered.
Other types of bias, such as academic bias, bias from trials with deficiencies in the trial design (Schulz 1995; Moher 1998; Kjaergard 2001), and small trial bias (Siersma 2007), could probably influence our results. Meta‐analysis of randomised trials increases the power and precision of the estimated intervention effect, but this effect may be influenced by systematic errors or random errors and can lead to a report of false significant results (Gluud 2006; Wetterslev 2008). It is probable that the results of our meta‐analysis are influenced by random errors and systematic errors.
A number of design errors may influence our results. First, abuse of surrogate outcomes. In most trials, the authors used non‐validated surrogate outcomes such as biochemical indices, liver steatosis, or bone mineral density, assuming that normal levels are beneficial. The ideal primary outcome in randomised clinical trials is one that is relevant to the person's quality of life or course of disease. Relying on non‐validated potential surrogate outcomes is potentially dangerous when assessing new therapies (Gluud 2007; Garattini 2016). We lack validated surrogate outcome measures in hepatology. Some trials included in this review examined early, rapid, or sustained virological response as a surrogate outcome for successful treatment. Improved early, rapid, or sustained virological response do not definitely mean significant improvement in clinical outcomes (Gluud 2007; Jakobsen 2017). The use of new interventions in hepatology should not be justified until these have been confirmed to be beneficial on clinical outcomes (Gluud 2006; Jakobsen 2017). These issues could be resolved with the development and application of agreed sets of outcomes, known as core outcome sets (www.comet‐initiative.org). The increase in the number of hepato‐biliary randomised trials will never be considered a sufficient valuable source for data if aspects of trial design, such as sample size, completeness of data reporting, duration of follow‐up, and bias risk, are not improved.
Agreements and disagreements with other studies or reviews
Efforts in evaluating the benefits and harms of vitamin D supplementation in people with chronic liver diseases resulted in neutral results. It is likely that vitamin D deficiency is not a pathogenetic mechanism contributing to liver damage. There is also the possibility that vitamin D deficiency is the consequence but not the cause of chronic liver diseases. Inflammatory processes involved in the pathogenesis of chronic liver diseases, as well as other chronic diseases, reduce serum vitamin D levels, which can explain their low vitamin D status (Autier 2014). Life style could also be related to vitamin D status (Skaaby 2016). Vitamin D supplementation had neutral effect on mortality which can be a result that included randomised clinical trials focused on a group of people with well‐compensated liver diseases at low risk of mortality.
Four trials in the present review included people with liver cirrhosis. We found no evidence that vitamin D supplementation may decrease mortality in people with liver cirrhosis. This finding is contrary to earlier claims in the literature that vitamin D deficiency is associated with increased mortality in people with advanced cirrhosis (Putz‐Bankuti 2012; Wang 2013; Stokes 2014; Finkelmeier 2015; Paternostro 2017). It seems that vitamin D status in people with liver cirrhosis is not only related to liver dysfunction (Lim 2012). Earlier it was thought that people with cholestatic liver disease were more likely to be vitamin D deficient. It is now evident that people with liver cirrhosis, non‐alcoholic fatty liver disease, and chronic hepatitis C are also at risk for low vitamin D levels. Vitamin D deficiency in these people is likely to be multifactorial in aetiology including decreased intake and absorption, altered activity of hepatic 25‐hydroxylase, and insufficient exposure to sunlight (Lim 2012). Trials including people with liver cirrhosis reported biochemical indices after vitamin D supplementation. There was no significant difference between supplemented and control group in most of the recorded values.
Our review did not confirm suggestions that vitamin D supplementation can be beneficial as an adjuvant to other drugs such as interferon or ribavirin (Luong 2012). Meta‐analysis of six trials that included participants with chronic hepatitis C revealed no effect of vitamin D3 on sustained virological response, and beneficial effect on rapid and early virological response. One study suggested no effect of vitamin D supplementation in people with advanced chronic hepatitis C (Corey 2012). Oliveira and colleagues observed no association between vitamin D and the degree of liver fibrosis in people with chronic hepatitis C (Oliveira 2017). Our results are contrary to the result of one meta‐analysis that found a positive relationship between high vitamin D status and sustained virological response in people with hepatitis C virus infection (Villar 2013), and in agreement with the results of another meta‐analysis by Kitson and colleagues that found that baseline vitamin D status was not associated with sustained virological response in people with chronic hepatitis C (Kitson 2014). However, due to paucity of data, we warn that our results may be deeply influenced by systematic and random errors. We found no randomised trials that tested vitamin D supplementation in people with chronic hepatitis B. Farnik and colleagues found that low vitamin D levels were associated with increased hepatitis B virus replication in people with chronic hepatitis B (Farnik 2013), while Mahamid and colleagues showed a correlation between normal vitamin D levels and spontaneous hepatitis B surface antigen seroclearance (Mahamid 2013). Hoan and colleagues observed vitamin D deficiency in the majority of hepatitis B‐infected people (Hoan 2016). However, whether vitamin D deficiency is the cause or is a consequence of chronic hepatitis is still unknown (Bitetto 2011).
Non‐alcoholic fatty liver disease has become the most common form of chronic liver disease in high‐income countries (Sayiner 2016; Younossi 2016). There is a growing interest to explore the relationship between vitamin D deficiency and severity of non‐alcoholic fatty liver disease. Four trials included in our review administered vitamin D3 to participants with non‐alcoholic fatty liver disease. We were unable to extract data on clinically important outcomes from these trials. We found no significant effect of vitamin D3 on surrogate outcomes such as liver function tests. Two meta‐analysis of case‐control and cross‐sectional studies found that people with non‐alcoholic fatty liver disease were more likely to be vitamin D deficient than people in the control groups, suggesting that vitamin D may play a role in the development of non‐alcoholic fatty liver disease (Eliades 2013; Wang 2015). However, we found that vitamin D supplementation may not be beneficial in this population.
We lack sufficient evidence on the effect of vitamin D supplementation on liver‐related morbidity and health‐related quality of life.
Although two included randomised trials analysed the influence of vitamin D supplementation on bone mineral density in people with liver cirrhosis, we were unable to extract relevant data from published reports, and the authors did not respond to our request for additional information. One systematic review and meta‐analysis concluded that vitamin D supplementation for osteoporosis prevention in community‐dwelling adults without specific risk factors for vitamin D deficiency seemed to be inappropriate (Reid 2014). In the same way, another updated systematic evidence review for the US Preventive Service Task Force found no benefit from vitamin D supplementation for prevention of cancer and cardiovascular disease (Fortmann 2013). Bolland and colleagues found that vitamin D did not reduce skeletal, vascular, or cancer outcomes (Bolland 2014).
It seems that health claims are again ahead of the evidence. Great enthusiasm for vitamin D as a cure for a myriad of diseases, reinforced by observational studies showing that healthy people have higher vitamin D status, has not been supported by the evidence obtained from randomised clinical trials. It is very likely that low vitamin D status is not the cause but rather the consequence of chronic diseases (Grey 2010; Guallar 2010; Harvey 2012; Kupferschmidt 2012; Autier 2014). We have now some evidence that vitamin D status is a biomarker of health status (Skaaby 2016). It is likely that less healthy people are obese, less active, and more sunlight‐deprived than healthier people, and therefore have lower vitamin D status (Lucas 2005; Bolland 2006; Grey 2010; Autier 2016; Skaaby 2016). It seems that the cautionary tale of antioxidant supplements is reiterated (Garattini 2016). Current evidence does not support the use of vitamin D supplementation to prevent or cure chronic liver diseases. Results of ongoing randomised trials will help us further in resolving the vitamin D enigma. Until then, it is prudent to get vitamin D from sun exposure and from a balanced diet.
Authors' conclusions
Implications for practice.
We are uncertain as to whether vitamin D supplements in the form of vitamin D3, vitamin D2, 1,25‐dihydroxyvitamin D, or 25‐dihydroxyvitamin D have an important effect on all‐cause mortality, liver‐related mortality, or serious or non‐serious adverse events because the results were imprecise. Neither was vitamin D beneficial in increasing the number of people with sustained virological response or decreasing the number of people with acute cellular rejection in liver transplant recipients. Vitamin D status of trial participants with chronic liver diseases was significantly increased after supplementation with vitamin D. We are uncertain as to whether vitamin D has an important effect on biochemical indices because the results were imprecise. There is no evidence on the effect of vitamin D supplementation on liver‐related morbidity and health‐related quality of life. Our conclusions are based on few trials with an insufficient number of participants and on a lack of data on clinically important outcomes. In addition, the analysed trials are at high risk of bias with significant intertrial heterogeneity. The overall quality of evidence is very low.
Implications for research.
We need more evidence before drawing final conclusions on the effect of vitamin D on chronic liver diseases, especially in people with cholestatic, autoimmune, and end‐stage liver diseases. More randomised trials assessing a longer duration of vitamin D intervention and different forms of vitamin D with greater number of participants, assessing clinical outcomes, may also be needed. The effects of vitamin D on health‐related quality of life deserves further investigation. Future trials ought to be designed according to the SPIRIT statement (Standard Protocol Items: Recommendations for Interventional Trials; www.spirit‐statement.org/) and reported according to the CONSORT statement (www.consort‐statement.org).
Notes
Cochrane Reviews can be expected to have a high percentage of overlap in the methods section because of standardised methods. In addition, overlap may be observed across some of our protocols and reviews as they share at least three common authors.
Acknowledgements
We thank Marija Bjelakovic for her work on the review.
Cochrane Review Group funding acknowledgement: the Danish State is the largest single funder of The Cochrane Hepato‐Biliary Group through its investment in The Copenhagen Trial Unit, Centre for Clinical Intervention Research, Rigshospitalet, Copenhagen University Hospital, Denmark. Disclaimer: the views and opinions expressed in this review are those of the authors and do not necessarily reflect those of the Danish State or The Copenhagen Trial Unit.
Peer reviewers: Tony Bruns, Germany; Sohail Mushtaq, UK. Contact and sign‐off editor: Vanja Giljaca, UK.
Appendices
Appendix 1. Search strategies
| Database | Search performed | Search strategy |
| The Cochrane Hepato‐Biliary Group Controlled Trials Register | January 2017 | ('vitamin D*' OR calciferol) AND (liver OR hepat* OR cirrhosis OR fibrosis) (11 hits) |
| Cochrane Central Register of Controlled Trials (CENTRAL) in the Cochrane Library (2016, Issue 12) | January 2017 | #1 MeSH descriptor Vitamin Dexplode all trees 1664 #2 vitamin d or calciferol 4055 #3 (#1 OR #2) 4641 #4 MeSH descriptor Liver Diseasesexplode all trees 8256 #5 liver OR hepat* OR cirrhosis OR fibrosis 49031 #6 (#4 OR #5) 49115 #7 (#3 AND #6) 636 (371 hits) |
| MEDLINE (OvidSP) | January 2017 | 1. exp Vitamin D/ 2. (vitamin d or calciferol).mp. [mp=protocol supplementary concept, rare disease supplementary concept, title, original title, abstract, name of substance word, subject heading word, unique identifier] 3. 1 or 2 4. exp Liver Diseases/ 5. (liver or hepat* or cirrhosis or fibrosis).mp. [mp=protocol supplementary concept, rare disease supplementary concept, title, original title, abstract, name of substance word, subject heading word, unique identifier] 6. 4 or 5 7. 3 and 6 8. (random* or blind* or placebo* or meta‐analysis).mp. [mp=protocol supplementary concept, rare disease supplementary concept, title, original title, abstract, name of substance word, subject heading word, unique identifier] 9. 7 and 8 (119 hits) |
| Embase (OvidSP) | January 2017 | 1. exp vitamin D/ 2. (vitamin d or calciferol).mp. [mp=title, abstract, subject headings, heading word, drug trade name, original title, device manufacturer, drug manufacturer] 3. 1 or 2 4. exp liver disease/ 5. (liver or hepat* or cirrhosis or fibrosis).mp. [mp=title, abstract, subject headings, heading word, drug trade name, original title, device manufacturer, drug manufacturer] 6. 4 or 5 7. 3 and 6 8. (random* or blind* or placebo* or meta‐analysis).mp. [mp=title, abstract, subject headings, heading word, drug trade name, original title, device manufacturer, drug manufacturer] 9. 7 and 8 (572 hits) |
| Science Citation Index Expanded and Conference Proceedings Citation Index ‐ Science | January 2017 | # 1 43,904 TS=(vitamin D OR calciferol) # 2 >100,000 TS=(liver OR hepat* OR cirrhosis OR fibrosis) # 3 2,954 #2 AND #1 # 4 >100,000 TS=(random* or blind* or placebo* or meta‐analysis) # 5 300 #4 AND #3 (300 hits) |
Data and analyses
Comparison 1. Vitamin D versus placebo or no intervention.
| Outcome or subgroup title | No. of studies | No. of participants | Statistical method | Effect size |
|---|---|---|---|---|
| 1 All‐cause mortality | 15 | 1034 | Peto Odds Ratio (Peto, Fixed, 95% CI) | 0.70 [0.09, 5.38] |
| 2 All‐cause mortality ('best‐worst' case and 'worst‐best' case scenarios) | 15 | Peto Odds Ratio (Peto, Fixed, 95% CI) | Subtotals only | |
| 2.1 'Best‐worst' case scenario | 15 | 1034 | Peto Odds Ratio (Peto, Fixed, 95% CI) | 0.11 [0.05, 0.24] |
| 2.2 'Worst‐best' case scenario | 15 | 1034 | Peto Odds Ratio (Peto, Fixed, 95% CI) | 7.80 [3.67, 16.57] |
| 3 Liver‐related mortality | 1 | 18 | Risk Ratio (M‐H, Random, 95% CI) | 1.62 [0.08, 34.66] |
| 4 Serious adverse events | 3 | Risk Ratio (M‐H, Random, 95% CI) | Subtotals only | |
| 4.1 Hypercalcaemia | 1 | 76 | Risk Ratio (M‐H, Random, 95% CI) | 5.0 [0.25, 100.80] |
| 4.2 Myocardial infarction | 2 | 86 | Risk Ratio (M‐H, Random, 95% CI) | 0.75 [0.08, 6.81] |
| 4.3 Thyroiditis | 1 | 68 | Risk Ratio (M‐H, Random, 95% CI) | 0.33 [0.01, 7.91] |
| 5 Non‐serious adverse events | 1 | Risk Ratio (M‐H, Random, 95% CI) | Subtotals only | |
| 5.1 Glossitis | 1 | 65 | Risk Ratio (M‐H, Random, 95% CI) | 3.70 [0.16, 87.58] |
| 6 Failure of rapid virological response | 2 | 187 | Risk Ratio (M‐H, Random, 95% CI) | 0.70 [0.52, 0.94] |
| 7 Failure of early virological response | 2 | 140 | Risk Ratio (M‐H, Random, 95% CI) | 0.10 [0.03, 0.33] |
| 8 Failure of sustained virological response | 5 | 422 | Risk Ratio (M‐H, Random, 95% CI) | 0.59 [0.28, 1.21] |
| 9 Acute cellular rejection in liver transplant recipients | 1 | 75 | Risk Ratio (M‐H, Random, 95% CI) | 0.33 [0.04, 2.62] |
| 10 Vitamin D status (ng/mL) | 6 | 424 | Mean Difference (IV, Random, 95% CI) | 17.24 [12.46, 22.02] |
| 11 Biochemical indices | 6 | Mean Difference (IV, Random, 95% CI) | Subtotals only | |
| 11.1 Aspartate aminotransferase (IU/L) | 6 | 313 | Mean Difference (IV, Random, 95% CI) | ‐1.40 [‐2.88, 0.08] |
| 11.2 Alanine aminotransferase (IU/L) | 6 | 313 | Mean Difference (IV, Random, 95% CI) | ‐0.52 [‐5.10, 4.06] |
| 11.3 Alkaline phosphatases (IU/L) | 2 | 96 | Mean Difference (IV, Random, 95% CI) | 7.39 [‐39.89, 54.67] |
| 11.4 Gamma‐glutamyl transpeptidase (IU/L) | 2 | 101 | Mean Difference (IV, Random, 95% CI) | 3.64 [0.33, 6.96] |
| 11.5 Albumin (g/L) | 2 | 48 | Mean Difference (IV, Random, 95% CI) | ‐0.10 [‐0.40, 0.20] |
| 11.6 Bilirubin (mg/dL) | 2 | 48 | Mean Difference (IV, Random, 95% CI) | 0.38 [0.21, 0.55] |
| 11.7 Triglyceride (mg/dL) | 2 | 115 | Mean Difference (IV, Random, 95% CI) | 23.69 [‐13.90, 61.27] |
| 11.8 Cholesterol (mg/dL) | 1 | 55 | Mean Difference (IV, Random, 95% CI) | 2.75 [‐4.75, 10.25] |
| 11.9 Calcium (mg/dL) | 2 | 72 | Mean Difference (IV, Random, 95% CI) | 2.01 [‐0.53, 4.56] |
Characteristics of studies
Characteristics of included studies [ordered by study ID]
Abu‐Mouch 2011.
| Methods | Randomised clinical trial with parallel group design (2 groups). | |
| Participants | 72 participants (44% women), aged 18 to 65 years, mean age 47 years, with chronic HCV genotype 1. Inclusion criteria: aged 18 to 65 years; chronic HCV genotype 1 infection; no previous treatment for HCV; seronegative for HBV, HDV, and HIV infections; absolute neutrophil count > 1500/mm3; platelet count > 90,000/mm3; and normal haemoglobin level. Exclusion criteria: decompensated liver disease (cirrhosis with a Child‐Pugh score > 9), another cause of clinically significant liver disease, or presence of hepatocellular carcinoma. |
|
| Interventions |
Intervention: PEG‐IFN‐α‐2b (1.5 μg/kg body weight) + oral ribavirin 1000 mg/day (for body weight < 75 kg) or 1200 mg/day (for body weight > 75 kg) and vitamin D3 2000 IU/day (n = 36). Control: PEG‐IFN‐α‐2b (1.5 μg/kg body weight) + oral ribavirin 1000 mg/day (for body weight < 75 kg) or 1200 mg/day (for body weight > 75 kg) (n = 36). For 48 weeks. All participants had ≥ 1 follow‐up visit at 24 weeks after completion of treatment. |
|
| Outcomes | Outcomes reported in abstract of publication. Primary outcome: SVR defined as undetectable HCV‐RNA at 24 weeks' post‐treatment. Secondary outcomes: treatment efficacy at weeks 4 (RVR), and 12 (EVR) during therapy, and 24 weeks after cessation of therapy (SVR). |
|
| Stated aim of study | To determine whether adding vitamin D improves HCV response to antiviral therapy. | |
| Notes | No participant discontinued treatment. Vitamin D3 (Vitamidyne D, Fischer Pharmaceuticals, Israel) given by oral drops for 4 weeks before initiation of antiviral treatment and after serum levels reached > 32 ng/mL in all participants in the treatment group. Registered at clinicaltrials.gov NCT00804752. Additional information received through personal communication with authors on 8 February 2017. |
|
| Risk of bias | ||
| Bias | Authors' judgement | Support for judgement |
| Random sequence generation (selection bias) | Low risk | Sequence generation performed using computer random number generation. |
| Allocation concealment (selection bias) | Low risk | Participant allocations could not have been foreseen in advance of, or during, enrolment. Allocation sequence hidden in sequentially numbered, opaque, and sealed envelopes. |
| Blinding of participants and personnel (performance bias) All outcomes | High risk | No blinding, and assessment of outcomes likely to be influenced by lack of blinding. |
| Blinding of outcome assessment (detection bias) All outcomes | High risk | No blinding, and assessment of outcomes likely to be influenced by lack of blinding. |
| Incomplete outcome data (attrition bias) All outcomes | Low risk | Missing data unlikely to make treatment effects depart from plausible values. |
| Selective reporting (reporting bias) | Low risk | All predefined outcomes reported fully. |
| For‐profit bias | Unclear risk | Trial may or may not have been free of for‐profit bias as no information on clinical trial support or sponsorship provided. |
| Other bias | Low risk | Trial appeared free of other factors that could put it at risk of bias. |
Atsukawa 2016.
| Methods | Open‐label randomised clinical trial with parallel group design (two groups) | |
| Participants |
Number of participants randomised: 115 patients (50% women), aged 31 to 82 years, mean age 64 years, with chronic hepatitis C. Inclusion criteria: HCV genotype 1b as determined by the conventional polymerase chain reaction (PCR)‐based method; IL28B SNP rs8099917 genotype TG or GG (designated as non‐TT); HCV RNA persistently detectable in serum by the real‐time PCR technique; white blood cell count of more than 2000/μ; platelet count of more than 50 000/μL; and haemoglobin levels of more than 9.0 g/dL at the time of enrolment. Patients could participate in the study regardless of whether they had received prior IFN‐based therapy. When patients had not received PEG IFN/ribavirin combination therapy, they were considered as naive patients. Exclusion criteria: Decompensated liver cirrhosis, evidence of other forms of liver disease, presence of malignancy and other serious medical illness, evidence of hypercalcaemia or hyperparathyroidism, positive hepatitis B surface antigen and antibody to HIV type 1, medication with Chinese herbal medicine or other type of vitamin D, past medical history of interstitial pneumonia, pregnancy or possibility of pregnancy, lactating, and past medical history of allergy to biological preparations or antiviral agents. |
|
| Interventions |
Intervention: lead‐in treatment with oral native vitamin D3 (Healthy Natural Products, Florence, KY, USA) at a dose of 2000 IU once daily for 4 weeks, followed by the addition of the vitamin D3 to the 12‐week triple therapy (PEG IFN‐α‐2a (Roche group‐Chugai, Tokyo, Japan), ribavirin (Chugai) and simeprevir (Janssen, Tokyo, Japan)), followed by 12 weeks of PEG IFN‐ α‐2a and ribavirin (n = 57); Control: 12‐week triple therapy (PEG IFN‐α‐2a (Roche group‐Chugai, Tokyo, Japan), ribavirin (Chugai) and simeprevir (Janssen, Tokyo, Japan)) for 12 weeks, followed by 12 weeks of PEG IFN‐ α‐2a and ribavirin (n = 58). PEG IFN‐α‐2a was administrated subcutaneously at a dose of 180 μg once weekly. Ribavirin was administrated orally twice daily, with doses adjusted according to bodyweight (600 mg daily for <60 kg, 800 mg daily for 60–80 kg and 1000 mg daily for >80 kg). Simeprevir was administrated orally once daily at a dose of 100 mg. Because of the low likelihood of achieving an SVR and high likelihood of developing antiviral resistance, treatment was stopped for patients with serum HCV RNA decline from baseline of less than 3 log IU/mL at 4 weeks of treatment, detectable HCV RNA at 12 weeks of treatment or more than 2 log IU/mL increase in HCV RNA levels from the lowest levels during treatment (defined as viral breakthrough). |
|
| Outcomes | Primary outcome: sustainability undetectable viraemia 24 weeks after the end of treatment. | |
| Stated aim of study | To clarify whether native vitamin D3 supplementation could improve SVR rate in PEG‐IFN/ribavirin therapy with simeprevir for people with treatment‐refractory genotype 1b HCV with the IL28B SNP rs8099917 non‐TT. | |
| Notes | ||
| Risk of bias | ||
| Bias | Authors' judgement | Support for judgement |
| Random sequence generation (selection bias) | Low risk | Used computer‐generated random number table. |
| Allocation concealment (selection bias) | Unclear risk | Method used to conceal the allocation not described so intervention allocations may have been foreseen before, or during, enrolment. |
| Blinding of participants and personnel (performance bias) All outcomes | High risk | No blinding, and outcome likely to be influenced by lack of blinding. |
| Blinding of outcome assessment (detection bias) All outcomes | Unclear risk | No blinding, and outcome measurement likely to be influenced by lack of blinding. |
| Incomplete outcome data (attrition bias) All outcomes | Unclear risk | Insufficient information to assess whether missing data in combination with method used to handle missing data were likely to induce bias. |
| Selective reporting (reporting bias) | Unclear risk | Unclear whether all predefined and clinically relevant and reasonably expected outcomes reported. |
| For‐profit bias | Unclear risk | Trial may or may not be free of for‐profit bias as no information provided on clinical trial support or sponsorship. |
| Other bias | Low risk | Trial appeared free of other factors that could put it at risk of bias. |
Barchetta 2016.
| Methods | Randomised clinical trial with parallel group design (2 groups). | |
| Participants | 65participants (35% women), mean age 59 years, with NAFLD. Inclusion criteria: men or women aged 25 to 70 years; diagnosis of type 2 diabetes according to American Diabetes Association 2009 criteria; presence of fatty liver detected by upper US and confirmed by MRI in people with clinical suspicion of NAFLD (increased serum transaminase levels in absence of known hepatic chronic disease, ALT > AST, presence of multiple components of metabolic syndrome); negative tests for hepatitis B surface antigen and antibody to HCV. Exclusion criteria: history of alcohol abuse (defined by mean daily consumption of alcohol > 30 g/day in men and > 20 g/day in women), cirrhosis, autoimmune hepatitis and other causes of liver disease (haemochromatosis, Wilson's disease), chronic enteropathies, advanced renal failure, cancer, hyper/hypoparathyroidism, known hypersensitivity to cholecalciferol or any other excipients, hypercalcaemia, hypercalciuria, nephrolithiasis, nephrocalcinosis; ongoing/recent (previous 6 months) supplementation with vitamin D, calcium, multivitamin products; treatment with agents affecting bone and calcium/vitamin D metabolism (anticonvulsants, glucocorticoids, antacids containing aluminium, cholestyramine); ultraviolet radiation exposure; pregnancy and lactation; or severe psychiatric illnesses. |
|
| Interventions |
Intervention: vitamin D3 2000 IU/day (n = 29). Control: placebo (n = 36). For 24 weeks. |
|
| Outcomes |
Primary outcomes: reduction of hepatic fat fraction measured by MRI, changes in serum transaminases, CK18‐M30, N‐terminal procollagen III propeptide levels, and Fatty Liver Index. Secondary outcomes: metabolic (fasting glycaemia, haemoglobin A1c, lipids, Homeostasis Model Assessment ‐ Insulin Resistance, Homeostasis Model Assessment ‐ beta cell function, adipose tissue insulin resistance, body fat distribution) and cardiovascular (ankle‐brachial index, intima‐media thickness, flow‐mediated dilatation) parameters. |
|
| Stated aim of study | To assess the efficacy and safety of 24‐week oral high‐dose vitamin D supplementation in people with type 2 diabetes and NAFLD. | |
| Notes | Registered at www.clinicaltrialsregister.eu (number 2011‐003010‐17). Funded by research grants from the Sapienza University Ateneo Scientific Research (authors MGC and IB) and the Italian Minister of University and Research (authors MGC and MGB). | |
| Risk of bias | ||
| Bias | Authors' judgement | Support for judgement |
| Random sequence generation (selection bias) | Low risk | Randomisation performed by statistician using computer‐generated and centrally administered procedure. |
| Allocation concealment (selection bias) | Low risk | Participant allocations could not have been foreseen in advance of, or during, enrolment. Used central and independent randomisation unit controlled allocation. |
| Blinding of participants and personnel (performance bias) All outcomes | Low risk | Participants, investigators, clinical site staff, laboratory staff, and radiologists all masked to treatment assignment throughout study. Treatment and placebo provided in identical vials by an experienced independent pharmacist. |
| Blinding of outcome assessment (detection bias) All outcomes | Low risk | Blinding of outcome assessment ensured, and unlikely that blinding could have been broken. |
| Incomplete outcome data (attrition bias) All outcomes | Unclear risk | Insufficient information to assess whether missing data in combination with method used to handle missing data were likely to introduce bias on the results. |
| Selective reporting (reporting bias) | Low risk | Study authors reported all predefined outcomes fully. |
| For‐profit bias | Low risk | Trial appeared free of industry sponsorship or other type of for‐profit support that could manipulate trial design, conductance, or trial results. |
| Other bias | Low risk | Trial appeared free of other factors that could put it at risk of bias. |
Esmat 2015.
| Methods | Randomised clinical trial with parallel group design (2 groups). | |
| Participants | 101 participants (25% women) aged 18 to 60 years, mean age 40 years, with chronic HCV genotype 4. Inclusion criteria: aged 18 to 60 years, chronic HCV infection genotype 4 for > 6 months by detectable serum quantitative HCV‐RNA, naive to treatment, compensated liver disease with the following minimum haematological and biochemical criteria (haemoglobin ≥ 12 g/dL for men and ≥ 11 g/dL for women, WBC > 3500/mm3, granulocyte count > 1500/mm3, platelet count > 75,000/mm3, albumin and thyroid function tests within normal limit, and antinuclear antibody ≤ 1:80). US‐guided liver biopsy within 12 months prior to study entry, using a semiautomatic true‐cut needle (16G). Exclusion criteria: other liver diseases, decompensated liver cirrhosis, hepatocellular carcinoma, liver biopsy contraindication, unsuitable for combined IFN and ribavirin treatment due to persistent haematological abnormalities, receiving medications known to affect vitamin D3 level or metabolism (calcium, vitamin D supplementation, oestrogen, alendronate, isoniazid, thiazide diuretics, long‐term antacids, calcium channel blockers, cholestyramine, anticonvulsants, and orlistat), clinically evident osteomalacia (waddling gait, bone pain, and pathological fractures), renal diseases or parathyroid diseases, and BMI > 35. |
|
| Interventions |
Intervention: vitamin D3 15,000 IU/week + PEG‐IFN‐α‐2b + ribavirin (n = 50). Control: placebo + PEG‐IFN‐α‐2b + ribavirin (n = 51). PEG‐IFN‐α‐2b (Peg‐Intron‐MSD) at 1.5 mg/kg subcutaneous injection once/week. Ribavirin (Rebetol, MSD) dose determined by body weight (< 75 kg = 1000 mg/day; ≥ 75 kg = 1200 mg/day in 2 separate oral doses after meals morning and night) for 48 weeks. Vitamin D3 given as oral solution with juice once weekly for 48 weeks. |
|
| Outcomes |
Primary outcome: SVR. Secondary outcome: stage of hepatic fibrosis. |
|
| Stated aim of study | To assess role of vitamin D supplementation on response to treatment in people with chronic HCV 4 and its possible relation to stage of hepatic fibrosis. | |
| Notes | Additional information received through personal communication with authors on 23 January 2017. | |
| Risk of bias | ||
| Bias | Authors' judgement | Support for judgement |
| Random sequence generation (selection bias) | Unclear risk | Method of sequence generation not specified. |
| Allocation concealment (selection bias) | Low risk | Allocation sequence hidden in sequentially numbered, opaque, and sealed envelopes. |
| Blinding of participants and personnel (performance bias) All outcomes | Low risk | No blinding, but we judged that outcomes were not likely to be influenced by lack of blinding. |
| Blinding of outcome assessment (detection bias) All outcomes | Low risk | No blinding of outcome assessment, but we judged that outcome measurements were not likely to be influenced by lack of blinding. |
| Incomplete outcome data (attrition bias) All outcomes | Unclear risk | Insufficient information to assess whether missing data in combination with the method used to handle missing data were likely to induce bias. |
| Selective reporting (reporting bias) | Unclear risk | Unclear whether all predefined and clinically relevant and reasonably expected outcomes reported. |
| For‐profit bias | Unclear risk | Trial may or may not have been free of for‐profit bias as trial did not provide any information on clinical trial support or sponsorship. |
| Other bias | Low risk | Trial appeared free of other factors that could put it at risk of bias. |
Foroughi 2016.
| Methods | Randomised clinical trial with parallel group design (2 groups). | |
| Participants | 60 participants (52% women), aged 30 to 70 years, mean age 48.5 years with NAFLD. Inclusion criteria: NAFLD confirmed by US and normal range of ALT and AST (< 31 IU/L). Exclusion criteria: acute illnesses, chronic kidney disease, hyperparathyroidism, hypoparathyroidism, chronic heart failure, HCV or HBV, Wilson's syndrome, history of chronic liver diseases or disorders that affect gallbladder and bile ducts, pregnancy, history of taking any drugs affecting levels of ALT (e.g. valproic acid, tamoxifen, 3‐hydroxy‐3‐methylglutaryl‐coenzyme A reductase inhibitors, metformin, angiotensin converting enzyme 1 and angiotensin‐converting enzyme‐related 1). Furthermore, participants should not have followed any special diet, and not take oral vitamin D, calcium, or multivitamin supplements. |
|
| Interventions |
Intervention: vitamin D3 50,000 IU (n = 30). Control: placebo (n = 30). Weekly for 10 weeks. |
|
| Outcomes |
Primary outcomes: inflammatory markers, liver function, lipid profile, body composition, and liver steatosis. Secondary outcomes: none stated. |
|
| Stated aim of study | To investigate effect of vitamin D supplementation on inflammation, liver function, and liver steatosis in people with NAFLD. | |
| Notes | Clinical trial registered at Iranian Registry of Clinical Trials (www.irct.ir) IRCT number: IRCT2013060411763N8. Funded by Food Security Research Center and Department of Community Nutrition, School of Nutrition and Food Sciences, Isfahan University of Medical Sciences, Isfahan, Iran. | |
| Risk of bias | ||
| Bias | Authors' judgement | Support for judgement |
| Random sequence generation (selection bias) | Low risk | Used computer‐generated random numbers. |
| Allocation concealment (selection bias) | Unclear risk | Method used to conceal the allocation not described so intervention allocations may have been foreseen before, or during, enrolment. |
| Blinding of participants and personnel (performance bias) All outcomes | Unclear risk | Insufficient information to permit judgement of 'low risk' or 'high risk'. |
| Blinding of outcome assessment (detection bias) All outcomes | Unclear risk | Insufficient information to permit judgement of 'low risk' or 'high risk'. |
| Incomplete outcome data (attrition bias) All outcomes | Low risk | Missing data unlikely to make treatment effects depart from plausible values. |
| Selective reporting (reporting bias) | Low risk | All predefined outcomes reported fully. |
| For‐profit bias | Low risk | Trial appeared to be free of industry sponsorship or other type of for‐profit support that could manipulate the trial design, conductance, or trial results. |
| Other bias | Unclear risk | Trial may or may not have been free of other factors that could put it at risk of bias. |
Lorvand Amiri 2016.
| Methods | Randomised clinical trial with parallel group design (3 groups). | |
| Participants | 120 participants (38% women), aged 18 to 65 years, mean age 41 years, with NAFLD. Inclusion criteria: BMI 25 kg/m2 to 35 kg/m2, serum 25‐hydroxyvitamin D3 level < 15 ng/mL, reporting a daily calcium intake 700 mg/day to 800 mg/day, and willingness to introduce a dietary change to lose weight. Exclusion criteria: calcium intake < 700 mg/day or > 800 mg/day (in diet or as a supplement); drugs for blood glucose or lipid control; pregnancy or having given birth in the past year or planning a pregnancy in the next 6 months; lactation; weight loss ≥ 10% of body weight within the 6 months before enrolment; participation in competitive sport; abnormal thyroid hormone concentration; intake of medications that could affect body weight or energy expenditure (or both); allergy; smoking; diagnosis of chronic diseases including inflammatory diseases; heart, liver, and renal failure; cancer; acute myocardial infarction; diabetes; stroke; or serious injuries and any other conditions that were not suitable for the trial as evaluated by the physician. |
|
| Interventions |
Intervention 1: vitamin D 25 μg/day as calcitriol (Jalinus Arya Co., Iran) + calcium carbonate placebo (25 mg/day as lactose; Jalinus Arya Co, Iran) (n = 37). Intervention 2: vitamin D 25 μg/day as calcitriol (Jalinus Arya Co., Iran) + calcium (500 mg/day as calcium carbonate; Jalinus Arya Co., Iran) (n = 37). Control: placebo of calcitriol + placebo of calcium (25 mg/day as lactose; Jalinus Arya Co., Iran) (n = 36). After lunch with a glass of water for 12 weeks. |
|
| Outcomes |
Primary outcomes: weight loss, body fat, fasting plasma glucose, serum insulin concentrations, lipid profiles, and liver function tests. Secondary outcomes: carbohydrate and lipid metabolism. |
|
| Stated aim of study | To compare effect of vitamin D supplementation with and without calcium on anthropometric measures and biochemical parameters in people with NAFLD during a weight‐loss programme. | |
| Notes | Clinical trial registered at Iranian Registry of Clinical Trials (www.irct.ir) IRCT registration number: IRCT201408312709N29. Trial did not receive any specific grant from funding agencies in the public, commercial, or not‐for‐profit sectors. Additional information received through personal communication with authors on 20 January 2017. | |
| Risk of bias | ||
| Bias | Authors' judgement | Support for judgement |
| Random sequence generation (selection bias) | Low risk | Participants randomly assigned using computer‐generated random‐numbers method by project co‐ordinator. |
| Allocation concealment (selection bias) | Low risk | Participant allocations could not have been foreseen in advance of, or during, enrolment. Allocation controlled by a central and independent randomisation unit. |
| Blinding of participants and personnel (performance bias) All outcomes | Low risk | Products administered by blinded research assistant to blinded participants. Shape, colour, and packaging of placebo similar to supplements in the intervention group. |
| Blinding of outcome assessment (detection bias) All outcomes | Unclear risk | Insufficient information to assess whether missing data in combination with method used to handle missing data were likely to induce bias. |
| Incomplete outcome data (attrition bias) All outcomes | Low risk | Missing data were unlikely to make treatment effects depart from plausible values. |
| Selective reporting (reporting bias) | Low risk | All predefined outcomes reported fully. |
| For‐profit bias | Unclear risk | Trial may or may not have been free of for‐profit bias as no information provided on clinical trial support or sponsorship. |
| Other bias | Unclear risk | Trial may or may not have been free of other factors that could put it at risk of bias. |
Mobarhan 1984.
| Methods | Randomised clinical trial with parallel group design (3 groups). | |
| Participants | 18 men, aged 32 to 61 years, mean age 52 years, with alcoholic cirrhosis. Inclusion criteria: men with advanced biopsy‐confirmed alcoholic cirrhosis with low levels of serum 25‐hydroxyvitamin D (< 20 ng/mL) and decreased bone density (i.e. > 1.5 standard deviations below mean of healthy Baltimore men of same ages). Exclusion criteria: history of corticosteroid, anticonvulsant, or vitamin D intake; renal disease. |
|
| Interventions |
Intervention 1: vitamin D2 50,000 IU 2 or 3 times weekly (n = 6). Intervention 2: 25‐hydroxyvitamin D3 800 IU/day to 2000 IU/day (prepared and supplied as identical soft elastic capsules (20 or 50 μg) by Upjohn Co.) (n = 6). Control: no intervention (n = 6). For 1 year. |
|
| Outcomes | Outcomes reported in abstract of publication. Primary outcomes: bone mineral density. Secondary outcomes: none stated. |
|
| Stated aim of study | To compare the efficacy of 25‐hydroxyvitamin D3 or vitamin D2 in correcting the bone disease of people with alcoholic cirrhosis. | |
| Notes | This study was supported by grants from Upjohn Co. and the Veterans Administration. | |
| Risk of bias | ||
| Bias | Authors' judgement | Support for judgement |
| Random sequence generation (selection bias) | Unclear risk | The method of sequence generation was not specified. |
| Allocation concealment (selection bias) | Unclear risk | The method used to conceal the allocation was not described so that intervention allocations may have been foreseen in advance of, or during, enrolment. |
| Blinding of participants and personnel (performance bias) All outcomes | High risk | No blinding, and the outcome was likely to be influenced by lack of blinding. |
| Blinding of outcome assessment (detection bias) All outcomes | High risk | No blinding of outcome assessment, and the outcome measurement is likely to be influenced by lack of blinding. |
| Incomplete outcome data (attrition bias) All outcomes | Low risk | Missing data were unlikely to make treatment effects depart from plausible values. |
| Selective reporting (reporting bias) | Low risk | All clinically relevant and reasonably expected outcomes were reported. |
| For‐profit bias | High risk | The trial is sponsored by the industry. |
| Other bias | Low risk | The trial appeared to be free of other factors that could put it at risk of bias. |
Nimer 2012.
| Methods | Randomised clinical trial with parallel group design (2 groups). | |
| Participants | 50 participants (58% women), mean age 47 years, with chronic HCV genotype 2 or 3. Inclusion criteria: aged 18 to 65 years; chronic genotype 2 or 3 HCV infection; no previous treatment for HCV; seronegative for HBV, hepatitis A virus, and HIV infection; absolute neutrophil count > 1500/mm3; platelet count > 90,000/mm3; and normal haemoglobin level. Liver biopsies not required prior to study entrance. Exclusion criteria: decompensated liver disease (cirrhosis with Child‐Pugh score > 9), another cause of clinically significant liver disease, or presence of hepatocellular carcinoma. |
|
| Interventions |
Intervention: PEG‐IFN‐α‐2a 180 μg weekly + oral ribavirin 800 mg/day + oral vitamin D3 2000 IU/day (Vitamidyne D, Fischer Pharmaceuticals, Israel), given by oral drops (n = 20). Control: PEG‐IFN‐α‐2a 180 μg weekly + oral ribavirin 800 mg/day (n = 30). For 24 weeks. |
|
| Outcomes | Outcomes reported in abstract of publication. Primary outcome: SVR defined as undetectable HCV‐RNA at 24 weeks' post‐treatment. Secondary outcomes: treatment efficacy at weeks 4 (RVR), and 12 (EVR) during therapy, and 24 weeks after cessation of therapy (SVR). |
|
| Stated aim of study | To assess prospectively influence of vitamin D supplementation on SVR in treatment of people with chronic HCV with HCV genotype 2‐3. | |
| Notes | Additional information received through personal communication with authors on 8 February 2017. | |
| Risk of bias | ||
| Bias | Authors' judgement | Support for judgement |
| Random sequence generation (selection bias) | Low risk | Sequence generation performed using computer random number generation. |
| Allocation concealment (selection bias) | Low risk | Participant allocations could not have been foreseen in advance of, or during, enrolment. Allocation sequence hidden in sequentially numbered, opaque, and sealed envelopes. |
| Blinding of participants and personnel (performance bias) All outcomes | High risk | No blinding, and outcomes were likely to be influenced by lack of blinding. |
| Blinding of outcome assessment (detection bias) All outcomes | High risk | No blinding, and outcome measurements were likely to be influenced by lack of blinding. |
| Incomplete outcome data (attrition bias) All outcomes | Low risk | Missing data unlikely to make treatment effects depart from plausible values. |
| Selective reporting (reporting bias) | Unclear risk | Unclear whether all predefined and clinically relevant and reasonably expected outcomes were reported. |
| For‐profit bias | Unclear risk | Trial may or may not have been free of for‐profit bias as no information on clinical trial support or sponsorship was provided. |
| Other bias | Low risk | Trial appeared to be free of other factors that could put it at risk of bias. |
Pilz 2016.
| Methods | Randomised clinical trial with parallel group design (2 groups). | |
| Participants | 36 participants (25% women), aged 18 to 75 years, mean age 61 years, with liver cirrhosis. Inclusion criteria: compensated cirrhosis, 25‐hydroxyvitamin D < 30 ng/mL, aged 18 to 75 years, and a negative pregnancy test in women of childbearing potential. Exclusion criteria: presence of hepatocellular carcinoma, hypercalcaemia (plasma calcium concentrations > 2.65 mmol/L), pregnant or lactating women, drug intake as part of another clinical study, estimated glomerular filtration rate according to Modification of Diet in Renal Disease formula < 15 mL/minute/1.73 m2, any clinically significant acute disease requiring drug treatment, regular intake (in addition to study medication) of vitamin D > 800 IU daily during the last 4 weeks before study entry. |
|
| Interventions |
Intervention: vitamin D3 2800 IU/day (Oleovit D3, Fresenius Kabi, Austria) (n = 18). Control: placebo daily (n = 18). For 8 weeks. |
|
| Outcomes |
Primary outcome: vitamin D status. Secondary outcomes: liver function tests (i.e. AST, ALT, gamma glutamyl transpeptidase, and alkaline phosphatase), albumin, International Normalized Ratio, bilirubin, and hyaluronic acid; and parameters of mineral metabolism (i.e. parathyroid hormone, total plasma calcium, free plasma calcium, urinary midstream calcium to creatinine ratio, and plasma phosphate). |
|
| Stated aim of study | To evaluate effects of vitamin D supplementation on 25‐hydroxyvitamin D, parameters of liver function and synthesis, and hyaluronic acid as a marker of liver fibrosis. | |
| Notes | Study sponsored by the Medical University of Graz, Austria. | |
| Risk of bias | ||
| Bias | Authors' judgement | Support for judgement |
| Random sequence generation (selection bias) | Low risk | Sequence generation performed using computer random number generation. |
| Allocation concealment (selection bias) | Low risk | Participant allocations could not have been foreseen in advance of, or during, enrolment. Central and independent randomisation unit controlled allocation. Investigators were unaware of allocation sequence. |
| Blinding of participants and personnel (performance bias) All outcomes | Low risk | Blinding of participants and key study personnel ensured, and it was unlikely that blinding could have been broken. |
| Blinding of outcome assessment (detection bias) All outcomes | Low risk | Blinding of outcome assessment ensured, and unlikely that blinding could have been broken. |
| Incomplete outcome data (attrition bias) All outcomes | Low risk | Missing data were unlikely to make treatment effects depart from plausible values. |
| Selective reporting (reporting bias) | Low risk | All predefined outcomes reported. |
| For‐profit bias | Low risk | Trial appeared to be free of industry sponsorship or other type of for‐profit support that could manipulate the trial design, conductance, or trial results. |
| Other bias | Unclear risk | Trial may or may not have been free of other factors that could put it at risk of bias. |
Sharifi 2014.
| Methods | Randomised clinical trial with parallel group design (2 groups). | |
| Participants | 60 (51% women), aged 18 to 70 years, mean age 42 years, with NAFLD. Inclusion criteria: diagnosis of NAFLD by US and increased serum levels of ALT (> 19 U/L for women and 30 U/L for men). Exclusion criteria: alcohol consumption > 20 g/day; pregnant and lactating women; hereditary haemochromatosis; Wilson's disease; α1‐antitrypsin deficiency; history of jejunoileal bypass surgery or gastroplasty; using total parenteral nutrition in the past 6 months; taking hepatotoxic drugs such as calcium channel blocker, high doses of synthetic oestrogens, methotrexate, amiodarone, and chloroquine; history of hypothyroidism, Cushing's syndrome, renal failure, and kidney stones; serum calcium levels > 10.6 mg/dL; and intake of vitamin D, vitamin E, and calcium supplements during the last 6 months. |
|
| Interventions |
Intervention: vitamin D3 50,000 IU (D‐Vitin Zahravi Pharm Co., Tabriz, Iran) (n = 30). Control: placebo (Zahravi Pharm Co.) (n = 30). Every 14 days for 4 months. |
|
| Outcomes |
Primary outcomes: changes in serum ALT and changes in insulin resistance index. Secondary outcomes: other liver enzymes, oxidative stress, and inflammatory biomarkers. |
|
| Stated aim of study | To determine effect of vitamin D supplementation on serum liver enzymes, insulin resistance, oxidative stress, and inflammatory biomarkers in people with NAFLD. | |
| Notes | Study financially supported by grant (No. RDC‐9105) from Vice‐Chancellor for Research Affairs of Jundishapur University of Medical Sciences and approved by the Research Institute for Infectious Diseases of the Digestive System, Jundishapur University of Medical Sciences, Ahvaz, Iran. | |
| Risk of bias | ||
| Bias | Authors' judgement | Support for judgement |
| Random sequence generation (selection bias) | Low risk | The study authors performed sequence generation using computer random number generation |
| Allocation concealment (selection bias) | Low risk | An investigator with no clinical involvement in the trial packed the supplements and placebos in numbered bottles based on the random list. The other person, who was not involved in the trial and not aware of random sequences, assigned the patients to the numbered bottles of pearls. |
| Blinding of participants and personnel (performance bias) All outcomes | Low risk | Blinding of participants and key study personnel ensured, and it was unlikely that the blinding could have been broken. |
| Blinding of outcome assessment (detection bias) All outcomes | Low risk | Blinding of outcome assessment ensured, and unlikely that the blinding could have been broken. |
| Incomplete outcome data (attrition bias) All outcomes | Low risk | Missing data were unlikely to make treatment effects depart from plausible values. |
| Selective reporting (reporting bias) | Unclear risk | It is unclear whether all predefined and clinically relevant and reasonably expected outcomes were reported. |
| For‐profit bias | Low risk | The trial appeared to be free of industry sponsorship or other type of for‐profit support that could manipulate the trial design, conductance, or trial results. |
| Other bias | Low risk | The trial appeared to be free of other factors that could put it at risk of bias. |
Shiomi 1999a.
| Methods | Randomised clinical trial with parallel group design (2 groups). | |
| Participants | 76 participants (66% women), aged 38 to 84 years, mean age 61 years, with cirrhosis and an underlying infection of liver (HBV and HCV). Inclusion criteria: liver cirrhosis and an underlying infection of the liver (HBV and HCV). Exclusion criteria: none stated. |
|
| Interventions |
Intervention: calcitriol 0.5 μg twice daily (n = 38). Control: no intervention (n = 38). For 1 year. |
|
| Outcomes | Outcomes reported in abstract of publication. Primary outcome: bone mineral density of the lumbar vertebrae. Secondary outcomes: none stated. |
|
| Stated aim of study | To evaluate efficacy of calcitriol (1,25‐dihydroxyvitamin D) in treatment of bone disease associated with cirrhosis and an underlying hepatitis viral infection. | |
| Notes | Additional information received through personal communication with the authors on 12 February 2014. | |
| Risk of bias | ||
| Bias | Authors' judgement | Support for judgement |
| Random sequence generation (selection bias) | Unclear risk | Method of sequence generation not specified. |
| Allocation concealment (selection bias) | Low risk | Allocation sequence hidden in sequentially numbered, opaque, and sealed envelopes. |
| Blinding of participants and personnel (performance bias) All outcomes | High risk | No blinding, and outcome was likely to be influenced by lack of blinding. |
| Blinding of outcome assessment (detection bias) All outcomes | High risk | No blinding of outcome assessment, and outcome measurement was likely to be influenced by lack of blinding. |
| Incomplete outcome data (attrition bias) All outcomes | Low risk | Missing data were unlikely to make treatment effects depart from plausible values. |
| Selective reporting (reporting bias) | High risk | Not all predefined outcomes reported fully. |
| For‐profit bias | Unclear risk | Trial may or may not have been free of for‐profit bias as no information on clinical trial support or sponsorship was provided. |
| Other bias | Unclear risk | Trial may or may not have been free of other components that could put it at risk of bias. |
Shiomi 1999b.
| Methods | Randomised clinical trial with parallel group design (2 groups). | |
| Participants | 34 women, aged 36 to 72 years, mean age 56 years, with primary biliary cirrhosis. Inclusion criteria: primary biliary cirrhosis. Exclusion criteria: none stated. |
|
| Interventions |
Intervention: calcitriol 0.5 μg twice a day (n = 17). Control: no intervention (n = 17). For 1 year. |
|
| Outcomes | Outcomes reported in abstract of publication. Primary outcome: bone mineral density. Secondary outcomes: none stated. |
|
| Stated aim of study | To evaluate efficacy of calcitriol (1,25‐dihydroxyvitamin D) in treatment of bone disease associated with primary biliary cirrhosis. | |
| Notes | Additional information received through personal communication with authors on 12 February 2014. | |
| Risk of bias | ||
| Bias | Authors' judgement | Support for judgement |
| Random sequence generation (selection bias) | Unclear risk | Method of sequence generation not specified. |
| Allocation concealment (selection bias) | Unclear risk | Method used to conceal allocation not described so that intervention allocations may have been foreseen in advance of, or during, enrolment. |
| Blinding of participants and personnel (performance bias) All outcomes | High risk | No blinding, and outcome was likely to be influenced by lack of blinding. |
| Blinding of outcome assessment (detection bias) All outcomes | High risk | No blinding of outcome assessment, and outcome measurement was likely to be influenced by lack of blinding. |
| Incomplete outcome data (attrition bias) All outcomes | Low risk | Missing data were unlikely to make treatment effects depart from plausible values. |
| Selective reporting (reporting bias) | High risk | Not all predefined outcomes reported fully. |
| For‐profit bias | Unclear risk | Trial may or may not have been free of for‐profit bias as no information on clinical trial support or sponsorship was provided. |
| Other bias | Unclear risk | Trial may or may not have been free of other components that could put it at risk of bias. |
Vosoghinia 2016.
| Methods | Randomised clinical trial with parallel group design (2 groups). | |
| Participants | 68 participants (13% women), mean age 42 years, with chronic HCV genotype 1,2,3,4. Inclusion criteria: adult patients with chronic HCV infection (> 6 months) and detectable serum levels of HCV RNA (genotype 1, 2, 3 or 4) with compensated liver disease fulfilling the following criteria of an absolute neutrophil count above 1500 permm3, a platelet count above 90,000 permm3, and a normal haemoglobin level. Exclusion criteria: co‐infection with hepatitis B virus or HIV, decompensated liver disease (Child‐Pugh classification B or C), autoimmune or metabolic liver disease, hepatocellular carcinoma, a history of anti‐HCV therapy or use of medications which alter vitamin D3 levels or metabolism (calcium, vitamin D supplementation, oestrogen, alendronate, isoniazid, anticonvulsants, and orlistat), or a history of diarrhoea or malabsorption syndromes like celiac and chronic pancreatitis or those with renal or parathyroid diseases. |
|
| Interventions |
Intervention: PEG‐IFN‐α‐2a (180 μg) + oral ribavirin (Rebetol, MSD) dosage determined based on patient’s weight and genotype, was administered for 48 weeks in patients with genotypes 1 and 4 and for 24 weeks in those with genotypes 2 and 3, and vitamin D3 1600 IU/day (n = 34). Control: PEG‐IFN‐α‐2a (180 μg) + oral ribavirin (Rebetol, MSD), dosage determined based on patient’s weight and genotype. PEG‐IFN‐α‐2a was administered for 48 weeks in patients with genotypes 1 and 4 and for 24 weeks in those with genotypes 2 and 3 (n = 34). Vitamin D3 was administered for 12 weeks. |
|
| Outcomes | Primary outcome: EVR defined as undetectable HCV‐RNA at 12 weeks' post‐treatment. | |
| Stated aim of study | To assess the influence of vitamin D supplementation on viral response to PegINF/RBV therapy | |
| Notes | The research council of Mashhad University of Medical Sciences,Mashhad, Iran financially supported this study. | |
| Risk of bias | ||
| Bias | Authors' judgement | Support for judgement |
| Random sequence generation (selection bias) | Unclear risk | Method of sequence generation not specified. |
| Allocation concealment (selection bias) | Low risk | Participant allocations could not have been foreseen in advance of, or during, enrolment. Allocation sequence hidden in sequentially numbered, opaque, and sealed envelopes. |
| Blinding of participants and personnel (performance bias) All outcomes | High risk | No blinding, and assessment of outcomes likely to be influenced by lack of blinding. |
| Blinding of outcome assessment (detection bias) All outcomes | High risk | No blinding, and assessment of outcomes likely to be influenced by lack of blinding. |
| Incomplete outcome data (attrition bias) All outcomes | Low risk | Missing data unlikely to make treatment effects depart from plausible values. |
| Selective reporting (reporting bias) | Low risk | All predefined outcomes reported fully. |
| For‐profit bias | Low risk | The trial appeared to be free of industry sponsorship or other type of for‐profit support that could manipulate the trial design, conductance, or trial results. |
| Other bias | Unclear risk | The trial may or may not have been free of other components that could put it at risk of bias. |
Xing 2013.
| Methods | Randomised clinical trial with parallel group design (3 groups). | |
| Participants | 75 participants (17% women), aged 28 to 65 years, mean age 48 years, undergoing liver transplantation. Inclusion criteria: primary liver transplant recipients. Exclusion criteria: history of corticosteroid, anticonvulsant, or vitamin D intake; renal disease. |
|
| Interventions |
Intervention 1: calcitriol 0.25 μg/day + calcium gluconate (n = 25). Intervention 2: calcium gluconate (n = 25). Control: placebo (n = 25). For 1 month. |
|
| Outcomes | Outcomes reported in abstract of publication: Primary outcomes: acute cellular rejection rate at 1 month' post transplant. Secondary outcomes: none stated. |
|
| Stated aim of study | To investigate effects of calcitriol on acute cellular rejection rate of liver transplant recipients. | |
| Notes | Study sponsored by a grant from Shanghai Nature Science Fund project and a grant from Science and Technology Department of Shanghai. Additional information received through personal communication with the authors on 13 February 2014. | |
| Risk of bias | ||
| Bias | Authors' judgement | Support for judgement |
| Random sequence generation (selection bias) | Unclear risk | Method of sequence generation not specified. |
| Allocation concealment (selection bias) | Unclear risk | Method used to conceal allocation not described so that intervention allocations may have been foreseen in advance of, or during, enrolment. |
| Blinding of participants and personnel (performance bias) All outcomes | Unclear risk | Insufficient information to permit judgement of 'low risk' or 'high risk'. |
| Blinding of outcome assessment (detection bias) All outcomes | Unclear risk | Insufficient information to permit judgement of 'low risk' or 'high risk'. |
| Incomplete outcome data (attrition bias) All outcomes | Low risk | Missing data unlikely to make treatment effects depart from plausible values. |
| Selective reporting (reporting bias) | Unclear risk | Unclear whether all predefined and clinically relevant and reasonably expected outcomes were reported. |
| For‐profit bias | Low risk | Trial appeared to be free of industry sponsorship or other type of for‐profit support that could manipulate the trial design, conductance, or trial results. |
| Other bias | Low risk | Trial appeared to be free of other factors that could put it at risk of bias. |
Yokoyama 2014.
| Methods | Randomised clinical trial with parallel group design (2 groups). | |
| Participants | 84 participants (49% women), aged 30 to 78 years, mean age 59 years, with HCV genotype 1b. Inclusion criteria: aged ≥ 20 years, chronically infected with HCV genotype 1 and plasma HCV RNA concentrations ≥ 100 log IU/mL. Exclusion criteria: decompensated cirrhosis, liver cancer, HBV or HIV infection, renal insufficiency, history of heart disease or cerebral infarction, pregnancy or breastfeeding. |
|
| Interventions |
Intervention: subcutaneous injections of PEG‐IFN‐α‐2b (1.5 μg/kg body weight) once weekly, along with weight‐based oral ribavirin (600 mg/day to 1200 mg/day) + vitamin D3 1000 IU (n = 42). Control: subcutaneous injections of PEG‐IFN‐α‐2b (1.5 μg/kg body weight) once weekly, along with weight‐based oral ribavirin (600 mg/day to 1200 mg/day) (n = 42). For 16 weeks. |
|
| Outcomes |
Primary outcome: undetectable HCV RNA at week 24. Secondary outcomes: none stated. |
|
| Stated aim of study | To rigorously evaluate the antiviral effects of vitamin D supplementation in people with HCV genotype‐1 infection being treated with PEG‐IFN + ribavirin. | |
| Notes | ||
| Risk of bias | ||
| Bias | Authors' judgement | Support for judgement |
| Random sequence generation (selection bias) | Unclear risk | Method of sequence generation not specified. |
| Allocation concealment (selection bias) | Unclear risk | Method used to conceal the allocation not described so intervention allocations may have been foreseen before, or during, enrolment. |
| Blinding of participants and personnel (performance bias) All outcomes | High risk | No blinding, and outcome was likely to be influenced by lack of blinding. |
| Blinding of outcome assessment (detection bias) All outcomes | High risk | No blinding of outcome assessment, and outcome measurement was likely to be influenced by lack of blinding. |
| Incomplete outcome data (attrition bias) All outcomes | Low risk | Missing data were unlikely to make treatment effects depart from plausible values. |
| Selective reporting (reporting bias) | Unclear risk | Unclear whether all predefined and clinically relevant and reasonably expected outcomes were reported. |
| For‐profit bias | Unclear risk | Trial may or may not have been free of for‐profit bias as trial did not provide any information on clinical trial support or sponsorship. |
| Other bias | Low risk | Trial appeared to be free of other factors that could put it at risk of bias. |
ALT: alanine aminotransferase; AST: aspartate aminotransferase; BMI: body mass index; EVR: early viral response; HBV: hepatitis B virus; HCV: hepatitis C virus; HDV: hepatitis D virus; IFN: interferon; IU: international unit; MRI: magnetic resonance imaging; n: number of participants; NAFLD: non‐alcoholic fatty liver disease; PCR: polymerase chain reaction; PEG: pegylated; RNA: ribonucleic acid; RVR: rapid viral response; SVR: sustained virological response; US: ultrasound; WBC: white blood cell count.
Characteristics of excluded studies [ordered by study ID]
| Study | Reason for exclusion |
|---|---|
| Atsukawa 2013 | Not a randomised trial. |
| Benetti 2008 | Not a randomised trial. |
| Bitetto 2010 | Not a randomised trial. |
| Fernández Fernández 2016 | Not a randomised trial. |
| Floreani 2007 | Not a randomised trial. |
| Kitson 2016 | Not a randomised trial. |
| Kondo 2013 | Not a randomised trial. |
| Ladero 2013 | Not a randomised trial. |
| Long 1978 | Not a randomised trial. |
| Malham 2012 | Not a randomised trial. |
| Papapostoli 2016 | Not a randomised trial. |
| Rode 2010 | Not a randomised trial. |
| Stokes 2016 | Not a randomised trial. |
| Terrier 2015 | Not a randomised trial. |
Characteristics of ongoing studies [ordered by study ID]
IRCT2016020326342N1.
| Trial name or title | Effectiveness of Vitamin D Supplementation on Severity of Cirrhosis Based on CHILD and MELD Scores in Patients with Decompensate Cirrhosis. |
| Methods | Randomised clinical trial using parallel group design (2 groups). |
| Participants |
Country: Iran. Estimated number of participants: 80. Inclusion criteria: people with HIV, renal failure due to reasons other than liver failure, malabsorption such as chronic diarrhoea, coeliac disease, chronic pancreatitis; people undergoing corticosteroid treatment; pregnancy; and people with cirrhosis secondary to cholestasis such as primary biliary cirrhosis. |
| Interventions |
Intervention: vitamin D3 (50,000 IU) and popular drugs using for liver cirrhosis. Control: popular drugs using for liver cirrhosis. Daily for 3 months. |
| Outcomes |
Primary outcome: liver function measured by Model for End‐Stage Liver Disease score. Secondary outcomes: liver function measured by Child‐Turcotte‐Pugh score. |
| Starting date | March 2016. |
| Contact information | Hossein Ali Abbasi, Emam Reza Hospital, Emam Reza Square, Ebne Sina Avenue, Mashhad, Iran, hoseinabbasi1342@yahoo.com. |
| Notes |
NCT02779465.
| Trial name or title | Study of Oral Vitamin D Treatment for the Prevention of Hepatocellular Carcinoma in Patients with Chronic Hepatitis B. |
| Methods | Randomised clinical trial using parallel group design (2 groups). |
| Participants |
Country: China. Estimated number of participants: 1500. Inclusion criteria: age 18 to 70 years; with chronic hepatitis B and under the oral antivirus treatment; no evidence of hepatocellular carcinoma on entry imaging study; Model for End‐Stage Liver Disease score < 22; not currently participating in another intervention study; not pregnant or lactating; and willing to use effective contraception during study period; absence of any psychological, familial, sociological, or geographical condition potentially hampering compliance with the study protocol and follow‐up schedule; and ability to provide written informed consent according to national or local regulations. Exclusion criteria: evidence of hepatocellular carcinoma within 6 months after enrolment; serum alanine aminotransferase level > 10 times the upper limit of normal, elevated serum creatinine level, diagnosis of kidney stones, diagnosis of hyperparathyroidism or other serious disturbance of calcium metabolism in past 5 years, evidence of autoimmune hepatitis, coinfection with hepatitis C or D virus or HIV, other serious concurrent illness (e.g. alcoholism, uncontrolled diabetes, or cancer), treatment with immunomodulatory agent within 6 months before screening, treatment with any investigational drug within 30 days before the study began. |
| Interventions |
Intervention: vitamin D3 800 IU/day besides the antivirus treatment with nucleos(t)ide medicine. Control: no intervention. For 1 year. |
| Outcomes |
Primary outcomes: change in serum levels of 25‐hydroxyvitamin D at baseline, and at 6 and 12 months, and change in serum levels of 25‐hydroxyvitamin D at 6 and 12 months compared to baseline. Secondary outcomes: change in serum creatinine at baseline, and at 6 and 12 months; change in serum creatinine at 6 and 12 months compared to baseline; change in fibrosis score at baseline, and at 6 and 12 months; fibrosis score at 6 and 12 months compared to baseline; number of participants on vitamin D treatment with adverse events. |
| Starting date | June 2016. |
| Contact information | Yutian Chong, MD, Third Affiliated Hospital, Sun Yat‐Sen University, ytchongkyzy@126.com. |
| Notes |
IU: international unit.
Differences between protocol and review
Types of outcome measures. Primary outcomes. We followed new recommendations from Cochrane, and changed primary outcomes to: all‐cause mortality, liver‐related mortality, and serious adverse events.
Types of outcome measures. Secondary outcomes. We followed new recommendations from Cochrane, and changed secondary outcomes to: liver‐related morbidity, health‐related quality of life, and non‐serious adverse events. We moved the other planned secondary outcomes: vitamin D status, bone mineral density, biochemical indices, failure of virological response, and acute cellular rejection in liver transplant recipients under 'Exploratory outcomes'. We added alkaline phosphatase, triglyceride, cholesterol, and calcium to exploratory outcome 'biochemical indices' to be able to analyse the effect of vitamin D supplementation on the broader spectrum of biochemical indices.
Data synthesis. We considered a P value of 0.025 or less, two‐tailed, as statistically significant if the required information size was reached due to our three primary outcomes (Jakobsen 2014).
Data synthesis. In our Trial Sequential Analysis, the diversity‐adjusted required information size was based on the event proportion in the control group; assumption of a plausible relative risk reduction; a risk of type I error of 2.5%; a risk of type II error of 10%; and the observed diversity of the included trials in the meta‐analysis (Jakobsen 2014; Wetterslev 2017).
Marko Bjelakovic joined the team of authors during the preparation of the review and Marija Bjelakovic left the team of authors during the preparation of the review.
Contributions of authors
GB: initiated the review; drafted the protocol; performed the literature search, data extraction, and statistical analyses; and drafted the review. DN: revised the protocol, performed data extraction, and revised the review. MB: joined the team of authors at the review stage, performed data extraction, and revised the review. CG: revised the protocol, acted as arbiter for disagreements, and revised the review.
Sources of support
Internal sources
Copenhagen Trial Unit, Centre for Clinical Intervention Research, Rigshospitalet, Copenhagen, Denmark.
External sources
Ministry of Education, Science and Technological Development of the Republic of Serbia, Project 41018, Serbia.
Medical Faculty, University of Nis, Project 24, Serbia.
Declarations of interest
None known.
New
References
References to studies included in this review
Abu‐Mouch 2011 {published data only}
- Abu‐Mouch S, Fireman Z, Jarchovsky J, Zeina AR, Assy N. Vitamin D supplementation improves sustained virologic response in chronic hepatitis C (genotype 1)‐naïve patients. World Journal of Gastroenterology 2011;17(47):5184‐90. [DOI] [PMC free article] [PubMed] [Google Scholar]
Atsukawa 2016 {published data only}
- Atsukawa M, Tsubota A, Shimada N, Yoshizawa K, Abe H, Asano T, et al. Effect of native vitamin D3 supplementation on refractory chronic hepatitis C patients in simeprevir with pegylated interferon/ribavirin. Hepatology Research 2016;46(5):450‐8. [DOI] [PubMed] [Google Scholar]
Barchetta 2016 {published data only}
- Barchetta I, Ben M, Angelico F, Martino M, Fraioli A, Torre G, et al. No effects of oral vitamin D supplementation on non‐alcoholic fatty liver disease in patients with type 2 diabetes: a randomized, double‐blind, placebo‐controlled trial. BMC Medicine 2016;14:92. [DOI] [PMC free article] [PubMed] [Google Scholar]
Esmat 2015 {published data only}
- Esmat G, Raziky M, Elsharkawy A, Sabry D, Hassany M, Ahmed A, et al. Impact of vitamin D supplementation on sustained virological response in chronic hepatitis C genotype 4 patients treated by pegylated interferon/ribavirin. Journal of Interferon & Cytokine Research 2015;35(1):49‐54. [DOI] [PubMed] [Google Scholar]
Foroughi 2016 {published data only}
- Foroughi M, Maghsoudi Z, Askari G. The effect of vitamin D supplementation on blood sugar and different indices of insulin resistance in patients with non‐alcoholic fatty liver disease (NAFLD). Iranian Journal of Nursing and Midwifery Research 2016;21(1):100‐4. [DOI] [PMC free article] [PubMed] [Google Scholar]
- Foroughi M, Maghsoudi Z, Ghiasvand R, Iraj B, Askari G. Effect of vitamin D supplementation on C‐reactive protein in patients with nonalcoholic fatty liver. International Journal of Preventive Medicine 2014;5(8):969‐75. [PMC free article] [PubMed] [Google Scholar]
Lorvand Amiri 2016 {published data only}
- Lorvand Amiri H, Agah S, Mousavi SN, Hosseini AF, Shidfar F. Regression of non‐alcoholic fatty liver by vitamin D supplement: a double‐blind randomized controlled clinical trial. Archives of Iranian Medicine 2016;19(9):631‐8. [PubMed] [Google Scholar]
- Lorvand Amiri H, Agah S, Tolouei Azar J, Hosseini S, Shidfar F, Mousavi SN. Effect of daily calcitriol supplementation with and without calcium on disease regression in non‐alcoholic fatty liver patients following an energy‐restricted diet: randomized, controlled, double‐blind trial. Clinical Nutrition 2016;16:31260‐2. [DOI] [PubMed] [Google Scholar]
Mobarhan 1984 {published data only}
- Mobarhan SA, Russell RM, Recker RR, Posner DB, Iber FL, Miller P. Metabolic bone disease in alcoholic cirrhosis: a comparison of the effect of vitamin D2, 25‐hydroxyvitamin D, or supportive treatment. Hepatology 1984;4(2):266‐73. [DOI] [PubMed] [Google Scholar]
Nimer 2012 {published data only}
- Nimer A, Mouch A. Vitamin D improves viral response in hepatitis C genotype 2‐3 naïve patients. World Journal of Gastroenterology 2012;18(8):800‐5. [DOI] [PMC free article] [PubMed] [Google Scholar]
Pilz 2016 {published data only}
- Pilz S, Putz‐Bankuti C, Gaksch M, Spindelboeck W, Haselberger M, Rainer F, et al. Effects of vitamin D supplementation on serum 25‐Hydroxyvitamin D concentrations in cirrhotic patients: a randomized controlled trial. Nutrients 2016;8(5):pii: E278. [DOI] [PMC free article] [PubMed] [Google Scholar]
Sharifi 2014 {published data only}
- Sharifi N, Amani R, Hajiani E, Cheraghian B. Does vitamin D improve liver enzymes, oxidative stress, and inflammatory biomarkers in adults with non‐alcoholic fatty liver disease? A randomized clinical trial. Endocrine 2014;47(1):70‐80. [DOI] [PubMed] [Google Scholar]
Shiomi 1999a {published data only}
- Shiomi S, Masaki K, Habu D, Takeda T, Nishiguchi S, Kuroki T, et al. Calcitriol for bone disease in patients with cirrhosis of the liver. Journal of Gastroenterology and Hepatology 1999;14(6):547‐52. [DOI] [PubMed] [Google Scholar]
Shiomi 1999b {published data only}
- Shiomi S, Masaki K, Habu D, Takeda T, Nishiguchi S, Kuroki T, et al. Calcitriol for bone loss in patients with primary biliary cirrhosis. Journal of Gastroenterology 1999;34(2):241‐5. [DOI] [PubMed] [Google Scholar]
Vosoghinia 2016 {published data only}
- Vosoghinia H, Esmaeilzadeh A, Ganji A, Hosseini SM, Jamehdar SA, Salehi M, et al. Vitamin D in standard HCV regimen (PEG‐Interferon plus Ribavirin), its effect on the early virologic r response rate: a clinical trial. Razavi Int J Med 2016;4(2):e36632. [Google Scholar]
Xing 2013 {published data only}
- Xing T, Qiu G, Zhong L, Ling L, Huang L, Peng Z. Calcitriol reduces the occurrence of acute cellular rejection of liver transplants: a prospective controlled study. Pharmazie 2013;68(10):821‐6. [PubMed] [Google Scholar]
Yokoyama 2014 {published data only}
- Yokoyama S, Takahashi S, Kawakami Y, Hayes CN, Kohno H, Kohno H, et al. Effect of vitamin D supplementation on pegylated interferon/ribavirin therapy for chronic hepatitis C genotype 1b: a randomized controlled trial. Journal of Viral Hepatitis 2014;21(5):348‐56. [DOI] [PubMed] [Google Scholar]
References to studies excluded from this review
Atsukawa 2013 {published data only}
- Atsukawa M, Tsubota A, Shimada N, Kondo C, Itokawa N, Nakagawa A, et al. Efficacy of alfacalcidol on PEG‐IFN/ribavirin combination therapy for elderly patients with chronic hepatitis C: a pilot study. Hepatitis Monthly 2013;13(12):e14872. [DOI] [PMC free article] [PubMed] [Google Scholar]
Benetti 2008 {published data only}
- Benetti A, Crosignani A, Varenna M, Giussani CS, Allocca M, Zuin M, et al. Primary biliary cirrhosis is not an additional risk factor for bone loss in women receiving regular calcium and vitamin D supplementation: a controlled longitudinal study. Journal of Clinical Gastroenterology 2008;42(3):306‐11. [DOI] [PubMed] [Google Scholar]
Bitetto 2010 {published data only}
- Bitetto D, Fabris C, Fornasiere E, Pipan C, Fumolo E, Cussigh A, et al. Vitamin D supplementation improves response to antiviral treatment for recurrent hepatitis C. Transplant International 2011;24(1):43‐50. [DOI] [PubMed] [Google Scholar]
Fernández Fernández 2016 {published data only}
- Fernández Fernández N, Linares Torres P, Joáo Matias D, Jorquera Plaza F, Olcoz Goñi JL. Vitamin D deficiency in chronic liver disease, clinical‐epidemiological analysis and report after vitamin d supplementation [Déficit de vitamina D en la enfermedad hepática crónica, análisis clínico epidemiológico y tras aporte vitamínico]. Gastroenterologia y Hepatologia 2016;39(5):305‐10. [DOI] [PubMed] [Google Scholar]
Floreani 2007 {published data only}
- Floreani A, Carderi I, Ferrara F, Rizzotto ER, Luisetto G, Camozzi V, et al. A 4‐year treatment with clodronate plus calcium and vitamin D supplements does not improve bone mass in primary biliary cirrhosis. Digestive and Liver Disease 2007;39(6):544‐8. [DOI] [PubMed] [Google Scholar]
Kitson 2016 {published data only}
- Kitson MT, Pham A, Gordon A, Kemp W, Roberts SK. High‐dose vitamin D supplementation and liver histology in NASH. Gut 2016;65(4):717‐8. [DOI] [PubMed] [Google Scholar]
Kondo 2013 {published data only}
- Kondo Y, Kato T, Kimura O, Iwata T, Ninomiya M, Kakazu E, et al. 1(OH) vitamin D3 supplementation improves the sensitivity of the immune‐response during Peg‐IFN/RBV therapy in chronic hepatitis C patients‐case controlled trial. PloS One 2013;8(5):e63672. [DOI] [PMC free article] [PubMed] [Google Scholar]
Ladero 2013 {published data only}
- Ladero JM, Torrejón MJ, Sánchez‐Pobre P, Suárez A, Cuenca F, Orden V, et al. Vitamin D deficiency and vitamin D therapy in chronic hepatitis C. Annals of Hepatology 2013;12(2):199‐204. [PubMed] [Google Scholar]
Long 1978 {published data only}
- Long RG, Varghese Z, Meinhard EA, Skinner RK, Wills MR, Sherlock S. Parenteral 1,25‐dihydroxycholecalciferol in hepatic osteomalacia. British Medical Journal 1978;1(6105):75‐7. [DOI] [PMC free article] [PubMed] [Google Scholar]
Malham 2012 {published data only}
- Malham M, Peter Jørgensen S, Lauridsen AL, Ott P, Glerup H, Dahlerup JF. The effect of a single oral megadose of vitamin D provided as either ergocalciferol (D2) or cholecalciferol (D3) in alcoholic liver cirrhosis. European Journal of Gastroenterology & Hepatology 2012;24(2):172‐8. [DOI] [PubMed] [Google Scholar]
Papapostoli 2016 {published data only}
- Papapostoli I, Lammert F, Stokes CS. Effect of short‐term vitamin D correction on hepatic steatosis as quantified by controlled attenuation parameter (CAP). Journal of Gastrointestinal and Liver Diseases 2016;25(2):175‐81. [DOI] [PubMed] [Google Scholar]
Rode 2010 {published data only}
- Rode A, Fourlanos S, Nicoll A. Oral vitamin D replacement is effective in chronic liver disease [Fréquence du déficit en vitamine D et effet de la supplémentation orale au cours des maladies chroniques du foie]. Gastroentérologie Clinique et Biologique 2010;34(11):618‐20. [DOI] [PubMed] [Google Scholar]
Stokes 2016 {published data only}
- Stokes CS, Grünhage F, Baus C, Volmer DA, Wagenpfeil S, Riemenschneider M, et al. Vitamin D supplementation reduces depressive symptoms in patients with chronic liver disease. Clinical Nutrition (Edinburgh, Scotland) 2016;35(4):950‐7. [DOI] [PubMed] [Google Scholar]
Terrier 2015 {published data only}
- Terrier B, Lapidus N, Pol S, Serfaty L, Ratziu V, Asselah T, et al. Vitamin D in addition to peg‐interferon‐alpha/ribavirin in chronic hepatitis C virus infection: ANRS‐HC25‐VITAVIC study. World Journal of Gastroenterology 2015;21(18):5647‐53. [DOI] [PMC free article] [PubMed] [Google Scholar]
References to ongoing studies
IRCT2016020326342N1 {published data only}
- Effectiveness of Vitamin D Supplementation on Severity of Cirrhosis Based on CHILD and MELD Scores in Patients with Decompensate Cirrhosis.. Ongoing study March 2016..
NCT02779465 {published data only}
- Study of Oral Vitamin D Treatment for the Prevention of Hepatocellular Carcinoma in Patients with Chronic Hepatitis B.. Ongoing study June 2016..
Additional references
Arteh 2010
- Arteh J, Narra S, Nair S. Prevalence of vitamin D deficiency in chronic liver disease. Digestive Diseases and Sciences 2010;55(9):2624‐8. [DOI] [PubMed] [Google Scholar]
Atef 2017
- Atef SH. Vitamin D assays in clinical laboratory: past, present and future challenges. Journal of Steroid Biochemistry and Molecular Biology 2017 Feb 24 [Epub ahead of print]. [DOI] [PubMed] [Google Scholar]
Autier 2014
- Autier P, Boniol M, Mullie P. Vitamin D status and ill health: a systematic review. The Lancet. Diabetes & Endocrinology 2014;2(1):76‐89. [DOI] [PubMed] [Google Scholar]
Autier 2016
- Autier P. Vitamin D status as a synthetic biomarker of health status. Endocrine 2016;51(2):201‐2. [DOI] [PubMed] [Google Scholar]
Begg 1994
- Begg CB, Mazumdar M. Operating characteristics of a rank correlation test for publication bias. Biometrics 1994;50(4):1088‐101. [PubMed] [Google Scholar]
Bischoff‐Ferrari 2009
- Bischoff‐Ferrari H. Vitamin D: what is an adequate vitamin D level and how much supplementation is necessary. Best Practice & Research. Clinical Rheumatology 2009;23(6):789‐95. [DOI] [PubMed] [Google Scholar]
Bitetto 2011
- Bitetto D, Fabris C, Falleti E, Toniutto P. Vitamin D deficiency and HCV chronic infection: what comes first. Journal of Hepatology 2011;55(4):944‐5. [DOI] [PubMed] [Google Scholar]
Bitetto 2012
- Bitetto D, Fabris C, Fornasiere E, Pipan C, Fumolo E, Cussigh A, et al. Vitamin D supplementation improves response to antiviral treatment for recurrent hepatitis C. Transplant International 2012;24(1):43‐50. [DOI] [PubMed] [Google Scholar]
Bjelakovic 2014a
- Bjelakovic G, Gluud LL, Nikolova D, Whitfield K, Wetterslev J, Simonetti RG, et al. Vitamin D supplementation for prevention of mortality in adults. Cochrane Database of Systematic Reviews 2014, Issue 1. [DOI: 10.1002/14651858.CD007470.pub3] [DOI] [PMC free article] [PubMed] [Google Scholar]
Bjelakovic 2014b
- Bjelakovic G, Gluud LL, Nikolova D, Whitfield K, Krstic G, Wetterslev J, et al. Vitamin D supplementation for prevention of cancer in adults. Cochrane Database of Systematic Reviews 2014, Issue 6. [DOI: 10.1002/14651858.CD007469.pub2] [DOI] [PMC free article] [PubMed] [Google Scholar]
Bolland 2006
- Bolland MJ, Grey AB, Ames RW, Mason BH, Horne AM, Gamble GD, et al. Determinants of vitamin D status in older men living in a subtropical climate. Osteoporosis International 2006;17(12):1742‐8. [DOI] [PubMed] [Google Scholar]
Bolland 2014
- Bolland MJ, Grey A, Gamble GD, Reid IR. The effect of vitamin D supplementation on skeletal, vascular, or cancer outcomes: a trial sequential meta‐analysis. Lancet, Diabetes Endocrinology 2014;2(4):307‐20. [DOI] [PubMed] [Google Scholar]
Borenstein 2009
- Borenstein M, Hedges LV, Higgins T, Rothstein HR. Introduction to Meta‐Analysis. Chichester (UK): John Wiley & Sons, 2009. [Google Scholar]
Bradburn 2007
- Bradburn MJ, Deeks JJ, Berlin JA, Russell Localio A. Much ado about nothing: a comparison of the performance of meta‐analytical methods with rare events. Statistics in Medicine 2007;26:53‐77. [DOI] [PubMed] [Google Scholar]
Brok 2008
- Brok J, Thorlund K, Gluud C, Wetterslev J. Trial sequential analysis reveals insufficient information size and potentially false positive results in many meta‐analyses. Journal of Clinical Epidemiology 2008;61(8):763‐9. [DOI] [PubMed] [Google Scholar]
Brok 2009
- Brok J, Thorlund K, Wetterslev J, Gluud C. Apparently conclusive meta‐analyses may be inconclusive ‐ Trial sequential analysis adjustment of random error risk due to repetitive testing of accumulating data in apparently conclusive neonatal meta‐analyses. International Journal of Epidemiology 2009;38(1):287‐98. [DOI] [PubMed] [Google Scholar]
Cacopardo 2012
- Cacopardo B, Camma C, Petta S, Pinzone MR, Cappellani A, Zanghi A, et al. Diagnostic and therapeutical role of vitamin D in chronic hepatitis C virus infection. Frontiers in Bioscience (Elite Edition) 2012;4:1276‐86. [DOI] [PubMed] [Google Scholar]
Chan 2004
- Chan AW, Hróbjartsson A, Haahr MT, Gøtzsche PC, Altman DG. Empirical evidence for selective reporting of outcomes in randomized trials: comparison of protocols to published articles. JAMA 2004;291(20):2457‐65. [DOI] [PubMed] [Google Scholar]
Chen 2014
- Chen EQ, Shi Y, Tang H. New insight of vitamin D in chronic liver diseases. Hepatobiliary & Pancreatic Diseases International 2014;13(6):580‐5. [DOI] [PubMed] [Google Scholar]
Chiang 2011
- Chiang KC, Yeh CN, Chen MF, Chen TC. Hepatocellular carcinoma and vitamin D: a review. Journal of Gastroenterology and Hepatology 2011;26(11):1597‐603. [DOI] [PubMed] [Google Scholar]
Cholongitas 2012
- Cholongitas E, Theocharidou E, Goulis J, Tsochatzis E, Akriviadis E, Burroughs K. Review article: the extra‐skeletal effects of vitamin D in chronic hepatitis C infection. Alimentary Pharmacology & Therapeutics 2012;35(6):634‐46. [DOI] [PubMed] [Google Scholar]
Cohen 1960
- Cohen J. A coefficient of agreement for nominal scales. Educational and Psychological Measurement 1960;20:37‐46. [Google Scholar]
Corey 2012
- Corey KE, Zheng H, Mendez‐Navarro J, Delgado‐Borrego A, Dienstag JL, Chung RT, et al. Serum vitamin D levels are not predictive of the progression of chronic liver disease in hepatitis C patients with advanced fibrosis. PloS One 2012;7(2):e27144. [DOI] [PMC free article] [PubMed] [Google Scholar]
Davis 2007
- Davis CD, Dwyer JT. The "sunshine vitamin": benefits beyond bone?. Journal of the National Cancer Institute 2007;99(21):1563‐5. [DOI] [PubMed] [Google Scholar]
Dawson‐Hughes 2005
- Dawson‐Hughes B, Heaney RP, Holick MF, Lips P, Meunier PJ, Vieth R. Estimates of optimal vitamin D status. Osteoporosis International 2005;16(7):713‐6. [DOI] [PubMed] [Google Scholar]
Dawson‐Hughes 2010
- Dawson‐Hughes B, Mithal A, Bonjour JP, Boonen S, Burckhardt P, Fuleihan GE, et al. IOF position statement: vitamin D recommendations for older adults. Osteoporosis International 2010;21(7):1151‐4. [DOI] [PubMed] [Google Scholar]
DeMets 1987
- DeMets DL. Methods for combining randomized clinical trials: strengths and limitations. Statistics in Medicine 1987;6(3):341‐50. [DOI] [PubMed] [Google Scholar]
DerSimonian 1986
- DerSimonian R, Laird N. Meta‐analysis in clinical trials. Controlled Clinical Trials 1986;7(3):177‐88. [DOI] [PubMed] [Google Scholar]
Egger 1997
- Egger M, Davey SG, Schneider M, Minder C. Bias in meta‐analysis detected by a simple, graphical test. BMJ (Clinical Research Ed.) 1997;315(7109):629‐34. [DOI] [PMC free article] [PubMed] [Google Scholar]
Elangovan 2017
- Elangovan H, Chahal S, Gunton JE. Vitamin D in liver disease: current evidence and potential directions. Biochimica et Biophysica Acta 2017;1863(4):907‐16. [DOI] [PubMed] [Google Scholar]
Eliades 2013
- Eliades M, Spyrou E, Agrawal N, Lazo M, Brancati FL, Potter JJ, et al. Meta‐analysis: vitamin D and non‐alcoholic fatty liver disease. Alimentary Pharmacology & Therapeutics 2013;38(3):246‐54. [DOI] [PubMed] [Google Scholar]
Eliades 2015
- Eliades M, Spyrou E. Vitamin D: a new player in non‐alcoholic fatty liver disease. World Journal of Gastroenterology 2015;21(6):1718‐27. [DOI] [PMC free article] [PubMed] [Google Scholar]
Farnik 2013
- Farnik H, Bojunga J, Berger A, Allwinn R, Waidmann O, Kronenberger B, et al. Low vitamin D serum concentration is associated with high levels of hepatitis B virus replication in chronically infected patients. Hepatology 2013;58(4):1270‐6. [DOI] [PubMed] [Google Scholar]
Finkelmeier 2014
- Finkelmeier F, Kronenberger B, Köberle V, Bojunga J, Zeuzem S, Trojan J, et al. Severe 25‐hydroxyvitamin D deficiency identifies a poor prognosis in patients with hepatocellular carcinoma ‐ a prospective cohort study. Alimentary Pharmacology & Therapeutics 2014;39(10):1204‐12. [DOI] [PubMed] [Google Scholar]
Finkelmeier 2015
- Finkelmeier F, Kronenberger B, Zeuzem S, Piiper A, Waidmann O. Low 25‐hydroxyvitamin D levels are associated with infections and mortality in patients with cirrhosis. PloS One 2015;10(6):e0132119. [DOI] [PMC free article] [PubMed] [Google Scholar]
Fortmann 2013
- Fortmann SP, Burda BU, Senger CA, Lin JS, Whitlock EP. Vitamin and mineral supplements in the primary prevention of cardiovascular disease and cancer: an updated systematic evidence review for the U.S. Preventive Services Task Force. Annals of Internal Medicine 2013;159(12):824‐34. [DOI] [PubMed] [Google Scholar]
Furukawa 2007
- Furukawa TA, Watanabe N, Omori IM, Montori VM, Guyatt GH. Association between unreported outcomes and effect size estimates in Cochrane meta‐analyses. JAMA 2007;297(5):468‐70. [DOI] [PubMed] [Google Scholar]
Garattini 2016
- Garattini S, Jakobsen JC, Wetterslev J, Bertelé V, Banzi R, Rath A, et al. Evidence‐based clinical practice: overview of threats to the validity of evidence and how to minimise them. European Journal of Internal Medicine 2016;32:13‐21. [DOI] [PubMed] [Google Scholar]
Geier 2011
- Geier A. Shedding new light on vitamin D and fatty liver disease. Journal of Hepatology 2011;55(2):273‐5. [DOI] [PubMed] [Google Scholar]
Gluud 2006
- Gluud C. The culture of designing hepato‐biliary randomised trials. Journal of Hepatology 2006;44(3):607‐15. [MEDLINE: ] [DOI] [PubMed] [Google Scholar]
Gluud 2007
- Gluud C, Brok J, Gong Y, Koretz RL. Hepatology may have problems with putative surrogate outcome measures. Journal of Hepatology 2007;46(4):734‐42. [DOI] [PubMed] [Google Scholar]
Gluud 2008
Gluud 2017
- Gluud C, Nikolova D, Klingenberg SL. Cochrane Hepato‐Biliary Group. About The Cochrane Collaboration (Cochrane Review Groups (CRGs)). 2017; Issue 1. Art. No.: LIVER.
GRADEpro [Computer program]
- GRADE Working Group, McMaster University. GRADEpro. Hamilton (ON): GRADE Working Group, McMaster University, 2014.
Grey 2010
- Grey A, Bolland M. Vitamin D: a place in the sun. Archives of Internal Medicine 2010;170(13):1099‐100. [DOI] [PubMed] [Google Scholar]
Guallar 2010
- Guallar E, Miller ER 3rd, Ordovas JM, Stranges S. Vitamin D supplementation in the age of lost innocence. Annals of Internal Medicine 2010;152(5):327‐9. [DOI] [PubMed] [Google Scholar]
Guañabens 2010
- Guañabens N, Parés A. Liver and bone. Archives of Biochemistry and Biophysics 2010;503(1):84‐94. [DOI] [PubMed] [Google Scholar]
Gutierrez 2011
- Gutierrez JA, Parikh N, Branch AD. Classical and emerging roles of vitamin D in hepatitis C virus infection. Seminars in Liver Disease 2011;31(4):387‐98. [DOI] [PMC free article] [PubMed] [Google Scholar]
Han 2013
- Han YP, Kong M, Zheng S, Ren Y, Zhu L, Shi H, et al. Vitamin D in liver diseases: from mechanisms to clinical trials. Journal of Gastroenterology and Hepatology 2013;28(Suppl 1):49‐55. [DOI] [PubMed] [Google Scholar]
Harvey 2012
- Harvey NC, Cooper C. Vitamin D: some perspective please. BMJ 2012;345:e4695. [DOI: 10.1136/bmj.e4695] [DOI] [PubMed] [Google Scholar]
Higgins 2002
- Higgins JP, Thompson SG. Quantifying heterogeneity in a meta‐analysis. Statistics in Medicine 2002;21(11):1539‐58. [DOI] [PubMed] [Google Scholar]
Higgins 2003
- Higgins JPT, Thompson SG, Deeks JJ, Altman DG. Measuring inconsistency in meta‐analysis. BMJ 2003;327:557‐60. [DOI] [PMC free article] [PubMed] [Google Scholar]
Higgins 2011
- Higgins JPT, Green S, editors. Cochrane Handbook for Systematic Reviews of Interventions Version 5.1.0 (updated March 2011). The Cochrane Collaboration, 2011. Available from www.cochrane‐handbook.org.
Hilger 2014
- Hilger J, Friedel A, Herr R, Rausch T, Roos F, Wahl DA, et al. A systematic review of vitamin D status in populations worldwide. British Journal of Nutrition 2014;111(1):23‐45. [DOI] [PubMed] [Google Scholar]
Hoan 2016
- Hoan NX, Khuyen N, Binh MT, Giang DP, Tong H, Hoan PQ, et al. Association of vitamin D deficiency with hepatitis B virus‐related liver diseases. BMC Infectious Diseases 2016;16(1):507. [DOI] [PMC free article] [PubMed] [Google Scholar]
Holick 2007
- Holick MF. Vitamin D deficiency. New England Journal of Medicine 2007;357(3):266‐81. [DOI] [PubMed] [Google Scholar]
Holick 2011
- Holick MF, Binkley NC, Bischoff‐Ferrari HA, Gordon CM, Hanley DA, Heaney RP, et al. Evaluation, treatment, and prevention of vitamin D deficiency: an Endocrine Society clinical practice guideline. Journal of Clinical Endocrinology 2011;96(7):1911‐30. [DOI] [PubMed] [Google Scholar]
Hollis 1999
- Hollis S, Campbell F. What is meant by intention to treat analysis? Survey of published randomised controlled trials. BMJ 1999;319(7211):670‐4. [DOI] [PMC free article] [PubMed] [Google Scholar]
Hollis 2008
- Hollis BW. Measuring 25‐hydroxyvitamin D in a clinical environment: challenges and needs. American Journal of Clinical Nutrition 2008;88(2):507S‐10S. [DOI] [PubMed] [Google Scholar]
ICH‐GCP 1997
- International Committee on Harmonization. Code of Federal Regulations & Guidelines. Vol. 1, Philadelphia, US: Barnett International/PAREXEL 1997.
Ioannidis 2009
- Ioannidis JP. Adverse events in randomized trials: neglected, restricted, distorted, and silenced. Archives of Internal Medicine 2009;169(19):1737‐9. [DOI] [PubMed] [Google Scholar]
IOM 2011
- Institute of Medicine. Dietary Reference Intakes for Calcium and Vitamin D. Washington, DC: National Academies Press, 2011. [PubMed] [Google Scholar]
Iruzubieta 2014
- Iruzubieta P, Terán Á, Crespo J, Fábrega E. Vitamin D deficiency in chronic liver disease. World Journal of Hepatology 2014;6(12):901‐15. [DOI] [PMC free article] [PubMed] [Google Scholar]
Jakobsen 2014
- Jakobsen JC, Gluud C, Winkel P, Lange T, Wetterslev J. Thresholds for statistical and clinical significance in systematic reviews with meta‐analytic methods. BMC Medical Research Methodology 2014;14:120. [DOI] [PMC free article] [PubMed] [Google Scholar]
Jakobsen 2017
- Jakobsen JC, Nielsen EE, Feinberg J, Katakam KK, Fobian K, Hauser G, et al. Direct‐acting antivirals for chronic hepatitis C. Cochrane Database of Systematic Reviews 2017, Issue 9. [DOI: 10.1002/14651858.CD012143.pub3] [DOI] [PMC free article] [PubMed] [Google Scholar]
Johnson 2007
- Johnson RT, Dickersin K. Publication bias against negative results from clinical trials: three of the seven deadly sins. Nature Clinical Practice. Neurology 2007;3(11):590‐1. [DOI] [PubMed] [Google Scholar]
Keus 2010
- Keus F, Wetterslev J, Gluud C, Laarhoven CJ. Evidence at a glance: error matrix approach for overviewing available evidence. BMC Medical Research Methodology 2010;10:90. [DOI] [PMC free article] [PubMed] [Google Scholar]
Kitson 2012
- Kitson MT, Roberts SK. D‐livering the message: the importance of vitamin D status in chronic liver disease. Journal of Hepatology 2012;57(4):897‐909. [DOI] [PubMed] [Google Scholar]
Kitson 2014
- Kitson MT, Sarrazin C, Toniutto P, Eslick GD, Roberts SK. Vitamin D level and sustained virologic response to interferon‐based antiviral therapy in chronic hepatitis C: a systematic review and meta‐analysis. Journal of Hepatology 2014;61(6):1247‐52. [DOI] [PubMed] [Google Scholar]
Kjaergard 2001
- Kjaergard LL, Villumsen J, Gluud C. Reported methodologic quality and discrepancies between large and small randomized trials in meta‐analyses. Annals of Internal Medicine 2001;135(11):982‐9. [DOI] [PubMed] [Google Scholar]
Konstantakis 2016
- Konstantakis C, Tselekouni P, Kalafateli M, Triantos C. Vitamin D deficiency in patients with liver cirrhosis. Annals of Gastroenterology 2016;29(3):297‐306. [DOI] [PMC free article] [PubMed] [Google Scholar]
Kovesdy 2013
- Kovesdy Csaba P, Quarles LD. Fibroblast growth factor‐23: what we know, what we don't know, and what we need to know. Nephrology Dialysis Transplantation 2013;28(9):2228‐36. [DOI] [PMC free article] [PubMed] [Google Scholar]
Kupferschmidt 2012
- Kupferschmidt K. Uncertain verdict as vitamin D goes on trial. Science 2012;337(6101):1476‐8. [DOI] [PubMed] [Google Scholar]
Kwok 2013
- Kwok RM, Torres DM, Harrison SA. Vitamin D and nonalcoholic fatty liver disease (NAFLD): is it more than just an association. Hepatology 2013;58(3):1166‐74. [DOI] [PubMed] [Google Scholar]
Lange 2013
- Lange CM, Miki D, Ochi H, Nischalke HD, Bojunga J, Bibert S, et al. Genetic analyses reveal a role for vitamin D insufficiency in HCV‐associated hepatocellular carcinoma development. PloS One 2013;8(5):e64053. [DOI] [PMC free article] [PubMed] [Google Scholar]
Lesser 2007
- Lesser LI, Ebbeling CB, Goozner M, Wypij D, Ludwig DS. Relationship between funding source and conclusion among nutrition‐related scientific articles. PLoS Medicine 2007;4(1):e5. [DOI] [PMC free article] [PubMed] [Google Scholar]
Li 2013
- Li YJ, Tang YW, Shi YQ, Han S, Wang JB, Zhou XM, et al. Polymorphisms in the vitamin D receptor gene and risk of primary biliary cirrhosis: a meta‐analysis. Journal of Gastroenterology and Hepatology 2013;29(4):706‐15. [DOI] [PubMed] [Google Scholar]
Lim 2012
- Lim LY, Chalasani N. Vitamin D deficiency in patients with chronic liver disease and cirrhosis. Current Gastroenterology Reports 2012;14(1):67‐73. [DOI] [PubMed] [Google Scholar]
Lips 2004
- Lips P. Which circulating level of 25‐hydroxyvitamin D is appropriate. Journal of Steroid Biochemistry and Molecular Biology 2004;89‐90(1‐5):611‐4. [DOI] [PubMed] [Google Scholar]
Lips 2006
- Lips P. Vitamin D physiology. Progress in Biophysics and Molecular Biology 2006;92(1):4‐8. [DOI] [PubMed] [Google Scholar]
Lips 2010
- Lips P. Worldwide status of vitamin D nutrition. Journal of Steroid Biochemistry and Molecular Biology 2010;121(1‐2):297‐300. [DOI] [PubMed] [Google Scholar]
Lucas 2005
- Lucas JA, Bolland MJ, Grey AB, Ames RW, Mason BH, Horne AM, et al. Determinants of vitamin D status in older women living in a subtropical climate. Osteoporosis International 2005;16(12):1641‐8. [DOI] [PubMed] [Google Scholar]
Lundh 2017
- Lundh A, Lexchin J, Mintzes B, Schroll JB, Bero L. Industry sponsorship and research outcome. Cochrane Database of Systematic Reviews 2017, Issue 2. [DOI: 10.1002/14651858.MR000033.pub3] [DOI] [PMC free article] [PubMed] [Google Scholar]
Luong 2012
- Loung KV, Nguyen LT. Theoretical basis of a beneficial role for vitamin D in viral hepatitis. World Journal of Gastroenterology 2012;18(38):5338‐50. [DOI] [PMC free article] [PubMed] [Google Scholar]
Luong 2013a
- Luong KV, Nguyen LT. The role of vitamin D in autoimmune hepatitis. Journal of Clinical Medicine Research 2013;5(6):407‐15. [DOI] [PMC free article] [PubMed] [Google Scholar]
Luong 2013b
- Luong KV, Nguyen LT. The role of vitamin D in primary biliary cirrhosis: possible genetic and cell signaling mechanisms. Gastroenterology Research and Practice 2013;2013:602321. [DOI] [PMC free article] [PubMed] [Google Scholar]
Luxon 2011
- Luxon BA. Bone disorders in chronic liver diseases. Current Gastroenterology Reports 2011;13(1):40‐8. [DOI] [PubMed] [Google Scholar]
Mahamid 2013
- Mahamid M, Nseir W, Abu Elhija O, Shteingart S, Mahamid A, Smamra M, et al. Normal vitamin D levels are associated with spontaneous hepatitis B surface antigen seroclearance. World Journal of Gastroenterology 2013;5(6):328‐31. [DOI] [PMC free article] [PubMed] [Google Scholar]
Malham 2011
- Malham M, Jørgensen SP, Ott P, Agnholt J, Vilstrup H, Borre M, et al. Vitamin D deficiency in cirrhosis relates to liver dysfunction rather than aetiology. World Journal of Gastroenterology 2011;17(7):922‐5. [DOI] [PMC free article] [PubMed] [Google Scholar]
Moher 1998
- Moher D, Pham B, Jones A, Cook DJ, Jadad A, Moher M, et al. Does quality of reports of randomised trials affect estimates of intervention efficacy reported in meta‐analysis. Lancet 1998;352(9128):609‐13. [DOI] [PubMed] [Google Scholar]
Moher 2009
- Moher D, Liberati A, Tetzlaff J, Altman DG, the PRISMA Group. Preferred reporting items for systematic reviews and meta‐analyses: the PRISMA Statement. PLoS Medicine 2009;6(7):e1000097. [DOI] [PMC free article] [PubMed] [Google Scholar]
Nordic Trial Alliance 2015
- Nordic Trial Alliance working group on transparency and registration. Transparency and registration in clinical research in the Nordic countries. 07 Group, 2015. [Google Scholar]
Oliveira 2017
- Oliveira KD, Buss C, Tovo CV. Is there an association between vitamin D and liver fibrosis in patients with chronic hepatitis C. Arquivos de Gastroenterologia 2017;54(1):57‐9. [DOI] [PubMed] [Google Scholar]
Paternostro 2017
- Paternostro R, Wagner D, Reiberger T, Mandorfer M, Schwarzer R, Ferlitsch M, et al. Low 25‐OH‐vitamin D levels reflect hepatic dysfunction and are associated with mortality in patients with liver cirrhosis. Wiener Klinische Wochenschrift 2017;129(1‐2):8‐15. [DOI] [PMC free article] [PubMed] [Google Scholar]
Petta 2010
- Petta S, Cammà C, Scazzone C, Tripodo C, Marco V, Bono A, et al. Low vitamin D serum level is related to severe fibrosis and low responsiveness to interferon‐based therapy in genotype 1 chronic hepatitis C. Hepatology 2010;51(4):1158‐67. [DOI] [PubMed] [Google Scholar]
Putz‐Bankuti 2012
- Putz‐Bankuti C, Pilz S, Stojakovic T, Scharnagl H, Pieber TR, Trauner M, et al. Association of 25‐hydroxyvitamin D levels with liver dysfunction and mortality in chronic liver disease. Liver International 2012;32(5):845‐51. [DOI] [PubMed] [Google Scholar]
Reid 2014
- Reid IR, Bolland MJ, Grey A. Effects of vitamin D supplements on bone mineral density: a systematic review and meta‐analysis. Lancet 2014;383(9912):146‐55. [DOI] [PubMed] [Google Scholar]
RevMan 2014 [Computer program]
- The Nordic Cochrane Centre, The Cochrane Collaboration. Review Manager (RevMan). Version 5.3. Copenhagen: The Nordic Cochrane Centre, The Cochrane Collaboration, 2014.
Royle 2003
- Royle P, Milne R. Literature searching for randomized controlled trials used in Cochrane reviews: rapid versus exhaustive searches. International Journal of Technology Assessment in Health Care 2003;19(4):591‐603. [DOI] [PubMed] [Google Scholar]
SACN 2016
- Public Health England. SACN vitamin D and health report, 2016. www.gov.uk/government/publications/sacn‐vitamin‐d‐and‐health‐report (accessed 17 July 2017).
Savović 2012a
- Savović J, Jones H, Altman D, Harris R, Jűni P, Pildal J, et al. Influence of reported study design characteristics on intervention effect estimates from randomised controlled trials: combined analysis of meta‐epidemiological studies. Health Technology Assessment 2012;16(35):1‐82. [DOI] [PubMed] [Google Scholar]
Savović 2012b
- Savović J, Jones HE, Altman DG, Harris RJ, Jüni P, Pildal J, et al. Influence of reported study design characteristics on intervention effect estimates from randomized, controlled trials. Annals of Internal Medicine 2012;157(6):429‐38. [DOI] [PubMed] [Google Scholar]
Sayiner 2016
- Sayiner M, Koenig A, Henry L, Younossi ZM. Epidemiology of nonalcoholic fatty liver disease and nonalcoholic steatohepatitis in the united states and the rest of the world. Clinics in Liver Disease 2016;20(2):205‐14. [DOI] [PubMed] [Google Scholar]
Schulz 1995
- Schulz KF, Chalmers I, Hayes RJ, Altman DG. Empirical evidence of bias. Dimensions of methodological quality associated with estimates of treatment effects in controlled trials. Journal of the American Medical Association 1995;273(5):408‐12. [DOI] [PubMed] [Google Scholar]
Siersma 2007
- Siersma V, Als‐Nielsen B, Chen W, Hilden J, Gluud LL, Gluud C. Multivariable modelling for meta‐epidemiological assessment of the association between trial quality and treatment effects estimated in randomized clinical trials. Statistics in Medicine 2007;26(14):2745‐58. [DOI] [PubMed] [Google Scholar]
Skaaby 2014
- Skaaby T, Husemoen LL, Borglykke A, Jørgensen T, Thuesen BH, Pisinger C, et al. Vitamin D status, liver enzymes, and incident liver disease and mortality: a general population study. Endocrine 2014;47(1):213‐20. [DOI] [PubMed] [Google Scholar]
Skaaby 2016
- Skaaby T, Husemoen LL, Thuesen BH, Pisinger C, Hannemann A, Jørgensen T. Longitudinal associations between lifestyle and vitamin D: a general population study with repeated vitamin D measurements. Endocrine 2016;51:342‐50. [DOI] [PubMed] [Google Scholar]
Stokes 2013
- Stokes CS, Volmer DA, Grünhage F, Lammert F. Vitamin D in chronic liver disease. Liver International 2013;33(3):338‐52. [DOI] [PubMed] [Google Scholar]
Stokes 2014
- Stokes CS, Krawczyk M, Reichel C, Lammert F, Grünhage F. Vitamin D deficiency is associated with mortality in patients with advanced liver cirrhosis. European Journal of Clinical Investigation 2014;44(2):176‐83. [DOI] [PubMed] [Google Scholar]
Storebø 2015
- Storebø OJ, Krogh HB, Ramstad E, Moreira‐Maia CR, Holmskov M, Skoog M, et al. Methylphenidate for attention‐deficit/hyperactivity disorder in children and adolescents: Cochrane systematic review with meta‐analyses and trial sequential analyses of randomised clinical trials. BMJ 2015;351:h5203. [DOI] [PMC free article] [PubMed] [Google Scholar]
Sweeting 2004
- Sweeting MJ, Sutton AJ, Lambert PC. What to add to nothing? Use and avoidance of continuity corrections in meta‐analyses of sparse data. Statistics in Medicine 2004;23:1351‐75. [DOI] [PubMed] [Google Scholar]
Thorlund 2009
- Thorlund K, Devereaux PJ, Wetterslev J, Guyatt G, Ioannidis JP, Thabane L, et al. Can trial sequential monitoring boundaries reduce spurious inferences from meta‐analyses. International Journal of Epidemiology 2009;38(1):276‐86. [DOI] [PubMed] [Google Scholar]
Thorlund 2011a
- Thorlund K, Engstrøm J, Wetterslev J, Brok J, Imberger G, Gluud C. User Manual for Trial Sequential Analysis (TSA). Copenhagen Trial Unit, Centre for Clinical Intervention Research, Copenhagen, Denmark 2011.
Thorlund 2011b
- Thorlund K, Imberger G, Walsh M, Chu R, Gluud C, Wetterslev J, et al. The number of patients and events required to limit the risk of overestimation of intervention effects in meta‐analysis ‐ a simulation study. PloS One 2011;6(10):e25491. [DOI] [PMC free article] [PubMed] [Google Scholar]
Trépo 2013
- Trépo E, Ouziel R, Pradat P, Momozawa Y, Quertinmont E, Gervy C, et al. Marked 25‐hydroxyvitamin D deficiency is associated with poor prognosis in patients with alcoholic liver disease. Journal of Hepatology 2013;59(2):344‐50. [DOI] [PubMed] [Google Scholar]
TSA 2017 [Computer program]
- Copenhagen Trial Unit. Trial Sequential Analysis, version 0.9.5.5. Copenhagen Trial Unit, 2017.
Tsiaras 2011
- Tsiaras WG, Weinstock MA. Factors influencing vitamin D status. Acta Dermato‐venereologica 2011;91(2):115‐24. [DOI] [PubMed] [Google Scholar]
Turner 2013
- Turner RM, Bird SM, Higgins JP. The impact of study size on meta‐analyses: examination of underpowered studies in Cochrane reviews. PloS One 2013;8(3):e59202. [DOI] [PMC free article] [PubMed] [Google Scholar]
van Schoor 2011
- Schoor NM, Lips P. Worldwide vitamin D status. Best Practice & Research. Clinical Endocrinology & Metabolism 2011;25(4):671‐80. [DOI] [PubMed] [Google Scholar]
Villar 2013
- Villar LM, Campo JA, Ranchal I, Lampe E, Romero‐Gomez M. Association between vitamin D and hepatitis C virus infection: a meta‐analysis. World Journal of Gastroenterology 2013;19(35):5917‐24. [DOI] [PMC free article] [PubMed] [Google Scholar]
Wang 2013
- Wang JB, Abnet CC, Chen W, Dawsey SM, Fan JH, Yin LY, et al. Association between serum 25(OH) vitamin D, incident liver cancer and chronic liver disease mortality in the Linxian Nutrition Intervention Trials: a nested case‐control study. British Journal of Cancer 2013;109(7):1997‐2004. [DOI] [PMC free article] [PubMed] [Google Scholar]
Wang 2015
- Wang X, Li W, Zhang Y, Yang Y, Qin G. Association between vitamin D and non‐alcoholic fatty liver disease/non‐alcoholic steatohepatitis: results from a meta‐analysis. International Journal of Clinical and Experimental Medicine 2015;8(10):17221‐34. [PMC free article] [PubMed] [Google Scholar]
Wesley Pike 2005
- Wesley Pike J, Shevde NK. The vitamin D receptor. In: Feldman D, Wesley Pike J, Glorieux FH editor(s). Vitamin D. 2nd Edition. Amsterdam (Netherlands): Elsevier Academic Press, 2005:167‐91. [Google Scholar]
Wetterslev 2008
- Wetterslev J, Thorlund K, Brok J, Gluud C. Trial sequential analysis may establish when firm evidence is reached in cumulative meta‐analysis. Journal of Clinical Epidemiology 2008;61(1):64‐75. [DOI] [PubMed] [Google Scholar]
Wetterslev 2009
- Wetterslev J, Thorlund K, Brok J, Gluud C. Estimating required information size by quantifying diversity in random‐effects model meta‐analyses. BMC Medical Research Methodology 2009;9:86. [DOI] [PMC free article] [PubMed] [Google Scholar]
Wetterslev 2017
- Wetterslev J, Jakobsen JC, Gluud C. Trial Sequential Analysis in systematic reviews with meta‐analysis. BMC Medical Research Methodology 2017;17(1):39. [DOI] [PMC free article] [PubMed] [Google Scholar]
Williamson 2005
- Williamson PR, Gamble C, Altman DG, Hutton JL. Outcome selection bias in meta‐analysis. Statistical Methods in Medical Research 2005;14(5):515‐24. [DOI] [PubMed] [Google Scholar]
Wood 2008
- Wood L, Egger M, Gluud LL, Schulz KF, Jüni P, Altman DG, et al. Empirical evidence of bias in treatment effect estimates in controlled trials with different interventions and outcomes: meta‐epidemiological study. BMJ 2008;336(7644):601‐5. [DOI] [PMC free article] [PubMed] [Google Scholar]
Younossi 2016
- Younossi ZM, Koenig AB, Abdelatif D, Fazel Y, Henry L, Wymer M. Global epidemiology of nonalcoholic fatty liver disease ‐ meta‐analytic assessment of prevalence, incidence, and outcomes. Hepatology 2016;64(1):73‐84. [DOI] [PubMed] [Google Scholar]
Zittermann 2014
- Zittermann A, Ernst JB, Gummert JF, Börgermann J. Vitamin D supplementation, body weight and human serum 25‐hydroxyvitamin D response: a systematic review. European Journal of Nutrition 2014;53(2):367‐74. [DOI] [PubMed] [Google Scholar]
References to other published versions of this review
Bjelakovic 2015
- Bjelakovic G, Nikolova D, Bjelakovic M, Gluud C. Vitamin D supplementation for chronic liver diseases in adults. Vitamin D supplementation for chronic liver diseases in adults. Cochrane Database of Systematic Reviews 2015, Issue 3. [DOI: 10.1002/14651858.CD011564] [DOI] [Google Scholar]