

Abstract
Background
A number of school‐based policies or practices have been found to be effective in improving child diet and physical activity, and preventing excessive weight gain, tobacco or harmful alcohol use. Schools, however, frequently fail to implement such evidence‐based interventions.
Objectives
The primary aims of the review are to examine the effectiveness of strategies aiming to improve the implementation of school‐based policies, programs or practices to address child diet, physical activity, obesity, tobacco or alcohol use.
Secondary objectives of the review are to: Examine the effectiveness of implementation strategies on health behaviour (e.g. fruit and vegetable consumption) and anthropometric outcomes (e.g. BMI, weight); describe the impact of such strategies on the knowledge, skills or attitudes of school staff involved in implementing health‐promoting policies, programs or practices; describe the cost or cost‐effectiveness of such strategies; and describe any unintended adverse effects of strategies on schools, school staff or children.
Search methods
All electronic databases were searched on 16 July 2017 for studies published up to 31 August 2016. We searched the following electronic databases: Cochrane Library including the Cochrane Central Register of Controlled Trials (CENTRAL); MEDLINE; MEDLINE In‐Process & Other Non‐Indexed Citations; Embase Classic and Embase; PsycINFO; Education Resource Information Center (ERIC); Cumulative Index to Nursing and Allied Health Literature (CINAHL); Dissertations and Theses; and SCOPUS. We screened reference lists of all included trials for citations of other potentially relevant trials. We handsearched all publications between 2011 and 2016 in two specialty journals (Implementation Science and Journal of Translational Behavioral Medicine) and conducted searches of the WHO International Clinical Trials Registry Platform (ICTRP) (http://apps.who.int/trialsearch/) as well as the US National Institutes of Health registry (https://clinicaltrials.gov). We consulted with experts in the field to identify other relevant research.
Selection criteria
'Implementation' was defined as the use of strategies to adopt and integrate evidence‐based health interventions and to change practice patterns within specific settings. We included any trial (randomised or non‐randomised) conducted at any scale, with a parallel control group that compared a strategy to implement policies or practices to address diet, physical activity, overweight or obesity, tobacco or alcohol use by school staff to 'no intervention', 'usual' practice or a different implementation strategy.
Data collection and analysis
Citation screening, data extraction and assessment of risk of bias was performed by review authors in pairs. Disagreements between review authors were resolved via consensus, or if required, by a third author. Considerable trial heterogeneity precluded meta‐analysis. We narratively synthesised trial findings by describing the effect size of the primary outcome measure for policy or practice implementation (or the median of such measures where a single primary outcome was not stated).
Main results
We included 27 trials, 18 of which were conducted in the USA. Nineteen studies employed randomised controlled trial (RCT) designs. Fifteen trials tested strategies to implement healthy eating policies, practice or programs; six trials tested strategies targeting physical activity policies or practices; and three trials targeted tobacco policies or practices. Three trials targeted a combination of risk factors. None of the included trials sought to increase the implementation of interventions to delay initiation or reduce the consumption of alcohol. All trials examined multi‐strategic implementation strategies and no two trials examined the same combinations of implementation strategies. The most common implementation strategies included educational materials, educational outreach and educational meetings. For all outcomes, the overall quality of evidence was very low and the risk of bias was high for the majority of trials for detection and performance bias.
Among 13 trials reporting dichotomous implementation outcomes—the proportion of schools or school staff (e.g. classes) implementing a targeted policy or practice—the median unadjusted (improvement) effect sizes ranged from 8.5% to 66.6%. Of seven trials reporting the percentage of a practice, program or policy that had been implemented, the median unadjusted effect (improvement), relative to the control ranged from ‐8% to 43%. The effect, relative to control, reported in two trials assessing the impact of implementation strategies on the time per week teachers spent delivering targeted policies or practices ranged from 26.6 to 54.9 minutes per week. Among trials reporting other continuous implementation outcomes, findings were mixed. Four trials were conducted of strategies that sought to achieve implementation 'at scale', that is, across samples of at least 50 schools, of which improvements in implementation were reported in three trials.
The impact of interventions on student health behaviour or weight status were mixed. Three of the eight trials with physical activity outcomes reported no significant improvements. Two trials reported reductions in tobacco use among intervention relative to control. Seven of nine trials reported no between‐group differences on student overweight, obesity or adiposity. Positive improvements in child dietary intake were generally reported among trials reporting these outcomes. Three trials assessed the impact of implementation strategies on the attitudes of school staff and found mixed effects. Two trials specified in the study methods an assessment of potential unintended adverse effects, of which, they reported none. One trial reported implementation support did not significantly increase school revenue or expenses and another, conducted a formal economic evaluation, reporting the intervention to be cost‐effective. Trial heterogeneity, and the lack of consistent terminology describing implementation strategies, were important limitations of the review.
Authors' conclusions
Given the very low quality of the available evidence, it is uncertain whether the strategies tested improve implementation of the targeted school‐based policies or practices, student health behaviours, or the knowledge or attitudes of school staff. It is also uncertain if strategies to improve implementation are cost‐effective or if they result in unintended adverse consequences. Further research is required to guide efforts to facilitate the translation of evidence into practice in this setting.
Plain language summary
Improving the implementation of school‐based policies and practices to improve student health
The review question: The review sought to assess how effective strategies were in supporting the implementation of school‐based policies and practices to address student diet, physical activity, excessive weight gain, tobacco or alcohol use. We also assessed if these strategies led to improvements in these student health behaviours or weight status, enhanced school staff attitudes or knowledge regarding implementation, had any adverse effects, and were cost‐effective.
Background: Research has identified a range of school‐based policies and practices that may be potentially effective in improving student health behaviours. Despite this, such policies and practices are often not implemented in schools, even in circumstances where it is mandatory to do so. Unless evidence‐based policies and practices are implemented, they can not benefit public health.
Study characteristics: We included 27 trials, 18 of which were conducted in the USA. Fifeteen trials tested strategies to implement healthy eating policies, practice or programs; six trials tested strategies targeting physical activity policies or practices; and three trials targeted tobacco policies or practices. Three trials targeted a combination of health behaviours. None of the included trials sought to increase the implementation of interventions to delay initiation or reduce the consumption of alcohol. The trials tested a range of implementation support strategies, including educational materials, educational meetings, the use of opinion leaders, external funding, local consensus processes, and tailored interventions.
Search date: The evidence is current to 31 August 2016.
Key results: It is uncertain whether the strategies tested improve implementation of the targeted school‐based policies or practices, student health behaviours, or the knowledge or attitudes of school staff. It is also uncertain whether the strategies tested result in unintended adverse effects or whether they are cost‐effective.
Limitations: Trial heterogeneity, and the lack of consistent terminology describing implementation strategies were important limitations of the review.
Quality of evidence: We rated the overall quality of evidence as very low for all outcomes that included trial‐reported effects.
Summary of findings
for the main comparison.
| Strategies for enhancing the implementation of school‐based policies or practices targeting risk factors for chronic disease | |||
|
Patient or population: School aged children (5 ‐ <18 years) Settings: School Intervention: Any strategy (e.g. educational materials, educational meetings, audit and feedback, opinion leaders, education outreach visits) with the intention of improving the implementation of health promoting policies, programs or practices for physical activity, healthy eating, obesity prevention, tobacco use prevention or alcohol use prevention in schools Comparison: No intervention or usual practice (22 trials), alternate intervention (2 trials) or minimal support comparison group (3 trials) | |||
| Outcomes | Impact | Number of Participants (trials) | Quality of the evidence (GRADE)d |
| Implementation of school‐based policies, practices or programs that aim to promote healthy or reduce unhealthy behaviours relating to child diet, physical activity, obesity, or tobacco or alcohol use | We are uncertain whether strategies improve the implementation of school‐based policies, practices or programs that aim to promote healthy or reduce unhealthy behaviours relating to child diet, physical activity, obesity, or tobacco or alcohol use. Among 13 trials reporting dichotomous implementation outcomes—the proportion of schools or school staff (e.g. classes) implementing a targeted policy or practice—the median unadjusted (improvement) effect sizes ranged from 8.5% to 66.6%. Of seven trials reporting the percentage of a practice, program or policy that had been implemented, the median unadjusted effect (improvement), relative to the control ranged from ‐8% to 43%. The effect, relative to control, reported in two trials assessing the impact of implementation strategies on the time per week teachers spent delivering targeted policies or practices ranged from 26.6 to 54.9 minutes per week. |
1599 schools (27 trials) |
Very lowa,b |
| Measures of student physical activity, diet, weight status, tobacco or alcohol use | We are uncertain whether strategies to improve the implementation of school‐based policies, practices or programs targeting risk factors for chronic disease impact on measures of student physical activity, diet, weight status, tobacco or alcohol use | 29,181 studentsf (21 trials) |
Very lowa,b,c |
| Knowledge, skills or attitudes of school staff involved regarding the implementation of health promoting policies, or practices | We are uncertain whether strategies to improve the implementation of school‐based policies, practices or programs targeting risk factors for chronic disease impact on the knowledge, skills or attitudes of school staff | 1347 stakeholders (3 trials) | Very lowa,b |
| Cost or cost‐effectiveness of strategies to improve the implementation | We are uncertain whether strategies to improve the implementation of school‐based policies, practices or programs targeting risk factors for chronic disease are cost‐effective | 42 schools (1 trial) 473 students (1 trial)g |
Very lowa,b,d |
| Unintended adverse effects of strategies to improve implementation on schools, school staff or children | We are uncertain whether strategies to improve the implementation of school‐based policies, practices or programs targeting risk factors for chronic disease result in unintended adverse effects or consequences | 68 schools and 4603 studentsh (2 trials) | Very lowb,c |
| High quality: Further research is very unlikely to change our confidence in the estimate of effect. Moderate quality: Further research is likely to have an important impact on our confidence in the estimate of effect and may change the estimate. Low quality: Further research is very likely to have an important impact on our confidence in the estimate of effect and is likely to change the estimate. Very low quality: We are very uncertain about the estimate. | |||
aDowngraded one level due to limitations in the design.
bDowngraded one level due to unexplained heterogeneity.
cDowngraded one level due to indirectness.
dDowngraded one level due to imprecision.
eGRADE Working Group grades of evidence
fTwo trials measured student behaviour through the use of non‐student data (e.g. purchases) and did not provide student sample sizes.
gOne trial reported on the impact of an intervention on school level revenue. One trial reported on cost‐effectiveness.
hOne trial measured adverse events through the use of non‐student data (i.e. canteen profits) and did not provide student sample sizes.
Background
Description of the condition
Five health risks: physical inactivity, poor diet, tobacco smoking, risky alcohol consumption and obesity are the most common modifiable causes of chronic disease (Lim 2012). These risk factors, all among the top 20 risk factors contributing to global death and disability, each account for a significant proportion of the total global disease burden: physical inactivity (2.8%), dietary risks (9.2%), tobacco smoking (5.5%), alcohol use (3.8%), and high body‐mass index (BMI) (3.8%) (IHME 2013). Together, they were responsible for more than 580 million years lived with disability and 24 million deaths in 2010 (IHME 2013). As a consequence, reducing the impact of these modifiable health risks in the community has been identified as a public health priority (WHO 2011).
Targeting health risks in children is an important chronic disease prevention strategy, as heath behaviours established in childhood are likely to track into adulthood (Swinburn 2011). Schools are an attractive setting for the implementation of child‐focused chronic disease‐prevention initiatives, as they offer continuous and intensive contact with children for prolonged periods (WHO 2012). Furthermore, evidence from systematic reviews support a range of benefits from school‐based health programs (Dobbins 2013; Dusenbury 2003; Foxcroft 2011; Jaime 2009; Kahn 2002; Thomas 2013; Waters 2011). For instance, comprehensive physical activity interventions can improve child activity during the school day, their movement skill proficiency and knowledge for lifetime physical activity (Kahn 2002). A Cochrane review of school‐based programs for smoking found interventions (> one year in duration) that aimed to prevent smoking uptake, reduced smoking rates by up to 12% (Thomas 2013). Similarly, Cochrane reviews of obesity and alcohol prevention programs include examples of interventions that have positive protective effects on child BMI and alcohol misuse (Dusenbury 2003; Foxcroft 2011; Waters 2011). Finally, systematic review evidence also suggests when implemented, school food policies are generally effective in improving the food environment and dietary intake of school students (Jaime 2009).
Despite such evidence, the implementation of policies, intervention programs or recommended practices to reduce these health risks in usual community contexts is poor (AONSW 2012; De Silva‐Sanigorski 2011; Downs 2012; Gabriel 2009; Nathan 2011). Research conducted in Brazil, Canada and Australia for example, suggests that less than 10% of schools are compliant with legislation, policy or nutrition guidelines regarding the sale and promotion of healthy foods in schools (De Silva‐Sanigorski 2011; Downs 2012; Gabriel 2009). In Australia, a recent report highlighted that around 30% of schools did not provide recommended planned physical activity to children (AONSW 2012). Further, in the USA, less than 17% of schools effectively implement substance misuse prevention programs including those related to tobacco and alcohol use (Ennett 2003). The failure to implement evidence‐based programs in the community, denies the public the benefits such health research is intended to deliver. Improving the translation of research findings, characterised by the transition of evidence regarding an intervention to its application in the real world, represents a significant challenge for 21st century medicine (Wolfenden 2015).
Description of the intervention
Research about a treatment or intervention can not lead to health outcomes if health systems, organisations, or professionals do not use interventions with known health benefits (Eccles 2009). The process of research translation, is however, complex. As a conceptual guide, the US National Institute of Health have described five phases of the translation process (T0 – T4) from research discovery to population health impact (Glasgow 2012; Khoury 2010). Earlier phases (T0 – T2) focus on basic science, epidemiology and testing the efficacy of health interventions. Translation Phase 3, known as 'T3', is dedicated to research designed to increase the implementation of evidence‐based interventions, practices, policies or programs in practice (Glasgow 2012). This is achieved through 'implementation strategies'—techniques designed to change practice patterns within specific settings to improve the 'implementation' of evidence‐based health interventions (Glasgow 2012; Rabin 2008). There are a range of potential implementation strategies that can improve the likelihood of schools' implementation of policies and practices to promote student health and reduce the risk of future disease including those listed in the Cochrane Effective Practice and Organisation of Care (EPOC) taxonomy (EPOC 2015). Such strategies might include continuous quality improvement processes, educational materials, performance monitoring, local consensus processes and educational outreach visits.
Why it is important to do this review
Studying the effectiveness of 'implementation strategies', and why these strategies succeed or fail, provides important information for future implementation research and informs decisions of policy makers and practitioners interested in ensuring evidence‐based chronic disease prevention programs are sufficiently implemented to yield health benefits. A number of systematic reviews have been conducted describing the effectiveness of strategies to implement practice guidelines and improve professional practice of clinicians in clinical settings, such as audit and feedback (Ivers 2012), reminders (Arditi 2017), education meetings and workshops (Forsetlund 2009), and incentives (Scott 2011). However, implementation research in non‐clinical community settings has largely been overlooked (Buller 2010). To our knowledge, few systematic reviews concerning implementation of community interventions have been conducted; only one has examined strategies to implement chronic disease prevention programs in schools (Rabin 2010), and another within childcare settings (Wolfenden 2016). The school's review included studies investigating cancer prevention strategies and only identified nine school‐based implementation strategies. Moreover, the review only included studies published until the beginning of 2008. To guide optimal implementation of school‐based health initiatives, further synthesis of evidence is warranted to ensure the inclusion of all relevant studies within the school setting. By doing so, this review aims to provide evidence for how health promotion practitioners and education systems can design and optimally implement policies, programs and practices in the school setting to promote healthy behaviours of children.
Objectives
The primary aims of the review are to examine the effectiveness of strategies aiming to improve the implementation of school‐based policies, programs or practices to address child diet, physical activity, obesity, tobacco or alcohol use.
Secondary objectives of the review are to:
examine the effectiveness of implementation strategies on health behaviour (e.g. fruit and vegetable consumption) and anthropometric outcomes (e.g. BMI, weight);
describe the impact of such strategies on the knowledge, skills or attitudes of school staff involved in implementing health‐promoting policies, programs or practices;
describe the cost or cost‐effectiveness of such strategies; and
describe any unintended adverse effects of strategies on schools, school staff or children.
Methods
Criteria for considering studies for this review
Types of studies
Strategies to improve the implementation of policies, programs or practices are often complex in nature and have been evaluated with a wide variety of methods and designs. While results of randomised controlled trials (RCTs) are considered more robust, using this study design is often impractical or inappropriate for complex public health interventions (Glasgow 1999). We are aware of an ongoing RCT evaluating implementation strategies in schools; however, we envisaged that there would be a paucity of completed trials of this kind. To overcome this, we included any trial (randomised or non‐randomised) with a parallel control group published in any language including the following trial designs:
RCTs and cluster‐RCTs;
quasi‐RCTs and cluster quasi‐RCTs; and
controlled before and after studies (CBAs), cluster‐CBAs.
Studies assessing any strategy aiming to improve the implementation of policies, programs or practices in a school setting which target healthy eating, physical activity, obesity prevention, tobacco or alcohol prevention (or combination of) were eligible. To be included trials were required to report the impact of a defined implementation strategy on an implementation outcome between experimental groups.
Types of participants
We included studies set in schools (e.g. elementary, primary, secondary, middle, high and central schools) where the age of students was typically between five and 18 years. Study participants could be any stakeholders who may influence the uptake, implementation or sustainability of the target health‐promoting policy, practice or program in schools, including teachers, managers, cooks or other staff of schools and education departments. Study participants may also include administrators, officials or representatives of school services, or other health, education, government or non‐government personnel responsible for encouraging or enforcing the implementation of health promoting programs, policies or practices in schools. Studies or arms of trials assessing implementation performed by research staff were excluded.
Types of interventions
We included studies that compared school‐based strategies with the intention of improving the implementation of health‐promoting policies, programs or practices for physical activity, healthy eating, obesity prevention, tobacco use prevention or alcohol use prevention to either 1) other implementation strategies, 2) no implementation strategy or 3) 'usual' practice. For trials that did not describe the comparison conditions, but reported the findings against a comparison group, we assumed that the comparison was usual practice.
To be eligible for inclusion, studies had to include strategies to improve implementation by those involved in the delivery, uptake or use of policies, programs or practices in schools. Strategies could include quality improvement initiatives, education and training, performance feedback, prompts and reminders, implementation resources (e.g. manuals), financial incentives, penalties, communication and social marketing strategies, professional networking, the use of opinion leaders, implementation consensus processes or other strategies. Strategies could be singular or multi‐component and could be directed at individuals, classes or whole schools.
Types of outcome measures
The review examined a range of primary and secondary outcomes of school policy, program or practice implementation. 'Implementation' was defined as the use of strategies to adopt and integrate evidence‐based health interventions and to change practice patterns within specific settings (Glasgow 2012). To be included, outcomes were required to report an action undertaken by a school or school personnel (e.g. proportion of schools implementing canteen services consistent with dietary guidelines or mean number of lessons of teaching curricula implemented). Measures of individual child behaviour (e.g. proportion of children who were moderately or vigorously physically active) were not considered implementation outcomes. Implementation could have occurred at any scale (local, national or international). We included trials reporting only follow‐up data of an implementation outcome (i.e. no baseline data) in instances where the trial utilised a randomised design as baseline values were assumed to have been equivalent (or differ only due to chance), or if the baseline values of implementation outcomes were assumed to be zero, for example, the implementation of a curricula resource not available to schools at baseline.
Primary outcomes
Any objectively or subjectively (self‐reported) assessed measure of school policy, program or practice implementation.
Measures relating to successful implementation including uptake, partial/complete uptake (e.g. consistent with protocol/design), or routine use were included. Such data may be obtained from audits of school records, questionnaires or surveys of staff, direct observation or recordings, examination of routinely collected information from government departments (such as compliance with food standards or breaches of department regulations) or other sources.
Secondary outcomes
Data on secondary outcomes were only extracted for measures corresponding to implementation outcomes. For example, in a trial of an intervention targeting physical activity and healthy eating, but where an implementation strategy and implementation outcome data were only reported for healthy eating policies or practices, only data on secondary trial outcomes only related to diet (foods or beverages consumed by students or student BMI) were extracted. Secondary outcomes could be measured objectively or subjectively (self‐reported) and included:
measures of health behaviours or risk factors relevant to policies, programs, or practices being implemented (i.e. diet; physical activity; tobacco or alcohol use; or measures of excessive weight gain);
any measure of school staff knowledge, skills or attitudes related to the implementation of policies, programs or practices supportive of diet, physical activity, or healthy weight, or tobacco or alcohol use prevention;
estimates of absolute costs or any assessment of the cost‐effectiveness of strategies to improve implementation of policies, programs or practices in schools; and
any reported unintended adverse consequences of a strategy to improve implementation of policies, programs or practices in schools; these could include adverse impacts on child health (e.g. unintended changes in other risk factors, injury), school operation or staff attitudes (e.g. impacts on staff motivation or cohesion following implementation), or the displacement of other key programs, curricula or practice.
We summarise data for all relevant risk factors targeted by the review. Where there were differences in published information between peer‐reviewed and grey literature for the same trial, we preferentially used data from peer‐reviewed publications.
Search methods for identification of studies
We performed a comprehensive search for both published and unpublished research studies across a broad range of information sources to reflect the cross‐disciplinary nature of the topic. Articles published in any language were eligible and there were no restrictions regarding article publication dates.
Electronic searches
We searched the following electronic databases:
Cochrane Library including the Cochrane Central Register of Controlled Trials (CENTRAL) (up to Sept 1st 2016);
MEDLINE (up to Sept 1st 2016);
MEDLINE In‐Process & Other Non‐Indexed Citations (up to Sept 1st 2016);
Embase Classic and Embase (up to Sept 1st 2016);
PsycINFO (up to Sept 1st 2016);
Education Resource Information Center (ERIC) (up to Sept 1st 2016);
Cumulative Index to Nursing and Allied Health Literature (CINAHL) (up to Sept 1st 2016);
Dissertations and Theses (up to Sept 1st 2016); and
SCOPUS (up to Sept 1st 2016).
We adapted the MEDLINE search strategy for each database using database‐specific subject headings, where available (Appendix 1). We included filters used in other systematic reviews for research design (Waters 2011), population (Guerra 2014), physical activity and healthy eating (Dobbins 2013; Guerra 2014; Jaime 2009), obesity (Waters 2011), tobacco use prevention (Thomas 2013), and alcohol misuse (Foxcroft 2011). A search filter for intervention (implementation strategies) was developed based on previous reviews (Wolfenden 2016), and common terms in implementation and dissemination research (Rabin 2008).
Searching other resources
We screened reference lists of all included trials for citations of potentially relevant studies and contacted authors of included studies for other potentially relevant trials. We handsearched all publications between July 2011 and July 2016 in the journals: Implementation Science and Journal of Translational Behavioral Medicine. We also conducted searches of the WHO International Clinical Trials Registry Platform (ICTRP) (http://apps.who.int/trialsearch/) as well as the US National Institutes of Health registry (https://clinicaltrials.gov). One study identified in these searches which had not been published was listed in the 'Characteristics of ongoing studies' table. We consulted with experts in the field to identify other relevant research. To identify companion papers of identified eligible trails we also conducted Google Scholar searches of the first 100 citations identified by a search of the trial name or title.
Data collection and analysis
Selection of studies
Initially, one review author (CW) screened the titles and abstracts retrieved from the literature search to exclude duplicate records and clearly‐ineligible articles (i.e. studies of non‐humans or inappropriate settings). The remaining titles and abstracts were then screened independently by two review authors (AF, AG, LW, NN, RS, RW, SY, or TD). We obtained full texts of all remaining potentially relevant or unclear articles and authors independently reviewed these against our inclusion criteria, in duplicate (AF, AG, LW, NN, RS, RW, RH, SY, or TD). We used Google translate for abstracts or obtained translation from non‐English speaking collaborators. At each stage, disagreements were resolved by discussion between the two review authors and, where required, by consulting a third review author (CW or LW). We recorded reasons for exclusion of studies in the 'Characteristics of excluded studies' table.
Data extraction and management
Two review authors (CW, NN, PB, RS, RW, SY, RH, BP or TD) independently extracted data using a data extraction form adapted from the Cochrane Public Health Group Methods Manual (CPHG 2011). Any disagreements in data extraction were resolved by discussion or by consulting a third author (LW), where required.
Where key data were missing from the study reports, we attempted to contact the authors to obtain the information. Where multiple reports of the same trial were published, we extracted data from those deemed the most applicable. We extracted data comprehensively to cover all relevant outcomes and methods reported across studies.
We extracted and reported the following study characteristics:
information regarding study eligibility as well as the study design, date of publication, school type, country, participant/school demographic/socioeconomic characteristics, number of experimental conditions, as well as information to allow assessment of risk of study bias;
information describing the characteristics of the implementation strategy, including the duration, and intervention (policy, program, practice), the theoretical underpinning of the strategy (if noted in the study), information to allow classification against the EPOC Group 'Taxonomy of Interventions', as well as data describing consistency of the execution of the strategy with a planned delivery protocol (EPOC 2015);
information on trial primary and secondary outcomes, including the data collection method, validity of measures used, effect size and measures of outcome variability, costs and adverse outcomes; and
information on the source(s) of research funding and potential conflicts of interest.
Assessment of risk of bias in included studies
Assessment of risk of bias considered study design and reporting characteristics relevant to the implementation outcomes of the included studies only. For included trials, we used Cochrane's tool for assessing risk of bias, which includes assessments based on domains (selection bias, performance bias, detection bias, attrition bias and reporting bias) (Higgins 2011). We also included additional criteria for cluster‐RCTs including 'recruitment to cluster', 'baseline imbalance', 'loss of clusters', 'incorrect analysis', 'contamination' and 'compatibility with individually RCTs'. We included an additional criterion 'potential confounding' for the assessment of the risk of bias in non‐randomised trial designs. We assessed studies as having 'low', 'high', or 'unclear' risk of bias in accordance with the Cochrane Handbook for Systematic Reviews of Interventions (Higgins 2011).
Two pairs of authors (FT, TCM and AG, AF) assessed risk of bias independently for each study. Any disagreement was resolved by discussion, or if required, by involving an additional author (LW).
Measures of treatment effect
Considerable differences in study measures and primary and secondary outcomes reported by included studies precluded the use of summary statistics to describe treatment effects. As such, we synthesised study findings narratively based on the outcomes reported in the included trials. For dichotomous implementation outcomes, these included absolute differences in the proportion of schools or teachers implementing a policy, practice or program. Continuous outcomes were reported as absolute, non‐standardised differences (mean difference) for measures including an implementation score, the percentage of policy or program implementation, or the frequency or time in which a policy, practice or program implementation occurred.
Unit of analysis issues
We examined cluster trials for unit of analysis errors and identified trials with such errors in the 'Risk of bias' summary.
Dealing with missing data
When outcomes, methods, or results of the studies were missing or unclear, we contacted the corresponding authors of the published trial to supply the data. Any information provided was incorporated into the review as appropriate. Any evidence of potential selective reporting or incomplete reporting of trial data was documented in the 'Risk of bias' tables.
Assessment of heterogeneity
We were unable to examine heterogeneity quantitatively through the use of I2 statistic or forest plots given considerable differences in the implementation strategies, outcomes, measures and comparators that precluded pooling of data. Clinical heterogeneity of the included studies was therefore described narratively.
Assessment of reporting biases
We compared published reports with information in trial registers and protocols to assess reporting bias where such information was available. Where we suspected reporting bias (via assessment of risk of bias in included studies), we attempted to contact study authors and ask them to provide missing outcome data. Instances of potential reporting bias were recorded in the 'Risk of bias' summary.
Data synthesis
Primarily, trial heterogeneity precluded meta‐analysis. The target population in trials varied, including teaching staff, school food service staff and principals. No two trials employed the same implementation strategies. Included studies compared implementation strategies with a different strategy, minimal support control or usual practice. Substantial heterogeneity was particularly evident for trial outcomes in terms of assessment methods and measures, which often occurred at multiple levels (at a school level and/or teacher/class level). The availability of data to pool was further limited by reporting of dichotomous and continuous outcomes which were not able to be combined. Further, the review identified studies with randomised and non‐randomised designs. Pooling data across such trial designs is not recommended (Higgins 2011). Finally, meta‐analysis with a small number of studies (< five) is problematic and can produce imprecise estimates of effect given the underlying assumptions of random‐effects models (Higgins 2008).
As such, and consistent with the approach of a previous Cochrane review of implementation strategies in the childcare setting (Wolfenden 2016), we narratively synthesised trial findings based on the outcomes reported. As trial heterogeneity precluded meta‐analysis, we described the effects of interventions for individual trials by reporting the absolute effect size of the primary outcome measure for policy, practice or program implementation for each study. We focused on specified primary outcomes where available as the intervention (implementation strategy) was designed to directly influence this outcome, the trial (should be) powered to detect meaningful effects on these measures, and as pre‐specified primary (as opposed to secondary) outcomes are considered most appropriate for hypothesis testing. We calculated the effect size by subtracting the change from baseline on the primary implementation outcome for the control (or comparison) group from the change from baseline in the experimental or intervention group. For trials with multiple follow‐up periods, we used data from the final follow‐up period reported. If data to enable calculation of change from baseline were unavailable, we used the differences between groups post‐intervention. Where there were two or more primary implementation outcome measures, we used the median effect size of the primary outcomes and also reported the range. Where the primary outcome measure was not identified by the study authors in the published manuscripts, we used the implementation outcome on which the trial sample size calculation was based or, in its absence, we took the median effect size of all measures judged to be implementation outcomes reported in a manuscript and also reported the range. Such an approach was previously used in the Cochrane review of the effects of audit and feedback on professional practices published by the Cochrane EPOC Group (Ivers 2012), and in our previous review of implementation strategies in the childcare setting (Wolfenden 2016). In instances where subscales of an overall implementation score were reported, in addition to a total scale score, we used the total score as the primary outcome to provide a more comprehensive measure of implementation. We reverse‐scored implementation measures that did not represent an improvement (e.g. the proportion of schools without a healthy menu) in the calculation of median effects. In instances where there were self‐reported, and observed data assessing the same implementation outcome, observational measures were extracted in place of self‐report given observation represents a more objective measure of implementation.
We present the effects of interventions grouped according to the outcome data (continuous or dichotomous) and implementation measure reported. For individual studies where there is no single primary implementation outcome, we describe the median as well as report the range of effects across all comparable measures (description of within‐trial effects). To characterise the effects of interventions across studies (description of between‐study effects), we report an unadjusted median and range of the absolute effects across included trials. The median and range for between‐study effects were calculated using the absolute effect size of the primary implementation outcome of individual trials, or the median of such measures where a single primary outcome was not reported. Such synthesis is intended for descriptive, rather than interpretative purposes, as it does not consider the trial characteristics (e.g. variance) for which trial weights are applied in formal meta‐analysis.
A 'Summary of findings' table was generated to present the key findings of included studies (Table 1 for the main comparison), based on recommendations of the Cochrane EPOC group and the Cochrane Handbook for Systematic Reviews of Interventions and included a list of primary and secondary outcomes in the reviews, a description of the intervention effect, the number of participants and studies addressing the outcome, and a grade for the overall quality of evidence. We used the GRADE system to assess the quality of the body of evidence through consideration of study limitations, consistency of effect, imprecision, indirectness and publication bias. Two review authors assessed the overall quality of evidence using the GRADE system (LW + RH) and consulted a third review author (CW) where consensus on any issues arising could not be reached. The quality of the body of evidence for each individual outcome was graded accordingly from 'High' to 'Very Low' in accordance with the Cochrane Handbook for Systematic Reviews of Interventions (Higgins 2011). Given the variability in the denominator for various implementation outcomes across and within included trials, we report the total number of schools providing data in the 'Summary of findings' table as all trials allocated schools to experimental groups.
Subgroup analysis and investigation of heterogeneity
Quantitative examination of heterogeneity could not be conducted as we were unable to pool outcome data from trials. However, clinical and methodological heterogeneity of studies is described narratively based on participant, intervention, outcome and study design characteristics. In order to investigate the impact of implementation strategies in improving implementation of policies, practices or programs at scale (defined as targeting implementation in 50 or more schools), we performed a narrative synthesis on a subgroup of studies where implementation occurred at scale.
Sensitivity analysis
We did not carry out a sensitivity analysis by removing studies with a high risk of bias from the meta‐analysis as no quantitative synthesis was conducted.
Results
Description of studies
See Characteristics of included studies; Characteristics of excluded studies; Characteristics of ongoing studies.
Results of the search
Full details of each of the included trials are presented in the Characteristics of included studies table. The reasons for excluding trials are reported in the Characteristics of excluded studies table. One ongoing study was identified and details are presented in the Characteristics of ongoing studies table. The electronic search, conducted to 31 August 2016, yielded 22,056 citations (Figure 1). We identified an additional 3125 records from handsearching key journals, checking reference lists of included trials and Google Scholar searches. Through our contact with authors of included trials or, experts in the field, we identified two additional articles. One was in‐press and the other was published later than our search dates; both contained eligible trials. The information obtained through contact with trial authors was incorporated into the Characteristics of included studies table and used in assessments of risk of bias, and trial outcomes. Following screening of titles and abstracts, we obtained the full texts of 385 manuscripts for further review, of which we included 81 manuscripts describing 27 individual trials.
1.
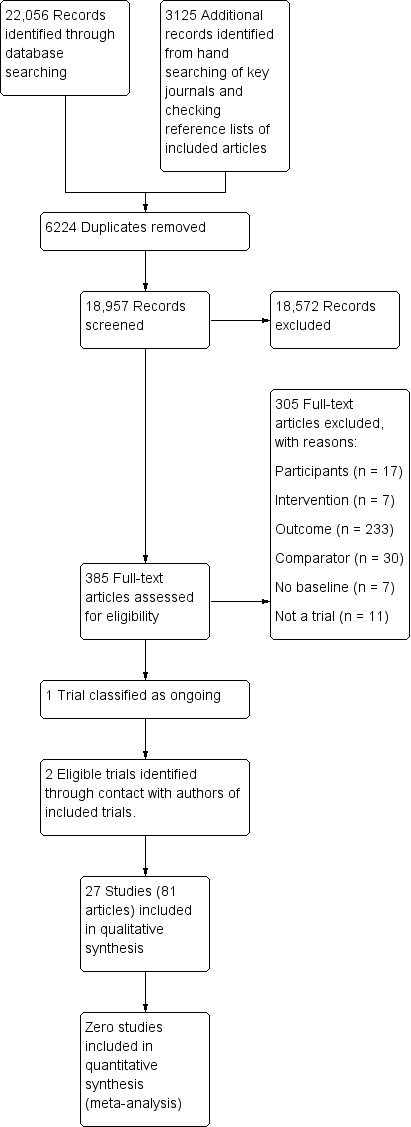
Study flow diagram.
Included studies
Types of studies
Of the 27 included trials 18 were conducted in the USA (Alaimo 2015; Cunningham‐Sabo 2003; Delk 2014; French 2004; Gingiss 2006; Heath 2002; Hoelscher 2010; Lytle 2006; McCormick 1995; Mobley 2012; Perry 1997; Perry 2004; Sallis 1997; Saunders 2006; Simons‐Morton 1988; Story 2000; Whatley Blum 2007; Young 2008), with the remaining trials undertaken in India (Mathur 2016; Saraf 2015), Australia (Nathan 2012; Nathan 2016; Sutherland 2017; Wolfenden 2017; Yoong 2016), Canada (Naylor 2006), and South Africa (De Villiers 2015). Trials were conducted between 1985 (Simons‐Morton 1988), and 2015 (Nathan 2016). In the assessment of implementation outcomes, eight studies employed randomised controlled trial (RCT) designs (Cunningham‐Sabo 2003; De Villiers 2015; Lytle 2006; Mobley 2012; Nathan 2016; Saunders 2006; Wolfenden 2017; Yoong 2016), 11 used cluster‐RCT designs (Delk 2014; French 2004; Mathur 2016; McCormick 1995; Naylor 2006; Perry 1997; Perry 2004; Saraf 2015; Story 2000; Sutherland 2017; Young 2008), and eight were conducted using non‐RCT designs. Trial designs used to evaluate implementation outcomes differed at times from those used to assess behavioural trial outcomes. For example, Saunders and colleagues assessed school level implementation outcomes (RCT design) as well as the impact of intervention implementation on individual student outcomes located within schools (cluster‐RCT). There was considerable variability in the types of participants, implementation strategies and outcomes reported.
Participants
Trials recruited samples of between four (Simons‐Morton 1988), and 828 (Nathan 2012) schools. In four trials, 50 or more schools were allocated to the intervention group to receive implementation support (Alaimo 2015; Gingiss 2006; Nathan 2012; Perry 1997). The majority of trials were conducted in elementary (or primary) schools catering for children between five years and 12 years (Cunningham‐Sabo 2003; De Villiers 2015; Heath 2002; Hoelscher 2010; Nathan 2012; Nathan 2016; Naylor 2006; Perry 1997; Perry 2004; Sallis 1997; Simons‐Morton 1988; Story 2000; Sutherland 2017; Wolfenden 2017; Yoong 2016). Six were conducted in middle schools where children are aged between 11 years and 14 years (Alaimo 2015; Delk 2014; Lytle 2006; Mobley 2012; Saraf 2015; Young 2008), two in both middle and high schools (Gingiss 2006; McCormick 1995), and four were conducted in high schools only typically catering for children aged 13 or 14 years to 18 years of age (French 2004; Mathur 2016; Saunders 2006; Whatley Blum 2007). A number of trials reported they were conducted in low‐income regions or in schools with students from predominantly low‐income households (Alaimo 2015; De Villiers 2015; Heath 2002; Hoelscher 2010; Lytle 2006; Mathur 2016; Mobley 2012; Nathan 2012; Sutherland 2017).
Interventions
There was considerable heterogeneity in the implementation strategies employed. All trials examined multi‐strategic implementation strategies with the most common implementation strategies being educational materials, educational outreach and educational meetings. No two trials examined the same combinations of implementation strategies (Table 2). The EPOC taxonomy descriptors of the implementation strategies employed by included trials are described in Table 3. In the trial reported by McCormick and colleagues, the duration of implementation support ranged from four months to more than four years. Seven trials did not report the use of any theory or theoretical frameworks. Eight trials used explicit implementation or dissemination theories and frameworks including the Charter and Jones Framework (institutional commitment, structural context, role performance, learning activities) (Simons‐Morton 1988), the Theoretical Domains Framework (TDF) (Nathan 2016; Wolfenden 2017), consolidated frameworks for practice change (Nathan 2012), social‐ecological theory (Sutherland 2017), diffusion of innovation and/or organisational change (McCormick 1995; Young 2008), and control theory (Yoong 2016). While other trials reported the use of operant learning theory (Young 2008), Social Contextual Model of Health Behavior Change (Mathur 2016), social‐ecological models (De Villiers 2015, Hoelscher 2010; Mobley 2012; Naylor 2006; Saunders 2006; Young 2008), social cognitive theory (Hoelscher 2010; Lytle 2006; Perry 2004; Story 2000; Young 2008), and social learning theory and/or organisational change (Cunningham‐Sabo 2003; Heath 2002; Perry 1997; Story 2000), often in the description of intervention content rather than a framework to guide an implementation strategy.
1. Interventions across studies.
| Trial | Audit and feedback | Clinical practice guidelines | Continuous quality improvements |
Distribution of supplies |
External funding |
Education games |
Education materials |
Education meeting |
Education outreach visits |
Inter‐ professional education |
Length of consultation |
Local consensus process |
Local opinion leader |
Managerial supervision |
Monitoring performance of delivery |
Pay for performance | Tailored intervention |
The use of communication technology |
Other |
| Alaimo 2015 | X | X | X | X | X | X | |||||||||||||
| Cunningham‐Sabo 2003 | X | X | X | X | |||||||||||||||
| De Villiers 2015 | X | X | X | X | |||||||||||||||
| Delk 2014 | X | X | X | X | X | X | |||||||||||||
| French 2004 | X | X | X | X | |||||||||||||||
| Gingiss 2006 | X | X | X | X | |||||||||||||||
| Heath 2002 | X | X | X | ||||||||||||||||
| Hoelscher 2010 | X | X | X | X | X | X | X | ||||||||||||
| Lytle 2006 | X | X | X | X | |||||||||||||||
| Mathur 2016 | X | X | X | X | X | ||||||||||||||
| McCormick 1995 | X | X | X | ||||||||||||||||
| Mobley 2012 | X | X | X | X | X | X | X | X | |||||||||||
| Nathan 2012 | X | X | X | X | X | X | X | ||||||||||||
| Nathan 2016 | X | X | X | X | X | X | X | ||||||||||||
| Naylor 2006 | X | X | X | X | X | X | |||||||||||||
| Perry 1997 | X | X | X | X | |||||||||||||||
| Perry 2004 | X | X | X | X | X | ||||||||||||||
| Sallis 1997 | X | X | X | X | X | ||||||||||||||
| Saraf 2015 | X | X | X | X | X | X | X | ||||||||||||
| Saunders 2006 | X | X | X | X | X | X | |||||||||||||
| Simons‐Morton 1988 | X | X | X | X | X | X | X | ||||||||||||
| Story 2000 | X | X | |||||||||||||||||
| Sutherland 2017 | X | X | X | X | X | X | |||||||||||||
| Whatley Blum 2007 | X | X | X | X | X | X | X | X | |||||||||||
| Wolfenden 2017 | X | X | X | X | X | X | X | X | X | ||||||||||
| Yoong 2016 | X | X | X | X | |||||||||||||||
| Young 2008 | X | X | X | X | X | X |
2. Definition of EPOC subcategories utilised in the review.
| EPOC subcategory | Definition |
| Audit and feedback | A summary of health workers’ performance over a specified period of time, given to them in a written, electronic or verbal format. The summary may include recommendations for clinical action. |
| Clinical practice guidelines | Clinical guidelines are systematically developed statements to assist healthcare providers and patients to decide on appropriate health care for specific clinical circumstances'(US IOM). |
| Educational materials | Distribution to individuals, or groups, of educational materials to support clinical care, i.e. any intervention in which knowledge is distributed. For example this may be facilitated by the Internet, learning critical appraisal skills; skills for electronic retrieval of information, diagnostic formulation; question formulation. |
| Educational meetings | Courses, workshops, conferences or other educational meetings. |
| Educational outreach visits, or academic detailing | Personal visits by a trained person to health workers in their own settings, to provide information with the aim of changing practice. |
| External funding | Financial contributions such as donations, loans, etc. from public or private entities from outside the national or local health financing system. |
| Inter‐professional education | Continuing education for health professionals that involves more than one profession in joint, interactive learning. |
| Length of consultation | Changes in the length of consultations. |
| Local consensus processes | Formal or informal local consensus processes, for example agreeing a clinical protocol to manage a patient group, adapting a guideline for a local health system or promoting the implementation of guidelines. |
| Local opinion leaders | The identification and use of identifiable local opinion leaders to promote good clinical practice. |
| Managerial supervision | Routine supervision visits by health staff. |
| Monitoring the performance of the delivery of healthcare | Monitoring of health services by individuals or healthcare organisations, for example by comparing with an external standard. |
| Other | Strategies were classified as other if they did not clearly fit within the standard subcategories. |
| Pay for performance – target payments | Transfer of money or material goods to healthcare providers conditional on taking a measurable action or achieving a predetermined performance target, for example incentives for lay health workers. |
| Procurement and distribution of supplies | Systems for procuring and distributing drugs or other supplies. |
| Tailored interventions | Interventions to change practice that are selected based on an assessment of barriers to change, for example through interviews or surveys. |
| The use of information and communication technology | Technology based methods to transfer healthcare information and support the delivery of care. |
Fifteen trials tested strategies to implement healthy eating policies, programs or practices (Alaimo 2015; Cunningham‐Sabo 2003; De Villiers 2015; French 2004; Heath 2002; Lytle 2006; Mobley 2012; Nathan 2012; Nathan 2016; Perry 2004; Simons‐Morton 1988; Story 2000; Whatley Blum 2007; Wolfenden 2017; Yoong 2016), six tested strategies targeting physical activity policies or practices (Delk 2014; Naylor 2006; Sallis 1997; Saunders 2006; Sutherland 2017; Young 2008), and three targeted tobacco policies and practices (Gingiss 2006; Mathur 2016; McCormick 1995). Three trials targeted a combination of health behaviours, with two examining implementation of healthy eating and physical activity policies or practices (Hoelscher 2010; Perry 1997), and one trial examining policies or practices to improve implementation of tobacco control, healthy eating and physical activity initiatives (Saraf 2015). None of the included trials sought to increase the implementation of interventions to delay initiation or reduce the consumption of alcohol.
Outcomes
Implementation outcome follow‐up data were collected six months post‐baseline in one trial (Sutherland 2017), 12 to 14 months in 11 trials (Alaimo 2015; Hoelscher 2010; Mathur 2016; Nathan 2016; Saraf 2015; Saunders 2006; Simons‐Morton 1988; Story 2000; Whatley Blum 2007; Wolfenden 2017; Yoong 2016), while another seven trials collected follow‐up data between 16 months and two years post‐baseline (Cunningham‐Sabo 2003; French 2004; Gingiss 2006; Nathan 2012; Naylor 2006; Perry 2004; Young 2008), with the remaining eight trials collecting data between two and a half and four years post‐baseline (Delk 2014; De Villiers 2015; Heath 2002; Lytle 2006; McCormick 1995; Mobley 2012; Perry 1997; Sallis 1997). Four trials used observation‐based measures to assess implementation outcomes (Perry 2004; Sallis 1997; Story 2000; Whatley Blum 2007). A further three trials used school records or documents (Mobley 2012; Nathan 2016; Wolfenden 2017). While one trial used a combination of observation methods and school records (Lytle 2006). In contrast, 13 trials relied on instruments to assess reported policy or practice implementation including surveys, questionnaires, semi‐structured interviews or teacher/staff completion of log‐books (Alaimo 2015; Cunningham‐Sabo 2003; De Villiers 2015; Delk 2014; Gingiss 2006; Heath 2002; Hoelscher 2010; Mathur 2016; McCormick 1995; Nathan 2012; Naylor 2006; Saunders 2006; Simons‐Morton 1988). Only one trial using these measures reported the instrument had been validated (Nathan 2012). A further six trials used both objective (direct observation or school records) and self‐report (staff completion of log‐books, surveys, questionnaires or interview) techniques for implementation outcome assessment (Perry 1997; French 2004; Saraf 2015; Sutherland 2017; Yoong 2016; Young 2008). Only one of these trials reported the self‐report measures had been validated (Young 2008).
Eight trials assessed student physical activity (Hoelscher 2010; Naylor 2006; Perry 1997; Sallis 1997; Saraf 2015; Saunders 2006; Sutherland 2017; Young 2008). Physical activity behaviours were assessed using accelerometer (Sallis 1997; Sutherland 2017; Young 2008), pedometer (Naylor 2006), student questionnaire (Perry 1997; Naylor 2006; Perry 1997; Saraf 2015; Saunders 2006), observations (Perry 1997; Hoelscher 2010; Sallis 1997) and fitness‐tests (Perry 1997; Naylor 2006; Sallis 1997). Fourteen trials assessed child nutritional intake or food selection using questionnaires (Alaimo 2015; Cunningham‐Sabo 2003; De Villiers 2015; French 2004; Hoelscher 2010; Lytle 2006; Mobley 2012; Perry 1997; Saraf 2015; Simons‐Morton 1988; Story 2000; Whatley Blum 2007), observation (Cunningham‐Sabo 2003; Perry 2004; Story 2000; Wolfenden 2017), or sales data (French 2004). Anthropometric measures, assessed objectively, were collected from participants in nine trials (Cunningham‐Sabo 2003; Heath 2002; Hoelscher 2010; Mobley 2012; Naylor 2006; Perry 1997; Sallis 1997; Saunders 2006; Young 2008). Tobacco use was assessed in two trials using questionnaires (Saraf 2015) and observation (Mathur 2016). No trials assessed student alcohol use. Two trials included a measure that was specified in the study methods as an assessment of potential unintended adverse effects (Mobley 2012; Wolfenden 2017), and two trials reported cost analyses (Heath 2002; Mobley 2012). While, three trials reported on the knowledge, skills or attitudes of school staff regarding implementation (Delk 2014; Gingiss 2006; McCormick 1995).
Types of comparisons
The predominance of trials (n = 22) compared implementation strategies against usual practice or waiting‐list control (Alaimo 2015; Cunningham‐Sabo 2003; French 2004; Gingiss 2006; Heath 2002; Lytle 2006; Mathur 2016; Mobley 2012; Nathan 2016; Naylor 2006; Perry 1997; Perry 2004; Sallis 1997; Saraf 2015; Saunders 2006; Simons‐Morton 1988; Story 2000; Sutherland 2017; Whatley Blum 2007; Wolfenden 2017; Young 2008; Yoong 2016), while two compared against different interventions (Delk 2014; Hoelscher 2010) and three trials used a minimal support comparison group (De Villiers 2015; McCormick 1995; Nathan 2012). Among trials using a minimal support control group, all schools in the study by Nathan and colleagues, including those allocated to control could have received support from a non‐government agency to assist with implementation of a fruit and vegetable break if they sought out such support. In the trial by McCormick and colleagues, control schools received curricula in the mail and technical assistance upon request. Finally in the trial by De Villiers and colleagues, Principals at schools in the control arm received a booklet with “tips” for healthy schools and a guide to resources that could be accessed to assist in creating a healthier school environment. Seven trials did not describe the comparison condition and so we assumed that the comparison was usual practice (Cunningham‐Sabo 2003; Gingiss 2006; Heath 2002; Saraf 2015; Simons‐Morton 1988; Story 2000; Young 2008).
Five trials included more than two trial arms (Alaimo 2015; Delk 2014; Naylor 2006; Perry 1997; Sallis 1997). The School Nutrition Advances Kids (SNAK) study included four conditions, three interventions and one control (Alaimo 2015). The three intervention conditions all sought to improve the implementation of nutrition policies and practices of schools. In all intervention conditions, implementation support included local consensus processes (convened by a coordinated school health team), educational outreach (visit from a trained facilitator), external funding ($1000 to implement aspects of the intervention) and tailored intervention (individualised action plans). In the second intervention group, such support was more intensive, for example, more frequent contact with the trained facilitator and additional funding ($400) for implementation. In the third group, the more intensive implementation support was also offered but schools were asked to implement additional changes to their cafeteria à la carte lines and were provided with a further $1500 (Alaimo 2015). The implementation outcomes reported in the paper combine all intervention conditions into a single group for comparison against the control group, and is reported accordingly in this review.
The Action Schools! British Columbia (BC) program randomised schools into three conditions (Naylor 2006). Two groups received implementation support. The implementation strategies utilised were identical in these two intervention groups, however, in one group post‐training support was provided directly to school teachers via a school facilitator, while in the second group, post‐training support was provided to a designated champion who was asked to activate and support their teacher colleagues (Naylor 2006). The third group served as a usual practice control. For this trial, we combined intervention groups by calculating, relative to the control, the unadjusted median effect (and range) across intervention conditions.
In the Child and Adolescent Trial for Cardiovascular Health (CATCH) trial, schools were randomly assigned to either an intervention condition or a control condition (Perry 1997). Of the 56 schools assigned to intervention, 28 schools were randomly assigned to an intervention arm targeting the same implementation outcomes and including the same implementation strategies, but were also asked to implement programs targeting families. Implementation data for the two intervention groups were combined in the reporting of the paper and the combined data used in this review.
The Sports, Play, and Active Recreation for Kids (SPARK) trial randomised schools to two intervention and one control condition (Sallis 1997). Data were only extracted for two of the three assigned groups; the control group where implementation support was not provided and an experimental group where implementation support was provided to usual teaching staff to implement the intervention. The third group, where physical activity practices were implemented by external specialist physical education teachers hired by the research team was excluded as per review inclusion criteria.
Finally, in the trial by Delk and colleagues, 30 schools were randomised into three conditions. As each condition contained different implementation strategies data were extracted and reported across all conditions.
Other study design characteristics
In a number of trials, decisions regarding study inclusion and data extraction were particularly complex. The SPARK trial included post‐intervention implementation outcome data only, however they used random assignment for six of the seven included schools, randomly allocating them to one of three conditions (Sallis 1997). The remaining school was allocated by the researchers to the control group. Despite the lack of baseline implementation data, given the use of random assignment, and similarity of other trial sample characteristics, the trial was retained in the review. The Texas Tobacco Initiative was also a non‐randomised trial that did not report baseline data for the implementation outcomes, however, was included as the authors state that there were no differences between groups at baseline on these measures (Gingiss 2006). Similarly, for the SPARK program, no single primary implementation outcome was reported. Implementation outcomes included measures of lesson context (management, general knowledge, fitness knowledge, fitness activity, skill drills and game play), measures of teacher behaviour (promotes fitness, demonstrates fitness, instructs generally, manages, observes and off task), as well as measures of lesson duration and frequency (Sallis 1997). However, only for lesson duration and frequency was the desired quantity or direction of effect specified in the published reports (three lessons per week of 30 minutes duration each). While improving lesson context and teacher behaviour was an objective of the support strategy, the desired direction of effect for each measure was not clear. For example, it was unclear if teachers were supported to reduce time spent managing or observing children during class time and more time in promoting fitness. As such, both frequency and duration of lessons were only extracted as outcomes for this trial. Identical measures of lesson context were also reported in the Coordinated Approach to Child Health (CATCH) project (Perry 1997), as well as the El Paso CATCH program (Heath 2002), and were similarly excluded.
A variety of outcomes pertaining to program implementation were reported across the published reports of the CATCH intervention (Perry 1997). At times there was inconsistency in the reported key implementation policies and practices targeted by the program. Given this, implementation outcome data were extracted from the study published by Perry and colleagues as the objective of this paper was specifically to report on program implementation and measures including intervention 'fidelity'. The median effects of these outcomes are reported as no single primary outcome was identified.
Finally, in the Lifestyle Education for Activity Program (LEAP) trial (Saunders 2006), implementation of targeted policies and practices in the experimental group was presented in subgroups of 'high' and 'low' implementers and could not be combined into a single group. As such, effect size estimates for outcomes reported in this trial between groups were unable to be reported.
Excluded studies
Following screening of titles and abstracts, we obtained the full texts of 385 papers for further assessment of eligibility (Figure 1). Of these, 305 papers were considered ineligible. Primary reasons for exclusion included inappropriate: participants n = 17; intervention n = 7; comparator n = 30; and outcomes n = 233. Studies were excluded based on 'inappropriate outcomes' if they: did not report any implementation outcomes; did not report implementation outcomes for both intervention and control groups; or did not report between‐group differences in implementation outcomes. We also excluded 11 papers that did not report the results of a trial; and a further seven studies that were non‐randomised and did not report comparability of implementation outcomes between groups at baseline (i.e. it could not be assumed that differences between groups were zero) (Donnelly 1996; Harvey‐Berino 1998; Hoelscher 2003; Hoelscher 2004; Kelder 2003; O’Brien 2010; Osganian 2003).
Risk of bias in included studies
Assessment of risk of bias considered study design and reporting characteristics relevant to the implementation outcomes of the included studies (Figure 2; Figure 3).
2.

Risk of bias summary: review authors' judgements about each risk of bias item for each included study.
3.
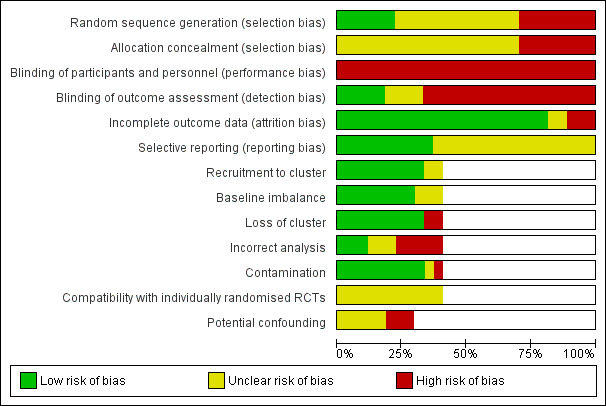
Risk of bias graph: review authors' judgements about each risk of bias item presented as percentages across all included studies.
Allocation
Risk of selection bias differed across the 27 trials. All of the eight non‐randomised trials were considered to have a high risk of selection bias for both random sequence generation and concealment of allocation (Alaimo 2015; Gingiss 2006; Heath 2002; Hoelscher 2010; Nathan 2012; Sallis 1997; Simons‐Morton 1988; Whatley Blum 2007). For the 11 trials with cluster‐RCT designs, only two were considered low risk for random sequence generation (Saraf 2015; Sutherland 2017), using the drawing of lots or computerised random number function to determine allocation to intervention or control groups. While four of the eight trials using RCT designs were considered low risk for random sequence generation (De Villiers 2015; Nathan 2016; Wolfenden 2017; Yoong 2016). The bias for concealment was unclear for all RCTs (Cunningham‐Sabo 2003; De Villiers 2015; Lytle 2006; Mobley 2012; Nathan 2016; Saunders 2006; Wolfenden 2017; Yoong 2016) and cluster‐RCTs (Delk 2014; French 2004; Mathur 2016; McCormick 1995; Nathan 2016; Naylor 2006; Perry 1997; Perry 2004; Saraf 2015; Story 2000; Young 2008).
Blinding
All 27 studies were considered to have high risk of performance bias, due to participants and research personnel not being blind to group allocation. Only four studies had a low risk for implementation outcome assessment, as this was conducted by staff who were blind to group allocation (Mobley 2012; Nathan 2016; Wolfenden 2017; Yoong 2016). Of the remaining 23 studies, detection bias was high for 17 studies primarily due to the use of self‐report measures (Cunningham‐Sabo 2003; Delk 2014; De Villiers 2015; French 2004; Gingiss 2006; Heath 2002; Hoelscher 2010; Mathur 2016McCormick 1995; Nathan 2012; Naylor 2006; Perry 1997; Perry 2004; Saraf 2015; Saunders 2006; Story 2000; Young 2008). For three studies, the risk of detection bias was unclear (Lytle 2006; Sallis 1997; Whatley Blum 2007), and for the remaining three studies, the risk of detection bias was high, low or unclear across one or more outcome measures (Alaimo 2015; Simons‐Morton 1988; Sutherland 2017).
Incomplete outcome data
For the majority of studies, the risk of attrition bias was low, as either all or most schools were still participating in the study at follow‐up, and their data included in the analyses. Two studies had a high attrition bias (Delk 2014; Gingiss 2006). In particular, Gingiss and colleagues reported 25 (19%) of schools were lost for the Principal survey and 50 (37%) schools were lost for the Health Coordinator survey. For the remaining studies, the risk of attrition bias was high, low or unclear for some (McCormick 1995; Sutherland 2017), or unclear for all (Naylor 2006; Sallis 1997), of the reported outcome data.
Selective reporting
Seventeen trials did not have a published protocol paper or trial registration record and therefore it was unclear whether reporting bias had occurred. The risk of reporting bias was low for the remaining 10 studies as protocols, design papers, or reports were available, and all a priori determined outcomes were reported (Cunningham‐Sabo 2003; De Villiers 2015; Mathur 2016; Mobley 2012; Nathan 2016; Naylor 2006; Sutherland 2017; Wolfenden 2017; Yoong 2016; Young 2008).
Other potential sources of bias
Eleven studies used a cluster‐RCT design (Delk 2014; French 2004; Mathur 2016; McCormick 1995; Naylor 2006; Perry 1997; Perry 2004; Saraf 2015; Story 2000; Sutherland 2017; Young 2008). Therefore we assessed the potential risk of additional biases for this group. For the potential risk of recruitment (to cluster) bias, two studies had an unclear risk (Delk 2014; McCormick 1995), while nine studies were low risk as randomisation to groups occurred either post‐recruitment or post‐baseline assessment (French 2004; Mathur 2016; Naylor 2006; Perry 1997; Perry 2004; Saraf 2015; Story 2000; Sutherland 2017; Young 2008). Regarding risk of bias due to baseline imbalances, three studies were at unclear risk while the remaining eight studies had a low risk due to the random allocation of schools to experimental groups, stratification by school characteristics, or adjustments for baseline differences being made within the analyses (Delk 2014; French 2004; McCormick 1995; Perry 1997; Perry 2004; Story 2000; Sutherland 2017; Young 2008). All studies except Delk 2014 and Sutherland 2017 had a low risk for loss of clusters. Only three studies had a low risk for incorrect analysis as the appropriate statistical analysis was undertaken to allow for clustering within groups (Naylor 2006; Perry 1997; Young 2008). Five studies were judged as having a high risk for incorrect analysis (Delk 2014; Mathur 2016; McCormick 1995; Saraf 2015Story 2000), while for three studies the analysis performed was unclear (French 2004; Perry 2004; Sutherland 2017). The risk of contamination was judged as high for one trial (Perry 2004). All 11 cluster‐RCTs were at unclear risk for compatibility with individually‐randomised trials as we were unable to determine whether a herd effect existed.
For the eight studies with non‐randomised designs, three studies were considered to have a high risk of bias due to potentially confounding factors (Gingiss 2006; Nathan 2012; Simons‐Morton 1988). For the remaining studies (n = 5) it was unclear whether confounders were adequately adjusted for.
Effects of interventions
See: Table 1
The majority of included trials reported significant improvements in at least one implementation outcome measure (Table 4). All primary implementation outcomes in nine trials (Delk 2014; French 2004; Mathur 2016; Nathan 2012; Nathan 2016; Naylor 2006; Sallis 1997; Story 2000; Wolfenden 2017), were significant, as were the majority of outcomes reported across implementation measures in a further five trials (Gingiss 2006; Hoelscher 2010; Perry 1997; Saraf 2015; Whatley Blum 2007). In three trials there was no significant improvements in implementation on any primary implementation outcomes (Alaimo 2015; McCormick 1995; Yoong 2016), and in six trials there was improvement in 50% or less of implementation outcomes reported (Cunningham‐Sabo 2003; Heath 2002; Lytle 2006; Perry 2004; Sutherland 2017; Young 2008). Four trials did not report significance testing of between‐group comparisons of implementation outcomes (De Villiers 2015; Mobley 2012; Saunders 2006; Simons‐Morton 1988).
3. Summary of intervention, measures and absolute intervention effect size in included studies.
| Trial | Trial name | Targeted risk factor | Implementation strategies | Comparison |
Primary Implementation outcome and measures |
Effect size | P < 0.05 |
| Alaimo 2015 | School Nutrition Advances Kids (SNAK) | Nutrition | Clinical practice guidelines, educational materials, educational outreach visits, external funding, local consensus processes, tailored interventions | Usual practice or waiting‐list control |
Continuous: i) Nutrition policy score and ii) Nutrition education and/or practice score (2 measures) |
Median (range) 0.65 (0.2 to 1.1) |
0/2 |
| Cunningham‐Sabo 2003 | Pathways | Nutritionc | Clinical practice guidelines, educational materials, educational meetings, educational outreach visits | Usual practice |
Continuous: Nutrient content of school meals % of calories from fat breakfast/lunch (2 measures) |
Median (range) ‐3% (‐3.3% to ‐2.7%) |
1/2 |
| De Villiers 2015 | HealthKick | Nutritionc | Local opinion leaders, educational materials, educational outreach visits, education meetings | Minimal support control |
Dichotomous: % implementing a variety of policies and practices (3 measures) |
Median (range) 25% (12.5% to 29.5%) |
Not reported |
| Delk 2014 | No trial name | Physical activity | Local consensus process, educational meetings, clinical practice guidelines, educational outreach visits, tailored interventions, other | Different implementation strategy |
Continuous: % of teachers that conducted activity breaks weekly (1 measure 2 comparisons) Dichotomous: % implementing a variety of policies and practices (2 measures 4 comparisons) |
Median (range) 13.3% (11.1% to 15.4%) Median (range) 26.5% (19.4% to 31.9%) |
6/6 |
| French 2004 | Trying Alternative Cafeteria Options in Schools (TACOS) | Nutrition | Local consensus processes, tailored intervention, educational meetings, pay for performance | Usual practice or waiting‐list control |
Continuous % of program implementation (5 measures) |
Median (range) 33% (11% to 41%) |
5/5 |
| Gingiss 2006 | Texas Tobacco Prevention Initiative | Tobacco | Educational meetings, educational outreach visits, external funding, local consensus processes | Usual practice |
Dichotomous: % implementing a variety of policies and practices (10 measures) |
Median (range) 18.5% (‐1% to 59%) | 7/10 |
| Heath 2002 | El Paso Coordinated Approach to Child Health (El Paso CATCH) | Nutritionc | Educational materials, educational meetings, educational outreach visits | Usual practice |
Continuous: % fat in school meal (2 measures) Sodium of school meals (2 measures) |
Effect size Median (range) ‐1.7% (‐4.4% to 1%) Median (range) ‐29.5 (‐48 to ‐11) |
1/4 |
| Hoelscher 2010 | Travis County Coordinated Approach To Child Health (CATCH) Trial | Nutrition and physical activity | Educational materials, educational meetings, educational outreach visits, pay for performance, other, the use of information and communication technology, local consensus process | Different implementation strategy |
Continuous: Mean number of lessons/or activities (5 measures) Dichotomous: % implementing a variety of policies and practices (2 measures) |
Median (range) 0.8 (‐0.4 to 1.2) Median (range) 4.4% (3.6% to 5.2%) |
4/7 |
| Lytle 2006 | Teens Eating for Energy and Nutrition at School (TEENS) | Nutrition | Educational materials, educational meetings, local opinion leaders, local consensus processes | Usual practice or waitling‐list control |
Dichotomous: % of schools offering or selling targeted foods (4 measures) |
Median (range) 8.5% (4% to 12%) |
2/4 |
| Mathur 2016 | Bihar School Teachers Study (BSTS) | Tobacco | Local opinion leader, continuous quality improvement, education materials, education meeting, local consensus process | Usual practice or waiting‐list control |
Dichotomous: % implementing a variety of policies and practices (2 measures) |
Median (range) 56.9% (36.3% to 77.5%) |
2/2 |
| McCormick 1995 | The North Carolina School Health and Tobacco Education Project (SHTEP)/ Skills Management and Resistance Training (SMART) | Tobacco | Educational meetings, local consensus processes, educational materials | Minimal support control |
Dichotomous: % later implementation of curriculum for school district (1 measure) Continuous: Mean extent later implementation for school district (% of total curriculum activities taught) (1 measure) |
Effect Size (95%CI) 16.7% (‐37.7% to 64.1%) Mean differencea 0.56% |
0/2 |
| Mobley 2012 | HEALTHY study | Nutritionc | Educational games, educational meetings, external funding, tailored intervention, educational materials, educational outreach, other, the use of information and communication technology | Usual practice or waiting‐list control |
Dichotomous: % schools meeting various nutrition goals (12 measures) |
Median (range) 15.5% (0% to 88%) |
Not reported |
| Nathan 2012 | Good for Kids. Good for Life | Nutrition | Educational materials, educational meetings, local consensus processes, local opinion leaders, other, monitoring the performance of the delivery of the healthcare, tailored interventions | Minimal support control |
Dichotomous: % Schools implementing a vegetable and fruit break (1 measure) |
Mean difference (95%CI) 16.2% (5.6% to 26.8%) |
1/1 |
| Nathan 2016 | No trial name | Nutrition | Audit and feedback, continuous quality improvement, education materials, education meeting, local consensus process, local opinion leader, tailored intervention, other | Usual practice |
Dichotomous: % implementing a variety of policies and practices (2 measures) |
Median (range) 35.5% (30.0% to 41.1%) |
2/2 |
| Naylor 2006 | Action Schools! British Columbia (BC) | Physical activity | Educational materials, educational meetings, educational outreach meetings, local consensus process, other, tailored Interventions | Usual practice or waiting‐list control |
Continuous: Minutes per week of physical activity implemented in the classroom (1 measure 2 comparisons) |
Median (range) 54.9 minutes (46.4 to 63.4) |
2/2 |
| Perry 1997 | Child and Adolescent Trial for Cardiovascular Health (CATCH) | Nutrition and physical activityd | Educational materials, educational meetings, educational outreach visits, other | Usual practice or waiting‐list control |
Continuous: % of kilocalories from fat in school lunch (1 measure) Mean milligrams of sodium in lunches (1 measure) Cholesterol milligrams in lunches (1 measure) Quality of PE lesson % of 7 activities observed (1 measure) |
Effect size Mean difference (95%CI) ‐4.3% (‐5.8% to ‐2.8%) Mean difference (95%CI) ‐100.5 (‐167.6 to ‐33.4) Mean difference (95%CI) ‐8.3 (‐16.7 to 0.1) Mean difference (95%CI) 14.3% (11.6% to 17.0%) |
3/4 |
| Perry 2004 | The Cafeteria Power Plus project | Nutrition | Educational meetings, educational outreach visits, educational materials, local consensus processes, other |
Usual practice or waiting‐list control |
Continuous: % of program implementation (2 measures) Mean number of fruit and vegetables available (2 measures) |
Median (range) 14% (‐2% to 30%) Median (range) 0.64 (0.48 to 0.80) |
2/4 |
| Sallis 1997 | Sports, Play, and Active Recreation for Kids (SPARK) | Physical activity | Educational materials, educational meetings, educational outreach visits, length of consultation, other | Usual practice or waiting‐list control |
Continuous: Duration (minutes) per week of physical education lessons (1 measure) Frequency (per week) of physical education lessons (1 measures) |
Mean difference (95%CI) 26.6 (15.3 to 37.9) Mean difference (95%CI) 0.8 (0.3 to 1.3) |
2/2 |
| Saraf 2015 | No trial name | Nutrition, physical activity and tobacco | Educational games, educational materials, educational meetings, local consensus processes, local opinion leaders, tailored Interventions, other | Usual practice |
Dichotomous: % implementing a variety of policies and practices (6 measures) |
Median (range) 36.9% (‐5.3% to 79.5%) |
5/6 |
| Saunders 2006 | Lifestyle Education for Activity Program (LEAP) | Physical activity | Educational materials, educational meetings, educational outreach visits, local consensus processes, local opinion leaders, other | Usual practice or waiting‐list control |
Continuous: School level policy and practice related to physical activity from the school administrators perspective (9 measures) |
N/Ab | Not reported |
| Simons‐Morton 1988 | Go for Health | Nutritionc | Educational materials, educational outreach visits, local consensus processes, local opinion leaders, managerial supervision, monitoring of performance, other | Usual practice |
Continuous: Macronutrient content of school meals (2 measures) |
N/Ab | Not reported |
| Story 2000 | 5‐a‐Day Power Plus | Nutrition | Educational meetings, other | Usual practice |
Continuous: Mean number of fruit and vegetables available (2 measures) % of guidelines implemented and % of promotions held (4 measures) |
Median (range) 1.15 (1 to 1.3) Median (range) 38.4% (28.5% to 43.8%) |
6/6 |
| Sutherland 2017 | Supporting Children’s Outcomes using Rewards, Exercise and Skills (SCORES) | Physical activity | Audit and feedback, education materials, education meeting, education outreach visits, local opinion leader, other | Usual practice or waiting‐list control |
Dichotomous: % implementing a variety of policies and practices (2 measures) Continuous: Physical education lesson quality score (1 measures) % of program implementation (4 measures) |
Median (range) 19% (16% to 22%) Mean difference 21.5a Median (range) ‐8% (‐18% to 2%) |
0/2 1/1 0/4 |
| Whatley Blum 2007 | No trial name | Nutrition | Clinical practice guidelines, educational materials, educational meetings, educational outreach visits, external funding, distribution of supplies, local consensus process, other | Usual practice or waiting‐list control |
Continuous: % of food and beverage items meeting guideline nutrient and portion criteria (6 measures) |
Median (range) 42.95% (15.7% to 60.6%) |
5/6 |
| Wolfenden 2017 | No trial name | Nutrition | Audit and feedback, continuous quality improvement, external funding, education materials, education meeting, education outreach visits, local consensus process, local opinion leader, tailored intervention, other | Usual practice |
Dichotomous: % implementing a variety of policies and practices (2 measures) |
Median (range) 66.6% (60.5% to 72.6%) |
2/2 |
| Yoong 2016 | CAFÉ | Nutrition | Audit and feedback, continuous quality improvement, education materials, tailored intervention | Usual practice |
Dichotomous: % implementing a variety of policies and practices (2 measures) |
Median (range) 21.6% (15.6% to 27.5%) |
0/2 |
| Young 2008 | Trial of Activity for Adolescent Girls (TAAG) | Physical activity | Education materials, education meetings, educational outreach visits, inter‐professional education, local consensus processes, local opinion leaders | Usual practice |
Dichotomous: % implementing a variety of policies and practices (7 measures) Continuous: Average number of physical activity programs taught (1 measure) |
Median (range) 9.3% (‐6.8% to 55.5%) Effect Size (95%CI) 5.1 (‐0.4 to10.6) |
1/8 |
aNo measure of variability.
bDid not report aggregate results by group.
cPhysical activity was also a targeted risk factor however, this component did not meet our inclusion criteria (e.g. implementation outcomes unavailable, study staff implemented physical activity component etc.) and was therefore, not considered in our review.
dTobacco use was also a targeted risk factor however, this component did not meet our inclusion criteria (e.g. implementation outcomes unavailable) and was therefore, not considered in our review.
Implementation strategies compared with waiting list, usual practice or minimal support controls
Dichotomous measures
Thirteen trials reported dichotomous implementation outcomes (De Villiers 2015; Gingiss 2006; Lytle 2006; Mathur 2016; McCormick 1995; Mobley 2012; Nathan 2012; Nathan 2016; Saraf 2015; Sutherland 2017; Wolfenden 2017; Yoong 2016; Young 2008). In most instances, such trials reported the proportion of schools or school staff (e.g. classes) implementing a targeted policy or practice. Across the trials, the unadjusted median effect size was 19% (range 8.5% to 66.6%) (Table 4).
The largest effect was reported for the trial conducted by Wolfenden and colleagues who conducted a RCT of 70 schools throughout the Hunter Region of New South Wales, Australia. In this trial, support was provided to implement a healthy school canteen policy restricting the availability of unhealthy foods sold in school canteens. The implementation support included local opinion leader (Principals), audit and feedback (menu reviews with feedback reports), education meeting (one five‐hour training), external funding (reimbursements), education materials (printed instructions), education outreach visits (one and three months post‐canteen training), local consensus process (with canteen staff), continuous quality improvements processes, tailored intervention (individualised goal setting and action planning with managers) and other strategies (marketing in schools, provision of equipment and congratulatory letters for achieving change). Relative to control, the unadjusted median improvement in implementation across two implementation outcomes was 66.6% (range 60.5% to 72.6%) as assessed by copies of canteen menus (Wolfenden 2017).
The smallest effects were reported by Lytle and colleagues who conducted a RCT in which local opinion leaders and consensus processes (school nutritional advisory councils to discuss improvements to the school food environment), educational meetings (food service staff training), and educational materials (information and tools) improved the proportion of schools selling targeted foods by a median (unadjusted) of 8.5% (range 4% to 12%) as assessed via school production records and periodic observation. Similarly, the unadjusted median improvement, relative to control, in the proportion of schools implementing a variety of practices promoting physical activity in the classroom was 9.3% (range ‐6.8% to 55.5%) following implementation support strategies including education meetings (teacher training workshops), educational materials (classroom instructional materials), educational outreach visits (on‐site support for PE teachers), inter‐professional education (collaborations between schools community agencies and university staff), local opinion leaders (recruitment of program champions), and local consensus processes (development of local implementation goals) in the cluster‐RCT by Young and colleagues (Young 2008).
Continuous data
Implementation Score
Three trials reported the effects of an implementation strategy using a score (Alaimo 2015; Saunders 2006; Sutherland 2017). The cluster‐RCT found a significant improvement in the implementation of quality physical education lessons assessed via classroom observations (MD, 21.5 P = < 0.01) (Sutherland 2017). Implementation support included audit and feedback (reports on lesson quality), education materials (lesson booklets, posters, whistles, lanyards and fundamental motor skill cards), education meeting (90‐minute professional learning workshop), education outreach visits (by staff with a physical education background to classroom teachers), local opinion leader (school champion) and other (equipment and ongoing support) (Sutherland 2017).
The other two trials report little improvement in implementation score outcomes. The non‐randomised SNAK trial of 65 low‐income schools reported no difference in change scores on nutrition policy (mean difference (MD) 0.2, 95% confidence interval (CI) ‐0.7 to 1.1) or nutrition education and/or practice (MD 1.1, 95%CI ‐0.8 to 3.0) as assessed by the School Environment and Policy Survey (Alaimo 2015). Schools in the experimental group were supported to implement self‐selected nutrition policies and practices via educational outreach (visits from a trained facilitator), tailored intervention (assessment and development of an action plan), and payment for performance (receipt of funding) strategies. Some randomly selected experimental schools were also asked to convene local school health teams (local consensus processes) or implement specifically a nutrition policy in their cafeteria à la carte. Control schools received support following the study.
In the LEAP RCT, implementation was assessed using an organisational assessment instrument designed to assess school level policy and practice related to physical activity from the school administrators' perspective. Implementation support provided as part of the trial included educational outreach visits (visit from program staff), local opinion leaders (use of a LEAP champion in the school to work with program staff), educational meetings (training before and during the school year), educational materials (including books and video tapes), local consensus process (involving LEAP staff, the LEAP champion and LEAP school teams) as well as other equipment such as hand weights and pedometers. Scores for the nine essential intervention elements assessed by the instrument were provided for the control group, however these were presented separately in the intervention group for 'high' and 'low' implementing schools. No aggregated between‐group comparisons were reported. Nonetheless, scores for control schools were within the scores for high‐ and low‐implementing schools of the intervention group for six of the nine measures (Saunders 2006).
Percentage of programs implemented
Seven trials reported the percentage of an intervention program or program content that had been implemented, the effects of which were mixed (French 2004; McCormick 1995; Perry 1997; Perry 2004; Story 2000; Sutherland 2017; Whatley Blum 2007). The unadjusted median effect, relative to the control in the proportion of program or program content implemented was 14.3% (range ‐8% to 43%). In their non‐randomised study, Whatley and colleagues allocated four public high schools to receive support to implement a low‐fat, low‐sugar guideline in à la carte and vending programs. Implementation support included educational outreach (visits to the schools food and beverage supplier), educational materials (suppliers were given healthy product lists), procurement and distribution of supplies (food service directors were given lists of vendors that met guidelines), practice guidelines (recipe preparation techniques), educational meetings (presentations to school staff), external funding ($1500 allocated to school liaison personnel), a local consensus process (establishment of committee) and other EPOC strategies (early consultation with school staff to obtain co‐operation). Compared with four schools allocated to control, the unadjusted median proportion of food or beverage items meeting criteria requirements of the guideline across à la carte, food vending, and beverage vending programs was 42.95% (range 15.7% to 60.6%), assessed via observation (Whatley Blum 2007). A large effect was also reported in the Trying Alternative Cafeteria Options in Schools (TACOS) cluster‐RCT of 20 schools conducted by French and colleagues. Implementation support to improve the foods available at school included local consensus processes (quarterly meetings between research and food service staff), tailored intervention (tailored lists of higher‐ and lower ‐at foods for schools), educational meetings (training for the students to facilitate implementation) and pay for performance (student groups were offered financial incentives for completing each promotion between $100 and $300). The unadjusted median effect, relative to a waiting‐list control group across implementation measures in the trial was 33% (range 11% to 41%) (French 2004). There were two trials in which there were no improvements in measures of the percentage of programs implemented (McCormick 1995; Sutherland 2017).
Measures of the frequency of implementation
Four trials compared the number or frequency with which program or targeted practices were implemented (Perry 2004; Sallis 1997; Story 2000; Young 2008). Evaluation of the non‐randomised SPARK trial reported that intervention schools taught, on average 0.8 physical education lessons per week more than control schools (Sallis 1997). Implementation support in the trial included educational outreach visits (by a physical education specialist), educational meetings (training), increasing the length of consultation (to include more classroom instruction and practice time), educational materials (yearly plan), as well as another non‐classifiable strategy (equipment was provided). In the cluster‐RCT titled the Trial of Activity for Adolescent Girls (TAAG), intervention schools taught five additional physical activity programs relative to control following education meetings (workshops for teachers), educational materials (instructional and social marketing materials), educational outreach visits (regular on‐site support to conduct lessons), inter‐professional education (collaborations were created between schools and community agencies), local opinion leaders (program champions were recruited and trained to direct the intervention) and local consensus processes, although the difference was not statistically significant (Young 2008). Two trials sought to increase the availability of fruits and vegetables at school cafeterias. The unadjusted median improvement from two measures of fruit and vegetable availability (both significant) among intervention schools in the 5‐a‐Day Power Plus cluster‐RCT was 1.15 items following educational meetings (staff training workshop for which staff were paid to attend) and other provisioning of free fruit and vegetables (Story 2000). In the Cafeteria Power Plus cluster‐RCT, the unadjusted median improvement across two measures of fruit and vegetable availability (one of which was significant) relative to control schools was 0.64 items following educational meetings (monthly meetings with cooks), outreach visits (weekly visits from research staff), educational materials (flyers and posters), local consensus processes (monthly meetings were held with the cook managers) and other special events (Perry 2004).
Time‐based measures of implementation.
Two trials reported the impact of implementation strategies on the time per week teachers implemented physical activity or physical education lessons, with improvements, relative to control ranging from 26.6 minutes per week to 54.9 minutes per week. In their non‐randomised trial, Sallis and colleagues report a significant increase in the duration of physical education lessons among schools receiving educational outreach visits and education meetings assessed via observation as part of the SPARK trial (Sallis 1997). Similarly, in their cluster‐RCT of the Action Schools! BC intervention, Naylor and colleagues reported an improvement (averaged across two experimental conditions) of 54.9 minutes of physical activity implemented in the classroom as assessed by teacher survey (Naylor 2006). Implementation support included tailored intervention (individualised action plans), educational meetings (teacher training), educational materials (planning guide and resources), local consensus process (a committee of school stakeholders to support implementation), educational outreach visits (for teachers) as well as other resources.
Macronutrient content of food served
Four trials reported changes in the macronutrient content of food available at school (Cunningham‐Sabo 2003; Heath 2002; Perry 1997; Simons‐Morton 1988). A non‐randomised trial by Simons‐Morton and colleagues sought to improve implementation of specific practices regarding school lunch, physical education and classroom health education in the Go for Health project. However, only implementation of school lunch initiatives (changes to the macronutrients of sodium and fat in school lunches) was reported post‐intervention. Furthermore, the trial did not report data aggregated by group, instead reporting changes in macronutrient context of school menus for each of the two experimental and two control schools separately. For the nutrition component, implementation support was primarily designed to facilitate implementation of low‐fat and low‐sodium school lunches. Analysis of lunch menus found pre‐ to post‐intervention reductions in sodium content of school meals reduced by 1148.1 mg and 695.5 mg, respectively in each of the intervention schools and remained stable in both control schools over the same period. Further, intervention schools reduced total fat content of school meals by 16.8 g and 11.6 g compared with 8.9 g and 6.1 g among the control schools.
In the Pathways RCT, Cunningham‐Sabo and colleagues examined the impact of providing practice guidelines (for food service), educational outreach visits (on‐site training and professional development for school food service staff twice per year), educational materials (posters, videos, guides etc.), and educational meetings (food service working group met monthly to establish and carry out the intervention). The intervention, relative to the control, reported significant reductions in the percentage of calories from fat included in meals served for school breakfast (‐3.3%, P = 0.03) but not lunches (‐2.7%, P = 0.10) (Cunningham‐Sabo 2003). Two trials examining the CATCH program assessed the macronutrient content of foods served to children at school (Heath 2002; Perry 1997). In the CATCH cluster‐RCT, schools received educational meetings (staff training), educational outreach visits (support visits to school staff to implement Eat Smart), and educational materials (Smart Choices manual) to improve the nutritional quality of school meals (Perry 1997). The intervention reduced the percentage of kilocalories from fat in school meals by 4.3%, sodium by 100 mg and cholesterol in school lunches by 8.3 mg. The El Paso CATCH non‐randomised trial reported unadjusted median reductions, reported across measures of macronutrient content of school breakfast and lunch respectively of 1.7% (range ‐1% to 4.4%) in the percentage of fat in school meals, and 29.5 mg of sodium (range 11 to 48) (Heath 2002).
Comparisons of different implementation strategies
Two trials compared different implementation strategies (Delk 2014; Hoelscher 2010). The Travis County CATCH trial compared the effects of two different implementation strategies to support the implementation of the CATCH program aimed at preventing child obesity in a non‐randomised design (Hoelscher 2010). The first implementation strategy included educational meetings (training and booster sessions for team members from each school), educational materials (CATCH coordination kit providing “how‐to” implementation instructions), local consensus process (community meetings), pay for performance ($2,000 to 5,000 for exemplary CATCH implementation), the use of information and communication technologies (social marketing strategies), educational outreach visits (facilitator visits), and other (family fun events) to implement the program. The second strategy included the same implementation strategies, however the level of support was more intense and often included elements to engage the community in supporting implementation. For example, there were more frequent educational outreach visits, educational meetings targeting community members, community members were engaged in consensus processes, and there were additional implementation resources such as guides and the inclusion of the Centers for Disease Control and Prevention School Health Index as a planning tool. There were small improvements in reporting of continuous measures of implementation favouring the more intensive implementation support. Specifically, four of the five continuous implementation measures, that reported the mean number of activities or practices implemented over the study period significantly increased. The unadjusted median effect size across such measures was 0.8 activities over a 12‐month period (range ‐0.4 to 1.2). Of the two dichotomous measures reporting the proportion of schools or staff implementing a policy or practice, neither was significantly different between groups at follow‐up. The unadjusted median effect size across these two measures was 4.4% (3.6% to 5.2%).
The Central Texas CATCH compared the effects of three combinations of implementation strategies in an effort to promote the implementation of activity breaks by classroom teachers in a cluster‐RCT (Delk 2014). The basic arm included a local consensus process (team developed at each school), clinical practice guidelines (activity break guidelines for teachers), and educational meetings (teaching training's of guidelines) while, the basic plus arm consisted of all of the basic activities plus educational outreach visits (monthly facilitator visits) and tailored interventions (individualised strategies to promote activity breaks on school campuses). The third arm (basic plus‐SM) consisted of all of the aforementioned strategies plus an unclassifiable EPOC strategy (social marketing campaigns). Significant differences in the percentage of teachers reporting implementing weekly activity breaks throughout the school year were found across the basic, basic plus and basic plus‐SM arm (23.3%, 34.4% and 38.7%, respectively). Similarly, significant changes occurred in the percentage of teachers conducting at least one activity break per year as well as those conducting an activity break in the week prior to data collection. For these, significant changes occurred in four of four implementation outcomes (two measures, four comparisons) wherein, the unadjusted median increase in effect size was 26.5% (range 19.4% to 31.9%).
Subgroup analyses of strategies to improve implementation 'at scale'
Four trials were conducted of strategies that sought to achieve implementation 'at scale', that is, across samples of at least 50 schools. Three trials reported significant improvements in the majority of the reported implementation outcomes (Gingiss 2006; Nathan 2012; Perry 1997), while one reported no improvements across any implementation outcome (Alaimo 2015). Among the two trials reporting dichotomous measures, the unadjusted median improvement in the proportion of schools implementing a policy or practice ranged from 16.2% in the study by Nathan and colleagues (Nathan 2012) to 18.5% in the trial by Gingiss and colleagues (Gingiss 2006).
The effectiveness of implementation strategies on health behaviour and anthropometric outcomes
Twenty‐one trials reported the effects of interventions on child health behaviour or anthropometric outcomes (Alaimo 2015; Cunningham‐Sabo 2003; De Villiers 2015; French 2004; Heath 2002; Hoelscher 2010; Lytle 2006; Mathur 2016; Mobley 2012; Naylor 2006; Perry 1997; Perry 2004; Sallis 1997; Saraf 2015; Saunders 2006; Simons‐Morton 1988; Story 2000; Sutherland 2017; Whatley Blum 2007; Wolfenden 2017; Young 2008). Seventeen studies were randomised trials (Cunningham‐Sabo 2003; De Villiers 2015; French 2004; Lytle 2006; Mathur 2016; Mobley 2012; Nathan 2016; Naylor 2006; Perry 1997; Perry 2004; Saraf 2015; Saunders 2006; Story 2000; Sutherland 2017; Wolfenden 2017; Yoong 2016; Young 2008), and six were non‐randomised trials (Alaimo 2015; Heath 2002; Hoelscher 2010; Sallis 1997; Simons‐Morton 1988; Whatley Blum 2007). Three studies targeted multiple health behaviours (Hoelscher 2010; Perry 1997; Saraf 2015), five physical activity only (Naylor 2006; Sallis 1997; Saunders 2006; Sutherland 2017Young 2008), 12 nutrition only (Alaimo 2015; Cunningham‐Sabo 2003; De Villiers 2015; French 2004; Heath 2002; Lytle 2006; Mobley 2012; Perry 2004; Simons‐Morton 1988; Story 2000; Whatley Blum 2007; Wolfenden 2017), and one smoking only (Mathur 2016). Overall, there were eight studies that assessed student physical activity or sedentary behaviour (Hoelscher 2010; Naylor 2006; Perry 1997; Sallis 1997; Saraf 2015; Saunders 2006; Sutherland 2017; Young 2008),14 that assessed student dietary intake (Alaimo 2015; Cunningham‐Sabo 2003; De Villiers 2015; French 2004; Hoelscher 2010; Lytle 2006; Mobley 2012; Perry 1997; Perry 2004; Saraf 2015; Simons‐Morton 1988; Story 2000; Whatley Blum 2007; Wolfenden 2017), nine weight status, BMI or skin‐folds (Cunningham‐Sabo 2003; Heath 2002; Hoelscher 2010; Mobley 2012; Naylor 2006; Perry 1997; Sallis 1997; Saunders 2006; Young 2008), and two tobacco smoking (Saraf 2015; Mathur 2016). Due to varying study designs, interventions and outcome measurements pooling of results was not performed.
Physical activity and sedentary behaviour
Three of eight trials reported no improvements on student physical activity following strategies to enhance implementation of physical activity promoting policies and practices in schools (Hoelscher 2010; Saraf 2015; Young 2008). Other trials reported improvements in student physical activity on at least some measures (Naylor 2006; Perry 1997; Sallis 1997; Saunders 2006; Sutherland 2017). For example, in a non‐randomised trial reported by McKenzie and colleagues and Sallis and colleagues of the SPARK program, students in classrooms of teachers trained to implement the curricula‐based intervention had greater minutes per week in observed moderate to vigorous physical activity (MVPA) compared to those in the usual physical education program group condition (32.7 minutes versus 17.8 minutes, P < 0.001). There was also a significant difference in the time to complete a mile run for boys but not girls in the teacher‐led condition compared to control. In this trial however, there were no significant differences in weekday or weekend physical activity as assessed via accelerometer. In the Action Schools! BC three‐arm randomised trial, relative to usual practice control, improvements in student step counts assessed via pedometer were reported for boys (MD 1175, 95%CI 97 to 2253, P = 0.03) but not girls (MD 730, 95%CI ‐648 to 2108, P = 0.30) attending schools where external liaison support was provided to facilitate implementation of physical activity policies and practices. No significant differences in step counts, relative to control, were reported for students of either boys (MD 804, 95%CI ‐341 to 1949, P = 0.17) or girls (MD 540, 95%CI ‐874 to 1954, P = 0.45) attending schools where implementation support was provided by school staff ('champions'). When the intervention arms were combined, children in intervention schools demonstrated a significantly greater increase in fitness (20‐m shuttle run) and average physical activity score. Finally, in the CATCH trial of Perry and colleagues, significant improvements were reported across measures of student reported vigorous physical activity and observed MVPA during lesson (% of time) but not general physical activity, nine‐minute distance run, or self‐reported total minutes of daily physical activity.
Three trials included measures of student sedentary behaviour outcomes (Hoelscher 2010; Saraf 2015; Young 2008). The cluster‐RCT by Saraf and colleagues, which examined strategies to implement an intervention consisting of school‐based policies and classroom activities as well as a family component, found that students in intervention schools spent almost 16 minutes less time watching television per day (P < 0.01). Similarly, the Travis County CATCH Trial compared different implementation support strategies to improve aspects of the school classroom, food service, PE activities, family and home environment (Hoelscher 2010). The trial found the proportion of students spending greater than two hours using a computer was 5.6% lower among those attending schools receiving support to implement the CATCH BPC relative to CATCH BP program (P = 0.003). In the TAAG trial, girls in the control schools spent 8.2 more minutes than intervention schools in daily sedentary activities (P = 0.050)(Young 2008). There was no difference between groups on measures of TV or video game use.
Overweight, obesity and adiposity
Mobley 2012 was the only trial to report a positive impact of the intervention on BMI between groups (Cunningham‐Sabo 2003; Heath 2002; Mobley 2012; Naylor 2006; Perry 1997; Sallis 1997; Saunders 2006; Young 2008). Similarly, no significant changes occurred in skin‐folds (Cunningham‐Sabo 2003; Sallis 1997; Perry 1997; Young 2008), or in percentage body fat or weight, in the Pathways or TAAG trials (Cunningham‐Sabo 2003; Young 2008). In the Travis County CATCH Project, a comparative effectiveness trial, students of schools receiving support to implement the CATCH BPC had 7% greater reductions in the proportion of overweight students (P = 0.051) and a 1.7% reduction in the proportion of students who were obese (P = 0.33) compared to those implementing CATCH BP (Hoelscher 2010). In the HEALTHY trial, there were no significant differences between groups in the odds of overweight and obese or waist circumference however, the percentage of students with waist circumference at or above the 90th percentile was lower relative to the control group at follow‐up (Mobley 2012). In the El Paso CATCH trial, there was no differences in waist‐to‐hip ratio or weight between groups at follow‐up however, the rate of increase for girls (2% versus 13%) and boys (1% versus 9%) in the CATCH schools was significantly lower compared to students in the control schools (Heath 2002). Sallis and colleagues assessed calf and triceps skin‐folds, and found no significant difference following support provided to teachers to implement the SPARK program verses control. While impacts on BMI were not reported post‐intervention, interim analyses of the impact of the program suggests that the intervention had no impact on child BMI (Sallis 1997).
Diet
Three trials reported no improvements for intervention students in the measures of school student dietary intake following implementation of a dietary related policy, practice or program (De Villiers 2015; Lytle 2006; Whatley Blum 2007). The remaining trials reported improvements on at least one measure of dietary intake (Alaimo 2015; Cunningham‐Sabo 2003; French 2004; Hoelscher 2010; Mobley 2012; Perry 1997; Perry 2004; Saraf 2015; Simons‐Morton 1988; Story 2000; Wolfenden 2017). For example, a cluster‐RCT evaluating the impact of strategies to implement school policies, classroom activities, and a family component targeting multiple health behaviours, found a higher proportion of students consuming fruits and vegetables three to four times a week (fruits +10%, P < 0.01; vegetables +7.2%, P = 0.01) among children of intervention schools relative to control (Saraf 2015). Significant reductions were also reported in the intake of deep‐fried foods but not salty snacks (Saraf 2015). Similarly, strategies to improve implementation of practices in school food services as part of the CATCH trial found that the intervention significantly reduced total self‐reported energy intake and proportion of intake from fat, saturated fat, polyunsaturated fat and monounsaturated fat, but not carbohydrate, protein, cholesterol, fibre or sodium intake of students (Perry 1997). In their exploratory analysis there were significant improvements in the intake of 6/17 vitamins and minerals measured in the study at follow‐up in the intervention school. Moreover, the HEALTHY trial of Mobley and colleagues, which aimed to improve the nutritional quality of foods and beverages served to students via the National School Lunch Program, the School Breakfast Program and à la carte food services, found that significant changes only occurred in student daily fruit consumption but not energy, macronutrients, fibre, grains, vegetables, legumes, sweets, sweetened beverages, fruit juice or higher‐ or lower‐fat milk.
In the Cafeteria Power Plus project, there was an increase in total fruit serves consumed however, there was no reported increase in the total fruit and vegetable serves consumed (Perry 2004). Support to implement the 5‐a‐Day Power Plus program also yielded significant improvements in school lunch intake for a number of measures of fruit and fruit and vegetable, vitamin C, calcium and percentage of total fat/kcal via direct observation or 24‐hour recall assessment methods, but no impact on other macronutrients assessed on either measure (Story 2000). The objective of the Go for Health Program was to reduce the sodium and fat content of school meals (Simons‐Morton 1988). Post intervention data collected via 24 hour dietary recalls found, relative to control, students in intervention schools reported reductions in intake of total fat (MD ‐11.4, 95%CI ‐23.9 to 1.09, P = 0.07) saturated fat (MD ‐5.4, 95%CI ‐10.4 to ‐0.4, P = 0.03) and sodium (MD ‐505, 95%CI ‐962 to ‐48, P = 0.03) and total energy (MD ‐40.8, 95%CI ‐271 to 190, P = 0.73). In the Pathways study, the percentage of energy from fat was significantly lower among students in intervention schools relative to controls. Total energy intake was also significantly lower among students in intervention schools when assessed via 24‐hour dietary recall, but energy intake, assessed via direct observation was not (Cunningham‐Sabo 2003). In the TACOS trial, of an intervention to improve food availability, intervention schools showed a higher percentage of sales of lower‐fat foods in year one (27.5% versus 19.6%, P = 0.096) and higher mean percentage of sales of lower‐fat foods in year two (33.6% versus 22.1%, P = 0.042) from intervention school cafeterias compared with controls, but no differences were found in self‐reported student food choices (French 2004). In the SNAK trial, students in schools that were randomised to complete an online self‐assessment and action and planning template (HSAT) to implement a variety of nutrition practices (marketing of healthy foods, posters for healthy foods in the cafeteria and taste tests) reported consuming significantly more fruit and fibre, and less cholesterol than students in the control schools (data not shown). Intake of other assessed macronutrients by experimental condition, however, were not reported (Alaimo 2015). Finally, in their comparative study students in CATCH BCP, schools had a significantly lower score on an unhealthy food index (measure of unhealthy food intake) than those attending CATCH BP schools. There were however, no difference between groups on a healthy food index score, or fruit, vegetable, milk or sweetened beverage consumption (Hoelscher 2010).
Tobacco
Two trials reported on outcomes indicating changes in student tobacco smoking. In their cluster‐RCT, Saraf and colleagues found a reduced smoking prevalence over 30 days (‐7.7%, 95%CI ‐10.7 to ‐4.7, P < 0.001) in the intervention group. In the Bihar School Teachers study, wrappers from chewing tobacco, cigarette ashes, butts and discarded packages as well as spit marks and staining from chewing tobacco were counted throughout classrooms, corridors, toilets, dustbins and playgrounds within the schools (Mathur 2016). The authors reported a significant decrease on these tobacco use measures in the predominance of locations (Mathur 2016). No other trial reported the effects of an implementation strategy on tobacco smoking.
The impact of implementation strategies on the knowledge, skills or attitudes of school staff
Three trials assessed the impact of implementation strategies on the attitudes of school staff and found mixed effects. A survey of staff participating in the Texas Tobacco Prevention Initiative found that staff from intervention schools were more interested in professional development in tobacco prevention than those in control schools following intervention (87% versus 65%, P < 0.05) (Gingiss 2006). Conversely, interest in doing something about tobacco prevention was not significantly different between staff in intervention schools versus those in the control following adoption and teacher training in the study by McCormick and colleagues. In the three‐arm randomised trial of the Central Texas CATCH Middle School project (serving children 11 to 14 years), relative to schools receiving local consensus processes, clinical practice guidelines and educational meetings, teachers of schools receiving more intensive implementation support (local consensus processes, clinical practice guidelines and educational meetings with educational outreach visits and tailored intervention; or such support with the addition of social marketing strategies) reported significantly higher confidence in implementation of classroom physical activity breaks (Delk 2014). No other trial reported the effects of an implementation strategy on school staff knowledge, skills or attitudes regarding the implementation of policies or practices to reduce the targeted chronic disease risks.
Unintended consequences and adverse effects of strategies
Two trials included a measure that was specified in the study methods as an assessment of potential unintended adverse effects. One of these included aggregate measures of academic test performance, attendance and referral for disciplinary action measures and found no significant difference between groups on these measures (Mobley 2012). The other reported on changes in canteen profitability as a potential adverse outcome of canteen menu modulation and found no significant differences between intervention and control schools (Wolfenden 2017). Four trials did not specify outcomes as measures of adverse effects in their study methods, however, did interpret study findings to suggest that the implementation of policies and practices did not cause unintended harms (Cunningham‐Sabo 2003; French 2004; Naylor 2006; Perry 1997). For example, French and colleagues reported strategies to improve school food service did not adversely impact on school revenue, Perry reported that implementation of a program to lower the fat and saturated fat content of school meals had no impact on the nutritional quality of the school meals, and two trials reported no changes in height (Cunningham‐Sabo 2003; Perry 1997), weight (Cunningham‐Sabo 2003) or statural growth (Perry 1997).
Cost or cost‐effectiveness of strategies
In the HEALTHY study, cost data revealed no significant differences between groups in school revenue or expenses following the provision of implementation support (Mobley 2012). Only one trial conducted formal economic evaluation. Brown and colleagues examined the cost‐effectiveness of the CATCH program using estimates from the CATCH El Paso Trial from a societal perspective. The study reported CATCH to be cost‐effective, with a cost‐effectiveness ratio of US$900 and net benefit of US$68125. No other trial reported the cost or cost‐effectiveness of the implementation strategy however, the TACOS trial reported the revenue generated by sales by the cafeteria targeted by the intervention.
Discussion
Summary of main results
The primary objective of the review was to examine the effectiveness of strategies aiming to improve the implementation of school‐based policies, programs or practices that promote healthy, or reduce unhealthy behaviours relating to child diet, physical activity, obesity, tobacco or alcohol. The review identified 27 unique trials. There was considerable heterogeneity in the implementation strategies examined, policies and practices targeted for implementation, and implementation outcomes assessed. No trials of strategies to implement policies or practices to address alcohol use in schools were identified. Overall, the findings of the impact of strategies on policy and practice implementation were equivocal and the overall quality of evidence (GRADE) was considered very low. For the 13 trials reporting dichotomous implementation outcomes (the proportion of schools or school staff implementing a targeted policy or practice compared with a waiting list, usual practice or minimal support controls), the unadjusted median absolute intervention improvement in implementation across trials was 19% (range 8.5% to 66.6%). Among seven trials reporting the percentage of intervention practices or content that had been implemented, the unadjusted median effect across trials, relative to the control was 14.3% (range ‐8% to 43%). The impact of interventions on student health behaviour or weight status were mixed. Three of the eight trials with physical activity outcomes reported no significant improvements, both trials reporting tobacco use reported significant reductions in such measures in interventions schools while seven out of nine trials reported no between‐group differences on measures of student overweight, obesity or adiposity at follow‐up. Positive improvements were generally reported among measures of child diet intake among trials reporting these outcomes and only two trials reported on, but did not find, an adverse consequence. Three trials assessed the impact of implementation strategies on the attitudes of school staff and found mixed effects. Only one trial conducted a formal cost‐effectiveness assessment.
Consistent with a previous Cochrane review examining implementation strategies in childcare services (Wolfenden 2016), the review team encountered a number of similar methodological issues which complicated synthesis and interpretation of the findings of the review. Among the most significant was the considerable heterogeneity of implementation strategies examined. While a number of implementation strategies, most notably educational materials, educational outreach and educational meetings were commonly used, no two trials examined the same combinations of implementation strategies. Implementation strategies were often poorly described in included studies. Classification of strategies using the EPOC taxonomy was further complicated as the Taxonomy has been developed to describe strategies to improve implementation or professional practice of health services or practitioners, which were often not relevant for the school setting, while other strategies employed by trials did not meet and Taxonomy descriptors (EPOC 2015). Variability in implementation measures, study, and population characteristics was also evident and precluded pooled quantitative analysis, but also represented a challenge to narrative synthesis.
Overall completeness and applicability of evidence
The identified trials demonstrate an immature evidence base as many of the included studies were not primarily designed to address the research questions posed in this review. The research examining implementation strategies in the school setting is dominated by studies conducted in the USA (18 of 27 trials). The applicability of the review to other countries, particularly low‐ and middle‐income countries is therefore limited. Given the importance of contextual factors in implementation outcomes (Durlak 2008), more research in jurisdictions that have different schooling systems to the USA is warranted. Furthermore, while a range of implementation strategies were examined in studies included in the review, there was a lack of studies testing individual implementation strategies, or the same strategies in combination. Not until intervention trials accrue will the impact of individual strategies or multi‐strategic approaches be able to be reliably discerned.
Quality of the evidence
The overall quality of evidence was judged to be very low across all implementation outcomes. The review included a combination of randomised trials and non‐randomised designs. The collective quality of evidence was downgraded due to design, precision and heterogeneity considerations. All 27 trials were considered to be at high risk of performance bias, and all non‐randomised designs were judged to be at high risk of bias due to selection bias from both random sequence generation and allocation concealment. Most trials were small, recruiting relatively small numbers of schools or school staff, limiting the precision of estimated effects. Furthermore, heterogeneity of trial designs, implementation strategies, populations and measures made comparison complex.
Potential biases in the review process
A number of strategies were employed in the conduct of the review to reduce the risk of bias. A comprehensive search was undertaken, including screening of over 18,000 citations, and included searches of trial registers, and handsearching of journals. We also utilised published search filters to maximise the likely capture of relevant studies. Nonetheless, as a developing field, terminology in implementation science is still evolving which may have increased the likelihood that relevant studies may have not been captured in the search strategy (Mazza 2013). The search did capture all relevant trials included in an earlier systematic review of implementation strategies conducted by the Agency for Healthcare Research and Quality (Rabin 2010), and only one additional trial was identified following contacts with study authors and experts in the field suggesting that omissions of large numbers of relevant trials are unlikely. Nonetheless, as terminology in the field develops, search terms may need to be expanded in future review updates. The review also could not pool effects of interventions, and instead utilised a simple description of the unadjusted median and range of effects reported within and across studies. While useful, unadjusted medians treat all trials the same, regardless, of factors such as trial size, as so should be viewed as descriptive. Formal meta‐analytic techniques which apply appropriate trial weights are required to provide robust quantitative estimates of between group effects.
Agreements and disagreements with other studies or reviews
The findings for this review concur with the limited number of previous systematic reviews of controlled trials conducted to assess the effectiveness of implementation strategies in schools and other community settings. The findings are consistent with an Agency for HealthCare Research and Quality systematic review, which included uncontrolled pre‐post trials examining the impact of dissemination or implementation strategies targeting policies or programs to address cancer risk behaviours (including diet and physical activity) across community settings including 11 school studies (Rabin 2010). The review reported considerable heterogeneity of included studies, and poor implementation measurement and methodological quality, and effects that were equivocal. Methodological issues, in particular those pertaining to definitions of implementation constructs and measurement have also been reported in a review of school‐based studies which have examined associations between implementation and individual outcomes in physical activity trials (Naylor 2015). The findings are also consistent with a previous Cochrane review of implementation strategies in childcare services that identified 10 trials of implementation strategies targeting implementation of healthy eating, physical activity or diet providing overall very low quality evidence regarding effectiveness (Wolfenden 2016). Among the four trials reporting a measure of the proportion of childcare service or staff implementing a policy or practice, effect sizes ranged from 0% to 9.5%, lower than the unadjusted median effect for trials identified in this review (19%). The unadjusted median effect size is also within the range of other interventions used to change professional practice of clinicians. For example, in clinical settings the median improvement in professional practice following educational outreach visits is 23% (interquartile range (IQR) 12% to 39%) relative to control, while educational meetings and workshops have achieved median improvements of 10% (IQR 8% to 32%) (Lau 2015). Finally, similar to consolidated reviews in clinical settings, the review also found little evidence of assessment or reporting of cost, cost‐effectiveness or adverse effects included in implementation studies (Lau 2015).
Authors' conclusions
Implications for practice.
The review provides little clear guidance for policy makers or practitioners responsible for implementing initiatives in school settings to reduce the risk of chronic diseases. The findings suggest that achieving improvements in the implementation of policies and practices is possible, although the overall quality of evidence is poor and the characteristics of effective implementation strategies and the contexts in which they may operate remain unknown. Furthermore, the effects of implementation strategies were, in most cases moderate (10% to 20% absolute improvement) based on definitions described by Grimshaw and colleagues (Grimshaw 2004). In many instances such improvements were not sufficient to achieve reductions in student health risks particularly with regard to weight status.
In the absence of clear guidance, maximising the likelihood of the effects of implementation, efforts may be achieved through thorough formative evaluation and consultation with schools and school systems to identify barriers or enablers to policy or program implementation, and the co‐development of appropriate, and contextually‐relevant implementation support strategies. A number of implementation frameworks are currently available to assist in the identification of the factors that may impede implementation and the selection of strategies to overcome them. Among the most commonly used are the Theoretical Domains Framework, and the Consolidated Framework for Implementation in Research (CFIR) (Cane 2012; Damschroder 2009; French 2012). Given the modest improvements in policy and practice implementation identified by strategies in this review, practitioners should also pay careful attention to the health promotion policy or practice that is the subject of implementation. The CFIR framework suggests that interventions that are too complex, time consuming, or expensive, or that require the skills or expertise that are uncommon in schools may be less likely to be implemented and sustained (Damschroder 2009). The selection of interventions that focus are simple, do not require significant resourcing and can be integrated into existing school procedures should, therefore, be preferenced. Additionally, Milat's guide to implementing health promotion programs at scale suggests that other factors including organisational infrastructure and resources, planning, and stakeholder engagement are important determinants of successfully implementing population health interventions at scale (Milat 2016). Such frameworks may provide good guidance until empirical evidence testing such recommendations is available.
Finally, the review identified a need for the development and use of robust measures for the assessment of implementation outcomes. A number of the included trials included self‐report measures of school staff such as questionnaires, teacher completed log books and telephone interviews, of which just two were reported to have been validated. The reliability and validity of self‐reported measures of policy or practice implementation are questionable, particularly for use in trials given the potential for socially desirable responding (Greene 2008). While direct observation methods represent a more objective measures, such assessments can be subject to research reactivity, and are cost prohibitive. Relative to direct observation, the use of video or audio recordings in situ may reduce bias, but provide objective measures of implementation at lower cost. Further, the use of routinely collected data from licensing agencies or authorities could be considered for large scale trials. In instances where the use of a single robust measure is not feasible, measurement triangulation may provide a more comprehensive assessment of the effects of an implementation strategy.
Implications for research.
Schools are one of the most valuable settings for population‐level interventions to improve child health. Despite this, there remains a surprising lack of controlled trials examining the impact of the strategies to implement initiatives to address chronic disease risks in this setting. Previous bibliographic studies have suggested that trials of implementation strategies represent just 3% of public health research publications (Wolfenden 2016b), and the findings of this review underscore the need for more trials in the field. For example, Cochrane reviews have identified 134 randomised trials of school‐based smoking prevention interventions (Thomas 2013), and 53 randomised trials of school‐based programs to prevent alcohol misuse (Foxcroft 2011). However, we did not identify any trials of strategies to implement alcohol prevention policies and practices in schools, and just four trials (Gingiss 2006; Mathur 2016; McCormick 1995; Saraf 2015), three of which were randomised trials, assessed strategies to implement school‐based tobacco policies or practices. The findings demonstrate an immature evidence base, and a need to re‐orient research investment to fund not only trials of interventions to improve health behaviours, but trials of strategies to get such interventions implemented in routine school practice.
The lack of evidence regarding the effects of strategies to improve implementation in schools is surprising, given that most interventions in this setting would involve some form of implementation strategy. A number of included studies targeted multiple health behaviours however, did not assess the impact of implementation strategies on policies and practices for each health behaviour. For example, Simmons‐Morton incorporated interventions components to improve the school nutrition and physical activity environment. However, strategies and outcomes, for the implementation of nutrition policies and practices only were reported (Simons‐Morton 1988). For such trials, the impact of efforts to implement policies and practices targeting other health behaviours and their effects on student outcomes (e.g. physical activity) represent a missed opportunity to learn from implementation experiences. Anecdotally, a number of trials were excluded as they described an implementation strategy, but only included assessments of implementation in process evaluations within the intervention group. The greater application of hybrid research designs has been suggested as one means of improving the availability of research evidence to guide implementation efforts (Wolfenden 2016c). Hybrid designs simultaneously plan and collect data on the impact of interventions on individual health behaviours or clinical outcomes as well as the impact (or potential impact) of strategies to enhance their implementation. The routine collection of such information in future trials seeking to test the effects of school‐based interventions delivered by usual teaching staff could efficiently build the evidence base (Wolfenden 2016c). Furthermore, application of the recently released Standards for Reporting Implementation Studies (StaRI) Statement may improve the availability and usability of implementation information in future trials (Pinnock 2017). Another potential explanation for the lack of trials was that policy implementation often occurs at large scale, occurs at the discretion of policy makers and practitioners and may not easily be examined using controlled trial designs. As such many evaluations of policy implementation occur post policy implementation only, or do not use comparison groups (Watts 2014).
While not unique to the field of implementation (Lau 2015), of particular concern was the lack of consideration to the costs of implementing health promoting policies or practices, or their unintended adverse effects. Information regarding costs and adverse effects are particularly salient for health decision makers who must weigh the benefits of intervention with their harms and costs to community (Wolfenden 2010; Wolfenden 2015). Approaches to implementation are not immune to unintended consequences. Surveys of teaching staff suggest a range of adverse outcomes are possible. For example, policies restricting unhealthy foods for sale from school kiosks or canteens have been suggested to compromise food sale profits which are often re‐invested in the school for other student initiatives (Pettigrew 2012). Furthermore, the introduction of new policies or practices in schools may displace the implementation of other policies or practices of proven benefit for students. Future research should incorporate logic models to identify potential harms associated with implementing health promotion programs in schools, and include measures to prospectively measure both harms and implementation costs.
What's new
| Date | Event | Description |
|---|---|---|
| 8 December 2017 | Amended | Republished after removal of parentheses in Plain Language Summary title. |
Acknowledgements
We acknowledge the contributions of Li Kheng in supporting the administration of the review.
Appendices
Appendix 1. Search Strategy
MEDLINE search strategy
| # | Searches |
| 1 | schools/ |
| 2 | ((primary or elementary or middle or junior or high or secondary) adj (school* or student*)).mp. |
| 3 | kinder*.mp. |
| 4 | 1 or 2 or 3 |
| 5 | implement*.tw. |
| 6 | dissemination.tw. |
| 7 | adopt*.tw. |
| 8 | practice.tw. |
| 9 | organi?ational change*.tw. |
| 10 | diffusion.tw. |
| 11 | system* change*.tw. |
| 12 | quality improvement*.tw. |
| 13 | transformation.tw. |
| 14 | translation.tw. |
| 15 | transfer.tw. |
| 16 | uptake.tw. |
| 17 | sustainab*.tw. |
| 18 | institutionali*.tw. |
| 19 | routin*.tw. |
| 20 | maintenance.tw. |
| 21 | capacity.tw. |
| 22 | incorporation.tw. |
| 23 | adherence.tw. |
| 24 | program*.tw. |
| 25 | integration.tw. |
| 26 | scal* up.tw. |
| 27 | 5 or 6 or 7 or 8 or 9 or 10 or 11 or 12 or 13 or 14 or 15 or 16 or 17 or 18 or 19 or 20 or 21 or 22 or 23 or 24 or 25 or 26 |
| 28 | exp Obesity/ |
| 29 | Weight Gain/ |
| 30 | exp Weight Loss/ |
| 31 | obes*.tw. |
| 32 | (weight gain or weight loss).tw. |
| 33 | (overweight or over weight or overeat* or over eat*).tw. |
| 34 | weight change*.tw. |
| 35 | ((bmi or body mass index) adj2 (gain or loss or change)).tw. |
| 36 | exp Primary Prevention/ |
| 37 | (primary prevention or secondary prevention).tw. |
| 38 | (preventive measure* or preventative measure*).tw. |
| 39 | (preventive care or preventative care).tw. |
| 40 | (obes* adj2 (prevent* or treat*)).tw. |
| 41 | 28 or 29 or 30 or 31 or 32 or 33 or 34 or 35 or 36 or 37 or 38 or 39 or 40 |
| 42 | exp Exercise/ |
| 43 | physical activity.tw. |
| 44 | physical inactivity.tw. |
| 45 | exp Motor Activity/ |
| 46 | (physical education and training).tw. |
| 47 | exp "Physical Education and Training"/ |
| 48 | Physical Fitness/ |
| 49 | sedentary.tw. |
| 50 | exp Life Style/ |
| 51 | exp Leisure Activities/ |
| 52 | exp Sports/ |
| 53 | Dancing/ |
| 54 | dancing.tw. |
| 55 | (exercise* adj aerobic*).tw. |
| 56 | sport*.tw. |
| 57 | ((lifestyle* or life style*) adj5 activ*).tw. |
| 58 | 42 or 43 or 44 or 45 or 46 or 47 or 48 or 49 or 50 or 51 or 52 or 53 or 54 or 55 or 56 or 57 |
| 59 | exp Diet/ |
| 60 | nutrition*.tw. |
| 61 | healthy eating.tw. |
| 62 | Child Nutrition Sciences/ |
| 63 | fruit*.tw. |
| 64 | vegetable*.tw. |
| 65 | canteen*.tw. |
| 66 | food service*.tw. |
| 67 | menu*.tw. |
| 68 | calorie*.tw. |
| 69 | Energy Intake/ |
| 70 | energy density.tw. |
| 71 | Eating/ |
| 72 | Feeding Behavior/ or feeding behaviour.mp. |
| 73 | dietary intake.tw. |
| 74 | Food Habits/ |
| 75 | Food/ |
| 76 | Carbonated Beverages/ or soft drink*.mp. |
| 77 | soda.tw. |
| 78 | sweetened drink*.tw. |
| 79 | Dietary Fats, Unsaturated/ or Dietary Fats/ |
| 80 | confectionar*.tw. |
| 81 | (school adj (lunch* or meal*)).tw. |
| 82 | menu plan*.tw. |
| 83 | ((feeding or food or nutrition*) adj program*).tw. |
| 84 | cafeteria*.tw. |
| 85 | Nutritional Status/ |
| 86 | 59 or 60 or 61 or 62 or 63 or 64 or 65 or 66 or 67 or 68 or 69 or 70 or 71 or 72 or 73 or 74 or 75 or 76 or 77 or 78 or 79 or 80 or 81 or 82 or 83 or 84 or 85 |
| 87 | exp Smoking/ |
| 88 | exp "Tobacco Use Cessation"/ |
| 89 | smok*.tw. |
| 90 | Nicotine/ |
| 91 | Tobacco/ or "Tobacco Use"/ |
| 92 | ((ceas* or cess* or prevent* or stop* or quit* or abstin* or abstain* or reduc*) adj5 (smok* or tobacco or nicotine)).tw. |
| 93 | "Tobacco Use Disorder"/ |
| 94 | ex‐smoker*.tw. |
| 95 | anti‐smok*.tw. |
| 96 | 87 or 88 or 89 or 90 or 91 or 92 or 93 or 94 or 95 |
| 97 | alcohol drinking/ or binge drinking/ |
| 98 | alcohol*.tw. |
| 99 | Alcoholic Intoxication/ or Alcoholism/ |
| 100 | drink*.tw. |
| 101 | liquor*.tw. |
| 102 | beer*.tw. |
| 103 | wine*.tw. |
| 104 | spirit*.tw. |
| 105 | drunk*.tw. |
| 106 | intoxicat*.tw. |
| 107 | binge.tw. |
| 108 | 97 or 98 or 99 or 100 or 101 or 102 or 103 or 104 or 105 or 106 or 107 |
| 109 | 41 or 58 or 86 or 96 or 108 |
| 110 | Randomized Controlled Trial/ |
| 111 | clinical trial/ or controlled clinical trial/ |
| 112 | random allocation/ |
| 113 | Double‐Blind Method/ |
| 114 | Single‐Blind Method/ |
| 115 | placebos/ |
| 116 | Research Design/ |
| 117 | Intervention Studies/ |
| 118 | Evaluation Studies/ |
| 119 | Comparative Study/ |
| 120 | exp Longitudinal Studies/ |
| 121 | Cross‐Over Studies/ |
| 122 | clinical trial.tw. |
| 123 | latin square.tw. |
| 124 | (time adj series).tw. |
| 125 | (before adj2 after adj3 (stud* or trial* or design*)).tw. |
| 126 | ((singl* or doubl* or trebl* or tripl*) adj5 (blind* or mark)).tw. |
| 127 | placebo*.tw. |
| 128 | random*.tw. |
| 129 | (matched adj (communit* or school* or population*)).tw. |
| 130 | control*.tw. |
| 131 | (comparison group* or control group*).tw. |
| 132 | matched pairs.tw. |
| 133 | outcome stud*.tw. |
| 134 | (quasiexperimental or quasi experimental or pseudo experimental).tw. |
| 135 | (nonrandomi?ed or non randomi?ed or psuedo randomi?ed or quasi randomi?ed).tw. |
| 136 | prospectiv*.tw. |
| 137 | volunteer*.tw. |
| 138 | 110 or 111 or 112 or 113 or 114 or 115 or 116 or 117 or 118 or 119 or 120 or 121 or 122 or 123 or 124 or 125 or 126 or 127 or 128 or 129 or 130 or 131 or 132 or 133 or 134 or 135 or 136 or 137 |
| 139 | 4 and 27 and 109 and 138 |
| 140 | limit 139 to ("child (6 to 12 years)" or "adolescent (13 to 18 years)") |
Embase Classic and Embase search strategy
| # | Searches |
| 1 | schools/ |
| 2 | ((primary or elementary or middle or junior or high or secondary) adj (school* or student*)).mp. |
| 3 | kinder*.mp. |
| 4 | 1 or 2 or 3 |
| 5 | implement*.tw. |
| 6 | dissemination.tw. |
| 7 | adopt*.tw. |
| 8 | practice.tw. |
| 9 | organi?ational change*.tw. |
| 10 | diffusion.tw. |
| 11 | system* change*.tw. |
| 12 | quality improvement*.tw. |
| 13 | transformation.tw. |
| 14 | translation.tw. |
| 15 | transfer.tw. |
| 16 | uptake.tw. |
| 17 | sustainab*.tw. |
| 18 | institutionali*.tw. |
| 19 | routin*.tw. |
| 20 | maintenance.tw. |
| 21 | capacity.tw. |
| 22 | incorporation.tw. |
| 23 | adherence.tw. |
| 24 | program*.tw. |
| 25 | integration.tw. |
| 26 | scal* up.tw. |
| 27 | 5 or 6 or 7 or 8 or 9 or 10 or 11 or 12 or 13 or 14 or 15 or 16 or 17 or 18 or 19 or 20 or 21 or 22 or 23 or 24 or 25 or 26 |
| | exp Obesity/ |
| 29 | Weight Gain/ |
| 30 | exp Weight Loss/ |
| 31 | obes*.tw. |
| 32 | (weight gain or weight loss).tw. |
| 33 | (overweight or over weight or overeat* or over eat*).tw. |
| 34 | weight change*.tw. |
| 35 | ((bmi or body mass index) adj2 (gain or loss or change)).tw. |
| 36 | exp Primary Prevention/ |
| 37 | (primary prevention or secondary prevention).tw. |
| 38 | (preventive measure* or preventative measure*).tw. |
| 39 | (preventive care or preventative care).tw. |
| 40 | (obes* adj2 (prevent* or treat*)).tw. |
| 41 | 28 or 29 or 30 or 31 or 32 or 33 or 34 or 35 or 36 or 37 or 38 or 39 or 40 |
| 42 | exp Exercise/ |
| 43 | physical activity.tw. |
| 44 | physical inactivity.tw. |
| 45 | exp Motor Activity/ |
| 46 | (physical education and training).tw. |
| 47 | exp "Physical Education and Training"/ |
| 48 | Physical Fitness/ |
| 49 | sedentary.tw. |
| 50 | exp Life Style/ |
| 51 | exp Leisure Activities/ |
| 52 | exp Sports/ |
| 53 | Dancing/ |
| 54 | dancing.tw. |
| 55 | (exercise* adj aerobic*).tw. |
| 56 | sport*.tw. |
| 57 | ((lifestyle* or life style*) adj5 activ*).tw. |
| 58 | 42 or 43 or 44 or 45 or 46 or 47 or 48 or 49 or 50 or 51 or 52 or 53 or 54 or 55 or 56 or 57 |
| 59 | exp Diet/ |
| 60 | nutrition*.tw. |
| 61 | healthy eating.tw. |
| 62 | Child Nutrition Sciences/ |
| 63 | fruit*.tw. |
| 64 | vegetable*.tw. |
| 65 | canteen*.tw. |
| 66 | food service*.tw. |
| 67 | menu*.tw. |
| 68 | calorie*.tw. |
| 69 | Energy Intake/ |
| 70 | energy density.tw. |
| 71 | Eating/ |
| 72 | Feeding Behavior/ or feeding behaviour.mp. |
| 73 | dietary intake.tw. |
| 74 | Food Habits/ |
| 75 | Food/ |
| 76 | Carbonated Beverages/ or soft drink*.mp. |
| 77 | soda.tw. |
| 78 | sweetened drink*.tw. |
| 79 | Dietary Fats, Unsaturated/ or Dietary Fats/ |
| 80 | confectionar*.tw. |
| 81 | (school adj (lunch* or meal*)).tw. |
| 82 | menu plan*.tw. |
| 83 | ((feeding or food or nutrition*) adj program*).tw. |
| 84 | cafeteria*.tw. |
| 85 | Nutritional Status/ |
| 86 | 59 or 60 or 61 or 62 or 63 or 64 or 65 or 66 or 67 or 68 or 69 or 70 or 71 or 72 or 73 or 74 or 75 or 76 or 77 or 78 or 79 or 80 or 81 or 82 or 83 or 84 or 85 |
| 87 | exp Smoking/ |
| 88 | exp "Tobacco Use Cessation"/ |
| 89 | smok*.tw. |
| 90 | Nicotine/ |
| 91 | Tobacco/ or "Tobacco Use"/ |
| 92 | ((ceas* or cess* or prevent* or stop* or quit* or abstin* or abstain* or reduc*) adj5 (smok* or tobacco or nicotine)).tw. |
| 93 | "Tobacco Use Disorder"/ |
| 94 | ex‐smoker*.tw. |
| 95 | anti‐smok*.tw. |
| 96 | 87 or 88 or 89 or 90 or 91 or 92 or 93 or 94 or 95 |
| 97 | alcohol drinking/ or binge drinking/ |
| 98 | alcohol*.tw. |
| 99 | Alcoholic Intoxication/ or Alcoholism/ |
| 100 | drink*.tw. |
| 101 | liquor*.tw. |
| 102 | beer*.tw. |
| 103 | wine*.tw. |
| 104 | spirit*.tw. |
| 105 | drunk*.tw. |
| 106 | intoxicat*.tw. |
| 107 | binge.tw. |
| 108 | 97 or 98 or 99 or 100 or 101 or 102 or 103 or 104 or 105 or 106 or 107 |
| 109 | 41 or 58 or 86 or 96 or 108 |
| 110 | Randomized Controlled Trial/ |
| 111 | clinical trial/ or controlled clinical trial/ |
| 112 | random allocation/ |
| 113 | Double‐Blind Method/ |
| 114 | Single‐Blind Method/ |
| 115 | placebos/ |
| 116 | Research Design/ |
| 117 | Intervention Studies/ |
| 118 | Evaluation Studies/ |
| 119 | Comparative Study/ |
| 120 | exp Longitudinal Studies/ |
| 121 | Cross‐Over Studies/ |
| 122 | clinical trial.tw. |
| 123 | latin square.tw. |
| 124 | (time adj series).tw. |
| 125 | (before adj2 after adj3 (stud* or trial* or design*)).tw. |
| 126 | ((singl* or doubl* or trebl* or tripl*) adj5 (blind* or mark)).tw. |
| 127 | placebo*.tw. |
| 128 | random*.tw. |
| 129 | (matched adj (communit* or school* or population*)).tw. |
| 130 | control*.tw. |
| 131 | (comparison group* or control group*).tw. |
| 132 | matched pairs.tw. |
| 133 | outcome stud*.tw. |
| 134 | (quasiexperimental or quasi experimental or pseudo experimental).tw. |
| 135 | (nonrandomi?ed or non randomi?ed or psuedo randomi?ed or quasi randomi?ed).tw. |
| 136 | prospectiv*.tw. |
| 137 | volunteer*.tw. |
| 138 | 110 or 111 or 112 or 113 or 114 or 115 or 116 or 117 or 118 or 119 or 120 or 121 or 122 or 123 or 124 or 125 or 126 or 127 or 128 or 129 or 130 or 131 or 132 or 133 or 134 or 135 or 136 or 137 |
| 139 | 4 and 27 and 109 and 138 |
| 140 | limit 139 to (school child <7 to 12 years> or adolescent <13 to 17 years>) |
MEDLINE In‐Process & Other Non‐Indexed Citations Search Strategy
| # | Searches |
| 1 | schools/ |
| 2 | ((primary or elementary or middle or junior or high or secondary) adj (school* or student*)).mp. |
| 3 | kinder*.mp. |
| 4 | 1 or 2 or 3 |
| 5 | implement*.tw. |
| 6 | dissemination.tw. |
| 7 | adopt*.tw. |
| 8 | practice.tw. |
| 9 | organi?ational change*.tw. |
| 10 | diffusion.tw. |
| 11 | system* change*.tw. |
| 12 | quality improvement*.tw. |
| 13 | transformation.tw. |
| 14 | translation.tw. |
| 15 | transfer.tw. |
| 16 | uptake.tw. |
| 17 | sustainab*.tw. |
| 18 | institutionali*.tw. |
| 19 | routin*.tw. |
| 20 | maintenance.tw. |
| 21 | capacity.tw. |
| 22 | incorporation.tw. |
| 23 | adherence.tw. |
| 24 | program*.tw. |
| 25 | integration.tw. |
| 26 | scal* up.tw. |
| 27 | 5 or 6 or 7 or 8 or 9 or 10 or 11 or 12 or 13 or 14 or 15 or 16 or 17 or 18 or 19 or 20 or 21 or 22 or 23 or 24 or 25 or 26 |
| 28 | exp Obesity/ |
| 29 | Weight Gain/ |
| 30 | exp Weight Loss/ |
| 31 | obes*.tw. |
| 32 | (weight gain or weight loss).tw. |
| 33 | (overweight or over weight or overeat* or over eat*).tw. |
| 34 | weight change*.tw. |
| 35 | ((bmi or body mass index) adj2 (gain or loss or change)).tw. |
| 36 | exp Primary Prevention/ |
| 37 | (primary prevention or secondary prevention).tw. |
| 38 | (preventive measure* or preventative measure*).tw. |
| 39 | (preventive care or preventative care).tw. |
| 40 | (obes* adj2 (prevent* or treat*)).tw. |
| 41 | 28 or 29 or 30 or 31 or 32 or 33 or 34 or 35 or 36 or 37 or 38 or 39 or 40 |
| 42 | exp Exercise/ |
| 43 | physical activity.tw. |
| 44 | physical inactivity.tw. |
| 45 | exp Motor Activity/ |
| 46 | (physical education and training).tw. |
| 47 | exp "Physical Education and Training"/ |
| 48 | Physical Fitness/ |
| 49 | sedentary.tw. |
| 50 | exp Life Style/ |
| 51 | exp Leisure Activities/ |
| 52 | exp Sports/ |
| 53 | Dancing/ |
| 54 | dancing.tw. |
| 55 | (exercise* adj aerobic*).tw. |
| 56 | sport*.tw. |
| 57 | ((lifestyle* or life style*) adj5 activ*).tw. |
| 58 | 42 or 43 or 44 or 45 or 46 or 47 or 48 or 49 or 50 or 51 or 52 or 53 or 54 or 55 or 56 or 57 |
| 59 | exp Diet/ |
| 60 | nutrition*.tw. |
| 61 | healthy eating.tw. |
| 62 | Child Nutrition Sciences/ |
| 63 | fruit*.tw. |
| 64 | vegetable*.tw. |
| 65 | canteen*.tw. |
| 66 | food service*.tw. |
| 67 | menu*.tw. |
| 68 | calorie*.tw. |
| 69 | Energy Intake/ |
| 70 | energy density.tw. |
| 71 | Eating/ |
| 72 | Feeding Behavior/ or feeding behaviour.mp. |
| 73 | dietary intake.tw. |
| 74 | Food Habits/ |
| 75 | Food/ |
| 76 | Carbonated Beverages/ or soft drink*.mp. |
| 77 | soda.tw. |
| 78 | sweetened drink*.tw. |
| 79 | Dietary Fats, Unsaturated/ or Dietary Fats/ |
| 80 | confectionar*.tw. |
| 81 | (school adj (lunch* or meal*)).tw. |
| 82 | menu plan*.tw. |
| 83 | ((feeding or food or nutrition*) adj program*).tw. |
| 84 | cafeteria*.tw. |
| 85 | Nutritional Status/ |
| 86 | 59 or 60 or 61 or 62 or 63 or 64 or 65 or 66 or 67 or 68 or 69 or 70 or 71 or 72 or 73 or 74 or 75 or 76 or 77 or 78 or 79 or 80 or 81 or 82 or 83 or 84 or 85 |
| 87 | exp Smoking/ |
| 88 | exp "Tobacco Use Cessation"/ |
| 89 | smok*.tw. |
| 90 | Nicotine/ |
| 91 | Tobacco/ or "Tobacco Use"/ |
| 92 | ((ceas* or cess* or prevent* or stop* or quit* or abstin* or abstain* or reduc*) adj5 (smok* or tobacco or nicotine)).tw. |
| 93 | "Tobacco Use Disorder"/ |
| 94 | ex‐smoker*.tw. |
| 95 | anti‐smok*.tw. |
| 96 | 87 or 88 or 89 or 90 or 91 or 92 or 93 or 94 or 95 |
| 97 | alcohol drinking/ or binge drinking/ |
| 98 | alcohol*.tw. |
| 99 | Alcoholic Intoxication/ or Alcoholism/ |
| 100 | drink*.tw. |
| 101 | liquor*.tw. |
| 102 | beer*.tw. |
| 103 | wine*.tw. |
| 104 | spirit*.tw. |
| 105 | drunk*.tw. |
| 106 | intoxicat*.tw. |
| 107 | binge.tw. |
| 108 | 97 or 98 or 99 or 100 or 101 or 102 or 103 or 104 or 105 or 106 or 107 |
| 109 | 41 or 58 or 86 or 96 or 108 |
| 110 | Randomized Controlled Trial/ |
| 111 | clinical trial/ or controlled clinical trial/ |
| 112 | random allocation/ |
| 113 | Double‐Blind Method/ |
| 114 | Single‐Blind Method/ |
| 115 | placebos/ |
| 116 | Research Design/ |
| 117 | Intervention Studies/ |
| 118 | Evaluation Studies/ |
| 119 | Comparative Study/ |
| 120 | exp Longitudinal Studies/ |
| 121 | Cross‐Over Studies/ |
| 122 | clinical trial.tw. |
| 123 | latin square.tw. |
| 124 | (time adj series).tw. |
| 125 | (before adj2 after adj3 (stud* or trial* or design*)).tw. |
| 126 | ((singl* or doubl* or trebl* or tripl*) adj5 (blind* or mark)).tw. |
| 127 | placebo*.tw. |
| 128 | random*.tw. |
| 129 | (matched adj (communit* or school* or population*)).tw. |
| 130 | control*.tw. |
| 131 | (comparison group* or control group*).tw. |
| 132 | matched pairs.tw. |
| 133 | outcome stud*.tw. |
| 134 | (quasiexperimental or quasi experimental or pseudo experimental).tw. |
| 135 | (nonrandomi?ed or non randomi?ed or psuedo randomi?ed or quasi randomi?ed).tw. |
| 136 | prospectiv*.tw. |
| 137 | volunteer*.tw. |
| 138 | 110 or 111 or 112 or 113 or 114 or 115 or 116 or 117 or 118 or 119 or 120 or 121 or 122 or 123 or 124 or 125 or 126 or 127 or 128 or 129 or 130 or 131 or 132 or 133 or 134 or 135 or 136 or 137 |
| 139 | 4 and 27 and 109 and 138 |
| 140 | (exercis* or diet* or physical fitness or energy intake or food* or fat* or tobacco).tw. |
| 141 | 109 or 140 |
| 142 | (randomi?ed controlled trial* or single blind method or placebo* or research design or intervention stud* or cross over stud*).tw. |
| 143 | 138 or 142 |
| 144 | 4 and 27 and 141 and 143 |
Age limits are not applied to Medline In Process records
PsycINFO search strategy
| # | Searches |
| 1 | schools/ |
| 2 | ((primary or elementary or middle or junior or high or secondary) adj (school* or student*)).mp. |
| 3 | kinder*.mp. |
| 4 | 1 or 2 or 3 |
| 5 | implement*.tw. |
| 6 | dissemination.tw. |
| 7 | adopt*.tw. |
| 8 | practice.tw. |
| 9 | organi?ational change*.tw. |
| 10 | diffusion.tw. |
| 11 | system* change*.tw. |
| 12 | quality improvement*.tw. |
| 13 | transformation.tw. |
| 14 | translation.tw. |
| 15 | transfer.tw. |
| 16 | uptake.tw. |
| 17 | sustainab*.tw. |
| 18 | institutionali*.tw. |
| 19 | routin*.tw. |
| 20 | maintenance.tw. |
| 21 | capacity.tw. |
| 22 | incorporation.tw. |
| 23 | adherence.tw. |
| 24 | program*.tw. |
| 25 | integration.tw. |
| 26 | scal* up.tw. |
| 27 | 5 or 6 or 7 or 8 or 9 or 10 or 11 or 12 or 13 or 14 or 15 or 16 or 17 or 18 or 19 or 20 or 21 or 22 or 23 or 24 or 25 or 26 |
| 28 | exp Obesity/ |
| 29 | Weight Gain/ |
| 30 | exp Weight Loss/ |
| 31 | obes*.tw. |
| 32 | (weight gain or weight loss).tw. |
| 33 | (overweight or over weight or overeat* or over eat*).tw. |
| 34 | weight change*.tw. |
| 35 | ((bmi or body mass index) adj2 (gain or loss or change)).tw. |
| 36 | exp Primary Prevention/ |
| 37 | (primary prevention or secondary prevention).tw. |
| 38 | (preventive measure* or preventative measure*).tw. |
| 39 | (preventive care or preventative care).tw. |
| 40 | (obes* adj2 (prevent* or treat*)).tw. |
| 41 | 28 or 29 or 30 or 31 or 32 or 33 or 34 or 35 or 36 or 37 or 38 or 39 or 40 |
| 42 | exp Exercise/ |
| 43 | physical activity.tw. |
| 44 | physical inactivity.tw. |
| 45 | exp Motor Activity/ |
| 46 | (physical education and training).tw. |
| 47 | exp "Physical Education and Training"/ |
| 48 | Physical Fitness/ |
| 49 | sedentary.tw. |
| 50 | exp Life Style/ |
| 51 | exp Leisure Activities/ |
| 52 | exp Sports/ |
| 53 | Dancing/ |
| 54 | dancing.tw. |
| 55 | (exercise* adj aerobic*).tw. |
| 56 | sport*.tw. |
| 57 | ((lifestyle* or life style*) adj5 activ*).tw. |
| 58 | 42 or 43 or 44 or 45 or 46 or 47 or 48 or 49 or 50 or 51 or 52 or 53 or 54 or 55 or 56 or 57 |
| 59 | exp Diet/ |
| 60 | nutrition*.tw. |
| 61 | healthy eating.tw. |
| 62 | Child Nutrition Sciences/ |
| 63 | fruit*.tw. |
| 64 | vegetable*.tw. |
| 65 | canteen*.tw. |
| 66 | food service*.tw. |
| 67 | menu*.tw. |
| 68 | calorie*.tw. |
| 69 | Energy Intake/ |
| 70 | energy density.tw. |
| 71 | Eating/ |
| 72 | Feeding Behavior/ or feeding behaviour.mp. |
| 73 | dietary intake.tw. |
| 74 | Food Habits/ |
| 75 | Food/ |
| 76 | Carbonated Beverages/ or soft drink*.mp. |
| 77 | soda.tw. |
| 78 | sweetened drink*.tw. |
| 79 | Dietary Fats, Unsaturated/ or Dietary Fats/ |
| 80 | confectionar*.tw. |
| 81 | (school adj (lunch* or meal*)).tw. |
| 82 | menu plan*.tw. |
| 83 | ((feeding or food or nutrition*) adj program*).tw. |
| 84 | cafeteria*.tw. |
| 85 | Nutritional Status/ |
| 86 | 59 or 60 or 61 or 62 or 63 or 64 or 65 or 66 or 67 or 68 or 69 or 70 or 71 or 72 or 73 or 74 or 75 or 76 or 77 or 78 or 79 or 80 or 81 or 82 or 83 or 84 or 85 |
| 87 | exp Smoking/ |
| 88 | exp "Tobacco Use Cessation"/ |
| 89 | smok*.tw. |
| 90 | Nicotine/ |
| 91 | Tobacco/ or "Tobacco Use"/ |
| 92 | ((ceas* or cess* or prevent* or stop* or quit* or abstin* or abstain* or reduc*) adj5 (smok* or tobacco or nicotine)).tw. |
| 93 | "Tobacco Use Disorder"/ |
| 94 | ex‐smoker*.tw. |
| 95 | anti‐smok*.tw. |
| 96 | 87 or 88 or 89 or 90 or 91 or 92 or 93 or 94 or 95 |
| 97 | alcohol drinking/ or binge drinking/ |
| 98 | alcohol*.tw. |
| 99 | Alcoholic Intoxication/ or Alcoholism/ |
| 100 | drink*.tw. |
| 101 | liquor*.tw. |
| 102 | beer*.tw. |
| 103 | wine*.tw. |
| 104 | spirit*.tw. |
| 105 | drunk*.tw. |
| 106 | intoxicat*.tw. |
| 107 | binge.tw. |
| 108 | 97 or 98 or 99 or 100 or 101 or 102 or 103 or 104 or 105 or 106 or 107 |
| 109 | 41 or 58 or 86 or 96 or 108 |
| 110 | Randomized Controlled Trial/ |
| 111 | clinical trial/ or controlled clinical trial/ |
| 112 | random allocation/ |
| 113 | Double‐Blind Method/ |
| 114 | Single‐Blind Method/ |
| 115 | placebos/ |
| 116 | Research Design/ |
| 117 | Intervention Studies/ |
| 118 | Evaluation Studies/ |
| 119 | Comparative Study/ |
| 120 | exp Longitudinal Studies/ |
| 121 | Cross‐Over Studies/ |
| 122 | clinical trial.tw. |
| 123 | latin square.tw. |
| 124 | (time adj series).tw. |
| 125 | (before adj2 after adj3 (stud* or trial* or design*)).tw. |
| 126 | ((singl* or doubl* or trebl* or tripl*) adj5 (blind* or mark)).tw. |
| 127 | placebo*.tw. |
| 128 | random*.tw. |
| 129 | (matched adj (communit* or school* or population*)).tw. |
| 130 | control*.tw. |
| 131 | (comparison group* or control group*).tw. |
| 132 | matched pairs.tw. |
| 133 | outcome stud*.tw. |
| 134 | (quasiexperimental or quasi experimental or pseudo experimental).tw. |
| 135 | (nonrandomi?ed or non randomi?ed or psuedo randomi?ed or quasi randomi?ed).tw. |
| 136 | prospectiv*.tw. |
| 137 | volunteer*.tw. |
| 138 | 110 or 111 or 112 or 113 or 114 or 115 or 116 or 117 or 118 or 119 or 120 or 121 or 122 or 123 or 124 or 125 or 126 or 127 or 128 or 129 or 130 or 131 or 132 or 133 or 134 or 135 or 136 or 137 |
| 139 | 4 and 27 and 109 and 138 |
| 140 | 4 and 27 and 109 |
| 141 | (diet* or energy intake or food habits or fat).tw. |
| 142 | randomi?ed controlled trial*.tw. |
| 143 | 109 or 141 |
| 144 | 138 or 142 |
| 145 | 4 and 27 and 143 and 144 |
| 146 | limit 145 to (180 school age or 200 adolescence ) |
CINAHL Search Strategy
| # | Query |
| S139 | S4 AND S27 AND S110 AND S138 Limiters ‐ Age Groups: Child: 6‐12 years, Adolescent: 13‐18 years |
| S138 | S111 OR S112 OR S113 OR S114 OR S115 OR S116 OR S117 OR S118 OR S119 OR S120 OR S121 OR S122 OR S123 OR S124 OR S125 OR S126 OR S127 OR S128 OR S129 OR S130 OR S131 OR S132 OR S133 OR S134 OR S135 OR S136 OR S137 |
| S137 | AB volunteer* |
| S136 | AB prospectiv* |
| S135 | (nonrandomised or nonrandomized or non randomized or non randomised or psuedo randomised or psuedo randomized or quasi randomised or quasi randomized |
| S134 | AB quasiexperimental or quasi experimental or pseudo experimental |
| S133 | AB outcome stud* |
| S132 | AB matched pairs |
| S131 | AB (comparison group* or control group*) |
| S130 | AB control* |
| S129 | (matched n1 (communit* or school* or population*)) |
| S128 | AB random* |
| S127 | AB placebo* |
| S126 | ((singl* or doubl* or trebl* or tripl*) n5 (blind* or mark)) |
| S125 | (before n2 after n3 (stud* or trial* or design*)) |
| S124 | (MH "Time Series") |
| S123 | "latin square" |
| S122 | AB clinical trial* |
| S121 | (MH "Crossover Design") OR "Cross‐Over Studies" |
| S120 | (MH "Prospective Studies") OR "Longitudinal Studies" |
| S119 | (MH "Comparative Studies") |
| S118 | (MH "Evaluation Research") OR "Evaluation Studies" |
| S117 | (MH "Experimental Studies") OR "Intervention Studies" |
| S116 | (MH "Study Design") |
| S115 | (MH "Placebos") |
| S114 | (MH "Single‐Blind Studies") |
| S113 | (MH "Double‐Blind Studies") |
| S112 | (MH "Random Assignment") |
| S111 | (MH "Randomized Controlled Trials") OR (MH "Clinical Trials+") |
| S110 | S42 OR S57 OR S87 OR S97 OR S109 |
| S109 | S98 OR S99 OR S100 OR S101 OR S102 OR S103 OR S104 OR S105 OR S106 OR S107 OR S108 |
| S108 | AB binge |
| S107 | AB intoxicat* |
| S106 | AB drunk* |
| S105 | AB spirit* |
| S104 | AB wine* |
| S103 | AB beer* |
| S102 | AB liquor* |
| S101 | AB drink* |
| S100 | (MH "Alcoholism") OR (MH "Alcoholic Intoxication") |
| S99 | AB alcohol* |
| S98 | (MH "Binge Drinking") OR (MH "Drinking Behavior") |
| S97 | S88 OR S89 OR S90 OR S91 OR S92 OR S93 OR S94 OR S95 OR S96 |
| S96 | AB anti‐smok* |
| S95 | AB ex‐smoker* |
| S94 | (MH "Substance Use Disorders") |
| S93 | ((ceas* or cess* or prevent* or stop* or quit* or abstin* or abstain* or reduc*) n5 (smok* or tobacco or nicotine)) |
| S92 | (MH "Tobacco") |
| S91 | (MH "Nicotine") |
| S90 | AB smok* |
| S89 | (MH "Smoking Cessation Programs") OR (MH "Tobacco Abuse Control (Saba CCC)") OR (MH "Tobacco Abuse (Saba CCC)") OR "Tobacco Use Cessation" |
| S88 | (MH "Smoking+") |
| S87 | S58 OR S59 OR S60 OR S61 OR S62 OR S63 OR S64 OR S65 OR S66 OR S67 OR S68 OR S69 OR S70 OR S71 OR S72 OR S73 OR S74 OR S75 OR S76 OR S77 OR S78 OR S79 OR S80 OR S81 OR S82 OR S83 OR S84 OR S85 OR S86 |
| S86 | (MH "Nutritional Status") |
| S85 | "cafeteria*" |
| S84 | ((feeding or food or nutrition*) n1 program*) |
| S83 | "menu plan*" |
| S82 | (school n1 (lunch* or meal*)) |
| S81 | (MH "Candy") |
| S80 | "confectionar*" |
| S79 | (MH "Dietary Fats") |
| S78 | "sweetened drink*" |
| S77 | "soda" |
| S76 | (MH "Carbonated Beverages") OR "soft drink*" |
| S75 | (MH "Food") |
| S74 | (MH "Food Habits") |
| S73 | (MH "Food Intake") OR "dietary intake" |
| S72 | (MH "Eating Behavior") OR "feeding behaviour" |
| S71 | (MH "Eating") |
| S70 | (MH "Energy Density") |
| S69 | (MH "Energy Intake") |
| S68 | "calorie*" |
| S67 | "menu*" |
| S66 | (MH "Food Services") OR "food service*" |
| S65 | AB canteen* |
| S64 | fruit* |
| S63 | (MH "Vegetables") OR "vegetable*" |
| S62 | (MH "Fruit+") |
| S61 | "Child Nutrition Sciences" OR (MH "Child Nutrition") |
| S60 | healthy eating |
| S59 | nutrition* |
| S58 | (MH "Diet+") |
| S57 | S43 OR S44 OR S45 OR S46 OR S47 OR S48 OR S49 OR S50 OR S51 OR S52 OR S53 OR S54 OR S55 OR S56 |
| S56 | ((lifestyle* or life style*) n5 activ*) |
| S55 | AB sport* |
| S54 | (exercise* n1 aerobic*) |
| S53 | (MH "Dancing+") OR "Dancing" |
| S52 | (MH "Sports+") |
| S51 | (MH "Leisure Activities+") |
| S50 | (MH "Life Style+") OR (MH "Life Style, Sedentary") |
| S49 | "sedentary" |
| S48 | (MH "Physical Fitness") |
| S47 | (MH "Physical Education and Training") OR "physical education and training" |
| S46 | (MH "Motor Activity+") |
| S45 | physical inactivity |
| S44 | (MH "Physical Activity") |
| S43 | (MH "Exercise+") |
| S42 | S28 OR S29 OR S30 OR S31 OR S32 OR S33 OR S34 OR S35 OR S36 OR S37 OR S38 OR S39 OR S40 OR S41 |
| S41 | (obes* n2 (prevent* or treat*)) |
| S40 | preventive care or preventative care |
| S39 | preventative measure* |
| S38 | preventive measure* |
| S37 | "secondary prevention" |
| S36 | "Primary Prevention" |
| S35 | ((bmi or body mass index) n2 (gain or loss or change)) |
| S34 | weight change* |
| S33 | (overweight or over weight or overeat* or over eat*) |
| S32 | (weight gain or weight loss) |
| S31 | obes* |
| S30 | (MH "Weight Loss") |
| S29 | (MH "Weight Gain") |
| S28 | (MH "Obesity+") |
| S27 | S1 OR S2 OR S3 OR S4 OR S5 OR S6 OR S7 OR S8 OR S9 OR S10 OR S11 OR S12 OR S13 OR S14 OR S15 OR S16 OR S17 OR S18 OR S19 OR S20 OR S21 OR S22 OR S23 OR S24 OR S25 OR S26 |
| S26 | AB scal* up |
| S25 | AB integration |
| S24 | AB program* |
| S23 | AB adherence |
| S22 | AB incorporation |
| S21 | AB capacity |
| S20 | AB maintenance |
| S19 | AB routin* |
| S18 | AB institutionali* |
| S17 | AB sustainab* |
| S16 | AB uptake |
| S15 | AB transfer |
| S14 | AB translation |
| S13 | AB transformation |
| S12 | AB quality improvement* |
| S11 | AB system* change* |
| S10 | AB diffusion |
| S9 | AB organisational change* or organizational change* |
| S8 | AB practice |
| S7 | adopt* |
| S6 | AB dissemination |
| S5 | AB implement* |
| S4 | S1 OR S2 OR S3 |
| S3 | kinder* |
| S2 | ((primary or elementary or middle or junior or high or secondary) n1 (school* or student*)) |
| S1 | (MH "Schools") OR (MH "Schools, Elementary") OR (MH "Schools, Middle") OR (MH "Schools, Secondary") |
COCHRANE LIBRARY search strategy
School* or ((primary or elementary or middle or junior or high or secondary) and student*) or kinder*
in Title, Abstract, Keywords and
Implement* or dissemination or adopt* or practice or "organisational change*" or "organizational change*" or diffusion or "system* change*" or "quality improvement*" or transformation or translation or transfer or uptake or sustainab* or institutionali* or routin* or maintenance or capacity or incorporation or adherence or program* or integration or "scal* up"
in Title, Abstract, Keywords and
Obes* or "Weight Gain" or "Weight Loss" or overweight or "over weight" or overeat* or "over eat*" or "weight change*" or ((bmi or body mass index) and (gain or loss or change)) or "Primary Prevention" or "secondary prevention" or "preventive measure*" or "preventative measure" or "preventive care" or "preventative care" or Exercise or "physical activity" or "physical inactivity" or "Motor Activity" or "physical education and training" or "Physical Fitness" or sedentary or "Life Style" or lifestyle or "Leisure Activities" or sport* or Dancing or aerobic* or diet or nutrition* or "healthy eating" or "Child Nutrition Sciences" or fruit* or vegetable* or canteen* or "food service*" or menu* or calorie* or "Energy Intake" or "energy density" or eating or "Feeding Behavior" or "Feeding Behaviour" or "dietary intake" or food or "Carbonated Beverage*" or "soft drink*" or soda or "sweetened drink*" or "Dietary Fats" or confectionar* or "school lunch*" or "school meal*" or "menu plan*" or ((feeding or food or nutrition*) and program*) or cafeteria* or smok* or Tobacco or Nicotine or alcohol* or drink* or liquor* or beer* or wine* or spirit* or drunk* or intoxicat* or binge in Title, Abstract, Keywords
Dissertations and Theses search strategy
ti(School* OR ((primary OR elementary OR middle OR junior OR high OR secondary) AND student*) OR kinder*)
AND
ab(Implement* OR dissemination OR adopt* OR practice OR "organisational change*" OR "organizational change*" OR diffusion OR "system* change*" OR "quality improvement*" OR transformation OR translation OR transfer OR uptake OR sustainab* OR institutionali* OR routin* OR maintenance OR capacity OR incorporation OR adherence OR program* OR integration OR "scal* up")
AND
ti(Obes* OR "Weight Gain" OR "Weight Loss" OR overweight OR "over weight" OR overeat* OR "over eat*" OR "weight change*" OR ((bmi OR body mass index) AND (gain OR loss OR change)) OR "Primary Prevention" OR "secondary prevention" OR "preventive measure*" OR "preventative measure" OR "preventive care" OR "preventative care" OR Exercise OR "physical activity" OR "physical inactivity" OR "Motor Activity" OR "physical education and training" OR "Physical Fitness" OR sedentary OR "Life Style" OR lifestyle OR "Leisure Activities" OR sport* OR Dancing OR aerobic* OR diet OR nutrition* OR "healthy eating" OR "Child Nutrition Sciences" OR fruit* OR vegetable* OR canteen* OR "food service*" OR menu* OR calorie* OR "Energy Intake" OR "energy density" OR eating OR "Feeding Behavior" OR "Feeding Behaviour" OR "dietary intake" OR food OR "Carbonated Beverage*" OR "soft drink*" OR soda OR "sweetened drink*" OR "Dietary Fats" OR confectionar* OR "school lunch*" OR "school meal*" OR "menu plan*" OR ((feeding OR food OR nutrition*) AND program*) OR cafeteria* OR smok* OR Tobacco OR Nicotine OR alcohol* OR drink* OR liquor* OR beer* OR wine* OR spirit* OR drunk* OR intoxicat* OR binge)
AND
ab("Randomized Controlled Trial*" OR "Randomised Controlled Trial*" OR "clinical trial*" OR random* OR "Double‐Blind Method" OR "Single‐Blind Method" OR placebo* OR "Research Design" OR "Intervention Stud*" OR "Evaluation Stud*" OR "Comparative Stud*" OR "Longitudinal Stud*" OR "Cross‐Over Stud*" OR "latin square" OR (time AND series) OR ((before AND after) AND (stud* OR trial* OR design*)) OR ((singl* OR doubl* OR trebl* OR tripl*) AND (blind* OR mark)) OR (matched AND (communit* OR school* OR population*)) OR control* OR "comparison group*" OR "control group*" OR "matched pairs" OR "outcome stud*" OR quasiexperimental OR "quasi experimental" OR "pseudo experimental" OR nonrandomized OR nonrandomised OR "non randomised" OR "non randomized" OR "psuedo randomised" OR "psuedo randomized" OR "quasi randomised" OR "quasi randomized" OR prospective* OR volunteer*)
ERIC search strategy
ti,ab(School* OR ((primary OR elementary OR middle OR junior OR high OR secondary) AND student*) OR kinder*)
AND ab(Implement* OR dissemination OR adopt* OR practice OR "organisational change*" OR "organizational change*" OR diffusion OR "system* change*" OR "quality improvement*" OR transformation OR translation OR transfer OR uptake OR sustainab* OR institutionali* OR routin* OR maintenance OR capacity OR incorporation OR adherence OR program* OR integration OR "scal* up")
AND ti,ab(Obes* OR "Weight Gain" OR "Weight Loss" OR overweight OR "over weight" OR overeat* OR "over eat*" OR "weight change*" OR ((bmi OR body mass index) AND (gain OR loss OR change)) OR "Primary Prevention" OR "secondary prevention" OR "preventive measure*" OR "preventative measure" OR "preventive care" OR "preventative care" OR Exercise OR "physical activity" OR "physical inactivity" OR "Motor Activity" OR "physical education and training" OR "Physical Fitness" OR sedentary OR "Life Style" OR lifestyle OR "Leisure Activities" OR sport* OR Dancing OR aerobic* OR diet OR nutrition* OR "healthy eating" OR "Child Nutrition Sciences" OR fruit* OR vegetable* OR canteen* OR "food service*" OR menu* OR calorie* OR "Energy Intake" OR "energy density" OR eating OR "Feeding Behavior" OR "Feeding Behaviour" OR "dietary intake" OR food OR "Carbonated Beverage*" OR "soft drink*" OR soda OR "sweetened drink*" OR "Dietary Fats" OR confectionar* OR "school lunch*" OR "school meal*" OR "menu plan*" OR ((feeding OR food OR nutrition*) AND program*) OR cafeteria* OR smok* OR Tobacco OR Nicotine OR alcohol* OR drink* OR liquor* OR beer* OR wine* OR spirit* OR drunk* OR intoxicat* OR binge)
AND ab("Randomized Controlled Trial*" OR "Randomised Controlled Trial*" OR "clinical trial*" OR random* OR "Double‐Blind Method" OR "Single‐Blind Method" OR placebo* OR "Research Design" OR "Intervention Stud*" OR "Evaluation Stud*" OR "Comparative Stud*" OR "Longitudinal Stud*" OR "Cross‐Over Stud*" OR "latin square" OR (time AND series) OR ((before AND after) AND (stud* OR trial* OR design*)) OR ((singl* OR doubl* OR trebl* OR tripl*) AND (blind* OR mark)) OR (matched AND (communit* OR school* OR population*)) OR control* OR "comparison group*" OR "control group*" OR "matched pairs" OR "outcome stud*" OR quasiexperimental OR "quasi experimental" OR "pseudo experimental" OR nonrandomized OR nonrandomised OR "non randomised" OR "non randomized" OR "psuedo randomised" OR "psuedo randomized" OR "quasi randomised" OR "quasi randomized" OR prospective* OR volunteer*) Narrowed by
Education level: [Clear(Clear Education level) Education level]: NOT (Higher Education AND Postsecondary Education AND Preschool Education AND Adult Education AND Two Year Colleges)
SCOPUS search strategy
TITLE‐ABS ( ( school* OR ( ( primary OR elementary OR middle OR junior OR high OR secondary ) AND student* ) OR kinder* ) ) AND TITLE ( implement* OR dissemination OR adopt* OR practice OR "organisational change*" OR "organizational change*" OR diffusion OR "system* change*" OR "quality improvement*" OR transformation OR translation OR transfer OR uptake OR sustainab* OR institutionali* OR routin* OR maintenance OR capacity OR incorporation OR adherence OR program* OR integration OR "scal* up" ) AND TITLE‐ABS ( obes* OR "Weight Gain" OR "Weight Loss" OR overweight OR "over weight" OR overeat* OR "over eat*" OR "weight change*" OR bmi OR "body mass index" OR "Primary Prevention" OR "secondary prevention" OR "preventive measure*" OR "preventative measure" OR "preventive care" OR "preventative care" OR exercise OR "physical activity" OR "physical inactivity" OR "Motor Activity" OR "physical education and training" OR "Physical Fitness" OR sedentary OR "Life Style" OR lifestyle OR "Leisure Activities" OR sport* OR dancing OR aerobic* OR diet OR nutrition* OR "healthy eating" OR "Child Nutrition Sciences" OR fruit* OR vegetable* OR canteen* OR "food service*" OR menu* OR calorie* OR "Energy Intake" OR "energy density" OR eating OR "Feeding Behavior" OR "Feeding Behaviour" OR "dietary intake" OR food OR "Carbonated Beverage*" OR "soft drink*" OR soda OR "sweetened drink*" OR "Dietary Fats" OR confectionar* OR "school lunch*" OR "school meal*" OR "menu plan*" OR cafeteria* OR smok* OR tobacco OR nicotine OR alcohol* OR drink* OR liquor* OR beer* OR wine* OR spirit* OR drunk* OR intoxicat* OR binge OR "feeding program*" OR "food program*" OR "nutrition* program*" ) AND TITLE ( ( "clinical trial*" OR random* OR "Double‐Blind Method" OR "Single‐Blind Method" OR placebo* OR "Research Design" OR "Intervention Stud*" OR "Evaluation Stud*" OR "Comparative Stud*" OR "Longitudinal Stud*" OR "Cross‐Over Stud*" OR "latin square" OR "time series" OR "before and after" OR control* OR "comparison group*" OR "control group*" OR "matched pairs" OR "outcome stud*" OR quasiexperimental OR "quasi experimental" OR "pseudo experimental" OR nonrandomized OR nonrandomised OR "non randomised" OR "non randomized" OR "psuedo randomised" OR "psuedo randomized" OR "quasi randomised" OR "quasi randomized" OR prospective* OR volunteer* OR "singl* blind*" OR "singl* mask*" OR "doubl* blind*" OR "doubl* mask*" OR "trebl* blind*" OR "trebl* mask*" OR "tripl* blind*" OR "tripl* mask*" ) )
Appendix 2. 'Risk of bias' assessment tool
|
RANDOM SEQUENCE GENERATION Selection bias (biased allocation to interventions) due to inadequate generation of a randomised sequence | |
| Criteria for a judgement of ‘Low risk’ of bias. | The investigators describe a random component in the sequence generation process such as:
*Minimization may be implemented without a random element, and this is considered to be equivalent to being random. |
| Criteria for the judgement of ‘High risk’ of bias. | The investigators describe a non‐random component in the sequence generation process. Usually, the description would involve some systematic, non‐random approach, for example:
Other non‐random approaches happen much less frequently than the systematic approaches mentioned above and tend to be obvious. They usually involve judgement or some method of non‐random categorization of participants, for example:
|
| Criteria for the judgement of ‘Unclear risk’ of bias. | Insufficient information about the sequence generation process to permit judgement of ‘Low risk’ or ‘High risk’. |
|
ALLOCATION CONCEALMENT Selection bias (biased allocation to interventions) due to inadequate concealment of allocations prior to assignment | |
| Criteria for a judgement of ‘Low risk’ of bias. | Participants and investigators enrolling participants could not foresee assignment because one of the following, or an equivalent method, was used to conceal allocation:
|
| Criteria for the judgement of ‘High risk’ of bias. | Participants or investigators enrolling participants could possibly foresee assignments and thus introduce selection bias, such as allocation based on:
|
| Criteria for the judgement of ‘Unclear risk’ of bias. | Insufficient information to permit judgement of ‘Low risk’ or ‘High risk’. This is usually the case if the method of concealment is not described or not described in sufficient detail to allow a definite judgement – for example if the use of assignment envelopes is described, but it remains unclear whether envelopes were sequentially numbered, opaque and sealed. |
|
BLINDING OF PARTICIPANTS AND PERSONNEL Performance bias due to knowledge of the allocated interventions by participants and personnel during the study | |
| Criteria for a judgement of ‘Low risk’ of bias. | Any one of the following:
|
| Criteria for the judgement of ‘High risk’ of bias. | Any one of the following:
|
| Criteria for the judgement of ‘Unclear risk’ of bias. | Any one of the following:
|
|
BLINDING OF OUTCOME ASSESSMENT Detection bias due to knowledge of the allocated interventions by outcome assessors | |
| Criteria for a judgement of ‘Low risk’ of bias. | Any one of the following:
|
| Criteria for the judgement of ‘High risk’ of bias. | Any one of the following:
|
| Criteria for the judgement of ‘Unclear risk’ of bias. | Any one of the following:
|
|
INCOMPLETE OUTCOME DATA Attrition bias due to amount, nature or handling of incomplete outcome data | |
| Criteria for a judgement of ‘Low risk’ of bias. | Any one of the following:
|
| Criteria for the judgement of ‘High risk’ of bias. | Any one of the following:
|
| Criteria for the judgement of ‘Unclear risk’ of bias. | Any one of the following:
|
|
SELECTIVE REPORTING Reporting bias due to selective outcome reporting | |
| Criteria for a judgement of ‘Low risk’ of bias. | Any of the following:
|
| Criteria for the judgement of ‘High risk’ of bias. | Any one of the following:
|
| Criteria for the judgement of ‘Unclear risk’ of bias. | Insufficient information to permit judgement of ‘Low risk’ or ‘High risk’. It is likely that the majority of studies will fall into this category. |
|
OTHER BIAS Bias due to problems not covered elsewhere in the table | |
| Criteria for a judgement of ‘Low risk’ of bias. | The study appears to be free of other sources of bias. |
| Criteria for the judgement of ‘High risk’ of bias. | There is at least one important risk of bias. For example, the study:
|
| Criteria for the judgement of ‘Unclear risk’ of bias. | There may be a risk of bias, but there is either:
|
Characteristics of studies
Characteristics of included studies [ordered by study ID]
Alaimo 2015.
| Methods |
Trial name: School Nutrition Advances Kids (SNAK). Study design: Non‐randomised. Intervention duration: The study involved two overlapping cohorts: 1 year 9 month per cohort, 2 years 9 months both cohorts: Cohort 1: 2007‐2009. Cohort 2: 2008‐2010. Length of follow‐up from baseline: Follow‐up occurred in the next school year. Students in cohort 1 completed the baseline survey between November 2007 and March 2008 and the follow‐up survey between October and December 2008. Cohort 2 students completed baseline surveys between November 2008 and February 2009 and the follow‐up survey between October 2009 and January 2010. Differences in baseline characteristics: There were no significant differences among intervention groups with regard to school characteristics at baseline. There were some significant differences at baseline with regard to student dietary intake (all subsequent analyses adjusted for baseline dietary values). Table 2 reports difference at baseline in school characteristics. Some differences were apparent in school location and kitchen type but no P values were reported. Unit of allocation: School. Unit of analysis: School. |
|
| Participants |
School type: Middle Schools (7th and 8th grades). Region: Michigan, USA. Demographic/socioeconomic characteristics: Low‐income middle schools (the mean percentage of students eligible for free/reduced‐price meals for schools in the SNAK project was 68% (range, 50% to 98%), which was similar to all Michigan low‐income middle schools in 2007 (72%; n = 514). Inclusion/exclusion criteria: Inclusion: ‐ Having 50% or more of the students eligible for free or reduced‐price meals and having seventh and eighth grades within the same building (for follow‐up purposes). ‐ Having 50% or more of students eligible for free or reduced‐price meals. ‐ Having seventh and eighth grades within the same building. Number of schools allocated: Schools: 75 (54 intervention, 21 control). Student: 1777 Seventh Graders (completed baseline). 65 (3 intervention groups, 1 control group stated, but result reported according to 2 groups: intervention and control). Numbers by trial group: The study contained one control and three intervention groups. The intervention groups consisted of three different programs (or program combinations) 1) the Healthy Schools Action Team (HSAT), 2) the HSAT plus the School Nutrition Advances Kids Team (SNAK) and 3) the HSAT plus the Michigan State Board of Education (MSBE) nutrition policy. The sample sizes by trial group follow: n (controls baseline) = 21 n (controls follow‐up) = 20 completed some aspect of the project.17 completed FFQ. n (interventions baseline) = 54. n (HSAT baseline) = 24. n (HSAT + SNAK baseline) = 5. n (HSAT + MSBE POLICY baseline) = 25. n (interventions follow‐up) = 45 completed some aspect of the project. 38 completed the FFQ. n (HSAT follow‐up) = 18 completing some aspect and 16 with FFQ. n (HSAT + SNAK follow‐up) = 5 completing some aspect and 4 with FFQ. n (HSAT + MSBE POLICY follow‐up) = 22 completing some aspect and 18 with FFQ. Recruitment: Schools: Were recruited through an application for small grant funding with award values ranging from $2,000 to $4,600 with recruitment methods included direct mailings, e‐mails, and phone calls to eligible schools, as well as a posting on the Michigan Team Nutrition website. Students: Written parental consent and student assent were obtained. Recruitment rate: Schools: denominator unknown. Student: 20.6%. |
|
| Interventions |
Number of experimental conditions: 4 (3 intervention, 1 control, but reported according to 2 groups: intervention and control) Policies, practices or programs targeted by the intervention: The three policies, practices or programs implemented in this study were the HSAT program, the SNAK program and the MSBE nutrition policy. ‐ Schools completed the (HSAT) concerning healthy eating and nutrition and developed an action plan to improve school‐nutrition practices. ‐ Seventh‐grade student teams were formed (SNAK) wherein the students implemented nutrition education and marketing. ‐ The MSBE is a nutrition policy recommending that schools offer and promote healthy foods and beverages in all competitive venues. Implementation strategies: EPOC: Tailored interventions. ‐ The HSAT consisted of a tailored intervention (online assessment and action planning process). EPOC: Educational outreach visits. ‐ Provision of a facilitator (1 time to complete HSAT action plan). ‐ SNAK intervention group also received: facilitator/student meetings to assess student nutrition environment and policies. EPOC: External funding. ‐ Incentives ($1,000 to implement nutrition education or implement aspects of their action plan). ‐ SNAK intervention group also received: incentives: $1000 for students to implement student nutrition action plan Standardised ‐ Curriculum developed for facilitator/student meetings. ‐ MSBE nutrition policy intervention schools were also received: $1500 to compensate for any loss to food service revenue. EPOC: Local consensus processes. ‐ Coordinated School Health Team. MSBE nutrition policy intervention schools were also asked to: EPOC: Clinical practice guidelines. ‐ Implementation of policy (2003 MSBE Healthy Food and Beverage Policy) in cafeteria à la carte lines (during 2nd year). EPOC: Educational materials. ‐ Guidance documents and assistance were provided to schools, food service staff. Theoretical underpinning: Not reported. Description of control: Control group schools participated only in data collection during the study period and were offered the HSAT intervention after the last data collection point. |
|
| Outcomes |
Outcome relating to the implementation of school policies, practices or programs: ‐ Mean Nutrition Policy Change Score (Range: 0‐6) ‐ Mean Nutrition Education and/or Practice Change Score (Range: 0‐14) Data collection method: Survey: The Middle‐School School Environment and Policy Survey (SEPS) was completed either online or by paper (took approx. 30 minutes to complete). There were 2 versions of the survey: one for administrators/principals and one for food service directors/kitchen managers. Validity of measures used: Not reported/self‐report methods. The authors comment that the tool was trialled to establish face and content validity however, the tool was not subjective to rigorous validity testing. Outcome relating to staff knowledge, skills or attitudes: Not reported. Outcome relating to cost: Not reported. Outcome relating to adverse consequences: Not reported. Outcome relating to child diet, physical activity or weight status: Student‐level dietary intake. Data collection method: The Block Kids Food Frequency Questionnaire 2004 (ages 8‐17 years) at baseline and follow‐up. Validity of measures used: Not reported. |
|
| Notes |
Research funding: Supported by funding from the Robert Wood Johnson Foundation’s Healthy Eating Research Program, the Michigan Department of Community Health, and the USDA Supplemental Nutrition Assistance Program–Nutrition Education, supported by the Michigan Department of Human Services under contract numbers ADMIN‐07‐99010, ADMIN‐08‐99010, and ADMIN 09‐99010. Conflicts of interest: Authors report no competing financial interests. |
|
| Risk of bias | ||
| Bias | Authors' judgement | Support for judgement |
| Random sequence generation (selection bias) | High risk | Non‐randomised. The schools were allocated based on preference and were not randomly assigned to group resulting in high risk of selection bias. |
| Allocation concealment (selection bias) | High risk | Non‐randomised trial and no indication that allocation was concealed resulting in high risk of selection bias. |
| Blinding of participants and personnel (performance bias) All outcomes | High risk | Outcome group: All. No blinding or incomplete blinding, and the outcome is likely to be influenced by lack of blinding. |
| Blinding of outcome assessment (detection bias) All outcomes | High risk | Outcome group: Number of school‐initiated nutrition policy and practice changes. No blinding of outcome assessment, and the outcome measurement is likely to be influenced by lack of blinding; self‐report considered high risk. Outcome group: Mean nutrition policy change/nutrition education or practice change (SEP). No blinding of outcome assessment, and the outcome measurement is likely to be influenced by lack of blinding; self‐report considered high risk. Outcome group: Cafeteria à la carte and vending offerings. Self‐reported data from food service directors/other food service personnel and school administrators/principals. No blinding of outcome assessment, and the outcome measurement is likely to be influenced by lack of blinding; self‐report considered high risk. Outcome group: Process data. Unclear if personnel conducting analysis of various process data sources blinded. |
| Incomplete outcome data (attrition bias) All outcomes | Low risk | Outcome group: Practice and Policy. Missing outcome data balanced in numbers across intervention groups, with similar reasons for missing data across groups. Outcome group: Changes in à la carte/vending during lunch. 18% missing/unreliable data overall, however relatively balanced across groups. Outcome group: Number of school‐initiated nutrition practice changes; and Number of school‐initiated nutrition policy changes. 5% missing data overall (n = 3), relatively balanced across groups but 2 schools missing from HSAT‐only group. |
| Selective reporting (reporting bias) | Unclear risk | There is no study protocol therefore it is unclear if there was selective outcome reporting. |
| Potential confounding | Unclear risk | There is insufficient information to determine the risk of potential confounders. |
Cunningham‐Sabo 2003.
| Methods |
Trial name: Pathways. Study design: Randomised controlled trial (not a cluster design). Intervention duration: 3 years. Length of follow‐up from baseline: Food service component: 22 months. Health Behaviour and Anthropometric outcomes: 3 years (Spring 1997 – Spring 2000). Differences in baseline characteristics: Not reported. Unit of allocation: School. Unit of analysis: School. |
|
| Participants |
School type: Primary schools.
Region: Arizona, New Mexico and South Dakota, USA. Demographic/socioeconomic characteristics: Not reported. Inclusion/exclusion criteria: Inclusion: ‐ A projected 3rd grader enrolment of >15 children. ‐ > 90% of 3rd grade children of American Indian ethnicity. ‐ Retention from 3rd to 5th grade over the past 3 years of >70%. ‐ School meals prepared and administered on‐site. ‐ Availability of minimum facilities to deliver a physical activity program at the school. ‐ Approval of the study by school, community, and tribal authorities. Exclusion criteria: ‐ Schools that were considering closing or merging in the next 3 years. Number of schools allocated: ‐ 41 schools (Lunch program) ‐ 21 Intervention, 20 control. ‐ 39 schools (Breakfast program) ‐ 19 intervention, 20 control. Numbers by trial group: n (controls baseline) = 20/20. n (controls follow‐up) = 20/20. n (interventions baseline) = 19/21. n (interventions follow‐up) = 19/19. Recruitment: Schools: A cohort of over 1700 students in 41 schools was followed from the third through the fifth grade Students: Not reported. Recruitment rate: Not reported. |
|
| Interventions |
Number of experimental conditions: 2 (1 Intervention, 1 Control). Policies, practices or programs targeted by the intervention: The practices targeted by the implementation intervention strategies were: ‐ To lower the fat in school breakfast and lunch: to reduce the fat contribution in meals to 30% or less of calories over five consecutive days. Implementation strategies: EPOC: Clinical practice guidelines: ‐ The food service intervention included the development of nutrient guidelines operationalised as behavioural guidelines. These behavioural guidelines included specific steps and skill‐building techniques for lowering the fat content of menu items. EPOC: Educational outreach visits: ‐ To support the behavioural guidelines, training sessions were conducted twice each school year with all food service staff. These training sessions were reinforced by at least five kitchen visits in the first year and eight or more visits to each school in the second and third years. EPOC: Educational materials: ‐ Materials and activities for the training sessions and kitchen visits were developed to reinforce the behavioural guidelines, and included posters, a videotape, food demonstrations, taste‐testing lower‐fat food items, and food quantity estimation activities. EPOC: Educational meetings: ‐ The food service working group, made up of nutrition research staff, some of whom were from the tribal communities involved in the study, met annually and held monthly conference calls to establish and carry out the intervention. Theoretical underpinning: Social Learning Theory and Principles of American Indian culture and practices. Description of control: Not reported, but assume usual practice. |
|
| Outcomes |
Outcome relating to the implementation of school policies, practices or programs: ‐ % calories total fat breakfast (%) ‐ % energy from total fat Lunch (%) Data collection method: Data collection included information on all school breakfast and lunch meal items. Data on all foods offered were recorded on data forms completed by the school food service manager. Data included menus, recipes, vendor products with labels, and nutrient information on all prepared, processed, and packaged foods. All schools had a Pathways notebook with forms to be completed for each meal per day. On the form each food item was listed with a complete description of the food (e.g. raw carrots, canned whole kernel corn, etc.), the serving size, and the number of students served the food. Separate forms were completed for breakfast and lunch. The lead Pathways nutritionist at each of the four sites had overall responsibility for the data collection at their site. School breakfast menus and recipes were entered into the NUTRITION DATA SYSTEM. The nutrient composition was computed by taking the weighted nutrient average of all food items offered and served within each meal component category (milk, breads, fruits, vegetables, entrees, desserts (if served), and condiments) and summing the nutrient averages for all meal components to generate a nutrient total for a single school breakfast and for a single school lunch. Five‐day school breakfast averages were then calculated as well as five‐day school lunch averages. Validity of measures used: Not reported/self‐report methods. While the authors report that the data collector and cook/manager reviewed all data forms together for accuracy and completeness and that an individual with an advanced degree in nutrition or related area and/or a registered dietitian cross‐checked all forms for completeness and clarity, it is not explicitly reported that the tool/measurement methods have been validated or that a validated nutrition collection tool was used. Outcome relating to staff knowledge, skills or attitudes: Not reported. Outcome relating to cost: Not reported. Outcome relating to adverse consequences: Adverse effects of the intervention on growth. Data collection method: Weight and height were measured annually. Validity of measures used: Not reported. Outcome relating to child diet, physical activity or weight status: Anthropometric data and dietary intake of total energy intake, percentage energy from fat. Data collection method: Anthropometric data: Height, weight, BMI and percentage body fat: ‐ Weight was measured with the use of self‐calibrating precision digital scales (Seca 770; Vogel and Halke GmbH, Hamburg, Germany) ‐ Height was measured with a fixed Shorr measuring board (Shorr Productions, Olney, MD). ‐ Two measurements were obtained and the average was recorded. ‐ Percentage body fat: estimated from bioelectrical impedance and anthropometry with the use of an equation developed and validated specifically for this study. Bioelectrical impedance was measured in duplicate with a single‐frequency tetrapolar plethysmograph (Valhalla Scientific, Valhalla, NY). Dietary Intake: 24 dietary recall and direct observation Validity of measures used: Anthropometric data: Percentage body fat equation was validated specifically for this study. Dietary Intake: Not reported. |
|
| Notes |
Other intervention components included: 1. Classroom curriculum: Two 45‐minute lessons were delivered by teachers each week for 12 weeks during the 3rd and 4th grades. This component was decreased to 8 weeks during 5th grade to allow for the follow‐up measurements during the final 2 months of the school year. 2. Physical activity was also a component of the intervention however, it is not reported on as Pathways research staff delivered some of this component to the school students. Consequently, this trial is reported as nutrition only trial. 3. Family involvement: Consisted of 1) family action packs, which were take‐home materials related to the Pathways intervention, including snack packs with samples of low‐fat foods and tips for preparing healthful snacks at home; and 2) family events at schools, which included cooking demonstrations and activities for healthier lifestyle, with the direct involvement of children. Research funding: Supported by funding grants HL‐50867, HL‐50869, HL50905, HL50885, and HL‐50907 from the National Heart, Lung, and Blood Institute. Conflicts of interest: Authors report no competing financial interests exist. |
|
| Risk of bias | ||
| Bias | Authors' judgement | Support for judgement |
| Random sequence generation (selection bias) | Unclear risk | The random sequence generation procedure is not described. |
| Allocation concealment (selection bias) | Unclear risk | There is no information provided about allocation concealment and therefore it is unclear if allocation was concealed. |
| Blinding of participants and personnel (performance bias) All outcomes | High risk | Outcome group: All/menu and recipes (nutrient and food groups) and school menu data collection. Given the nature of the intervention, participants and study personnel are likely to have been aware of study allocation and therefore high risk of performance bias. |
| Blinding of outcome assessment (detection bias) All outcomes | High risk | Outcome group: All/menu and recipe (nutrient and food groups) and school menu data collection. No blinding of outcome assessment, and the outcome measurement is likely to be influenced by lack of blinding; self‐report considered high risk. |
| Incomplete outcome data (attrition bias) All outcomes | Low risk | Outcome group: Low risk of attrition bias given that 39 of 41 schools that included breakfast were included in analysis. |
| Selective reporting (reporting bias) | Low risk | Design paper available and outcomes reported are consistent. http://ajcn.nutrition.org/content/69/4/760S.full.pdf+html |
De Villiers 2015.
| Methods |
Trial name: HealthKick. Study design: Randomised controlled trial for implementation outcome. Intervention duration: 3 years. Length of follow‐up from baseline: 3 years. Differences in baseline characteristics: Not reported. Unit of allocation: Schools. Unit of analysis: Schools. |
|
| Participants |
School type: Elementary. Region: Cape Town, South Africa. Demographic/socioeconomic characteristics: Historically disadvantaged, low‐income communities from an urban area close to the city of Cape Town and from two rural areas outside of Cape Town, South Africa. Inclusion/exclusion criteria: Inclusion: ‐ Whether the principal expressed the need for a health promotion program to be implemented in the school. ‐ The presence of a shop or vendor selling food items at the school. ‐ Unhealthy diet and lack of physical activity among learners and teachers selected as a top health priority by the school principal. ‐ The view of the education district level managers of the potential of schools to effect changes, subjectively taking into account functionality (i.e. functional school‐based support team; school management team), ethos (co‐operation, will, inclination) and viability of school (e.g. results/performance of schools). ‐ Distance from the research office (not more than 105 minutes drive). Exclusion: ‐ School size (schools with less than 50 grade 4 learners were excluded). Number of schools allocated: 16. Numbers by trial group: n (controls baseline) = 8. n (controls follow‐up) = 8. n (interventions baseline) = 8. n (interventions follow‐up) = 8. Recruitment: Schools: The HealthKick study comprised sixteen eligible schools selected from the representative sample of 100 primary schools surveyed in two conveniently selected educations districts (one urban and one rural) in the Western Cape Province of South Africa during the formative phase of the study. Students: Not reported. Recruitment rate: Not clear. |
|
| Interventions |
Number of experimental conditions: 2 (1 intervention, 1 control). Policies, practices or programs targeted by the intervention: The HealthKick Program which was an adaptation of the National School Health Policy and Implementation Guidelines (since replaced by the Integrated School Health Policy [ISHP]). The specific objectives were to: ‐ Promote healthy eating habits. ‐ To develop an environment within the school and community that promotes and facilitates these objectives through an action planning process (APP). Implementation strategies: EPOC: Local opinion leaders: ‐ To facilitate and drive the formal implementation of the APP, a champion (teacher) was identified at each school and they were encouraged to liaise with the project team whenever they required assistance. EPOC:Educational materials: ‐ An “educator’s manual” which contained an APP guide, a booklet for each action area containing guidelines for prioritising action as well as strategies to address identified priorities; the South African food‐based dietary guidelines; a poster listing the behaviour outcomes desired for the children; a poster for listing planned actions; and in 2011 a healthy lifestyle guide for teachers was included. ‐ A resource box with printed materials relating to a healthy lifestyle and its role in the school curriculum. ‐ A curriculum support manual integrating the HK goals with the existing Life Orientation curriculum, developed by an expert in a format familiar to educators. EPOC:Educational outreach visits: ‐ Optional intervention support was offered to the intervention schools in all four action areas during the three years of the intervention. The support took the form of structured activities by the research team to broaden the staff’s knowledge and skills around actions to support a healthy lifestyle. Furthermore, the research team kept in regular contact with the schools who were encouraged to call for assistance/support from the research team at any time. EPOC:Education meetings: ‐ Implementation and nutrition training workshop. Theoretical underpinning: Social Ecological model. Description of control: Principals at schools in the control arm received a booklet with “tips” for healthy schools and a guide to resources that could be accessed to assist in creating a healthier school environment. No further engagement took place between the research team and these schools except for the annual learner and environmental survey. |
|
| Outcomes |
Outcome relating to the implementation of school policies, practices or programs: ‐ School with shops selling fruit salad ‐ Vegetable gardens at schools ‐ Schools having nutrition‐related policies Data collection method: ‐ Data from the situational analysis were used as baseline information and an adapted version of the principal questionnaire and observational schedule used during the formative assessment which was completed annually at all 16 schools. ‐ Principals and school staff involved with the school nutrition program, tuck shops and vegetable gardens were interviewed using semi‐structured questionnaires. The interviews were conducted by members of the research team. As above and project officers acted as both implementers and outcome assessors. Interviews were recorded and transcribed, and the data managed with ATLAS.ti Qualitative Data Analysis. Initial data analysis involved coding the focus group data as group interviews (i.e. similar responses coded only once per group). Validity of measures used: Not reported/self‐report methods. Outcome relating to staff knowledge, skills or attitudes: Not reported. Outcome relating to cost: Not reported. Outcome relating to adverse consequences: Not reported. Outcome relating to child diet, physical activity or weight status: Student level dietary intake. Data collection method: 24‐hour recall. Validity of measures used: Not reported. |
|
| Notes |
Notes: Physical activity was also a goal of the HealthKick Program however, an implementation outcome was unavailable. Consequently, this trial is reported as a nutrition trial, with corresponding implementation strategies, and behavioural outcomes extracted. Research funding: Supported by funding from the World Diabetes Foundation. Conflicts of interest: Authors report no conflict of interest. |
|
| Risk of bias | ||
| Bias | Authors' judgement | Support for judgement |
| Random sequence generation (selection bias) | Low risk | The random sequence was generated by drawing the names of schools typed on folded white paper of exactly the same shape and size from a container. |
| Allocation concealment (selection bias) | Unclear risk | Although the authors' state that the allocation sequence was decided on by the project coordinator before the selection took place, there is no description of whether or not this was concealed. |
| Blinding of participants and personnel (performance bias) All outcomes | High risk | Outcome group: There is no mention that participants and personnel were blinded. Team members served as both implementers and researchers due to limited resources and therefore a high risk of performance bias. |
| Blinding of outcome assessment (detection bias) All outcomes | High risk | Outcome group: Self‐reported records were kept of all activities/events planned by the schools and the numbers that were carried out. Observation was not undertaken by an independent observer blind to group allocation. |
| Incomplete outcome data (attrition bias) All outcomes | Low risk | Outcome group: No schools dropped out over the three years. |
| Selective reporting (reporting bias) | Low risk | There were no unreported process evaluation outcomes according to those planned in the published protocol. |
Delk 2014.
| Methods |
Trial name: The trial was a brief intervention conducted as part of the Central Texas CATCH. The larger scope of the Central Texas CATCH program (reported by Hoelscher and colleagues 2001 and Springer and colleagues 2012) was excluded as the program did not report implementation outcomes appropriate for this review. Study design: Cluster‐randomised controlled trial. Intervention duration: 2009 to 2012. Length of follow‐up from baseline: Assessment occurred at 2 measurement periods, once in March and April of 2011, and again in March and April of 2012, during the second and third years of CATCH implementation, respectively. Differences in baseline characteristics: Schools were matched on size and composition of student ethnicity and economic disadvantage. Baseline demographic characteristics were reported to be similar between groups. Unit of allocation: Schools. Unit of analysis: School teachers. |
|
| Participants |
School type: Middle School (grades 6 – 8) Region: Central Texas Demographic/socioeconomic characteristics: Multi‐ethnic sample. Inclusion criteria: ‐ Grades (6‐ 8) Number of services allocated: 30. Numbers by trial group: Thirty central Texas middle schools were assigned to 1 of 3 conditions: training‐only (Basic), training plus facilitator support (Basic Plus), and training/facilitator support and a social marketing campaign (Basic Plus SM). There was 10 schools in each condition. Recruitment: Schools: Middle schools were selected to participate in the evaluation of the CATCH Middle School program. Recruitment rate: Schools: 30/32 = 94%. |
|
| Interventions |
Number of experimental conditions: 3 (3 intervention groups). Policies, practices or programs targeted by the intervention: To promote the adoption of activity breaks (Abs) by classroom teachers. Implementation strategies: Training‐only (Basic) received: EPOC: Local consensus process and clinical practice guidelines: ‐ A CATCH Middle School Abs guide was developed wherein PE and classroom teachers assisted in developing the guide by reviewing ABs from a variety of sources for ease of use and potential to generate PA and reinforce academic content. The guide included 55 Abs. Each school received 10 hard copies of the ABs and an electronic version to upload on the school’s shared drive so that all teachers could access them. EPOC: Local consensus process and educational meetings: ‐ A CATCH Team was developed at each school. The CATCH Team comprised faculty and staff members, parents, and community members, with one member designated the CATCH Champion. The team was charged with overseeing the implementation of the CATCH Program at their school, which included encouraging teachers to conduct ABs. CATCH program training's took place to promote the adoption of ABs by classroom teachers. Schools were required to send representatives from their CATCH Team to 8 CATCH training's conducted at regular intervals from September 2009 to January 2012. At these training's, CATCH Team members were introduced to the concept of ABs and were provided with research that supports the use of ABs to enhance academic performance. Basic Plus In addition to the aforementioned EPOC strategies this groups also received: EPOC: Educational outreach visits and tailored interventions: ‐ A CATCH facilitator was assigned and conducted monthly visits at these schools. During these visits they helped CATCH Teams devise strategies to promote ABs on their campus. These strategies included faculty meeting presentations explaining the benefits of ABs and regular teacher‐led demonstrations of ABs to faculty; placement of ABs on the school’s shared drive so teachers could access them easily; periodic e‐mail reminders to teachers; and scheduling of a school‐wide time to conduct ABs. Basic Plus SM In addition to all the aforementioned implementation strategies, this group also received: EPOC: Other: ‐ Social marketing campaigns to promote PA. Theoretical underpinning: Not reported. Description of control: There was no control group. All groups received varying amounts of implementation support (strategies). |
|
| Outcomes |
Outcome relating to the implementation of school policies, practices or programs: Teacher reported frequency of AB implementation including: ‐ Have you conducted at least one AB this year? ‐ Percentage of teachers that conducted activity breaks weekly (%, N) ‐ Last week, did you conduct an activity break on at least 1 day? (%, N) Data collection method: Survey. The survey is a 15‐item, self‐administered questionnaire that includes items on teacher implementation of ABs, encouragement of specific health behaviours, and other process evaluation measures for the CATCH program. Validity of measures used: Not reported/self‐report methods. Outcome relating to staff knowledge, skills or attitudes: Teacher self‐efficacy to implement ABs Outcome relating to cost: Not reported. Outcome relating to adverse consequences: Not reported. Outcome relating to child diet, physical activity or weight status: Not reported. |
|
| Notes |
Research funding: This study was funded by the Michael & Susan Dell Foundation. Conflicts of interest: Not reported. |
|
| Risk of bias | ||
| Bias | Authors' judgement | Support for judgement |
| Random sequence generation (selection bias) | Unclear risk | Schools were matched on size and composition of student ethnicity and economic disadvantage and then randomly assigned to one of the 3 study conditions – no other information. |
| Allocation concealment (selection bias) | Unclear risk | No information provided. |
| Blinding of participants and personnel (performance bias) All outcomes | High risk | Little information. Unclear if blinding of key study participants and personnel attempted, but likely that the blinding could have been broken, and the outcome is likely to be influenced by lack of blinding. |
| Blinding of outcome assessment (detection bias) All outcomes | High risk | Blinding of outcome assessment unclear, but likely that the blinding could have been broken, or the outcome measurement is likely to be influenced by lack of blinding. The CATCH Teacher Survey was created to assess the implementation of the CATCH program, including ABs, by classroom teachers. The survey is a 15‐item, self‐administered questionnaire that includes items on teacher implementation of ABs, encouragement of specific health behaviours, and other process evaluation measures for the CATCH program. |
| Incomplete outcome data (attrition bias) All outcomes | High risk | Response rates varied among the conditions (Basic = 56.2%, Basic Plus = 69.7%, and Basic Plus SM = 83.2%, in measurement period 1 and Basic = 59.1%, Basic Plus = 48.9%, and Basic Plus SM = 75.4% in measurement period 2). All surveys from one Basic condition school, 15 surveys in total, were excluded from analysis at both measurement periods due to a low response rate (9%, N = 6) at measurement period 1. Additionally, 54 surveys from measurement period 1 and 58 surveys from measurement period 2 were excluded from analysis because the teacher only taught PE and/or athletics. |
| Selective reporting (reporting bias) | Unclear risk | There is no study protocol therefore it is unclear if there was selective outcome reporting. |
| Recruitment to cluster | Unclear risk | Insufficient information provided. |
| Baseline imbalance | Low risk | The demographic characteristics of students and schools across the 3 conditions were similar at baseline. |
| Loss of cluster | High risk | All surveys from one Basic condition school, 15 surveys in total, were excluded from analysis at both measurement periods due to a low response rate (9%, N = 6) at measurement period 1. |
| Incorrect analysis | High risk | No account of clustering. Significant differences across conditions within each measurement period, and by conditions across measurement periods, were assessed by Chi2 for categorical outcomes and by analysis of variance (ANOVA) with a Scheffe post hoc test for continuous outcomes. |
| Contamination | Low risk | Contamination: Schools were randomised to study condition. |
| Compatibility with individually randomised RCTs | Unclear risk | Unable to determine if a herd effect exists. |
French 2004.
| Methods |
Trial name: Trying Alternative Cafeteria Options in Schools (TACOS). Study design: Cluster‐randomised controlled trial. Intervention duration: 2 years. Length of follow‐up from baseline: 2 years. Differences in baseline characteristics: Similar. Unit of allocation: Schools. Unit of analysis: Schools and students. |
|
| Participants |
School type: Schools (secondary). Region: St Paul metropolitan, Minneapolis, USA. Demographic/socioeconomic characteristics: Schools were predominantly urban. On average, 14% of students were non‐white (range 3% to 77%), and 9% were eligible for free lunch (range 1% to 57%). Two schools’ food services were run by food service management companies, 18 schools’ services were run by the school district food services, 19 schools prepared meals on‐site, and 20 schools participated in the National School Lunch Program. Inclusion criteria: ‐ The presence of an à la carte area in the school cafeteria operated by the school food service. ‐ A food service director and principal willing to take part in the study for 2 school years. ‐ A willingness to be randomly assigned to intervention or control group. ‐ Computerised à la carte sales data. ‐ A willingness to share these data with researchers, allow a mail‐based administration of student evaluation surveys, and allow student groups to collaborate with research staff on the development and implementation of school‐wide promotional activities involving foods offered in the à la carte area. Number of schools allocated: 20. Numbers by trial group: n (controls baseline) = 10. n (controls follow‐up) = 10. n (interventions baseline) = 10. n (interventions follow‐up) = 10. Recruitment: Not reported. Recruitment rate: 80%. Of the 25 eligible secondary schools invited to participate, 5 declined, primarily because of the respective food service directors’ concern about the additional food service staff burden related to compliance with research protocols. To avoid contamination caused by schools sharing the same food service director, only 1 school per district was included in the study. For student survey mean response rates for the 3 surveys were 75%, 75%, and 77%, respectively, and did not differ significantly between intervention and control schools. |
|
| Interventions |
Number of experimental conditions: 2 (1 intervention, 1 control). Policies, practices or programs targeted by the intervention: Intervention consisted of increasing the availability of lower‐fat foods in cafeteria à la carte areas and implementing school‐wide, student‐based promotions of these lower‐fat foods. The goal was to increase lower‐fat à la carte food availability by 30% relative to baseline. The ultimate goal was to have 50% of products be lower fat. Implementation strategies: EPOC: Local consensus processes: ‐ Quarterly meetings between research and food service staff were held to review progress toward goals. EPOC: Tailored intervention: ‐ Development of tailored lists of higher‐ and lower‐fat foods for schools. EPOC: Education meetings: ‐ TACOS staff worked with the student groups and their faculty advisors to train the students for specific promotional activities and to act as liaisons between students and the food service staff. EPOC: Pay for performance: ‐ Student groups were offered financial incentives for completing each promotion (from $100 to $300, depending on the complexity of the promotion). Theoretical underpinning: Not reported. Description of control: No intervention control. |
|
| Outcomes |
Outcome relating to the implementation of school service policies, practices or programs: ‐ Students seen any posters in school about cafeteria food choices? ‐ Students heard any messages over public address system, in school? ‐ Students heard about any contests or events at school about cafeteria food choices? ‐ Students took part in any taste tests, food samplings, or contests in the school cafeteria? ‐ Percentage low‐fat à la carte foods Data collection method: To monitor the extent to which intervention schools implemented their lower‐fat à la carte food availability goals, trained research staff visited each intervention school every 3 weeks to record all foods offered at lunchtime in the à la carte areas. In addition, complete à la carte inventories in intervention and control schools were conducted by trained research staff at baseline and after the second intervention year. Student exposure to the TACOS intervention activities was assessed with a series of 4 questions on a mailed student survey. Validity of measures: Not reported. Both self‐reports and objective measures were used. Outcome relating to staff knowledge, skills or attitudes: Not reported. Outcome relating to cost: Not reported. Outcome relating to adverse consequences: School food service revenue was reported. Data collection method: Data on school food service revenues were collected at the end of each school semester from a same point‐of sales software program including revenues from student reimbursable lunches, student à la carte foods, total à la carte foods, and total school food service revenues. Validity of measures: Not reported. Outcome relating to child diet, physical activity or weight status: Nutritional food choices two outcome measures assessing nutrition intake: 1) The percentage of lower‐fat à la carte foods sold and 2) students’ self‐reported food choices. Data collection method: 1) Students’ self‐reported food choices: Student food choices were measured via a mailed survey to a random sample of 75 students per school, according to the Dillman method, during the Fall of 2000, the Spring of 2001, and the Spring of 2002. Surveys comprised 48 questions related to students’ food choices. 2) Sales data were collected on a weekly basis in electronic format from school food service staff in each of the 20 schools Validity of measures used: Sales data: objective. |
|
| Notes |
Research funding: Supported by the National Institutes of Health (grant R18 HL61305). Conflicts of interest: Not reported. |
|
| Risk of bias | ||
| Bias | Authors' judgement | Support for judgement |
| Random sequence generation (selection bias) | Unclear risk | Schools were randomly allocated to experimental group. The random sequence generation procedure is not described. |
| Allocation concealment (selection bias) | Unclear risk | There is no information provided about allocation concealment and therefore it is unclear if allocation was concealed. |
| Blinding of participants and personnel (performance bias) All outcomes | High risk | Outcome group: Student data and observations: No mention that students or TACOS staff were blinded. |
| Blinding of outcome assessment (detection bias) All outcomes | High risk | Outcome group: Student data and observations: No mention that students or TACOS staff were blinded. |
| Incomplete outcome data (attrition bias) All outcomes | Low risk | Outcome group: All 20 secondary schools participated. |
| Selective reporting (reporting bias) | Unclear risk | There is no study protocol therefore it is unclear if there was selective outcome reporting. |
| Recruitment to cluster | Low risk | Schools were randomised to condition and those within each school participated. |
| Baseline imbalance | Low risk | Schools were randomised to condition. |
| Loss of cluster | Low risk | There were no losses of clusters. |
| Incorrect analysis | Unclear risk | Graphs of data by school showed that the first 3 weeks and last 3 weeks of each 40‐week academic year demonstrated excessive variation attributable to start‐up and termination process. Therefore, data from these weeks were excluded from the analysis. Unclear how the full analysis was performed. |
| Contamination | Low risk | To avoid contamination caused by schools sharing the same food service director, only one school per district was included in the study. |
| Compatibility with individually randomised RCTs | Unclear risk | Unable to determine if a herd effect exists. |
Gingiss 2006.
| Methods |
Trial name: Texas Tobacco Prevention Initiative. Study design: Non‐randomised control (comparison group). Intervention duration: 2 years. Length of follow‐up from baseline: 2 years (baseline in 2000 and 2 years later). Differences in baseline characteristics: No significant differences between schools. Unit of allocation: Schools. Unit of analysis: Schools. |
|
| Participants |
School type: Schools (middle and high). Region: East Texas, USA. Demographic/socioeconomic characteristics: Not reported. Inclusion/exclusion criteria: Not reported. Number of schools allocated: 134. Numbers by trial group: n (controls baseline) = Not reported. n (controls follow‐up) = Not reported. n (interventions baseline) = Not reported. n (interventions follow‐up) = Not reported. Recruitment: School: The baseline sample of schools was randomly selected by Texas Department of State Health Services (TDSHS) in school year (SY) SY2000from schools serving students in grades 6 through 12 in the East Texas study area. A representative sample of schools was selected. Participating schools were located in 69 districts in a 7‐county study area. The original SY2000 sample of 171 schools was drawn with probability proportional to study‐area size and school condition (intervention or comparison). Among these schools, 134 participated in the baseline study. This sample was retained and used in this SY2002 follow‐up. Student: Not reported Recruitment rate: 134/171 = 78.4% |
|
| Interventions |
Number of experimental conditions: 2 (1 intervention, 1 control) Policies, practices or programs targeted by the intervention: 1) Conduct tobacco‐use prevention education (TUPE) with the designated curriculums of Project Towards No Tobacco (TNT) at the middle school level and Not On Tobacco (NOT) at the high school level. 2) Conduct at least 1 tobacco prevention event. 3) Provide education and training for parents and staff regarding local policies and ordinances as well as state tobacco laws. 4) establish STARS, PALS, or Teens Against Tobacco Use (TATU) groups or other peer mentor programs at the high school level. Implementation strategies: EPOC: Local consensus processes: Contractual agreements were issued to intervention schools to: ‐ Participate in training organised by their Education Service Centres (ESC) on tobacco issues and curricula. ‐ Conduct TUPE with the designated curriculums of Project TNT at the middle school level and NOT at the high school level. EPOC: Educational outreach visits: ‐ The Texas Tobacco Prevention Initiative placed a Tobacco Specialist at each of four regional ESC serving the East Texas study area. Their responsibilities included coordination, distribution and management of funding, training, and technical assistance for intervention schools in respective service areas. EPOC: Educational meetings: ‐ Training to encourage planning and implementing the above activities based on the Guidelines for school health programs to prevent tobacco use and addiction. EPOC: External funding: ‐ Each school received an allocation of approximately $2000 per year to be used for materials, supplies and small equipment, in‐service release time, training, and travel to tobacco‐related meetings. Theoretical underpinning: Not reported. Description of control: Not reported, but assume usual practice. |
|
| Outcomes |
Outcome relating to the implementation of school policies, practices or programs: ‐ Enforcement of school policy on tobacco use ‐ Instruction on tobacco prevention education ‐ Assessment of prevention programs ‐ Student cessation support ‐ Teacher training for tobacco prevention education ‐ Establish or change school policy on tobacco use ‐ Faculty and staff cessation support ‐ Family involvement in student tobacco programs ‐ Parental involvement in policy ‐ Greater than 10 lessons Data collection method: Self‐report surveys were mailed to the schools for both principals and health coordinators. Validity of measures: Not reported/self‐report methods. Outcome relating to staff knowledge, skills or attitudes: At follow‐up, intervention schools were more likely than comparison schools to be extremely/moderately active in teacher training, using recommended curricula, offering more tobacco‐related lessons, and using more recommended teaching methods. More interest in staff development was reported at intervention schools. Data collection method: Self‐report surveys were mailed to the schools for both principals and health coordinators. Validity of measures: Not reported. Outcome relating to cost: Not reported. Outcome relating to adverse consequences: Not reported. Outcome relating to child diet, physical activity or weight status: Not reported. |
|
| Notes |
Research funding: Supported by funding from Texas Department of State Health Services. Conflicts of interest: Not reported. |
|
| Risk of bias | ||
| Bias | Authors' judgement | Support for judgement |
| Random sequence generation (selection bias) | High risk | Non‐randomised control (comparison group). It appears that schools were not randomly assigned to the intervention or the comparison group and therefore high risk of selection bias. |
| Allocation concealment (selection bias) | High risk | Non‐randomised trial and there is no indication that allocation was concealed and therefore at high risk of selection bias. |
| Blinding of participants and personnel (performance bias) All outcomes | High risk | Outcome group: There is no mention that participants or personnel were blinded to experimental group and therefore at high risk of performance bias. |
| Blinding of outcome assessment (detection bias) All outcomes | High risk | Outcome group: There is no blinding of principals or health coordinators described and the outcomes are likely to be influenced by the use of self‐reported questionnaires. |
| Incomplete outcome data (attrition bias) All outcomes | High risk | Outcome group: High attrition as 25 (19%) schools were lost for the principal survey and 50 (37%) schools for the health coordinator survey. |
| Selective reporting (reporting bias) | Unclear risk | There is no study protocol therefore it is unclear if there was selective outcome reporting. |
| Potential confounding | High risk | There is no mention of measurement of potential confounders, or any attempt to adjust for confounders. |
Heath 2002.
| Methods |
Trial name: El Paso Coordinated Approach to Child Health (El Paso CATCH). Study design: Non‐randomised. Intervention duration: 1997 ‐ 2000. Length of follow‐up from baseline: 3 years. Differences in baseline characteristics: Not reported. Unit of allocation: Schools. Unit of analysis: Schools. |
|
| Participants |
School type: Elementary schools. Region: Participants were 24 elementary schools from five school districts in West Texas and Eastern New Mexico. Demographic/socioeconomic characteristics: El Paso, Texas, a region dominated by the Mexican culture and low‐income families. Inclusion/exclusion criteria: Not reported. Number of schools allocated: 24 (20 intervention, 4 control). Four schools served as controls, with the remaining 20 schools enrolled in the El Paso CATCH program. Most of the schools had baseline physical activity measures (n = 16) and 12 had baseline school meal assessments. Physical activity behaviour during PE classes was assessed in third, fourth, and fifth grades for 16 intervention schools and in third grade only for 4 intervention and the 4 control schools. Grades three, four, and five are reflected in school meal assessments for all schools. All but two schools (1 control and 1 intervention school) had PE with certified PE instructors. In these two schools, classroom teachers conducted PE for third grade only. Numbers by trial group: n (controls baseline) = 4. n (controls follow‐up) = 4. n (interventions baseline) = 20. n (interventions follow‐up) = 20. Recruitment: Not reported. Recruitment rate: Not reported. |
|
| Interventions |
Number of experimental conditions: 2 (1 intervention, 1 control). Policies, practices or programs targeted by the intervention: CATCH intervention was delivered at school level to: Food service: ‐ To reduce the total fat content of food served to 30%. ‐ To reduce the total sodium content to 600 mg ‐ 1000 mg per serving. Implementation strategies: EPOC: Educational meetings: ‐ Staff received training sessions to deliver CATCH. EPOC: Educational outreach visits: ‐ Staff received ongoing support visits to implement EATSMART/CATCH PE. EPOC: Educational materials: ‐ Educational materials were provided to staff/schools. Smart choices manual was provided to all schools. Theoretical underpinning: Social Learning Theory and Organisational Change. Description of control: Not reported but assume usual practice. |
|
| Outcomes |
Outcome relating to the implementation of school service policies, practices or programs: ‐ % fat in breakfast ‐ Sodium (mg) in breakfast ‐ % fat in lunch ‐ Sodium (mg) in lunch Data collection method: For both control and CATCH schools, school breakfast and lunch menus and their recipes were collected for 5 consecutive days during each semester in every year of the study. Recipes for these menus were obtained by interviewing cooks and kitchen managers in school cafeterias and by reviewing the cafeteria production sheets for each meal. Foods from the menus, production sheets, and recipes were entered into a nutritional database that is especially useful for ethnic foods (ESHA Research Inc, Salem, Ore). Once the nutrient content of the meals was analysed, averages of breakfast and lunch values across the 5 days of data collection were obtained. Validity of measures used: Not reported/self‐report methods. Outcome relating to staff knowledge, skills or attitudes: Not reported. Outcome relating to cost: Not reported. Outcome relating to adverse consequences: Not reported. Outcome relating to child diet, physical activity or weight status: BMI, waist‐to‐hip ratio and weight. Data collection method: Anthropometry was conducted in the late Fall or early Spring semester (November, December, January, or February) of each year of the project. At least 3 people were trained to collect these measurements. Validity of measures used: Anthropometry is valid. Each person’s measurements were compared with an experienced technician’s values (the trainer), and reliability was established at a minimum of r = 0.90 for all measures before data collection. |
|
| Notes |
Note: This trial also contained a PA component as part of their policy, practice or programs implemented however, the trial was downgraded to a nutrition trial only as it did not report implementation outcomes for PA or in some instances, the direction and magnitude of effect was not known. Research funding: Supported by funding from the Patient Care and Outcomes Research Award program from the American Heart Association (9970182N) and the Paso del Norte Health Foundation, El Paso, Texas. Conflicts of interest: Not reported. |
|
| Risk of bias | ||
| Bias | Authors' judgement | Support for judgement |
| Random sequence generation (selection bias) | High risk | Non‐randomised. Four schools that were beginning the CATCH program in 1999 were randomly selected and then four control schools that were not in the CATCH program were selected by matching them to the intervention schools for district, relative location, number of PE teachers, number of cafeteria staff, size of third‐grade classes and size of school overall. |
| Allocation concealment (selection bias) | High risk | Non‐randomised. Intervention schools were in the CATCH program while control schools were not in the CATCH program. High risk of bias as no concealment of allocation. |
| Blinding of participants and personnel (performance bias) All outcomes | High risk | Outcome group: There was no blinding of participants or personnel described and performance is likely to be influenced by knowledge of group allocation. |
| Blinding of outcome assessment (detection bias) All outcomes | High risk | Outcome group: Questionnaires were used to survey PE teachers, cafeteria staff and classroom teachers about the implementation of CATCH. There is no blinding of participants described and the outcome is likely to be influenced by the use of self‐reported questionnaires. |
| Incomplete outcome data (attrition bias) All outcomes | Low risk | Outcome group: No schools appeared to drop out. |
| Selective reporting (reporting bias) | Unclear risk | There is no study protocol therefore it is unclear if there was selective outcome reporting. |
| Potential confounding | Unclear risk | Matched intervention and control schools for district, relative location, number of PE teachers, number of cafeteria staff, size of third‐grade classes and size of school overall. However it is unknown whether all potential confounders were measured. |
Hoelscher 2010.
| Methods |
Trial name: Travis County Coordinated Approach To Child Health (CATCH) Trial. Study design: Non‐randomised. Intervention duration: 4 years. Length of follow‐up from baseline: 1 year. Differences in baseline characteristics: Not reported. Unit of allocation: Schools (elementary). Unit of analysis: Classroom and students (elementary). |
|
| Participants |
School type: Schools (elementary). Region: Four school districts in Travis County, Texas, USA. Demographic/socioeconomic characteristics: 53% female; 61% Hispanic, and 14% African American; and mean age of 9.9 years. Inclusion/exclusion criteria: ‐ Schools that include 4th grade classes. ‐ ≥ 60% of school composition of economically disadvantaged students. Number of schools allocated: 30. Numbers by trial group: n (controls baseline) = 15 (CATCH BasicPlus (BP) Group). n (controls follow‐up) = 15 (CATCH BP group). n (interventions baseline) = 15 (CATCH BasicPlus and Community (BPC) group). n (interventions follow‐up) = 15 (CATCH BPC group). Recruitment: Not reported. Recruitment rate: Not reported. |
|
| Interventions |
Number of experimental conditions: 2 (1 intervention, 1 control). Policies, practices or programs targeted by the intervention: The objective of this CATCH program was to target multiple aspects of the school environment, including the classroom, nutrition services and the cafeteria environment, physical education (PE) activities, family and home environment, and, via school health promotion messages and events, the broader school community. This trial compared two versions of the CATCH program, the CATCH BP and the CATCH BPC. The CATCH BPC included all components of the BP program however schools were provided with additional support for building school and community partnerships and local decision making and capacity building related to physical activity (PA) and healthy eating promotion. Implementation strategies: CATCH BP: EPOC: Educational meetings: ‐ Coordinated school health CATCH training and booster training sessions. EPOC: Educational materials: ‐ CATCH program materials, CATCH component coordination kit and supplemental health promotion resources. EPOC: Local consensus process: ‐ CATCH Committee Meetings. EPOC: Pay for performance: ‐ CATCH Awards Program (recognition and funds for CATCH). EPOC: The use of information and communication technology: ‐ School social marketing efforts. EPOC: Educational outreach visits: ‐ CATCH facilitator support visits (1 visit/4–6 weeks). EPOC: Other: ‐ Family Fun night activities/events. CATCH BPC: All the above strategies plus: EPOC: Educational outreach visits: ‐ Additional CATCH facilitator visits (2–3 visits/4–6 weeks). EPOC: Educational meetings: ‐ CATCH Community “Best Practices” workshops (3/year). EPOC: Local consensus process: ‐ Community member required on CATCH Committee and CATCH Community “Best Practices” workshops (3/year). EPOC: Other: ‐ CDC School Health Index used as planning tool. EPOC: Educational materials: ‐ School program and community health promotion activity guide. Theoretical underpinning: Elements of Social Ecological Theory and Social Cognitive Theory. Description of control: Low‐income schools. They received the CATCH BP intervention. Alternate active implementation strategy. |
|
| Outcomes |
Outcome relating to the implementation of school service policies, practices or programs: Continuous ‐ CATCH parent and extracurricular activities ‐ CATCH coordinated healthy eating–related activities ‐ CATCH coordinated physical activity–related activities ‐ Number of CATCH lessons taught ‐ Number of health lessons taught Dichotomous ‐ % Reporting CATCH lessons in schoolroom ‐ % Reporting that fruit usually served at lunch Data collection method: Structured interview with CATCH Champion, self‐administered questionnaire for 4th grade classroom teachers and CATCH SPAN student questionnaire. Validity of measures: Not reported/self‐report methods. However the authors comment that the teacher and Champion measurement tools were based on previous instruments used to measure the dissemination of the CATCH program. The student survey used was modified from the SPAN study. The dietary intake, activity, and process measures were self‐reported, all of the measures were adopted from previous work by the study investigators and have demonstrated face validity, and have been evaluated for reproducibility. Outcome relating to staff knowledge, skills or attitudes: Not reported. Outcome relating to cost: Not reported. Outcome relating to adverse consequences: Not reported. Outcome relating to child diet, physical activity or weight status: Height, weight and BMI measurements along with student‐level dietary intake concerning their unhealthy food intake, food index score, fruit and vegetable intake and sweetened beverage consumption, sedentary behaviour and physical activity. Data collection method: Weight status: Weight measurements were collected using a Tanita BWB‐800S scale; a Perspectives Enterprise stadiometer was used to measure height. BMI was calculated using the standard formula, and BMI percentiles were calculated using the CDC 2000 growth charts. Dietary intake: Student questionnaire. Activity behaviours: Student questionnaire. Physical Activity: SOFIT. Validity of measures used: Weight Status: Validated: Standard protocols were followed by trained and certified research staff. Dietary Intake: The student survey used was modified from the SPAN study. Activity Behaviours: The student survey used was modified from the SPAN study. Physical Activity: Valid. |
|
| Notes |
Research funding: Supported by funding from Michael & Susan Dell Foundation. Conflicts of interest: Some authors received funding from Flaghouse, Inc. and the Michael & Susan Dell Foundation for development, dissemination and evaluation of the CATCH program. The University of Texas School of Public Health receives royalties based on sale of CATCH curriculum, of which 100% goes back into further research and development. The University of Minnesota receives royalties from Flaghouse, Inc. based on sale of CATCH curriculum materials, of which a portion is paid as royalties to the investigators. The remaining authors declared no conflict of interest. |
|
| Risk of bias | ||
| Bias | Authors' judgement | Support for judgement |
| Random sequence generation (selection bias) | High risk | Non‐randomised trial as it does not appear that the schools were randomised to experimental group. 15 CATCH BPC schools were matched to 15 similar low‐income CATCH BP schools by ethnicity and percentage economic disadvantaged. |
| Allocation concealment (selection bias) | High risk | Non‐randomised trial and there is no mention that allocation was concealed and therefore at high risk of selection bias. |
| Blinding of participants and personnel (performance bias) All outcomes | High risk | Outcome group: There is no mention that participants or personnel were blinded to experimental group allocation and therefore risk of performance bias is high. |
| Blinding of outcome assessment (detection bias) All outcomes | High risk | Outcome group: School‐level observations and teacher and student surveys provided process measures. It is not reported that observers or participants were blinded to group allocation and therefore the risk of detection bias is high. |
| Incomplete outcome data (attrition bias) All outcomes | Low risk | Outcome group: There was no school dropout reported. |
| Selective reporting (reporting bias) | Unclear risk | There is no study protocol therefore it is unclear if there was selective outcome reporting. |
| Potential confounding | Unclear risk | CATCH BP and CATCH BPC schools were matched by ethnicity and percentage economic disadvantaged but it is unknown if there were other potential confounders that were not measured. |
Lytle 2006.
| Methods |
Trial name: Teens Eating for Energy and Nutrition at School (TEENS). Study design: Randomised controlled trial for implementation outcome. Intervention duration: 2 years. Length of follow‐up from baseline: 2.5 years (Fall 1998‐Spring 2000). Differences in baseline characteristics: Reported as none: “Participation did not differ significantly by treatment condition or by student‐level dietary variables”. Lytle 2004 reports significant differences between intervention and control students completing diet recall (race/ethnicity and parents’ highest education) and completing the student survey (race/ethnicity, parents’ full‐time employment, parents’ highest education). Unit of allocation: Schools. Unit of analysis: Schools. |
|
| Participants |
School type: Schools (middle). Region: Minneapolis/St. Paul Minnesota USA (lower‐income population). Demographic/socioeconomic characteristics: white (72.9%); and 19.8% were categorised as lower‐socioeconomic status. Inclusion/exclusion criteria: Inclusion: ‐ Schools required to have at least 20% of students in their district qualify for free or reduced‐price school lunch. ‐ Schools required to have both seventh and eighth graders attend their school and have at least 30 students in each of those grades. Number of schools allocated: 16 (8 intervention, 8 control). Numbers by trial group: n (controls baseline) = 8. n (controls follow‐up) = 5. n (interventions baseline) = 8. n (interventions follow‐up) = 8. Recruitment: Schools: Schools agreeing to be in the study committed to the measurement protocol, randomisation to condition, and if randomised to the intervention condition, to the following intervention protocol: 1) Offer all 10 sessions of the TEENS curriculum in each of the seventh and eighth grades, 2) allow the designated teacher to attend a full day of training each year, 3) allow for provision of a family education component, and 4) allow school food service staff to be trained on modifying the school food environment.” Parents: A sub‐sample of parents was randomly selected to complete parent survey. Students: All students who were in seventh grade during the baseline data collection period were considered eligible to participate in TEENS. Recruitment rate: Schools: 20 of 33 = 61%. Parents: 67% of families completed the parents survey (n = 343; 526 families sent the survey) Students: 3,878 (95.8%) students completed the baseline survey, 3,503 (90.3%) completed the interim survey, 3,010 (77.6%) completed the follow‐up survey, sample for analysis of survey data was 2833 students who had survey data at baseline and follow‐up. |
|
| Interventions |
Number of experimental conditions: 2 (1 TEENS intervention, 2 control). Policies, practices or programs targeted by the intervention: ‐ Teens Eating for Energy and Nutrition at School (TEENS) was a school‐based intervention trial conducted in middle schools with a goal of developing and evaluating school and family‐linked intervention strategies to promote students' consumption of fruit, vegetable, and lower fat snacks (FVLFS). ‐The TEENS intervention included classroom, family, school policy, and food service components. Implementation strategies: EPOC: Local opinion leaders and local consensus processes: ‐ School Nutrition Advisory Councils (SNACs) was established to convene school and parental stakeholders to discuss and propose school‐level policy to improve the school food environment. The composition of SNACs differed on a school‐to‐school basis but included as a minimum, a school administrator, food service staff, teacher, student, and university staff member. EPOC: Educational meetings and educational materials: ‐ School food service intervention: The emphasis of the school food service intervention was on increasing the offerings and sales of FVLFS in the lunchroom and on the à la carte lines. District food service directors and workers from intervention schools attended training that emphasised the importance of offering more FVLFS, gave them new tools for promoting FVLFS, exposed food service workers to snacks and beverages that could be offered on the à la carte line that met the TEENS fat criteria of less than 5 g of fat per serving, including taste testing of lower fat products, and offered a forum for sharing ideas between schools. TEENS interventionists also conducted on‐site training to help workers problem‐solve. Theoretical underpinning: Social Cognitive Theory (SCT) was used to inform the intervention plans. Description of control: Delayed intervention. |
|
| Outcomes |
Outcome relating to the implementation of service policies, practices or programs: ‐ Food offered: Foods to limit ‐ Foods offered: Foods to promote ‐ Foods sold: Foods to limit ‐ Food sold: Foods to promote Data collection method: School food environment/fruits, vegetables and salads: Data on the fruits, vegetables, and salads available on school cafeteria lunch lines were collected at eight time points: baseline (Fall 1998), six interim time points; and at follow‐up (Spring 2000). Each data point included 5 consecutive days of meal information. Data collected included the total number of students served the meal pattern lunch, the types and amounts of fruit and vegetable choices offered and sold, and the number of vegetable salads sold. With a few exceptions, these data were extracted from schools' food production records. Periodic observations of school meals were conducted to confirm production records. School food environment/à la carte: A daily data collection form for à la carte items that categorised à la carte items and documented the number of items offered and sold in each category was developed based on their earlier work conducted on à la carte in schools and intervention goals. At baseline and follow‐up, TEENS evaluation staff observed and recorded all the foods and beverages that were offered and sold on à la carte lines for a 5‐day period. Two evaluation staff conducted independent reviews of the data categorisation and abstraction for data quality assurance. Data were summarised into categories of “Foods to Promote” and “Foods to Limit”. “Foods to Promote” included snacks that were 5 or less g of fat, 100% fruit juice, water and low‐fat milk, fruits or vegetables offered, and other lower‐fat versions of popular entrees such as pizza or pretzels and cheese. “Foods to Limit” included all snacks that were more than 5 g of fat, fruit drinks, and higher fat popular entrees such as regular pizza or nachos. Validity of measures used: School food environment/fruits, vegetables and salads: Not reported however objective measures for implementation outcome assessment were used. School food environment/à la carte: Not reported however objective measures for implementation outcome assessment were used. Outcome relating to staff knowledge, skills or attitudes: Not reported. Outcome relating to cost: Not reported. Outcome relating to adverse consequences: Not reported. Outcome relating to child diet, physical activity or weight status: Student‐level fruit and vegetable intake and food choices. Data collection method: Student self‐report survey and 24‐hour recalls. Validity of measures: 24‐hour recalls – not reported. Student survey: Fruit and vegetable component of survey has been validated. Provides a reference to where the psychometric properties of the measure have been described: Survey development for assessing correlates of young adolescents’ eating. |
|
| Notes |
Research funding: Supported by funding from the National Cancer Institute (5R01 CA71943‐03) and from the Minnesota Obesity Center. Conflicts of interest: Not reported. |
|
| Risk of bias | ||
| Bias | Authors' judgement | Support for judgement |
| Random sequence generation (selection bias) | Unclear risk | Schools were randomly allocated to experimental group. The random sequence generation procedure is not described. |
| Allocation concealment (selection bias) | Unclear risk | There is no information provided about allocation concealment and therefore it is unclear if allocation was concealed. |
| Blinding of participants and personnel (performance bias) All outcomes | High risk | Outcome group: All Given the nature of the intervention, participants and study personnel are likely to have been aware of study allocation and therefore high risk of performance bias. |
| Blinding of outcome assessment (detection bias) All outcomes | Unclear risk | Outcome group: School food environment/fruits, vegetables, and salads Unclear if evaluation staff conducting data abstractions, observations and recording were blind to group allocation. Outcome group: School food environment/à la carte Unclear if evaluation staff conducting data abstractions, observations and recording were blind to group allocation. |
| Incomplete outcome data (attrition bias) All outcomes | Low risk | Outcome group: School food environment/fruits, vegetables, and salads There was no attrition (16/16) and therefore risk of attrition bias is low. |
| Selective reporting (reporting bias) | Unclear risk | There is no study protocol therefore it is unclear if there was selective outcome reporting. |
Mathur 2016.
| Methods |
Trial name: Bihar School Teachers Study (BSTS). Study design: Cluster‐randomised controlled trial. Intervention duration: 7 months. Length of follow‐up from baseline: The study was conducted in two waves over two consecutive academic years (2009‐2010 and 2010‐2011), each with 36 schools, 18 intervention and 18 control. Differences in baseline characteristics: The sociodemographic characteristics and tobacco use patterns were comparable among participants in the intervention and control groups. Unit of allocation: School. Unit of analysis: School personnel (with unit of analysis error). |
|
| Participants |
School type: Government rural and urban schools representing grade levels 8‐10 were selected. The assumption is made that this reflects high schools.
Region: 10 districts of Bihar in India which is situated in northeast India on the border with Nepal. Demographic/socioeconomic characteristics: The authors report the study was conducted in an area with fewer social and financial resources than much of India at the time of the study. In 2001, only 4% of Bihar households had tap drinking water (national average = 37%), and 10% had electricity as a source of lighting (56% nationwide). Inclusion/exclusion criteria: Inclusion ‐ At least 8 teachers. Exclusion ‐ School districts located in flood zones (because school closures would make intervention delivery unfeasible). Number of services allocated: 72 Numbers by trial group: n (controls baseline) = 36 n (controls follow‐up) = 36 n (interventions baseline) = 36 n (interventions follow‐up) = 36 Recruitment: 72/86 schools Recruitment rate: 84% schools Note. no sample sizes for children in enrolled schools given. |
|
| Interventions |
Number of experimental conditions: 2 (1 intervention, 1 control). Policies, practices or programs targeted by the intervention: The BSTS was initiated to test the efficacy of a comprehensive tobacco control program (known as the ‘Tobacco‐Free Teachers/Tobacco‐Free Society’ program (TFT/TFS)) in increasing tobacco use cessation among teachers and promoting the adoption and implementation of school tobacco policies. The TFT/TFS targeted teachers as they have been identified as a high‐priority audience for tobacco control efforts in India, because they serve as role models for students. Implementation strategies: EPOC: Local opinion leader ‐ Each Health educator was assigned a set of five to six schools in which to deliver the intervention, with assistance from a designated teacher at each school, termed as Lead Teacher (LT). The LT played the role of a liaison between the HE and other school personnel at his/her school and was nominated by their school principal according to guidelines provided (being a non‐user/quitter of tobacco, being respected among teachers, possessing good leadership qualities and having willingness to give personal time for the program). EPOC: Continuous quality improvement ‐ Health educators offered ongoing technical support for the lead teachers through monthly school visits, phone support, and a mid‐year meeting with lead teachers from other intervention schools. The intervention protocol specified that health educators would conduct 1 visit per month to each school, for a total of 6 visits over the 7 months of intervention delivery. During each visit, health educators met with the principal and lead teacher and conducted a group discussion with the teachers and other school personnel. The lead teacher also conducted 6 to 8 group discussions with the other teachers in the school, addressing the topic defined for that month. EPOC: Education materials ‐ Program materials. Schools were provided with supporting educational and programmatic materials including: (i) posters (one per theme); (ii) a calendar (displaying the monthly theme); (iii) a notice board to display materials; (iv) a suggestion box for the HE/LT to receive feedback/questions; and (v) self‐help quit booklets (a step‐by‐step guide to quitting, available for each teacher). EPOC: Education meeting ‐ Each school appointed a lead teacher, who was trained to facilitate the program on‐site during a 2‐day training provided by wave in a centralised location. Mid‐year refresher training was also provided Health education sessions. Health education sessions were conducted twice per month at each school in the format of group discussions and were centred on six topics (themes): (i) teachers as role models for tobacco control; (ii) health effects of tobacco; (iii) motivations to quit tobacco; (iv) skills to quit tobacco; (v) dealing with withdrawal symptoms; and (vi) maintaining abstinence from tobacco. The first session of each month was facilitated by the HE and the second session was facilitated by the LT 2 weeks later, with the HE present as an observer. These sessions were usually conducted during lunch‐breaks (to avoid interference with teaching schedules) and engaged both tobacco users as well as non‐users. In‐depth protocols were created to ensure standardisation of intervention delivery of both HE and LT sessions. Twelve sessions total were offered to each school. EPOC: Local consensus process ‐ A tobacco policy workgroup was also formed in every school, with the responsibility of regularly announcing the policy and monitoring its implementation in each school as a way to build organisational support for quitters by creating a tobacco‐free school campus. Theoretical underpinning: Social Contextual Model of Health Behavior Change. Description of control: Delayed intervention. |
|
| Outcomes |
Outcome relating to the implementation of school policies, practices or programs: ‐ Are any signs posted in your school warning that tobacco use is not allowed? ‐ The policy or rule is completely enforced Data collection method: School personnel survey. Validity of measures used: Not reported/self‐report methods. Outcome relating to staff knowledge, skills or attitudes: Not reported. Outcome relating to cost: Not reported. Outcome relating to adverse consequences: Not reported. Outcome relating to child diet, physical activity or weight status: Tobacco use. Data collection method: Policy observation checklist. Validity of measures used: Objective. |
|
| Notes |
Research funding: Supported by the National Cancer Institute at the National Institutes of Health (5R01CA120958, 5K05 A108663). Conflicts of interest: None declared. |
|
| Risk of bias | ||
| Bias | Authors' judgement | Support for judgement |
| Random sequence generation (selection bias) | Unclear risk | Cluster‐RCT. The random sequence generation is not described. |
| Allocation concealment (selection bias) | Unclear risk | There is no information provided about allocation concealment and therefore it is unclear if allocation was concealed. |
| Blinding of participants and personnel (performance bias) All outcomes | High risk | Outcome group: Policy observation checklist Due to the nature of the intervention, unlikely that schools would have been blinded and therefore at high risk of performance bias. Outcome group: School personnel survey Unlikely that school personnel would have been blinded and therefore at high risk of performance bias. |
| Blinding of outcome assessment (detection bias) All outcomes | High risk | Outcome group: Policy observation checklist There is no mention that project staff who made the observations were blinded to group allocation. Outcome group: School personnel survey School personnel reported data and therefore at high risk of detection bias. |
| Incomplete outcome data (attrition bias) All outcomes | Low risk | “756 of 947 eligible participants completed the baseline survey (80% response rate) and 684 completed the post intervention survey (72% response rate)". Attrition was relatively equal across experimental arms for the survey. |
| Selective reporting (reporting bias) | Low risk | There were no unreported implementation outcomes according to those planned in the published protocol. |
| Recruitment to cluster | Low risk | Recruitment bias: Individuals within each randomised cluster participated. |
| Baseline imbalance | Unclear risk | Baseline imbalance: Not reported |
| Loss of cluster | Low risk | Loss of clusters: There were no loss of clusters. |
| Incorrect analysis | High risk | Incorrect analysis: No adjustment for clustering within schools appears to have occurred. |
| Contamination | Low risk | Contamination: Unlikely due to a waiting‐list intervention design. |
| Compatibility with individually randomised RCTs | Unclear risk | Compatibility with individually randomised RCTs (cluster‐RCTs): Unable to determine. |
McCormick 1995.
| Methods |
Trial name: The North Carolina School Health and Tobacco Education Project (SHTEP)/Skills Management and Resistance Training (SMART). Study design: Cluster‐randomised controlled trial. Intervention duration: 4 years. Length of follow‐up from baseline: 4 years. Differences in baseline characteristics: Not reported. Unit of allocation: School district. Unit of analysis: School district and individual teachers. |
|
| Participants |
School type: Schools (junior or middle high schools).
Region: North Carolina, USA. Demographic/socioeconomic characteristics: Not reported. Inclusion/exclusion criteria: In order to be eligible for participation, a school district had to have at least two junior high or middle schools (51 of 140 school districts in North Carolina met this criteria). All teachers who were eligible to teach health. Number of schools allocated: ‐ 21 districts (11 intervention, 10 control). ‐ 69 teachers (51 intervention, 18 control). ‐ 42 schools. Numbers by trial group: n (controls baseline) = 10. n (controls follow‐up) = 10. n (interventions baseline) = 11. n (interventions follow‐up) = 11. Recruitment: School districts: 28 districts were randomly selected and a five‐stage strategy was used to recruit districts to the study. After a school district agreed to participate, it was randomly assigned to either the experimental or control condition, resulting in 11 experimental and 10 control districts. Schools: In both experimental and control school districts, two or more schools and two or more classrooms per school participated in the study. Teachers: All teachers in study districts identified by their schools as “eligible to teach health” were included in the sample. Students: Not reported. Recruitment rate: School districts: 21 school districts of 28 identified, therefore 75%. Schools: approximately 50 schools. Teachers at baseline 69/115 = 60%. Teachers at follow‐up 136/175 = 78%. Classrooms: approximately 100 classrooms. Students: Approximately 3000 students exposed to one of the tobacco prevention curricula. |
|
| Interventions |
Number of experimental conditions: 2 (1 intervention, 1 control). Policies, practices or programs targeted by the intervention: School health/tobacco prevention curricula (schools districts offered choice of three: Growing Healthy, Teenage Health Teaching Modules, Project SMART). Implementation strategies: EPOC: Educational meetings: ‐ Implementation intervention: In‐depth training for teachers and administrators on the use of the specific curriculum that had been adopted. EPOC: Educational materials: ‐ Schools were provided with curricular materials (schools chose the most suited of three options). EPOC: Local consensus processes: ‐ Signing of a Memorandum of Understanding: A Memorandum of Understanding, specifying which curriculum was adopted, how many lessons were to be taught, and how many classes would receive instruction, was signed by each district. Adoption intervention: Process consultation for adoption. A consultation workshop was conducted with each experimental district to inform school personnel about the 3 health curricula that were being disseminated Theoretical underpinning: Diffusion of innovation. Description of control: Districts in the control conditions were mailed curricula materials and provided technical assistance upon request, but did not receive the training sessions. |
|
| Outcomes |
Outcome relating to the implementation of school policies, practices or programs: ‐ % later implementation of curriculum for school district. ‐ Extent later implementation mean for school district (% of total curriculum activities taught). Data collection method: Each teacher who was eligible to teach health received an implementation check‐sheet and was asked to indicate which activities were taught. Data were also aggregated at school district level. Assessed at Year 4 follow‐up “later implementation”. A dichotomous measure of implementation (i.e., yes/no) necessary but not sufficient to assess the implementation of a school health curriculum. Therefore, Implementation checksheets were also used to assess implementation as the percentage of total curriculum activities that were taught (extent of implementation). Validity of measures used: Not reported/self‐report methods. Outcome relating to staff knowledge, skills or attitudes: Yes. Data collection method: 13‐item measure of awareness and concern among teachers and administrators about tobacco use among students. Validity of measure: Validity is not reported although the authors report the instrument is described elsewhere. Outcome relating to cost: Not reported. Outcome relating to adverse consequences: Not reported. Outcome relating to child diet, physical activity or weight status: Not reported. |
|
| Notes |
Research funding: Supported by funding from the National Cancer Institute (#5 R01 CA 459907‐02). Conflicts of interest: Not reported. |
|
| Risk of bias | ||
| Bias | Authors' judgement | Support for judgement |
| Random sequence generation (selection bias) | Unclear risk | The random sequence generation procedure is not described. |
| Allocation concealment (selection bias) | Unclear risk | There is no information provided about allocation concealment and therefore it is unclear if allocation was concealed. |
| Blinding of participants and personnel (performance bias) All outcomes | High risk | Outcome group: All Given the nature of the intervention, participants and study personnel are likely to have been aware of study allocation and therefore high risk of performance bias. |
| Blinding of outcome assessment (detection bias) All outcomes | High risk | Outcome group: All All outcomes subjective, self‐report. There is no mention of blinding of participants and personnel. Teachers completed check sheets that assessed their delivery of curricula activities and researchers conducted site visits at implementing schools. High risk of performance bias as the implementation outcomes likely to be influenced by knowledge of group allocation. |
| Incomplete outcome data (attrition bias) All outcomes | High risk | Outcome group: Organisational climate The implementation measures represent cross‐sectional assessments. There was low attrition as only one experimental and one control district dropped out of the study. (Low risk of bias). Outcome group: Organisational size Organisational size represented the total student enrolment for each school district and was obtained from North Carolina Department of Public Instruction records. The smallest district had 4134 students and the largest district had 29,532 students.” Intervention = 9 districts (82%) Control = 7 districts (70%) Imbalance across intervention and control district response. (High risk of bias). Outcome group: Time of adoption Time of adoption ranged from 9.57 to 19.86 weeks. Intervention = 8 districts (73%) Control = 7 districts (70%) (High risk of bias). Outcome group: Awareness ‐ concern ‐ interest The response rate for teacher’s Awareness and interest was 69% (n = 432), and for concern was 52% (n = 324). Insufficient reporting of attrition/exclusions to permit judgement of 'Low risk' or 'High risk' (e.g. no reasons for missing data provided). (Unclear risk of bias). Outcome group: Level of Use ‐ District Of the 570 Level of Use instruments sent to teachers, 252 were returned and completed, for a response rate of 44% (n = 252). Only the Level of Use instruments for School Health and Tobacco Education Project curricula were analysed (n = 71). Intervention = 9 districts (82%) Control = 7 districts (70%) Imbalance across intervention and control district response. (High risk of bias). Outcome group: Level of Use ‐ Teacher Of the 570 Level of Use instruments sent to teachers, 252 were returned and completed, for a response rate of 44% (n = 252). Only the Level of Use instruments for School Health and Tobacco Education Project curricula were analysed (n = 71).” Intervention = 52 teachers Control = 20 teachers Insufficient reporting of attrition/exclusions to permit judgement of 'Low risk' or 'High risk' (e.g. no reasons for missing data provided). (Unclear risk of bias). Outcome group: Implementation Checklist ‐ District Initial Implementation Intervention = 8 districts (73%) Control = 6 districts (60%) Later Implementation Intervention = 8 districts (73%) Control = 6 districts (60%) Imbalance across intervention and control district response. (High risk of bias). Outcome group: Implementation Checklist ‐Teachers During year three 115 Implementation Checksheets were sent to teachers and 69 were returned (60%). Later implementation was measured in year four of the project. During this year, 136 of 175 (78%) Implementation Checksheets were returned. Insufficient reporting of attrition/exclusions to permit judgement of 'Low risk' or 'High risk' (no reasons for missing data provided). (Unclear risk of bias). |
| Selective reporting (reporting bias) | Unclear risk | There is no study protocol therefore it is unclear if there was selective outcome reporting. |
| Recruitment to cluster | Unclear risk | District selected which two middle or junior high schools participated. |
| Baseline imbalance | Low risk | Districts randomised to condition. |
| Loss of cluster | Low risk | Small loss of clusters (1 experimental, 1 control) and equal drop out across conditions. |
| Incorrect analysis | High risk | No adjustment for clustering reported in analysis. |
| Contamination | Low risk | Low risk of contamination as districts randomised to condition. |
| Compatibility with individually randomised RCTs | Unclear risk | Unable to determine if a herd effect exists. |
Mobley 2012.
| Methods |
Trial name: HEALTHY. Study design: Randomised controlled trial for implementation outcome. Intervention duration: Approx. 3 ½ years (Fall 2006 ‐ Spring 2009). Length of follow‐up from baseline: Approx. 3 ½ years. Differences in baseline characteristics: Stated as similar but not shown. Unit of allocation: Schools. Unit of analysis: Schools. |
|
| Participants |
School type: Schools (middle). Region: 10 school districts located at 7 sites across the USA. Demographic/socioeconomic characteristics: Schools were serving largely minority and lower income populations. Inclusion criteria: ‐ The student body is representative of the adolescent population at risk for type 2 diabetes, defined as either at least 50% minority (African American, Hispanic/Latino and/or American Indian) and/or greater than 50% eligible for free or reduced lunch. ‐ Annual student attrition from all causes is ≤ 25%. ‐ Expected cohort size at end of study is at least 50 per school. ‐ School authorities are willing to accept randomisation of an individual school to intervention or control. If a school is assigned to the intervention program, this means that the school must arrange tasks/requirements needed to comply with the trial protocol. ‐ School authorities permit grade‐wide collection of height, weight, gender, age and race/ethnicity at baseline. ‐ The school assists with mass mailings of study materials to students’ homes. ‐ The school district possesses or obtains Federal Wide Assurance (FWA) to conduct research. ‐ Appropriate school authorities agree to adhere to the protocol. Number of schools allocated: 42 (21 intervention, 21 control). Numbers by trial group: n (controls baseline) = 21. n (controls follow‐up) = 21. n (interventions baseline) = 21. n (interventions follow‐up) = 21. Recruitment: ‐ Each site recruited 6 middle schools that were randomised into intervention or control. ‐ Students provided parental informed consent. Recruitment rate: Not reported. |
|
| Interventions |
Number of experimental conditions: 2 (1 intervention, 1 control). Policies, practices or programs targeted by the intervention: The following nutritional goals were set for the NSLP (National School Lunch Program), SBP (School Breakfast Program) and à la carte school food services: ‐ Lower the average fat content of food served in schools. ‐ Serve at least 2 servings of fruit and/or vegetables per student on NSLP (National School Lunch Program) and at least 1 serving per student on SBP (School Breakfast Program) each day. ‐ Serve all dessert and snack foods with ≤ 200 kcal per single size serving and/or package. ‐ Eliminate milk >1% fat, all other added sugar beverages, and 100% fruit juice (100% fruit juice may only be served as ≤ 6 ounces as part of SBP). ‐ Serve at least 2 servings of high fibre (≥2 g of fibre per serving) grain‐based foods and/or legumes per student on NSLP and at least 1 serving per student on SBP each day. Implementation strategies: EPOC: Educational meetings: ‐ Provision of staff training (Food Services Manager and staff). ‐ Educational events held during lunchtime in and around the cafeteria. EPOC: Educational games: ‐ Conducted 'taste tests' of new products and unfamiliar foods, including conducting comparison of available items. EPOC: External funding: ‐ Intervention schools received $3000 per year to defray expenses and potential loss of income and received $125 for cafeteria enhancements, and to attend training. EPOC: Tailored intervention: ‐ Research staff worked with food service managers to identify barriers and develop solutions for schools to achieve selected goals. EPOC: Educational materials: ‐ Curricula, posters, brief messages displayed near serving lines. EPOC: Educational outreach: ‐ Research staff met weekly with food service managers to observe the food environment and too plan and support goal achievement. EPOC: The use of information and communication technology: ‐ Engagement with social marketing experts to generate content and offer guidance on the school social marketing efforts. EPOC: Other: ‐ Intervention launch and finale; these events were designed to promote global awareness for the program at participating schools. Family outreach including delivery of newsletters and materials. ‐ Meetings with district level staff and buyers who procure food and with food distributors, to solicit support for change. Theoretical underpinning: Social‐ecological models Description of control: Control school followed existing school district standards and guidelines. |
|
| Outcomes |
Outcome relating to the implementation of school policies, practices or programs: 12 scores across the following variables: ‐ Lower than average fat content ‐ Serve 2 servings of fruit and vegetables ‐ Serve all desert and snack foods with < 200 kcal ‐ Eliminate milk >1% fat ‐ Serve at least 2 servings of high fibre Data collection method: ‐ Data collected by trained staff not involved in the intervention. ‐ Nutrition data were extracted from food service management source documents maintained by school food service personnel. ‐ Average food group servings and nutrient amounts served per day were calculated by the trained program staff using the food service staff records. Validity of measure: Not reported however the measures used were objective. Outcome relating to staff knowledge, skills or attitudes: Not reported. Outcome relating to cost: Yes. Data collection method: By income statements, federal meal records and sales data. Validity of measure: Not reported. Outcome relating to adverse consequences: Adverse impact on scholastic performance. Data collection method: State accountability tests and the total number and passing rates of students taking the test. Grade and school level data were recorded—no individual student data were collected. Validity of measures used: Not reported. Outcome relating to child diet, physical activity or weight status: Assessed self‐reported dietary intake (energy, macronutrient, and grams consumed of selected food groups). Height, waist circumference and BMI. Data collection method: Dietary intake: Block Kids Questionnaire Anthropometry: Height (Perspective Enterprises PE‐AIM‐101 stadiometer) and weight (SECA Alpha 882 and SECA Large Capacity 634 electronic scales) were measured without shoes. Waist circumference was taken using a tape measure on bare skin measured just above the iliac crest Validity of measure: Dietary intake: Not reported. Anthropometry: Valid. |
|
| Notes |
Notes: This trial also contained a PA component as part of their policy, practice or programs implemented however, the trial was downgraded to a nutrition trial only as it did not report implementation outcomes for PA. Research funding: Supported by funding from the National Institute of Diabetes and Digestive and Kidney Diseases and the National Institute of Health grant numbers U01‐DK61230, U01‐DK61249, U01‐DK61231, and U01‐DK61223 to the STOPP‐T2D collaborative group Conflicts of interest: One author received consulting fees from McDonald’s Global Advisory Committee and another received consulting fees from General Mills and ConAgra Foods. The remaining authors declared no conflict of interest. |
|
| Risk of bias | ||
| Bias | Authors' judgement | Support for judgement |
| Random sequence generation (selection bias) | Unclear risk | Schools were randomly allocated to experimental group. The random sequence generation procedure is not described. |
| Allocation concealment (selection bias) | Unclear risk | There is no information provided about allocation concealment and therefore it is unclear if allocation was concealed. |
| Blinding of participants and personnel (performance bias) All outcomes | High risk | Outcome group: All. Given the nature of the intervention, participants and study personnel are likely to have been aware of study allocation and therefore high risk of performance bias. |
| Blinding of outcome assessment (detection bias) All outcomes | Low risk | Outcome group: à la carte, Nutrition goals, Food group servings. Data were collected at baseline and end of study by trained study staff not involved in implementing the intervention. |
| Incomplete outcome data (attrition bias) All outcomes | Low risk | Outcome group: All. All 42 schools were retained therefore risk of attrition bias is low. |
| Selective reporting (reporting bias) | Low risk | The protocol is available and the outcomes reported are consistent. |
Nathan 2012.
| Methods |
Trial name: Good for Kids. Good for Life. Study design: Non‐randomised. Intervention duration: 11‐15 months (duration of treatment). Length of follow‐up from baseline: Baseline; November 2006 ‐ April 2007, Follow‐up: October 2008 ‐ March 2009. Differences in baseline characteristics: No significant difference in the prevalence of vegetable and fruit breaks between intervention and comparison schools. Relative to comparison schools, intervention schools were more likely to be small, and located in rural and lower socioeconomic areas. Unit of allocation: Schools. Unit of analysis: Schools. |
|
| Participants |
School type: Schools (K‐6 and K‐12 central schools). Region: Hunter New England, New South Wales, Australia. Demographic/socioeconomic characteristics: Region: A demographically and socioeconomically diverse population of approximately 121 000 children aged 5–14 years (14% of the state population of 5–14 year olds). Sample: Schools were primarily government, urban and lower SES schools. Inclusion/exclusion criteria: Inclusion: ‐ All primary schools (children 5–12 years of age) and central schools (children 5–18 years of age) across the state were eligible for participation. Exclusion: ‐ Special purpose schools catering for students with special needs. ‐ Juvenile justice schools. ‐ Schools serving children who are hospitalised. Number of schools allocated: 828 (422 intervention, 406 control). Numbers by trial group: n (controls baseline) = 316. n (controls follow‐up) = 258. n (interventions baseline) = 407. n (interventions follow‐up) = 388. Recruitment: Principals of both groups of schools were sent a letter inviting them to participate in the study. Two weeks after receipt of the letter, Principals were telephoned by a trained research assistant who confirmed school eligibility, sought consent to participate and scheduled a time for a telephone interview. Recruitment rate: 96.4% of intervention schools and 77.8% of control schools consented to participate in the baseline data collection. |
|
| Interventions |
Number of experimental conditions: 2 (1 intervention, 1 control). Policies, practices or programs targeted by the intervention: ‐ The prevalence of vegetable and fruit breaks. Implementation strategies: EPOC: Local consensus processes: ‐ Consensus processes. EPOC: Local opinion leaders: ‐ Leadership support and endorsement. EPOC: Educational meetings: ‐ Staff training and professional development. EPOC: Educational materials: ‐ Program materials (curriculum resource and materials, information to parents) EPOC: Other: ‐ Incentives (material goods). EPOC: Tailored interventions: ‐ Follow‐up support. EPOC: Monitoring the performance of the delivery of the health care: ‐ Implementation feedback (performance monitoring and feedback). Theoretical underpinning: A structured multi‐strategy intervention was developed based on theoretical frameworks of practice change and recommendations from reviews and implementation studies conducted in schools and other settings. Description of control: Comparison schools were not offered the multi‐strategy intervention described above, but were offered access to information‐based support provided by a non‐government organization. Information regarding the program was provided to schools via a website, newsletters and events. If a school chose to register for the program, teaching resource materials were forwarded to the school, with schools able to receive e‐mail and telephone information‐based support if desired. If the school provided evidence of having adopted the program, they were eligible to be 'certified' as such and to receive additional resource materials and obtain access to ongoing e‐mail and telephone support. In some areas of the state, schools could access additional support provided at the discretion of local health promotion teams. |
|
| Outcomes |
Outcome relating to the implementation of childcare service policies, practices or programs: ‐ Prevalence of fruit and vegetable breaks. Data collection method: Principal reported computer‐assisted telephone interviewing (CATI). Validity of measures used: Self‐report however method has been validated. The accuracy of Principal‐reported implementation of vegetable and fruit breaks in schools was assessed in a convenience sample of intervention schools (n = 42; 10%). Based on observations made in these schools over a 9‐week period, pre‐service teachers located in schools reported in a pen‐paper survey if classes at the school had specific breaks or if students had permission to eat vegetables and/or fruit during class time ('yes all classes', 'yes some classes', 'no classes', 'don’t know'). The pre‐service teacher surveys were completed within one month of the Principal telephone survey. Comparison of Principal and pre‐service teacher report of vegetable and fruit breaks revealed perfect agreement (Kappa = 1.0). Outcome relating to staff knowledge, skills or attitudes: Not reported. Outcome relating to cost: Not reported. Outcome relating to adverse consequences: Not reported. Outcome relating to child diet, physical activity or weight status: Not reported. |
|
| Notes |
Research funding: Supported by funding from the New South Wales Health ASSIST program. The project also received infrastructure support from the Hunter Medical Research Institute (HMRI) and Hunter New England Population Health. Conflicts of interest: Authors report no conflict of interest. |
|
| Risk of bias | ||
| Bias | Authors' judgement | Support for judgement |
| Random sequence generation (selection bias) | High risk | Non‐randomised trial. High risk of selection bias as intervention services were recruited from a selected area and control services from a comparison region. |
| Allocation concealment (selection bias) | High risk | Non‐randomised trial. Intervention services were recruited from a selected area, therefore high risk of selection bias as no concealment of allocation. |
| Blinding of participants and personnel (performance bias) All outcomes | High risk | Outcome group: All due to nature of the intervention, school staff and study personnel delivering the intervention were not blind to study allocation. |
| Blinding of outcome assessment (detection bias) All outcomes | High risk | Outcome group: Prevalence of vegetable and fruit breaks No blinding of outcome assessment and the outcome measurement is likely to be influenced by lack of blinding, self‐report considered high risk. |
| Incomplete outcome data (attrition bias) All outcomes | Low risk | Outcome group: Although differential response rate for intervention vs. comparison schools at baseline and follow‐up (96.4% vs. 77.8% and 95.3% and 81.6%, respectively) appropriate analyses to address this were conducted. All schools lost to follow‐up were included in the GEE model (using last value carried forward method). |
| Selective reporting (reporting bias) | Unclear risk | There is no study protocol therefore it is unclear if there was selective outcome reporting. |
| Potential confounding | High risk | Baseline differences in intervention and control schools not adjusted for in analysis. Relative to comparison schools, intervention schools were more likely to be small, and located in rural and lower socioeconomic areas. |
Nathan 2016.
| Methods |
Trial name: No trial name. Study design: Randomised controlled trial. Intervention duration: 9 months. Length of follow‐up from baseline: Outcome data were collected at baseline (May–July 2014) and follow‐up (May–July 2015) Differences in baseline characteristics: There were no significant differences between groups in school characteristics or menu composition at baseline. Unit of allocation: Schools. Unit of analysis: Schools. |
|
| Participants |
School type: Primary schools. Region: Government and Catholic schools located in the Hunter New England (HNE) Local Health District in New South Wales (NSW), Australia. Demographic/socioeconomic characteristics: The HNE region covers a large non‐metropolitan area (more than 130,000 km2); with a demographically and socioeconomically diverse population of children aged 5 to 12 years. Inclusion/exclusion criteria: Inclusion: ‐ Located within HNE region Australia ‐ Primary schools Exclusion: ‐ Independent schools ‐ Having secondary students (including central schools i.e. enrolling students from Kindergarten to Grade 12) ‐ Those exclusively catering for children requiring specialist care ‐ Not having a canteen that operated at least once per week ‐ Schools participating in another canteen intervention study ‐ Schools identified by the NSW government as a high performing health‐promoting school in terms of implementing nutrition (including canteens) and physical activity policies and practices Number of schools allocated: 53 Numbers by trial group: n (controls baseline) = 25 n (controls follow‐up) = 24 n (interventions baseline) = 28 n (interventions follow‐up) = 27 Recruitment: Sixty‐eight schools were randomised prior to baseline data collection and approached to participate in the study of which 61 schools agreed. Recruitment rate: 89.7 % however some schools were later found to be ineligible. |
|
| Interventions |
Number of experimental conditions: 2 (1 intervention, 1 control). Policies, practices or programs targeted by the intervention: The NSW state government had introduced a healthy school canteen policy (“Fresh Tastes @ School”). Utilising a ‘traffic light’ food classification system, the policy classifies foods and beverages sold in school canteens (whether that be pre‐packaged foods or those made on site by canteen staff ) as either ‘red’, ‘amber’ or ‘green’ based on their nutritional content. For all foods sold in the canteen at recess and lunch the policy requires schools to remove all red foods from regular sale and to fill the menu (that is more than 50%) with green foods and to not let amber foods dominate the menu. This study was designed assess the effectiveness of a multi‐strategy implementation intervention in increasing the implementation of the healthy canteen policy in Australian primary schools. Implementation strategies: EPOC: Audit and feedback ‐ Performance monitoring and feedback. During the workshop, schools were provided with a written feedback report on their previously supplied canteen menu. The feedback report identified the included foods and beverages that were red/banned, amber or green and the proportion of the menu contributed by each category. Red/banned food items in the report were advised to be removed, with alternatives, where possible, identified. Where amber foods dominated the menu (> 50 %), green alternative food items were recommended. The feedback report included a sample ‘compliant’ menu, individually tailored using the schools baseline menu. EPOC: Continuous quality improvement ‐ Canteen managers were asked to send an updated version of the menu for review and a second feedback report was generated EPOC: Education materials ‐ Tools and resources Canteen managers were provided with a ‘Canteen Resource Kit’ containing various printed and electronic instructional materials, including electronic menu and pricing templates, and a poster‐sized checklist that prompted canteen managers to regularly review their canteen practices relating to Fresh Tastes @ School. EPOC: Education meeting ‐ Canteen manager/parent training‐ A 1 day (5 hour) group‐training workshop was offered to canteen managers and parent representatives providing education and skill development in the Fresh Tastes @ School policy, label reading, canteen stock and financial management, pricing and promotion, and change management. Dietitians, experienced in delivering training to canteen managers, conducted the training. If a school canteen manager was unable to attend the workshop, they were telephoned and offered a 30–45 minute teleconference call or a face‐to‐face meeting with a dietitian to discuss workshop content and resources. EPOC: Local consensus process ‐ The workshop provided opportunities for canteen managers to participate in consensus processes through the development of a canteen action plan identifying how they would implement Fresh Tastes @ School in their school. EPOC: Local opinion leader ‐ Executive support‐ School principals were telephoned to inform them of the training and resources available to their school canteen and asked to demonstrate their support for implementation of the Fresh Tastes @ School policy by encouraging the canteen manager and a parent representative to attend canteen manager training and for receipt of ongoing support. EPOC: Tailored intervention ‐ The feedback report included a sample ‘compliant’ menu, individually tailored using the schools EPOC: Other ‐ Following training, canteen managers received two support contacts per school term via text messages. Framed by the TDF these contacts provided targeted advice to overcome common barriers to policy implementation and encouraged canteen managers to review progress against their action plan. Canteen managers who requested additional support were contacted by a project officer after the workshop and provided tailored advice. ‐ Recognition: Schools with a menu assessed as adhering to the policy (i.e. greater than 50 % green items and no red or banned items) received a congratulatory letter from the research team, and provided a positive feedback article they could include in their school newsletter. ‐ Canteen managers who attended the workshop also received kitchen equipment to the value of AUD$100. Theoretical underpinning: Theoretical Domains Framework. Description of control: Comparison schools were not offered the multi‐strategy intervention described above. |
|
| Outcomes |
Outcome relating to the implementation of school service policies, practices or programs: ‐ The proportion of schools with a canteen menu that did not include red or banned foods and beverages. ‐ The proportion of schools where green items make up the majority of the menu defined as more than 50 % of listed menu items. Data collection method: Audits of canteen menus faxed or emailed to the project team by the school. Validity of method: Objective and reported as valid. Authors report the method has previously been validated with a cross‐sectional study in 38 schools that compared menu analysis using assumptions to an observational audit (the criterion standard). Outcome relating to staff knowledge, skills or attitudes: Not reported. Outcome relating to cost: Not reported. Outcome relating to adverse consequences: Not reported. Outcome relating to child diet, physical activity or weight status: Not reported. |
|
| Notes |
Research funding: Supported by funding received from the New South Wales Healthy Children’s Initiative. The project also received infrastructure support from the Hunter Medical Research Institute (HMRI) and Hunter New England Population Health. Conflicts of interest: Authors report no conflict of interest. |
|
| Risk of bias | ||
| Bias | Authors' judgement | Support for judgement |
| Random sequence generation (selection bias) | Low risk | Randomised controlled trial. The random sequence was generated using a computerised random number function in Microsoft Excel. |
| Allocation concealment (selection bias) | Unclear risk | Group allocation was concealed from staff involved in school recruitment, however there is no information about how allocation was concealed. |
| Blinding of participants and personnel (performance bias) All outcomes | High risk | Outcome group: Schools were not blinded to group allocation and therefore at high risk of performance bias. |
| Blinding of outcome assessment (detection bias) All outcomes | Low risk | Outcome group: Dietitians conducting menu assessments were blinded to group allocation. |
| Incomplete outcome data (attrition bias) All outcomes | Low risk | Outcome group: Only one school was lost to follow‐up. |
| Selective reporting (reporting bias) | Low risk | The trial was prospectively registered with the Australian New Zealand Clinical Trials Registry (ACTRN12614001148662). All predetermined outcomes were reported. |
Naylor 2006.
| Methods |
Trial name: Action Schools! British Columbia (BC). Study design: Cluster‐randomised controlled trial. Intervention duration: 11 months. Length of follow‐up from baseline: 16 months. Differences in baseline characteristics: Not reported. Unit of allocation: Schools. Unit of analysis: Teachers/classes. |
|
| Participants |
Region: British Columbia, Canada. Demographic/socioeconomic characteristics: A broad socioeconomic and cultural spectrum. Inclusion criteria: ‐ Elementary schools from two British Colombia school districts that were ranked 'low' in terms of current implementation of physical activity initiatives. Number of schools allocated: 10 randomised, stratified by size (< 300 or > 300 students) and geographic location to: 3 intervention (Champion schools (CS)), 4 intervention (Liaison schools (LS)), 3 controls (usual practice schools (UP)). Numbers by trial group: n (controls baseline) = 3 services. n (controls follow‐up) = 3 services. n (interventions baseline) = 7 services (4 LS, 3CS). n (interventions follow‐up) = 7 services (4LS, 3 CS). Teachers: 42 grade 3 and 4 teachers. 50 grade 5 and 6 teachers. Students: Not reported. Recruitment: School districts: We recruited elementary schools from two BC School Districts. Schools: We gave presentations at District principals’ meetings and from a pool of 103 schools, 20 schools (19%) volunteered to participate. To discriminate between schools who were already undertaking physical activity initiatives from those who were not, we used results from the 2002 BC Ministry of Education Satisfaction Survey which assessed parent and student satisfaction with current school PA on a 5‐point Likert scale (5 = very satisfied). From the pool of 20 volunteer schools, schools (n = 11) with satisfaction score that ranked 3 or lower were invited to participate. One principal withdrew his school (before randomisation) after determining there was a chance their school could be randomly selected as a control school. Students/Teacher: Grades 4—6 were included. Forty‐two (100%) Grades 4 and 5 teachers consented to participate in Phase I and 49 (98%) Grades 5 and 6 teachers consented to participate in Phase II (23 taught Grade 5 in both phases). We also recruited children in these grades to participate in an evaluation of multiple health outcomes. Recruitment rate: School districts: N/A. Schools: 19% of schools approached consented, 11/20 were eligible (55%), 10/11 consented. Classrooms: Forty‐two (100%) Grades 4 and 5 teachers consented to participate in Phase I and 49 (98%) Grades 5 and 6 teachers consented to participate in Phase II. Students: Not reported. |
|
| Interventions |
Number of experimental conditions: Three (2 intervention: LS and CS, 1 control: UP) Policies, practices or programs targeted by the intervention: The AS! BC model provided tools for schools and teachers to create individualised Action Plans that increased PA opportunities across Six Action Zones: ‐ School Environment ‐ Scheduled PE ‐ Classroom Action ‐ Family and Community ‐ Extra‐curricular ‐ School Spirit Implementation strategies: EPOC: Tailored interventions. ‐ The AS! BC model provided tools for schools and teachers to create individualised Action Plans that increased PA opportunities across six Action zones: 1) School Environment, 2) Scheduled PE, 3) Classroom action, 4) Family and Community, 5) Extra‐curricular and 6) School spirit. EPOC: Educational meetings. ‐ Teachers received teacher‐on‐call support to attend a Classroom Action training session (half‐day) from the AS! BC Support Team and School Facilitators and had access to further training on professional development days and by telephone consultation (on request). ‐ The AS! BC model provided generalist teachers with training and resources to operationalise their Action Plan with the ultimate goal of providing students with 150 minutes of moderate intensity PA per week. ‐ In the CS condition the School Facilitator for CS schools provided the initial training to the designated ‘champion’ teacher (a teacher willing to activate and support their colleagues). EPOC: Educational materials. ‐ Each teacher received a Planning Guide and a copy of the Action Pages ‐ The AS! BC model provided generalist teachers with training and resources to operationalise their Action Plan with the ultimate goal of providing students with 150 minutes of moderate intensity PA per week. EPOC: Other: ‐ Teachers received an Action Bin which remained in each teacher’s classroom and contained equipment and resources to facilitate Classroom Action activities. Resources were gender inclusive and designed for children at all skill levels. ‐ Also, Classroom Action Bins were enhanced with specific resources as requested. ‐ In the CS condition, Classroom Action Bins contained a basic set of resources. EPOC: Local consensus process: ‐ A school action team ‐ A committee of school stakeholders (e.g. interested intermediate grade teachers, administrators, parents, health, sport/recreation practitioners) that created and supported implementation of the Action Plan EPOC: Educational outreach meetings: ‐ In the LS condition, teachers had weekly contact with the School Facilitator who would come to the classroom to provide mentorship and demonstrate activities. ‐ In the CS condition the School Facilitator for CS schools provided support to the designated ‘champion’ teacher (a teacher willing to activate and support their colleagues). Support was not provided to each classroom in the CS group Theoretical underpinning: Socioecological. Description of control: Usual practice schools were control. In usual practice schools, teachers were asked to carry‐on with their typical delivery of PA and PE. |
|
| Outcomes |
Outcome relating to the implementation of school policies, practices or programs: ‐ Minutes per week of physical activity Data collection method: Teachers at Intervention schools were asked to complete weekly activity Logs during Phases I and II. Teachers recorded daily, the type, frequency and duration (minutes) of PA implemented in the classroom, in PE or in the other Action Zones. Activity Logs were collected monthly by the School Facilitators. Teachers at UP schools completed a modified version of the Activity Log. Validity of measures used: Not reported/self‐report methods. Outcome relating to staff knowledge, skills or attitudes: Not reported. Outcome relating to cost: Not reported. Outcome relating to adverse consequences: Not reported. Outcome relating to child diet, physical activity or weight status: Physical activity of step count, fitness and physical activity score as well as anthropometry (BMI). Data collection method: Physical activity: All children wore a New Lifestyles Digiwalker SW‐200 pedometer and completed the physical activity questionnaire for children (PAQ‐C) Fitness: 20‐m shuttle run. Anthropometry: Standing height (without shoes) was measured to the nearest 1 mm (Seca stadiometer Model 242, Hanover, MD). Weight in light clothing was measured using an electronic scale (Seca Model 840, Hanover, MD) to the nearest 0.1 kg. Body mass index (BMI) was determined as weight (kg)/height (m)2. Validity of method: Physical activity: Paper reports pedometers are a valid objective measure of PA. Validity of PAQ‐C is not reported. Fitness: Objective. Anthropometry: Valid. |
|
| Notes |
Research funding: Supported by funding from the British Columbia Ministry of Health, 2010 Legacies Now, BC Ministry of Tourism, Sport and the Arts and the Provincial Health Services Authority. Conflicts of interest: Not reported. |
|
| Risk of bias | ||
| Bias | Authors' judgement | Support for judgement |
| Random sequence generation (selection bias) | Unclear risk | Schools were stratified by size and geographic location and randomly assigned to a Usual Practice or Intervention or Champion condition. The random sequence generation procedure is not described. |
| Allocation concealment (selection bias) | Unclear risk | There is no information provided about allocation concealment and therefore it is unclear if allocation was concealed. |
| Blinding of participants and personnel (performance bias) All outcomes | High risk | Outcome group: All. Given the nature of the intervention, participants and study personnel are likely to have been aware of study allocation and therefore high risk of performance bias. |
| Blinding of outcome assessment (detection bias) All outcomes | High risk | Outcome group: All. All self‐reported outcomes and no blinding of outcome assessment and the outcome measurement is likely to be influenced by lack of blinding. |
| Incomplete outcome data (attrition bias) All outcomes | Unclear risk | Outcome group: Physical activity delivered. There is insufficient information to determine missing data for teacher response rates and intervention fidelity. |
| Selective reporting (reporting bias) | Low risk | Pre‐specified outcomes appear to be covered. |
| Recruitment to cluster | Low risk | Randomisation post‐recruitment. |
| Baseline imbalance | Unclear risk | Baseline characteristics by group not reported. |
| Loss of cluster | Low risk | No loss of clusters. |
| Incorrect analysis | Low risk | Clustering has been taken into account. |
| Contamination | Low risk | Low risk due to design. |
| Compatibility with individually randomised RCTs | Unclear risk | Unable to determine if a herd effect exists. |
Perry 1997.
| Methods |
Trial name: Child and Adolescent Trial for Cardiovascular Health (CATCH). Study design: Cluster‐randomised controlled trial. Intervention duration: 3 years 1991‐1994. Length of follow‐up from baseline: Follow‐up of the schools and students took place in the Spring of 1992, 1993, and 1994. Differences in baseline characteristics: Schools: Among the 96 schools measured at baseline, there were no significant differences between the study conditions for all relevant variables, insuring equivalency between groups. All 96 schools maintained their participation in their allocated treatment condition over the 3‐year study period. Students: There were no significant differences by site, gender, or ethnic group between those who did and did not participate. Unit of allocation: Schools. Unit of analysis: Classrooms and schools. |
|
| Participants |
School type: Schools (elementary).
Region: CATCH was implemented in four study centres: San Diego, CA; New Orleans, LA; Minneapolis, MN; and Austin, TX, USA. Demographic/socioeconomic characteristics: Students were from ethnically diverse backgrounds and from geographically diverse areas. Inclusion/exclusion criteria: Inclusion of schools: ‐ Distance from one of the four study centres. ‐ Ethnic diversity. ‐ Food service characteristics (potential for intervention). ‐ Commitment to offering at least 90 minutes of PE per week. ‐ Commitment to participating in a 3‐year study. ‐ Cooperation with random assignment. Inclusion of students: ‐ In 3rd grade at beginning of trial. ‐ Parents and students agreed to provide a blood sample at baseline. Number of schools allocated: 96 from 12 districts. Numbers by trial group: n (controls baseline) = 40. n (controls follow‐up) = 40. n (interventions baseline) = 56. n (interventions follow‐up) = 56. The intervention schools were further randomised into two equal subgroups: n School‐based only (baseline) = 28. n School‐ and family‐based (baseline) = 28. n School‐based only (follow‐up) = 28. n School‐ and family‐based (follow‐up) = 28. Recruitment: School district superintendents received a letter describing the project and inviting their school district to participate in the study beginning in Fall 1991. While the recruitment process differed somewhat among sites the next step usually involved a personal meeting between a school district representative (for example superintendent, curriculum specialist or other district level person) and the principal investigator and sit intervention coordinator. After the initial meeting the necessary decision‐making procedures were followed for each school district indicating interest in participating in CATCH. School districts: Of the 15 school districts initially contacted among the four sites, 12 chose to participate in the study. In Louisiana, two of six school districts declined due to teacher strikes. In Minnesota one district declined due to competing district‐wide commitments. Schools: Following recruitment of districts schools within districts were contacted. Students: Not reported. Recruitment rate: School districts: 12/15. Schools: Of the 162 schools contacted 96 agreed to participate (59.3%) recruitment rate. Student: Total baseline 5106 (60.4%). |
|
| Interventions |
Number of experimental conditions: 3 (2 intervention: 1 control) The schools were randomised to either intervention (56 schools; 14 per field centre) or control status (40 schools; 10 per field centre). Randomisation occurred after all baseline measurements were completed. The intervention schools were further randomised into two equal subgroups: one group received a school‐based program consisting of school food service modifications, physical education, and the CATCH curricula (28 schools; seven per field centre); the other group received the same school‐based program plus a family‐based program (28 schools; seven per field centre). Policies, practices or programs targeted by the intervention: School level: 1. EATSMART: ‐ To reduce the total fat content of food served to 30%. ‐ To reduce the total sodium content to 600 mg ‐ 1000 mg per serving. ‐ Recommendations to lower the total cholesterol in foods offered. 2. CATCH PE: ‐ increase the amount of PE time that students spent in MVPA to 40% of class time. Implementation strategies EPOC: Educational meetings: ‐ Staff received training sessions to deliver EATSMART and CATCH PE. EPOC: Educational outreach visits: ‐ Staff received ongoing support visits to implement EATSMART/CATCH PE. EPOC: Educational materials: ‐ Educational materials were provided to staff/schools for EATSMART and CATCH PE. ‐ Smart choices manual was provided to all schools. EPOC: Other: ‐ Families were engaged by Family Fun Nights and home curricula Theoretical underpinning: Social Learning Theory and Organisational Change. Description of control: The control group received their usual health curricula, physical education, and food service programs, but none of the CATCH interventions. |
|
| Outcomes |
Outcome relating to the implementation of school service policies, practices or programs: ‐ Mean % of kilocalories from fat in lunches ‐ Mean mg of sodium in lunches ‐ Cholesterol mg in lunches (mean) ‐ Quality of PE lesson % of 7 activities observed Data collection method: Nutrient content of school lunches: Nutrient content of school lunches: Five consecutive, non‐ randomly selected days of school menu, recipe, and vendor product information were collected from each intervention and control school. School food service managers were instructed by trained and certified CATCH evaluation staff to keep a written record of lunch menus as well as the portions served each day. At the end of the 5‐day, CATCH evaluation, staff conducted in‐person interviews with the managers and cooks about the menus and recipes using standardised probes for ingredients and preparation methods. Nutrient and ingredient information for vendor products (i.e. foods purchased pre‐prepared) were collected from the food companies. Data entry and nutrient calculations for school menu data at each interval were performed using the Minnesota Nutrition Data System (NDS) Version 2.2. Quality of PE lesson: Direct observation. Validity of measures used: Nutrient content of school lunches: Not reported (measures not objective). Quality of PE lesson: Not reported however the measure used is objective. Outcome relating to staff knowledge, skills or attitudes: Not reported. Outcome relating to cost: Not reported. Outcome relating to adverse consequences: Growth and nutritional quality of the school meals. Data collection method: Measurements of height and nutrient intake as described in implementation outcomes were collected. Validity of measures used: Not reported. Outcome relating to child diet, physical activity or weight status: 1) child diet 2) physical activity 3) anthropometry. Data collection method: Child diet: A 24‐Hour Dietary Recall measured total daily food and nutrient intake in a random sub‐sample of 30 students per school at both baseline and follow‐up. A non‐quantified food record was completed by students on the previous day and was used as a prompt for the interviewer who conducted the 24‐hour recall. The data were directly entered into a laptop computer during the interview and the NCC database was used for evaluation. Self‐reported child physical activity: The Self‐Administered Physical Activity Checklist (SAPAC). Fitness: 9‐minute distance run. Fitness other: SOFIT. Height, weight, and triceps and subscapular skin‐folds: Were measured using the Stadiometer, a balance scale, and Lange callipers, respectively. Skinfold thickness was measured three times at each site, with intra‐class correlation coefficients exceeding 0.97. Height was measured to the nearest 0.1 cm, weight to the nearest 0.1 kg, and the skin‐folds to the nearest mm. Body mass index (BMI) is defined as weight (kg)/by height (m)2. Validity of measures used: Child diet: This method has previously been shown to be reliable and valid. Self‐reported child physical activity: Validated. Fitness: Objective. Fitness other: Objective. Child physical activity: Validated. Anthropometry: Objective. |
|
| Notes |
Note: This study targeted PA, nutrition and tobacco however, implementation outcomes for tobacco were unavailable and as such, this trial is reported as a nutrition and PA only trial, with their corresponding implementation outcomes and strategies only reported. Research funding: Supported by funding from the National Heart, Lung and Blood Institute (U01HL 33927, UOI HL 39852, UOI HL 39870, UOI HL 33906, UOI HL 39880). Conflicts of interest: Not reported. |
|
| Risk of bias | ||
| Bias | Authors' judgement | Support for judgement |
| Random sequence generation (selection bias) | Unclear risk | Schools were randomly allocated to experimental group. The random sequence generation procedure is not described. |
| Allocation concealment (selection bias) | Unclear risk | There is no information provided about allocation concealment and therefore it is unclear if allocation was concealed. |
| Blinding of participants and personnel (performance bias) All outcomes | High risk | Outcome group: There is no blinding to group allocation of participants or personnel described and this is likely to influence performance. |
| Blinding of outcome assessment (detection bias) All outcomes | High risk | Outcome group: There is no mention that observers were blinded to group allocation and therefore the risk of detection bias is high. |
| Incomplete outcome data (attrition bias) All outcomes | Low risk | Outcome group: None of the schools dropped out or refused to participate in the intervention activities. |
| Selective reporting (reporting bias) | Unclear risk | There is no study protocol, therefore it is unclear if there was selective outcome reporting. |
| Recruitment to cluster | Low risk | Individuals within each randomised cluster participated. |
| Baseline imbalance | Low risk | Schools were randomly allocated to condition and so risk of baseline imbalance is low. |
| Loss of cluster | Low risk | None of the schools dropped out or refused to participate in the intervention activities. |
| Incorrect analysis | Low risk | The analysis appeared appropriate. |
| Contamination | Low risk | The unit of randomisation was the school and so risk of contamination is low. |
| Compatibility with individually randomised RCTs | Unclear risk | Unable to determine if a herd effect exists. |
Perry 2004.
| Methods |
Trial name: Cafeteria Power Plus project. Study design: Cluster‐randomised controlled trial. Intervention duration: The intervention took place during 2 consecutive school years beginning in Fall 2000. Length of follow‐up from baseline: 2 years. Differences in baseline characteristics: Not reported. Unit of allocation: Schools. Unit of analysis: Lunchroom observations. |
|
| Participants |
School type: Schools (elementary). Region: Twin Cities metropolitan area of Minnesota USA. Demographic/socioeconomic characteristics: The 26 schools had an enrolment that was 90% white and 21% of the school meals served were free or reduced price. Inclusion/exclusion criteria: Not reported. Number of schools allocated: 26. Numbers by trial group: n (controls baseline) = 13. n (controls follow‐up) = 13. n (interventions baseline) = 13. n (interventions follow‐up) = 13. Recruitment: Not reported. Recruitment rate: Schools: Not reported. Children: 91.7%. Of the 1820 students who were eligible to be observed in Spring 2000, 1668 were observed and became the baseline sample. Of the 1820 students, 41 had moved, 7 parents and 44 students refused participation, and 60 students were absent. |
|
| Interventions |
Number of experimental conditions: 2 (1 intervention, 1 control). Policies, practices or programs targeted by the intervention: ‐ Increasing the availability, appeal, and encouragement of fruits and vegetables in the school lunch program; emphasizing changes in the lunch line; and, secondarily, the school snack cart. ‐ Increase the quality and quantity of fruits and vegetables served. ‐ Increase the choices of fruits and vegetables in the lunch line, to make them look more attractive (by putting them in small cups or arranging by colour), and to vary the type and preparation methods daily. ‐ Special events to promote fruits and vegetables. Implementation strategies: EPOC: Educational meetings: ‐ Monthly meetings were held with the cook managers from each of the 13 intervention schools to discuss and share implementation issues and new ideas during the 1st school year. EPOC: Educational outreach visits: ‐ Intervention staff visited schools weekly, on average, and supported the activities for the kick‐off. EPOC: Educational materials: ‐ The “High 5 Flyers” that were hung in posters around the school cafeteria. EPOC: Other: ‐ Special events: sampling of fruit and vegetables, class challenges (to eat 3 serves of fruit and vegetables per day at lunch). EPOC: Local consensus processes: ‐ Monthly meetings were held with the cook managers from each of the 13 intervention schools to discuss and share implementation issues and new ideas during the 1st school year. Theoretical underpinning: Social Cognitive Theory. Description of control: Received training and materials at the end of the active study phase in Fall 2002. |
|
| Outcomes |
Outcome relating to the implementation of school service policies, practices or programs: ‐ Verbal encouragement by food staff (mean % of observations). ‐ Number of fruits and vegetables on the snack cart (mean). ‐ Number of fruits and vegetables students can choose (mean). ‐ Fruit and vegetables rated as appealing (mean %). Data collection method: Process measures for the study, collected in both the intervention and control schools, included direct observations of the lunchroom, lunch line, food cart, and food service staff behaviour. Validity of measures used: Not reported however the measure is objective. Outcome relating to staff knowledge, skills or attitudes: Not reported. Outcome relating to cost: Not reported. Outcome relating to adverse consequences: Not reported. Outcome relating to child diet, physical activity or weight status: Fruit and vegetable intake. Data collection method: Trained observers watched the selected students from a distance in the cafeteria and recorded all items eaten at lunch and their portion. Validity of measures used: Reported to be valid. |
|
| Notes |
Research funding: Supported by funding grants provided by a grant from the National Cancer Institute (R01 CA59805). Conflicts of interest: Not reported |
|
| Risk of bias | ||
| Bias | Authors' judgement | Support for judgement |
| Random sequence generation (selection bias) | Unclear risk | Schools were randomly allocated to experimental group. The random sequence generation procedure is not described. |
| Allocation concealment (selection bias) | Unclear risk | There is no information provided about allocation concealment and therefore it is unclear if allocation was concealed. |
| Blinding of participants and personnel (performance bias) All outcomes | High risk | Outcome group: Observations: There is no blinding to group allocation of participants or personnel described and this is likely to influence performance. |
| Blinding of outcome assessment (detection bias) All outcomes | High risk | Outcome group: There is no mention that observers were blinded to group allocation and therefore the risk of detection bias is high. |
| Incomplete outcome data (attrition bias) All outcomes | Low risk | Outcome group: All 26 schools were retained in the study. |
| Selective reporting (reporting bias) | Unclear risk | There is no study protocol therefore it is unclear if there was selective outcome reporting. |
| Recruitment to cluster | Low risk | Direct observations of school environment and food service staff. |
| Baseline imbalance | Low risk | There were no significant differences at baseline from the lunch observations for all the main outcome measures. |
| Loss of cluster | Low risk | All 26 schools were retained in the study. |
| Incorrect analysis | Unclear risk | Used mixed‐model regression procedures however it is unclear if adjusted for clustering. |
| Contamination | High risk | Given that schools rather than school districts were randomised to condition, there is potential for contamination because all the schools were in the same school district and so shared the same food sources and lunch menus, even though preparation was done at each school site. |
| Compatibility with individually randomised RCTs | Unclear risk | Unable to determine if a herd effect exists. |
Sallis 1997.
| Methods |
Trial name: Sports, Play, and Active Recreation for Kids (SPARK). Study design: Non‐randomised. Intervention duration: 2.5 years – reported in paper as 3 academic years (1990‐1993) (intervention began in Fall 1990 and ended in Spring 1992 for fourth grade teachers and started in Fall 1991 and ended in Spring 1993 for fifth grade teachers. Follow‐up observations were made during Fall 1993 and Spring 1994)/8 months /2 years. Length of follow‐up from baseline: 2.5 years/not explicit /Baseline = Fall 4th grade, Follow‐up = Spring 5th grade. Maintenance effects also studied 1.5 years after the termination of the program (i.e. 4 year follow‐up from baseline I total). Differences in baseline characteristics: Not reported (however matched by size and ethnic make‐up (% white))/significant difference in age by condition (9.49 vs. 9.62 years). Unit of allocation: Schools. Unit of analysis: Classroom. |
|
| Participants |
School type: Schools (elementary) 7/12 schools in one school district. Region: Southern California, USA. Demographic/socioeconomic characteristics: The schools were situated in a middle class suburb of a large city containing 82% European American, 12% Asian/Pacific Islander, 4% Latino, 2% African American with 53% male. Inclusion/exclusion criteria: School level was not reported. Student level Inclusion: ‐ Students were required to complete baseline and final survey and fitness test. Number of schools allocated: Of the seven schools, there were four interventions and three controls. The four intervention groups were further sub‐divided into two groups; one teacher arm and one specialist arm. The specialist arm was excluded in this review as the in‐school program was delivered by certified PE specialist (PES). Conversly, the other intervention arm was delivered by school teachers. Consequently, we report five schools as allocated. Students: 2 consecutive cohort of 4th graders, followed to 5th grade) Numbers by trial group: n (controls baseline) = 3. n (controls follow‐up) = 3. n (intervention (teachers‐led) baseline) = 2. n (interventions (teachers‐led) follow‐up) = 2. Recruitment: Schools: Schools agreed to participation in an experimental program and be randomised to one of three study conditions. Schools were stratified by percentages of minority student and within those strata; two schools were randomly assigned to each condition (PE specialist, teacher‐led or control). The remaining school was added to the control condition. Teachers: Not reported. Students: Two consecutive cohorts of fourth grade students entered the study. All fourth grade students were invited to participate. Approximately 98% provided informed consent through a passive consent procedure. Recruitment rate: 12/16 Principals consented (consent rate = 75%). Resourcing constraints meant that only 7 of 12 schools were randomised. All 4th grade classes in the 7 schools participates. |
|
| Interventions |
Number of experimental conditions: 3 (2 intervention conditions (PES condition, TT condition) 1 control condition). PES: credentialed PE specialists were employed and trained by the investigators to ensure full implementation of the intervention. Teacher‐led: In the trained classroom teacher condition, classroom teachers were trained in the intervention methods. Note: This review only reports on the Teacher‐led and control conditions. Policies, practices or programs targeted by the intervention: Sports, Play and Active Recreation for Kids (SPARK) PE was designed to be a comprehensive program for upper elementary students to increase physical activity. It was deigned to influence the quantity and quality of elementary PE lessons and the amount of PE through: ‐ # Lessons per week ‐ Minutes of PE per week Implementation strategies: Intervention strategies provided to all 3 conditions EPOC: Educational materials: ‐ Written curriculum guide identified the program philosophy and goals and included a yearly plan which was divided into instruction units with activity progressions within each unit. A detailed plan was provided for each PE lesson, which typically had two parts: health‐fitness activities and skill‐fitness activities. EPOC: Length of consultation: ‐ An additional 30 minutes per week was allocated for classroom instruction and practices in self‐management activities and skills. EPOC: Other: ‐ To support implementation of the curricula, equivalent types of equipment were provided to all seven schools, including control schools, and replacement equipment was added each year. Trained classroom teacher condition EPOC: Educational meetings: ‐ Classroom teachers were trained to implement SPARK PE. EPOC: Educational outreach visits: ‐ On‐site support which was provided during the 3 years ensured the curriculum was followed. A PE specialist provided feedback, encouragement and direct assistance during schools visits. The specialist assisted teachers by leading grade‐level planning meetings, modelling lesson segments, coordinating space and equipment, and giving verbal and written feedback after observing lessons. Theoretical underpinning: Not reported. Description of control: Usual PE was implemented by untrained classroom teachers/usual care. |
|
| Outcomes |
Outcome relating to the implementation of school policies, practices or programs: ‐ Duration (minutes) per week of physical education lessons ‐ Frequency (per week) of physical education lessons Data collection method: Measured by direct observation by trained assessors for one full week twice a year in each school year. Validity of measures used: Not reported however the measure is objective. Outcome relating to staff knowledge, skills or attitudes: Not reported. Outcome relating to cost: Not reported. Outcome relating to adverse consequences: Not reported. Outcome relating to child diet, physical activity or weight status: Physical activity (MVPA of students in classrooms and out of school physical activity as well as a fitness test) as well as height and weight. Data collection method: MVPA of students in classrooms: SOFIT (System for observing fitness instruction time) was used to obtain student activity levels. Codes were used to estimate energy expenditure associated with physical activity, which have been calibrated using heart rate monitoring and the system has been validated using Caltrac accelerometers. Out of school physical activity: Accelerometer was the primary measure of physical activity for out of school. Fitness: mile‐run test. Anthropometric measures: Height and weight were measured in stocking feet. Calf and triceps skinfolds were assessed three times using calibrated Lange calipers. Validity of measures used: MVPA of students in classrooms: The system has been validated using Caltrac accelerometers. Out of school physical activity: Valid. Fitness: Objective. Anthropometric measures: The interobserver agreement (intraclass correlations) was .87 for triceps skinfold and .93 for calf skinfold (n = 47). Anthropometry is a valid tool. |
|
| Notes |
Research funding: This work was supported by NIH grant HL44467. Conflicts of interest: Not reported. |
|
| Risk of bias | ||
| Bias | Authors' judgement | Support for judgement |
| Random sequence generation (selection bias) | High risk | Randomisation of all schools did not occur resulting in high risk of selection bias. Within each stratum, one school was randomly assigned to each of the three experimental conditions. To guard against loss of control schools, the remaining school was assigned to the control condition. |
| Allocation concealment (selection bias) | High risk | Randomisation of all schools did not occur and there is no indication that allocation was concealed and therefore at high risk of selection bias. |
| Blinding of participants and personnel (performance bias) All outcomes | High risk | Outcome group: All. Given the nature of the intervention, participants and study personnel are likely to have been aware of study allocation and therefore high risk of performance bias. |
| Blinding of outcome assessment (detection bias) All outcomes | Unclear risk | Outcome group: Observations of physical education classes. Implementation of the school physical education program was assessed by direct observation by trained assessors not part of the intervention team. There is insufficient information about whether these assessors were blinded. |
| Incomplete outcome data (attrition bias) All outcomes | Unclear risk | Outcome group: Observations of physical education classes. Insufficient reporting of attrition/exclusions to permit judgement of ‘Low risk’ or ‘High risk’ (e.g. no reasons for missing data provided). |
| Selective reporting (reporting bias) | Unclear risk | There is no study protocol therefore it is unclear if there was selective outcome reporting. |
| Potential confounding | Unclear risk | There is insufficient information to determine the risk of potential confounders. |
Saraf 2015.
| Methods |
Trial name: No trial name. Study design: Cluster‐randomised controlled trial. Intervention duration: The intervention started in April 2009 and continued till Dec 2009. Length of follow‐up from baseline: The baseline data were collected from Dec 2008 through Feb 2009. The post intervention assessment was carried out in Jan‐ Feb 2010. Differences in baseline characteristics: There were no significant differences between the intervention and the control group in the student population at baseline. Unit of allocation: Region. Unit of analysis: School. |
|
| Participants |
School type: Middle.
Region: Villages of Ballabgarh Block of Haryana state, India. Recruitment: 40 schools were invited to participate. For the purpose of randomisation, all the villages predominantly on the left side of Mohna Road (the main road passing through all these villages) were considered one group and those on the right side another group. One group was allocated as intervention (IG), and the other as control (CG) based on draw of lots. Schools: At school level, verbal consent was taken from the school administrator. Students: At student level, written consent was taken from the parents by sending the consent form to the students before administering the questionnaire. Students present at the time of school visit with a written consent from parents were included and those absent on the day of visit were excluded from the study. There were 1026 students in the intervention and 1322 students in control group. Demographic/socioeconomic characteristics: The mean age of the study population was 12.5 years (±1.08) in the intervention group and 12.3 years (±1.11) in the control group (P = 0.08). There were 47 % girls in the intervention group and 46 % girls in the control group (P = 0.6). Inclusion/exclusion criteria: School level Inclusion: No criteria reported. Students level inclusion: Present at the time of school visit with a written consent from parents were included and those absent on the day of visit were excluded from the study. Number of schools allocated: 40 (19 intervention, 21 control). Numbers by trial group: n (controls baseline) = 21 n (controls follow‐up) = 21 n (interventions baseline) = 19 n (interventions follow‐up) = 19 |
|
| Interventions |
Number of experimental conditions: 2 (1 intervention, 1 control). Policies, practices or programs targeted by the intervention: The intervention consisted of a school component (policies), a classroom component (activities) and a family component [Information Education & Communication (IEC) material]. Implementation strategies: EPOC: Local consensus processes: ‐ Initially a sensitisation meeting was conducted to sensitise the school administrators; a short film on non‐communicable diseases (NCDs) and their risk factors was shown in addition to baseline results. The meeting aimed to conclude with assured support from the school administrators and formation of school health committee The intervention had three components: a school component, a classroom component, a family/community component. School component: This aimed to create enabling environments in the schools by: EPOC: Local opinion leaders: ‐ Formation of school health committee. EPOC: Tailored interventions: ‐ Formulation of school action plan. EPOC: Educational materials: ‐ Improving school environment by display of posters and bulletin. EPOC: Educational games: ‐ Improving school environment by conducting quiz competitions, sports competitions and cultural activities based on non‐communicable diseases (NCDs). Classroom component: to involve student in health‐promoting activities including: EPOC: Educational meetings: ‐ Health education lectures, flash film, peer group discussions, flip charts, physical training classes. Family/community component: To reach out to the families and community through schools, including: EPOC: Other: ‐ Families were engaged via holiday assignments, school rally, distribution of pamphlets, list of healthy foods, and family orientation about NDCs during parent/teacher meetings and annual functions. Theoretical underpinning: It is reported that the intervention was not based on any theoretical model. Description of control: Not reported but assume usual practice. |
|
| Outcomes |
Outcome relating to the implementation of school policies, practices or programs: ‐ Schools having tobacco policy ‐ Policy about PA ‐ School food policy ‐ Average of fried foods ‐ Average of salted snacks ‐ Average of healthy foods Data collection methods: Were measured using a school check list. The information was gathered from school authorities and by direct observation. Validity of measures used: Not reported however the methods contained objective and non‐objective components. Outcome relating to staff knowledge, skills or attitudes: Not reported. Outcome relating to cost: Not reported. Outcome relating to adverse consequences: Not reported. Outcome relating to child diet, physical activity or weight status: Students attending physical training classes > 5 days, Leisure time MVPA, time watching TV, consumption of fruit, vegetables, deep fried foods, salted snacks, purchasing ‘eatables’ from outside and smoking status. Data collection method: Student survey. Validity of measures used: Not reported. |
|
| Notes |
Research funding: India Institute of Medical Sciences, New Delhi. Conflicts of interest: Authors report no conflict of interest. |
|
| Risk of bias | ||
| Bias | Authors' judgement | Support for judgement |
| Random sequence generation (selection bias) | Low risk | All the villages predominantly on the left side of the main road passing through all these villages were considered one group and those on the right side another group. One group was allocated as intervention, and the other as control based on draw of lots. |
| Allocation concealment (selection bias) | Unclear risk | There is no information provided about allocation concealment and therefore it is unclear if allocation was concealed. |
| Blinding of participants and personnel (performance bias) All outcomes | High risk | Outcome group: All. No blinding or incomplete blinding, and the outcome is likely to be influenced by lack of blinding. |
| Blinding of outcome assessment (detection bias) All outcomes | High risk | Outcome group: School check‐list. The information was gathered from school authorities and by direct observation. No blinding of outcome assessment, and the outcome measurement is likely to be influenced by lack of blinding; self‐report considered high risk. |
| Incomplete outcome data (attrition bias) All outcomes | Low risk | Outcome group: School check‐list. No missing outcome data at school‐level and therefore low risk of attrition bias. |
| Selective reporting (reporting bias) | Unclear risk | There is no study protocol therefore it is unclear if there was selective outcome reporting. |
| Recruitment to cluster | Low risk | Randomisation post‐recruitment and baseline data collection. |
| Baseline imbalance | Unclear risk | School‐baseline characteristics not reported. Arbitrary zone boundary used to create groups and unclear if systematic differences exist between‐group areas although balance between government and private schools relatively even in both groups. |
| Loss of cluster | Low risk | No loss of clusters. |
| Incorrect analysis | High risk | Unit of analysis error for the primary trial implementation outcome. |
| Contamination | Unclear risk | Even after taking due precautions, it is unclear if cross‐contamination might have occurred in the index study as in any other community trial. |
| Compatibility with individually randomised RCTs | Unclear risk | Unable to determine if a herd effect exists. |
Saunders 2006.
| Methods |
Trial name: Lifestyle Education for Activity Program (LEAP). Study design: Randomised controlled trial for implementation outcome. Intervention duration: 2 years. Length of follow‐up from baseline: 12 months. Differences in baseline characteristics: There were no baseline age or racial/ethnic differences between girls in the control and the intervention schools. Unit of allocation: Schools. Unit of analysis: School. |
|
| Participants |
School type: High‐schools in 14 South Carolina counties (1998–2000). Region: South Carolina. Demographic/socioeconomic characteristics: No details about participating schools. Of students, 48.7% were African American and 46.7% were White, which was comparable to the population of the participating schools. Inclusion/exclusion criteria: Not reported. Number of schools allocated: 24. Numbers by trial group: n (controls baseline) = 12 schools and 1221 girls. n (controls follow‐up) = 12 schools and 741 girls. n (interventions baseline) = 12 schools and 1523 girls. n (interventions follow‐up) = 12 schools and 863 girls. Recruitment: Schools: Not reported. Students: All eighth‐grade girls (n = 8155) who attended 1 of the 31 middle schools that “fed” students to the 24 participating high schools were invited to complete the measures. These girls participated in a school assembly during which the measurement protocol was explained, incentives were described (gifts and promotional items valued at < $10), and all girls were invited to participate. Recruitment rate %: School districts: Not reported. Schools: 24 schools, does not report school recruitment rate. Students: 97% of those recruited completed the baseline measures. (2744/2841 eighth‐grade girls who volunteered to participate in the measurement protocol). |
|
| Interventions |
Number of experimental conditions: 2 (1 intervention, 1 control). Policies, practices or programs targeted by the intervention: The LEAP intervention focused on changing personal, social, and environmental factors related to physical activity and involved changes to the school environment and instructional programs. Instructional program components included changes in physical education and health instruction to enhance physical activity self‐efficacy and enjoyment. Schools were not required to implement a specific LEAP curriculum. Rather, to change instructional practice. The environmental strategy involved changing school practices that encouraged and supported physical activity and included changes to school health services, faculty staff health promotion, school environment, and school community linkages. The original six components of LEAP from the Coordinated School Health Program model were expanded to 16 ‘‘essential elements’’(including instructional and environmental). Of these, schools were expected to implement all instructional elements and three environmental elements (school administrator support, school physical activity team, and media messages promoting physical activity). Implementation strategies: EPOC: Educational outreach visits: ‐ Two full‐time program support staff provided. EPOC: Local opinion leaders: ‐ Each LEAP team was headed by a LEAP champion who was usually the teacher responsible for girls PE. The LEAP champion was either the person assigned to be the primary contact for the school or the person who evolved as the strongest supporter of the intervention effort. The LEAP champion, in coordination with the LEAP project staff, worked to involve school administrators, teachers and staff in the LEAP team. EPOC: Educational meetings: ‐ Schools received training and strong encouragement to implement the remaining environmental elements. Staff training consisted of formal workshops and one‐on‐one technical assistance for school personnel. Training was provided through in‐service days before and during the school year. EPOC: Educational materials: ‐ LEAP staff maintained a wide range of resources, including physical activity videotapes, books EPOC: Other: ‐ Equipment (hand weights, exercise bands, pedometers) for the intervention schools. EPOC: Local consensus processes: ‐ LEAP staff worked with the LEAP champion and the LEAP team in each school to identify opportunities to enhance the environment or change school policy in support of physical activity. Training was provided for developing and implementing strategic plans to promote physical activity in the school. LEAP staff provided ongoing consultation and support to LEAP schools through regular visits, phone calls, e‐mail and a listserv. Theoretical underpinning: An ecological model provided the organising framework for the LEAP intervention and drew primarily from social cognitive theory for the overall intervention. Nothing specific to the implementation strategy. Description of control: 12 control schools received no treatment. |
|
| Outcomes |
Outcome relating to the implementation of school policies, practices or programs: ‐ (Active PA team) School physical activity team‐ A team that regularly plans, implements and evaluates student and faculty PA programs. ‐ (Admin support) School administrator supports physical activity promotion‐ Tangible support from the principal for physical activity (PA) promotion, such as providing time and resources physical education (PE) classes and PA programs; participates on PA team. ‐ (Emphasise lifelong PE) Emphasises lifelong physical activity‐ Classes emphasise a variety lifetime PAs girls enjoy, such as dance, aerobics, strength training, etc. ‐ (Co‐op options in PE) Includes cooperative activities‐ PE has cooperative games, activities, and team‐ building, along with the traditional, competitive sport activities. ‐ (Provide health services) School nurse counselling for physical activity (health services) ‐ School nurse regularly counsels students about PA and has materials related to PA in health room. ‐ (Health promotion for staff) Adult modelling of physical activity through faculty/staff health promotion‐ School has an active wellness program in place which sponsors PA programs for staff. ‐ (Provide health education) Health education reinforces messages and skills taught in physical education ‐ Instructional activities in health education complement and reinforce those taught in PE. ‐ (Co‐ordinate PA events with community) Community agency involvement‐ School collaborates with community agencies to provide PA programs and resources for students, faculty/staff, and families. ‐ (Family involvement) Family involvement‐ Families are provided information about PA, PA resources, and PA opportunities. Data collection method: The organisational assessment interview was a 22‐item interview (administered in 10–15 minute) conducted by the independent process evaluator in all intervention and control schools with a school administrator (usually assistant principal), to assess organisational‐level components (i.e., school environment and instruction practice consistent with the LEAP intervention). This tool assessed organisational‐level factors and, unlike the process tools described in the previous section, was not designed to measure implementation. The organisational assessment rated nine of the essential elements, including seven environmental factors and two instructional factors. Additional items assessed events and activities (secular events) that could affect project outcomes such as participation in physical education teacher training and receiving an award in school health, and organisational resources such as budget for physical education. Validity of measures used: Not reported/self‐report methods. Outcome relating to staff knowledge, skills or attitudes: Not reported. Outcome relating to cost: Not reported. Outcome relating to adverse consequences: Not reported. Outcome relating to child diet, physical activity or weight status: Physical activity and weight status. Data collection method: Physical activity: The 3‐Day Physical Activity Recall (3DPAR), a modification of the Previous Day Physical Activity Recall, was used to assess physical activity. Weight status: Height and weight were measured in a private setting while students were dressed in light clothing. Height was measured to the nearest 1.0 centimetre with a portable stadiometer (Shorr Productions, Olney, Md); weight was measured to the nearest 0.1 kilogram (kg) with a calibrated digital scale (model PS6600, BeFour, Inc, Saulville, Wis). Body mass index (BMI) was calculated as body weight in kg divided by height in metres squared (kg/m2). Validity of measures used: Physical activity: 3DPAR. Weight status: BMI classified in accordance with the Center for Disease Control and Prevention’s growth charts for BMI. |
|
| Notes |
Research funding: Supported by a grant from the National Heart, Lung and Blood Institute (R01 HL057775). Conflicts of interest: Authors report no conflict of interest. |
|
| Risk of bias | ||
| Bias | Authors' judgement | Support for judgement |
| Random sequence generation (selection bias) | Unclear risk | Schools were paired by school size, percentage of girls who were African American, urban/suburban or rural location, and class structure. Schools from each pair were randomly assigned to control or intervention groups. The random sequence generation procedure is not described. |
| Allocation concealment (selection bias) | Unclear risk | There is no information provided about allocation concealment and therefore it is unclear if allocation was concealed. |
| Blinding of participants and personnel (performance bias) All outcomes | High risk | Outcome group: All given the nature of the intervention, participants and study personnel are likely to have been aware of study allocation and therefore high risk of performance bias. |
| Blinding of outcome assessment (detection bias) All outcomes | High risk | Outcome group: Organisational assessment interview No blinding of outcome assessment and the outcome measurement is likely to be influenced by lack of blinding; self‐report considered high risk. |
| Incomplete outcome data (attrition bias) All outcomes | Low risk | Outcome group: Organisational assessment interview. There were no missing outcome data and therefore low risk of attrition bias. |
| Selective reporting (reporting bias) | Unclear risk | There is no study protocol therefore it is unclear if there was selective outcome reporting. |
Simons‐Morton 1988.
| Methods |
Trial name: Go for Health. Study design: Non‐randomised. Intervention duration: 2 years. Length of follow‐up from baseline: 12 months. Data collection was conducted during the Spring semester at baseline and the first follow‐up after one year of intervention. Differences in baseline characteristics The ethnic distributions were comparable between treatment and control conditions and were similar to the ethnic distribution in the community. Unit of allocation: Schools (elementary). Unit of analysis: Schools (elementary). |
|
| Participants |
School type: Schools (elementary) in Texas City Independent School District.
Region: Texas, USA. Demographic/socioeconomic characteristics: For all schools combined, ethnic distributions were Anglo‐American (62.3%), Mexican‐American (20.9%), Black‐American (14.8%), and Asian and American Indian (2%). Inclusion/exclusion criteria: Not reported. Number of services allocated: 4 schools included. Numbers by trial group: n (controls baseline) = 2. n (controls follow‐up) = 2. n (interventions baseline) = 2. n (interventions follow‐up) = 2 (1293 third and fourth grade students were enrolled in the four study schools). Recruitment: Schools: All 4 schools in the Texas City Independent School District participated. Students: At baseline 1293 third and fourth grade students were enrolled in the four study schools. Recruitment rate: Schools: Not reported. |
|
| Interventions |
Number of experimental conditions: 2 (1 intervention, 1 control). Policies, practices or programs targeted by the intervention: Innovations introduced into the schools included: 1) the new school lunch,) and 2) health education for healthful diet. Implementation of each of the program components required organisational changes in school programs and in the roles and practices of school personnel. Implementation strategies: Commitment of school district administrators to adopt the program was obtained in writing before intervention was initiated. Principals at each experimental school adopted a statement of support for the goal of providing healthful diet. Planning groups, consisting of teachers and staff, were established to inform intervention staff and to foster program ownership EPOC: Other: ‐ Institutional Commitment: Principals adopted an official statement of support for the goal to provide healthy diet. Alterations in Policies and Practices: 1) Policies to change food purchasing and menu planning 2) policies to support formation of school health task force at each school to develop school wide learning activities. Alterations in roles and actions of staff: 1) Changes to food preparation, presentations, and addition of healthy alternatives, 2) school health task force and school staff plan social learning activities to provide social support for continuation and to assist students to learn targeted behaviours. Student Learning: Changes in behaviour to 1) Increase selection and consumption of low‐sodium, low‐fat foods, 2) Increase duration and frequency in aerobic activity and 3) Skill development, modelling, behaviour rehearsal, reinforcement. School lunch The objective was to reduce the content of sodium and fat served in school lunches by 25% over a two‐year period. EPOC: Monitoring of performance: ‐ Existing menu planning, food purchasing, recipe selection, and food preparation practices were examined by project staff. EPOC: Local consensus processes: ‐ Specific practice changes in four areas purchasing, menu planning, recipes, and food preparation were identified and negotiated with the food service director and with intervention school cafeteria managers. EPOC: Educational outreach visits: ‐ The dietitian worked with the cafeteria managers and cooks to adjust standard recipes to reflect 25% reductions in fat and sodium. To facilitate implementation, food handlers received six hours of summer in‐service training conducted by the project staff in cooperation with cafeteria managers. The food service director and cafeteria managers were actively involved in the development of the new school lunch. ‐ The staff dietitian continually solicited the input and impressions of the cooks both formally and informally. EPOC: Managerial supervision: During the school year, the staff dietitian served as a consultant and was present in the treatment schools on a regular basis, providing feedback on performance and assistance in resolving food viability, recipe preparation, cooking, and serving problems. Health education for healthful diet EPOC: Educational materials: ‐ The innovation consisted of six health education modules on diet. ‐ The modules were attractively packaged with visual aids and teaching materials ready to be handed out to the children. EPOC: Local opinion leaders: ‐ The classroom modules were developed by project staff with the aid of a classroom teacher who had recently retired from the school district. EPOC: Educational outreach visits: ‐ To foster adoption of the modules, teachers were provided with 1 hour of training prior to the start date for each module. EPOC:Other: ‐ Children were eligible to receive token incentives (stickers, T‐shirts, sweat bands) upon completion of the major learning activities. Theoretical underpinning: Charter and Jones framework four levels at which implementation of innovations may occur in a school: 1) institutional commitment, 2) structural context, 3) role performance, and 4) learning activities. Description of control: Not reported but assume usual practice. |
|
| Outcomes |
Outcome relating to the implementation of school policies, practices or programs: ‐ Sodium content of school meals mg by schools ‐ Fat content of school lunches (g) Data collection method: The identical menu was repeated in March and April each year of the study. At baseline, 12 meals were selected randomly from the March and April menus and analysed for nutrient content. Recipe analyses, based on detailed interviews with each cook in the intervention schools at baseline and in all four schools at mid‐test and post‐test, were conducted by trained staff nutritionists and analysed by the Nutrition Coding Center (NCC). Validity of measures used: Not reported/self‐report methods. Outcome relating to staff knowledge, skills or attitudes: Not reported. Outcome relating to cost: Not reported. Outcome relating to adverse consequences: Not reported. Outcome relating to child diet, physical activity or weight status: Child sodium and fat intake. Data collection method: A 24‐hour dietary recall interview was administered. Each child was interviewed at home in the company of one parent, who was asked about ingredients, food preparation, and other items as needed. Validity of measures used: Not reported. |
|
| Notes |
Note: This trial also included a PA component in the program however did not report a corresponding implementation outcome measure. Consequently, this trial is reported as a nutrition trial only. Research funding: Supported by Grant HL33376 from National Heart, Lung, and Blood Institute, National Institute of Health. Conflicts of interest: Not reported |
|
| Risk of bias | ||
| Bias | Authors' judgement | Support for judgement |
| Random sequence generation (selection bias) | High risk | Non‐randomised trial. Elementary schools were not randomly assigned to experimental condition and therefore high risk of selection bias. |
| Allocation concealment (selection bias) | High risk | Non‐randomised trial. There is no indication that allocation was concealed and therefore at high risk of selection bias. |
| Blinding of participants and personnel (performance bias) All outcomes | High risk | Outcome group: All Due to nature of the intervention, school staff and study personnel delivering the intervention were not blind to study allocation. |
| Blinding of outcome assessment (detection bias) All outcomes | Unclear risk | Outcome group: New school lunch Blinding of outcome assessment ensured, and unlikely that the blinding could have been broken. (Low risk of bias). Outcome group: Physical education Random, anonymous observations of children’s physical activity were made during physical education classes by trained observers. Insufficient information to permit judgement of ‘Low risk’ or ‘High risk’, e.g. not reported in methods or register. (Unclear risk of bias). Outcome group: Classroom instruction No blinding of outcome assessment and the outcome measurement is likely to be influenced by lack of blinding; self‐report considered high risk. (High risk of bias). Outcome group: Nutrient analysis of school lunches Recipe analyses were conducted by trained staff nutritionists. Insufficient information to permit judgement of ‘Low risk’ or ‘High risk’; e.g. not reported in methods or register. (Unclear risk of bias). |
| Incomplete outcome data (attrition bias) All outcomes | Low risk | Outcome group: New school lunch There were no missing outcome data. Outcome group: Physical education There were no missing outcome data. Outcome group: Classroom instruction Missing outcome data balanced in numbers across intervention groups, with similar reasons for missing data across groups. Outcome group: Nutrient analysis of school lunches There were no missing outcome data. |
| Selective reporting (reporting bias) | Unclear risk | There is no study protocol therefore it is unclear if there was selective outcome reporting. |
| Potential confounding | High risk | Appears no adjustments were made in analysis for school‐based confounders. |
Story 2000.
| Methods |
Trial name: 5‐a‐Day Power Plus. Study design: Cluster‐randomised controlled trial. Intervention duration: Unclear (beginning in the fourth grade (1994‐1995) and throughout the fifth‐grade school year (1995‐1996). Length of follow‐up from baseline: approximately 12 months. Differences in baseline characteristics: Similar – schools were matched pairs that were then randomised. Unit of allocation: Schools. Unit of analysis: Cafeteria observations. |
|
| Participants |
School type: Elementary schools. Region: St. Paul, Minnesota, USA. Demographic/socioeconomic characteristics: Of the 1750 fourth‐grade students enrolled at baseline, 1.3% were Native American, 6.4% were Hispanic, 19.1% were African American, 25.2% were Asian American (largely Hmong), and 48% were white. Approximately 60% of the students were eligible for free or reduced‐price school meals. Inclusion/exclusion criteria: Not reported. Number of schools allocated: 20 inner‐city public elementary schools. Numbers by trial group: 10 intervention, 10 control. Recruitment: Recruitment strategy not reported. Recruitment rate: Not reported. |
|
| Interventions |
Number of experimental conditions: 2 (1 intervention, 1 control). Policies, practices or programs targeted by the intervention: The intervention consisted of a parent, industry, curricula and classroom component. Only the food service and curricula components were subject to an implementation strategy. Only the food service component had an implementation outcome assessed between experimental groups and consequently, only food service implementation strategies were extracted. Regarding the food service intervention, the four food service intervention strategies were 1) point‐of‐purchase promotion of fruit and vegetable using characters and messages from the classroom curricula, 2) increasing the appeal of fruit and vegetable by enhancing their attractiveness, 3) increasing the variety and choice of fruit and vegetable served, and 4) offering an additional fruit choice on days when baked or frozen desserts were served. These four strategies involved eight guidelines on how to offer appealing fruit and vegetable choices and four promotion guidelines. Implementation strategies: EPOC: Educational meetings: ‐ Centralised training sessions were held for food service staff from the intervention schools. It was held during a regularly scheduled school day and was conducted by the 5‐a‐Day Power Plus staff. Food service staff attended the teacher training for 2 hours and also attended 2‐hour training after school each of the 2 intervention years. Food service staff members were paid for attending the training members were paid for attending the training. EPOC: Other: ‐ A local producer provided some fruit and vegetable for use in classroom taste testing, home snack packs, and to expand choice in school lunch. They also provided a 30‐minute presentation on fruit and vegetable to each of the fifth‐grade intervention classrooms. Service staff members were paid for attending the training. Theoretical underpinning: 5‐a‐Day Power Plus intervention program was guided by social cognitive theory and social learning theory. Description of control: Not reported but assume usual practice. |
|
| Outcomes |
Outcome relating to the implementation of school service policies, practices or programs: ‐ Mean number of fruit and vegetable choices available 4th grade ‐ Mean number of fruit and vegetable choices available 5th grade ‐ Mean % of eight guidelines on how to offer appealing fruit and vegetable met 4th grade ‐ Mean % of eight guidelines on how to offer appealing fruit and vegetable met 5th grade ‐ Mean % of four fruit and vegetable promotions met 4th grade ‐ Mean % of four fruit and vegetable promotions met 5th grade Data collection method: An observation‐based process evaluation method was also developed to assess the food service intervention implementation. Direct observations were conducted in each of the 10 intervention and 10 control schools on a monthly basis using trained observers and standardised protocols and instruments. Validity of measures: Not reported however, considered an objective measure of implementation. Outcome relating to staff knowledge, skills or attitudes: Not reported. Outcome relating to cost: Not reported. Outcome relating to adverse consequences: Not reported. Outcome relating to child diet, physical activity or weight status: Student dietary intake. Data collection method: 24‐hour quantified food record and recall and student lunchroom observations. Validity of measures used: Not stated although observations considered an objective measure. |
|
| Notes |
Research funding: Supported by Grant R01CA59805 from the National Institute of Health. Conflicts of interest: Not reported. |
|
| Risk of bias | ||
| Bias | Authors' judgement | Support for judgement |
| Random sequence generation (selection bias) | Unclear risk | Schools were matched in pairs and randomly allocated to experimental group. The random sequence generation procedure is not described. |
| Allocation concealment (selection bias) | Unclear risk | There is no information provided about allocation concealment and therefore it is unclear if allocation was concealed. |
| Blinding of participants and personnel (performance bias) All outcomes | High risk | Outcome group: Participants (teachers and cooks) were aware that they were being asked to implement an intervention. There was no blinding to group allocation and this is likely to influence performance. |
| Blinding of outcome assessment (detection bias) All outcomes | High risk | Outcome group: Trained evaluation staff visited each school to conduct observations using standardised protocols and measures. However, there is no information provided about whether these personnel were blinded to group allocation and teacher self‐reported measures were completed. |
| Incomplete outcome data (attrition bias) All outcomes | Low risk | Outcome group: There is no report of any schools dropping out of the study. |
| Selective reporting (reporting bias) | Unclear risk | There is no study protocol therefore it is unclear if there was selective outcome reporting. |
| Recruitment to cluster | Low risk | Individuals within each randomised cluster participated. |
| Baseline imbalance | Low risk | Schools were randomly allocated to condition and so risk of baseline imbalance is low. |
| Loss of cluster | Low risk | There is no report of any schools dropping out of the study. |
| Incorrect analysis | High risk | There was no reporting of statistical techniques apart from simple t‐tests. |
| Contamination | Low risk | Schools were randomly allocated to condition and so the risk of contamination is low. |
| Compatibility with individually randomised RCTs | Unclear risk | Unable to determine if a herd effect exists. |
Sutherland 2017.
| Methods |
Trial name: No trial name. Study design: Cluster‐randomised controlled trial. Intervention duration: Two school terms. Length of follow‐up from baseline: 6 months. Differences in baseline characteristics: Assumed to be zero. Unit of allocation: Schools. Unit of analysis: Schools and school classes. |
|
| Participants |
School type: Primary school.
Region: Hunter New England (HNE) region of New South Wales (NSW). Demographic/socioeconomic characteristics: Socioeconomically disadvantaged communities. Inclusion/exclusion criteria: Inclusion ‐ Government or Catholic schools. ‐ Located within HNE Local Health District. ‐ having a socioeconomic status score of 5 or less (lower 50% of NSW) based on school postcode. ‐ Not participating in other physical activity studies. Number of services allocated: 46 Numbers by trial group: n (controls baseline) = 21 n (controls follow‐up) = 21 n (interventions baseline) = 25 n (interventions follow‐up) = 25 Recruitment: Schools: 46 Students: 1139 Recruitment rate: Schools: 72% Students: 58% |
|
| Interventions |
Number of experimental conditions: 2 (1 intervention, 1 control). Policies, practices or programs targeted by the intervention: The evidence‐based school physical activity program known as SCORES (Supporting Children’s Outcomes using Rewards, Exercise and Skills) was rolled out in primary schools and the implementation intervention strategies facilitated its roll out. Implementation strategies: EPOC: Audit and feedback Schools were provided feedback on the implementation of the intervention on three occasions via email. Classroom teachers were given detailed feedback reports on PE lesson quality on two occasions. Feedback was based on the SAAFE teaching principles. EPOC: Education materials Teachers were provided with resources (lesson booklets, posters, whistles, lanyards and fundamental motor skills cards) to support delivery of high quality PE lessons, teach fundamental motor skills and increase MVPA within PE lessons. EPOC: Education meeting All classroom teachers were offered a 90‐minute professional learning workshop including theory and practical sessions. The workshop focused on delivery of fundamental motor skills to students, strategies to improve lesson quality through student engagement and increase students’ MVPA. The quality PE teaching principles were from the original SCORES program and known as the Supportive, Active, Autonomous, Fair and Enjoyable (SAAFE) teaching principles. In additional, teachers were required to team teach a PE lesson with experienced Health Promotion staff on one occasion. EPOC: Education outreach visits Peer teaching with experienced Health Promotion staff with a PE background was offered to classroom teachers in intervention schools. PE lessons were also observed, followed by written feedback and verbal encouragement. EPOC: Local opinion leader A meeting with school executive was held at the commencement of intervention and a school champion nominated for each school. School champions were responsible for embedding the physical activity practices within the school and leading policy development. Ongoing support was provided throughout the intervention from experienced Health Promotion staff. EPOC: Other Ongoing Support: was provided to school champions to embed the practices within their schools. Additional support was provided to classroom teachers via five short (five minute) video clips viewed in staff meetings, reinforcing the quality PE teaching principles (based on the SAAFE principles). Classroom teachers were provided with stickers to be used as prompts for quality PE and issued to students throughout practical PE. School champions provided prompts to classroom teachers to implement the strategies via email, electronic calendar reminders, and in meetings. School champion also received a polo shirt. Intervention schools also received equipment ($180) to support delivery of recess and lunchtime activities. Theoretical underpinning: Social‐ecological theory. Description of control: Control schools participated in the measurement components of the trial only and delivered school physical activity practices according to the curriculum. Support was offered post‐data collection. |
|
| Outcomes |
Outcome relating to the implementation of school policies, practices or programs: ‐ School PA policy or plan (% of schools). ‐ Overall lesson quality score. ‐ Recess PA (mean % of days offered). ‐ Lunch PA (mean % of days offered). ‐ Provision of sports equipment at recess (mean % of days offered). ‐ Provision of sports equipment at lunch (mean % of days offered). ‐ Provision of parent newsletters regarding PA. Data collection method: Survey and observation. Validity of measures used: Not reported/contains both objective and self‐report measures. Outcome relating to staff knowledge, skills or attitudes: Not reported. Outcome relating to cost: Not reported. Outcome relating to adverse consequences: Not reported. Outcome relating to child diet, physical activity or weight status: Physical activity. Data collection method: Accelerometer Validity of measures used: Objective. |
|
| Notes |
Research funding: No financial disclosures were reported by the authors of this paper. Conflicts of interest: All authors declare no conflict of interest. |
|
| Risk of bias | ||
| Bias | Authors' judgement | Support for judgement |
| Random sequence generation (selection bias) | Low risk | Cluster‐RCT. The random sequence produced using computerised random number function in Microsoft Excel. |
| Allocation concealment (selection bias) | Unclear risk | There is no information provided about allocation concealment and therefore it is unclear if allocation was concealed. |
| Blinding of participants and personnel (performance bias) All outcomes | High risk | Outcome group: Both the schools and the health promotion staff delivering the intervention were aware of the schools’ group allocation. |
| Blinding of outcome assessment (detection bias) All outcomes | Low risk | Outcome group: PE teaching quality Low: Lessons observed by trained research staff with experience in PE, blinded to group allocation. Outcome group: School physical activity practices High: Teacher reported practices and due to the nature of the intervention teachers could not be blinded and therefore at high risk of detection bias. |
| Incomplete outcome data (attrition bias) All outcomes | Low risk | Outcome group: School Physical Activity practice 2 Low: “69 lessons were observed (88% of eligible lessons)” Outcome group: School Physical Activity practice 1, 3 & 4 High: “141 (87 intervention, 54 control) of the 382 eligible school teachers (37%) completed an online survey across the 46 participating intervention and control schools.” High attrition and unequal across study arms. |
| Selective reporting (reporting bias) | Low risk | “The trial was registered with the Australian New Zealand Clinical Trials Registry (ACTRN12615000437561)” All predetermined outcomes are reported. |
| Recruitment to cluster | Low risk | Recruitment bias: Individuals within each randomised cluster participated/random allocation of schools to group occurred post‐recruitment. |
| Baseline imbalance | Low risk | Baseline imbalance: Schools were randomly allocated to condition and so risk of baseline imbalance is low. |
| Loss of cluster | High risk | Loss of clusters: High risk of loss of clusters based on teacher reported data. |
| Incorrect analysis | Unclear risk | Incorrect analysis: Unclear if clustering was taken into account for the teacher reported school physical activity practices. |
| Contamination | Low risk | Contamination: The unit of randomisation is the school and so risk of contamination is low. |
| Compatibility with individually randomised RCTs | Unclear risk | Compatibility with individually randomised RCTs (cluster‐RCTs): Unable to determine if a herd effect exists. |
Whatley Blum 2007.
| Methods |
Trial name: No trial name. Study design: Non‐randomised. Intervention duration: 1 year. Length of follow‐up from baseline: Approximately 1 year between baseline and follow‐up data collection Spring 2004 (Baseline data collection) to Spring 2005 (follow‐up data collection). Recruitment date not provided. Differences in baseline characteristics: Intervention schools had more students eligible for free/reduced‐price meal (32.9%) compared to controls (20.0%). Unit of allocation: School. Unit of analysis: School. |
|
| Participants |
School type: Public Schools (High). Region: Maine, USA. Demographic/socioeconomic characteristics: % students eligible for free/reduced‐price meal: control = 20.0%, intervention = 32.9%. No further details of student demographics provided. Inclusion/exclusion criteria: Inclusion: ‐ Participation in National school Lunch Program (NSLP). ‐ Offered an à la carte program. ‐ Have at least 1 snack and 1 beverage vending machine accessible to students. Exclusion: Not Provided. Number of schools allocated: 7. Numbers by trial group: n (controls baseline) = 3. n (controls follow‐up) = 3. n (interventions baseline) = 4. n (interventions follow‐up) = 4. Recruitment: Electronic informational letter sent from The Maine Department of Education to all superintendents (n = 150). Interested schools (n = 50) were screened by telephone. Recruitment rate: 7 schools expressed interest and met inclusion criteria (denominator unknown). |
|
| Interventions |
Number of experimental conditions: 2 (1 intervention, 1 control). Policies, practices or programs targeted by the intervention: Implementing low‐fat, low‐sugar and portion controlled guidelines in à la carte and vending (snack and beverage) programs. Implementation strategies: EPOC: Educational outreach visits: ‐ Visits by research staff to each schools food and beverage supplier to identify items that met the LFLS guidelines. EPOC: Educational materials: ‐ Suppliers who stocked vending machines were given lists of the available LFLS items (expected to stock from the Fall 2004) and letters sent home to parents and students informing them of changes incentives. Banners were also displayed to promote healthier foods and taste testing was conducted. EPOC: Clinical practice guidelines: ‐ Modification of recipes and preparation techniques by research and food service personnel. EPOC: Procurement and distribution of supplies: ‐ Food service directors were given lists of available products/vendors that met LFLS guidelines. EPOC: Educational meetings: ‐ Presentations describing LFLS guideline made to school administrations, faculty and/or staff EPOC: External funding: ‐ $1500 allocated annual to school liaison personnel. EPOC: Local consensus process: ‐ A committee at each school site was created. A liaison identified at each school was responsible for establishing a the committee to promote the healthy changes in the vending machines and à la carte menus at their schools. Expectations for the committees were discussed in detail with each school liaison; these expectations included recruitment of representatives from all stakeholder groups — school administration, faculty, students, parents, and food service personnel — and the completion of at least four activities over the course of the school year to promote the healthy changes EPOC: Other: ‐ Early communication between the project team and schools began in 2004 as a means to obtain the cooperation of school administration, and meet food service personnel. Theoretical underpinning: Not reported. Description of control: Made no changes to à la carte and vending machine programs for 1 school year. |
|
| Outcomes |
Outcome relating to the implementation of school service policies, practices or programs: ‐ % items meeting nutrient (LFLS) criteria in à la carte. ‐ % items meeting nutrient (LFLS) criteria in snack vending. ‐ % items meeting nutrient (LFLS) criteria in beverage vending. ‐ % items meeting nutrient (LFLS) AND proportion criteria in à la carte. ‐ % items meeting nutrient (LFLS) AND proportion criteria in snack vending. ‐ % items meeting nutrient (LFLS) AND proportion criteria in beverage vending. Data collection method: Trained personnel visited the school on 5 consecutive non‐randomised days at baseline and follow‐up. Observation and recording of items sold was taken at breakfast and lunch at cafeterias. Vending machine data included: number of machines, items and nutritional information completed on the same day as nutritional observation. Validity of method: Not reported however methods considered objective. Outcome relating to staff knowledge, skills or attitudes: Not reported. Outcome relating to cost: Not reported. Outcome relating to adverse consequences: Not reported. Outcome relating to child diet, physical activity or weight status: Consumption of sugar sweetened beverages. Data collection method: Food frequency Questionnaire: Subjects were asked to complete the youth food frequency questionnaire for what they ate and drank over the past 30 days. Validity of method: The youth food frequency questionnaire has been shown to be valid in youth (defined as 9 to 18 years of age) with mean correlation of r = 0.49 for food groups from the youth food frequency questionnaire compared with three 24‐ hour recalls. |
|
| Notes |
Research funding: Supported by a grant from the Centers for Disease Control and Prevention (03022). Conflicts of interest: Not reported. |
|
| Risk of bias | ||
| Bias | Authors' judgement | Support for judgement |
| Random sequence generation (selection bias) | High risk | Non‐randomised design. High risk of selection bias as high schools volunteered into the intervention or control group. |
| Allocation concealment (selection bias) | High risk | Non‐randomised design. High schools volunteered into an experimental group, therefore high risk of bias as no concealment of allocation. |
| Blinding of participants and personnel (performance bias) All outcomes | High risk | Outcome group: High schools volunteered as intervention or control, therefore participants and personnel were not blind to allocation and there is a high risk of performance bias. |
| Blinding of outcome assessment (detection bias) All outcomes | Unclear risk | Outcome group: Trained personnel visited each school to conduct observations. There is no information provided about whether these personnel were blinded to group allocation (i.e. may have conducted observations only and be unaware of the purpose of the study) and therefore the risk of detection bias is unclear. |
| Incomplete outcome data (attrition bias) All outcomes | Low risk | Outcome group: No schools dropped out and this study conducted observations of à la carte and vending programs in schools. |
| Selective reporting (reporting bias) | Unclear risk | There is no study protocol therefore it is unclear if there was selective outcome reporting. |
| Potential confounding | Unclear risk | The characteristics of the school and food environments are presented for the control and intervention groups (i.e. number of students, percentage of students eligible for free/reduced‐price meal, closed campus policy during lunch, offered à la carte breakfast). However, given this is a quasi‐experimental trial with no random allocation it is unclear if all potential confounders were measured. |
Wolfenden 2017.
| Methods |
Trial name: No trial name. Study design: Randomised controlled trial. Intervention duration: 12 to 14 months. Length of follow‐up from baseline: To assess the primary trial outcome, data were collected at baseline (April to September, 2013) and at the completion of the implementation period (November, 2014 to April, 2015). Differences in baseline characteristics: There were no significant differences in baseline characteristic among schools. Unit of allocation: Schools. Unit of analysis: Schools. |
|
| Participants |
School type: Primary schools. Region: Hunter region of NSW, Australia Demographic/socioeconomic characteristics: The trial region contained a socioeconomically diverse group. Inclusion/exclusion criteria: Schools from the study region were randomly selected and invited to participate. Inclusion: ‐ Schools were required to have an operational canteen ‐ Ethier one or more items on their canteen menu that was restricted for sale (‘red’ or ‘banned’) or less than 50% of menu items classified as healthy (‘green’ items). Exclusion: ‐ Nongovernment schools ‐ Schools with both primary and secondary students ‐ Schools catering exclusively for children requiring specialist care Number of schools allocated: 70 Numbers by trial group: n (controls baseline) = 35 n (controls follow‐up) = 30 n (interventions baseline) = 35 n (interventions follow‐up) = 27 Recruitment: Recruitment continued until 70 schools provided consent for study participation. Recruitment rate: 88% as 80 schools were assessed for eligibility. Note. no sample sizes for children in enrolled schools given. |
|
| Interventions |
Number of experimental conditions: 2 (1 intervention, 1 control). Policies, practices or programs targeted by the intervention: The New South Wales (NSW) Government launched a Healthy School Canteen Strategy (also known as Fresh Tastes @ School) to help prevent childhood obesity. The strategy classified foods sold by schools as ‘red’, ‘amber’ or ‘green’ based on their nutritional content. The strategy was adopted as policy by the government education department, and all government schools were mandated to remove items classified as ‘red’ from regular sale. Furthermore, schools were encouraged to ‘fill the menu’ with items classified as ‘green’ and ensure items classified as ‘amber’ did not dominate the menu. The primary aim of this study was to assess the effectiveness of a multi‐strategic intervention to increase implementation of the state‐wide healthy canteen policy. Implementation strategies: EPOC: Audit and feedback ‐ Performance monitoring and feedback menu reviews were conducted quarterly (unless menus were unchanged), and the results were used to compile written feedback reports to the canteen manager and school principal. Verbal discussion of the reports occurred during academic detailing visits or via telephone support calls. EPOC: Continuous quality improvement ‐ Policy implementation support Schools were allocated a support officer with qualifications in nutrition and dietetics and experience in supporting schools to implement the policy. Support officers contacted canteen managers every 2 months (via email, telephone or in person) throughout the intervention and used a continuous quality improvement framework of repeated goal setting, action planning, self‐monitoring and problem‐solving with canteen managers. EPOC: External funding ‐ Schools were also offered a small reimbursement to cover the costs associated with canteen manager attendance at training. EPOC: Education materials ‐ Tools and resources‐ Printed instructional materials, sample policies/menus, planning templates, pricing guides, product lists of policy compliant menu items, supplier contacts and menu assessment feedback were provided to all school canteen managers during the workshop or mailed to non‐attenders of the workshop. EPOC: Education meeting ‐ Canteen managers, canteen staff and parent representatives were invited to attend a training workshop (5 hours) with the aim of providing education and skill development in the policy, nutrition and food label reading, canteen stock and financial management, pricing and promotion, and change management. Training combined didactic and interactive components including opportunities for self‐assessment, role play and facilitator provided feedback. Training was facilitated by a support officer. EPOC: Education outreach visits ‐ School canteen visits were conducted 1 and 3 months post‐canteen manager training to enable support officers to observe the operational canteen environment, provide feedback and assist with problem‐solving barriers to policy implementation EPOC: Local consensus process ‐ Meetings between support officers and canteen staff were held to discuss and reach consensus regarding the policy, how best to implement it and to develop local canteen action plans to co‐ordinate implementation tasks. EPOC: Local opinion leader ‐ Executive support school principals were asked to communicate support for policy implementation and maintenance to teachers, parents, students and canteen managers during staff meetings, in newsletters and assemblies. Support officers also sought meetings with the executive of parent representative groups to garner their support for and input on policy implementation. EPOC: Tailored intervention ‐ Individualised goal setting, action planning with canteen managers at different schools EPOC: Other ‐ Quarterly project newsletters communicated key messages, provided information and case studies of successful implementation approaches to common barriers. ‐ Recognition Schools with a menu assessed as adhering to the policy (i.e. greater than 50% ‘green’ items and no ‘red’ or ‘banned’ items) received a congratulatory letter and phone call from the research team and were publicly acknowledged via marketing strategies. ‐ Canteen managers also received kitchen equipment to the value of AUD$100. Theoretical underpinning: The selection of intervention components was guided by the Theoretical Domains Framework. Description of control: No contact was made, and no resources provided to control schools during the intervention period by the research team. |
|
| Outcomes |
Outcome relating to the implementation of school service policies, practices or programs: ‐ The proportion of schools with a canteen menu that did not contain foods or beverages restricted for sale (‘red’ and ‘banned’) under the policy. ‐ The proportion of schools where healthy canteen items (‘green items’) represented more than 50% of listed menu items. Data collection method: Copies of canteen menus were collected from all participating schools and audited by two dietitians independently. Validity of method: Not reported yet objective. Outcome relating to staff knowledge, skills or attitudes: Not reported. Outcome relating to cost: Not reported. Outcome relating to adverse consequences: As a measure of potential adverse effects yearly income and expenditure of canteen profitability were calculated. Data collection method: canteen’s financial records. Validity: Objective. Outcome relating to child diet, physical activity or weight status: Mean (95% CI) energy, total fat and sodium of student purchases. Data collection method: Direct observation. Validity of method: Objective. |
|
| Notes |
Research funding: This work was supported by the Australian Research Council who provided funding for the trial [LP130101008]. In‐kind support was provided by the Hunter New England Population Health and the Hunter Medical Research Institute. Conflicts of interest: Authors report grants from Australian Research Council Linkage Project Scheme (LP130101008) during the conduct of the study; (2) no financial relationships with any organisation that might have an interest in the submitted work in the previous 3 years; and (3) no other relationships or activities that could appear to have influenced the submitted work. |
|
| Risk of bias | ||
| Bias | Authors' judgement | Support for judgement |
| Random sequence generation (selection bias) | Low risk | Randomised controlled trial. The random sequence was generated using a random number function in Microsoft Excel. |
| Allocation concealment (selection bias) | Unclear risk | There is no information provided about allocation concealment and therefore it is unclear if allocation was concealed. |
| Blinding of participants and personnel (performance bias) All outcomes | High risk | Outcome group: School staff (principals and canteen managers) were not blinded to group allocation. |
| Blinding of outcome assessment (detection bias) All outcomes | Low risk | Outcome group: Data collectors were blinded to group allocation. |
| Incomplete outcome data (attrition bias) All outcomes | Low risk | Outcome group: 13 of the 70 (19%) schools did not provide their menu for assessment at follow‐up. There were no significant differences in baseline characteristics among schools that did and did not provide follow‐up data. |
| Selective reporting (reporting bias) | Low risk | There were no unreported implementation outcomes according to those planned in the published protocol. |
Yoong 2016.
| Methods |
Trial name: CAFÉ Study design: Randomised controlled trial. Intervention duration: 12 months Length of follow‐up from baseline: To assess the primary trial outcome, data were collected at baseline (Feb–Oct 2013) and follow‐up (Sept 2014–Jan 2015). Differences in baseline characteristics: No differences in the baseline characteristics of participating schools in the intervention and control group were apparent Unit of allocation: Schools. Unit of analysis: Schools. |
|
| Participants |
School type: Primary schools. Region: The study was conducted in the Hunter New England Local Health District of New South Wales, Australia. Demographic/socioeconomic characteristics: The study region consisted of a socioeconomically and demographically diverse population of approximately 112,000 children aged 5–12 years. Inclusion/exclusion criteria: Inclusion: ‐ Rural or remote primary schools within areas within the study region. ‐ Having a canteen open at least one day per week. ‐ Were not compliant with the NSW Healthy School Canteen Policy, defined as either having at least one canteen menu item restricted for sale (‘red’ or ‘banned’ item) or having less than 50% of menu items classified as healthy (‘green’ items) (based on dietitian assessment of the supplied canteen menu). Exclusion: ‐ Schools enrolling both primary and secondary students. ‐ Schools catering exclusively for children requiring specialist care. Number of schools allocated: 72 Numbers by trial group: n (controls baseline) = 36 n (controls follow‐up) = 24 n (interventions baseline) = 36 n (interventions follow‐up) = 29 Recruitment: 72 schools Recruitment rate: 64% |
|
| Interventions |
Number of experimental conditions: 2 (1 intervention, 1 control). Policies, practices or programs targeted by the intervention: As part of the New South Wales obesity prevention strategy in 2005 the State government introduced the NSW Healthy School Canteen Policy called ‘Fresh Tastes @ School’. The policy was based on the 2003 Australian Dietary Guidelines and utilises a traffic light system to classify menu items as ‘red’, ‘amber’ or ‘green’ based on their nutritional profile (including energy, saturated fat, and/or salt). ‘Red’ items are typically nutrient poor, high‐energy foods; ‘amber’ items are considered to have some nutritional value, however if consumed in large amounts can contribute to excess energy intake, and ‘green’ items are those that are considered to be good sources of nutrients, such as fruit, vegetables and lean meats. The ‘Fresh Tastes @ School’ policy requires that schools: i) provide primarily ‘green’ items (> 50% of the menu) and ii) restrict the sale of ‘red’ foods and remove ‘banned’ drinks. Government primary schools are mandated to implement the policy, while implementation amongst non‐government schools is strongly encouraged. The efficacy of the intervention (implementation) strategies to facilitate the implementation of the Fresh Tastes @ School policy were tested in this trial. Implementation strategies: EPOC: Audit and feedback ‐ Menu audit: A dietitian who was blind to group allocation and not involved in the delivery of the intervention undertook audits of the canteen menus using a standardised template based on the ‘Fresh Tastes @ School’ policy. Canteen managers were requested to provide a copy of their menu and additional information needed to assess menu compliance with the ‘Fresh Tastes @ School’ policy (as described above). Additional phone contact was made by the dietitian as needed to obtain all necessary information to classify menu items as ‘red’, ‘banned’, ‘amber’ and ‘green’ according to the policy. Subsequent menu audits were planned for each term (four over a 12‐month period) with verbal and written feedback (described below) provided after each audit. Feedback report Dietitians developed a standard feedback report template which summarised whether or not the school menu complied with the ‘Fresh Tastes @ School’ policy. The feedback report was delivered via email or mail by a member of the health promotion team, depending on individual school preference. The report graphically displayed the proportion of ‘red’, ‘banned’, ‘amber’ and ‘green’ items on the menu and outlined the school’s compliance with the ‘Fresh Tastes @ School’ policy. Specific suggestions on how to change canteen menus to meet the requirements of the ‘Fresh Tastes @ School’ policy were provided including: healthy recipes, ideas about how to increase the number of ‘green’ items on their menu, and alternative food options to replace specific ‘red’ foods or ‘banned’ drinks. The health promotion staff also provided other useful resources based on canteen managers’ reported requirements, as assessed during the feedback calls (described below in ‘Resources’). EPOC: Continuous quality improvement ‐ Feedback calls: During the initial feedback call, the Health Promotion Officer reiterated the purpose of the report, discussed the results, clarified any unclear components, supported the canteen manager to undertake a goal‐setting process to identify key areas for improvement in order to improve compliance with the ‘Fresh Tastes @ School’ policy, and developed an action plan to overcome existing barriers to policy compliance. In all subsequent calls (two to four), the Health Promotion Officer tailored the discussion to the needs of the Canteen Manager based on previous contact; and monitored their actions and progress toward their goals, set new goals where required, or monitored compliance. Where possible, the same Health Promotion Officer provided support to the same school throughout the intervention period. Two of the five Health Promotion Officers had qualifications in nutrition and dietetics, however all support officers received the same training in implementing strategies to support organisational change processes and intervention delivery. EPOC: Education materials ‐ All intervention schools were provided with ‘Fresh Tastes @ School’ resources (including a Canteen Menu Planning guide, recipes, and a manual on financial management and food safety), healthy food guidelines, a menu planning template, sample policies and menus, pricing guides and a local suppliers buyer’s guide which lists foods that meet the ‘amber’ and ‘green’ criteria, developed by a state nutrition agency which provides canteen support to their member schools (Healthy Kids Association). EPOC: Tailored intervention ‐ The specific number of menu audits, feedback reports and calls provided was tailored depending on each school’s compliance with the guidelines and whether menu changes had occurred between the previous and planned menu audit; and the responsiveness of the canteen manager to the feedback (e.g. whether they declined to take feedback calls). Theoretical underpinning: The selection of specific canteen manager behaviour change techniques was based on Control Theory, which has previously been applied to audit and feedback interventions in healthcare settings. The theory suggests that the key behaviour change techniques to target knowledge gaps and skill barriers include: feedback on current performance, goal setting to allow comparison between current and target performance, and development of action plans to support target attainment. Description of control: Usual practice: Schools in the control group received the standard offer of professional development opportunities provided through the NSW Government’s Live Life Well @ School initiative. No support to implement the Fresh Tastes @ School was specifically provided by the local health promotion unit. |
|
| Outcomes |
Outcome relating to the implementation of school service policies, practices or programs: ‐ Proportion of schools having a canteen menu that did not contain any ‘red’ foods or ‘banned’ drinks ‐ Proportion of schools having a canteen menu that contained > 50% ‘green’ items as specified by the ‘Fresh Tastes @ School’ policy Data collection method: ‐ Menu audits were used to assess the primary trial outcome. Canteen managers were asked to supply their current canteen menu and participate in follow‐up telephone calls from dietitians to collect additional information required to assess menu compliance. If additional information was required to classify a menu item according to the policy, dietitians collected additional product information from canteen managers via phone or email using a standard data collection template. Validity of measure: Not reported/contains both objective assessments and self‐reports. Outcome relating to staff knowledge, skills or attitudes: Not reported. Outcome relating to cost: Not reported. Outcome relating to adverse consequences: Not reported. Outcome relating to child diet, physical activity or weight status: Not reported. |
|
| Notes |
Research funding: In‐kind funding was received by Hunter New England Population Health to support conduct of the trial. Some authors were Postdoctoral Research Fellows funded by the National Heart Foundation and the National Health and Medical Research Council Career Statistical support was funded by the Priority Research Centre for Health Behaviour. Conflicts of interest: The authors declare that they have no competing interests. |
|
| Risk of bias | ||
| Bias | Authors' judgement | Support for judgement |
| Random sequence generation (selection bias) | Low risk | Randomised controlled trial. The random sequence was produced using a computer‐generated randomisation schedule in Microsoft Excel. |
| Allocation concealment (selection bias) | Unclear risk | There is no information provided about allocation concealment and therefore it is unclear if allocation was concealed. |
| Blinding of participants and personnel (performance bias) All outcomes | High risk | Outcome group: Due to the nature of the intervention schools could not be blinded to group allocation and therefore at high risk of performance bias. |
| Blinding of outcome assessment (detection bias) All outcomes | Low risk | Outcome group: Menu audits were undertaken by dietitians blinded to group allocation. |
| Incomplete outcome data (attrition bias) All outcomes | Low risk | Outcome group: 19 of the 72 (26%) schools did not provide menus at follow‐up. There were no significant differences in baseline characteristics among schools that did and did not provide follow‐up data. |
| Selective reporting (reporting bias) | Low risk | There were no unreported implementation outcomes according to those planned in the published protocol. |
Young 2008.
| Methods |
Trial name: Trial of Activity for Adolescent Girls (TAAG). Study design: Cluster‐randomised controlled trial. Intervention duration: 2‐year study‐directed intervention (Fall 2003 to Spring 2005). A third‐year intervention used school and community personnel to direct intervention activities. Length of follow‐up from baseline: 2 years. Differences in baseline characteristics: The study population was diverse with the largest percentage of African‐American girls in Louisiana and South Carolina and the largest percentage of Hispanic girls in California and Arizona. Differences between groups at baseline were not presented. Unit of allocation: Schools. Unit of analysis: Classrooms and schools. |
|
| Participants |
School type: Schools (Middle).
Region: TAAG was conducted at six university‐based field sites representing diverse geographic locations and populations: Universities of Arizona, Maryland, Minnesota and South Carolina, San Diego State University and Tulane University. Demographic/socioeconomic characteristics: Not reported. Inclusion/exclusion criteria: ‐ Public middle schools (grades 6–8) were eligible if the majority of children enrolled lived in the community served by the school, so that the community component of the intervention would be relevant to them. ‐ Schools were excluded if they were unwilling or unable to respond to and report medical emergencies during the trial; plan to close or merge within 3 years, fewer than 90 girls in the 8th Grade, expected transience of > 38% in any given year or 35% over 2 years; does not offer physical education each semester for all grades; Fewer than 2 (year‐round schools) or 3 (semester‐based schools) physical education classes per week; participation in pilot testing of the study materials. ‐ Student exclusions included unable to read or understand questions in English, been told not to participate in or avoid exercise for health reasons, or have an existing medical condition; parent unwilling or unable to give consent; girls unwilling to assessment measurement. Number of schools allocated: 36. Numbers by trial group: n (controls baseline) = 18. n (controls follow‐up) = 18. n (interventions baseline) = 18. n (interventions follow‐up) = 18. Note: All 36 schools participated in the 6th‐grade measurements during Spring 2003 and in the 8th grade measurements during Spring 2005; however, only 34 schools participated in the 8th grade measurements during Spring 2006. Recruitment: Schools: 6 schools were recruited at each of the 6 field centres (36 schools in total). Of the 68 schools invited to participate, 41 agreed and the 36 most conveniently accessed from the university‐based research centres were selected. Students: In each of 36 schools (6 per field centre), 60 randomly selected sixth‐grade girls were invited at baseline to be measured with a goal of measuring at least 80% (48) of those girls. At the end of the 2‐year intervention (end point) and in the subsequent year (follow‐up), 120 randomly selected eighth‐grade girls per field centre will be invited to participate in the measurements. Recruitment rate: Schools: Of the 68 schools invited to participate, 41 agreed (60%) and the 36 most conveniently accessed from the university‐based research centres were selected. Students: During 2003 Spring, 60 girls per school were randomly chosen. A total of 1721 (79.7%) of the 2160 eligible girls consented and participated in the measurement. During 2005 Spring, 4123 girls were eligible for the student‐level measurements, and 3504 (85.0%) consented and participated in the measurements. During 2006 Spring, 3915 were eligible at the six study sites, and 3502 (89.5%) consented and participated in the measurements. The approximate doubling of the number of girls measured in each 8th‐grade survey compared to the 6th‐grade survey was purposeful and based on our determination that the smaller 6th‐grade sample would have little adverse effect on power. |
|
| Interventions |
Number of experimental conditions: 2 (1 intervention, 1 control). Policies, practices or programs targeted by the intervention: Adaptation of PE classes to meet TAAG objectives and implementation of health education lessons were assessed through structured observations throughout the academic year by TAAG staff and teacher surveys at the end of the school year (dose, fidelity and acceptability). Implementation strategies: EPOC: Education meetings: ‐ Health education, PE, science or homeroom teachers attended workshops to teach a series of six lessons that promoted development of behavioural skills associated with physical activity. Each health education lesson included an activity challenge (i.e. homework) in which students monitored a behaviour and set goals to increase their activity. EPOC: Education materials: ‐ PE teachers received instructional materials for PE lessons; social marketing efforts that included posters, flyers and special activities were launched to encourage overall physical activity and promote TAAG‐specific programs to students. EPOC: Educational outreach visits: ‐ PE teachers received regular on‐site support to conduct lessons that encouraged active participation of girls during PE classes and to promote out‐of‐class physical activity. EPOC: Inter‐professional education: ‐ Collaborations were created between schools, community agencies and TAAG university staff to increase girl‐focused physical activity programs outside of PE classes. EPOC: Local opinion leaders: ‐ Program champions were recruited and trained during the second intervention year, and they directed the intervention to enhance its sustainability in the third year. EPOC: Local consensus processes: ‐ Intervention goals were identified to indicate optimal intervention implementation. Goals varied by component, but essentially were set for 100% fidelity for delivery of the intervention by TAAG staff to teachers and 80% fidelity for delivery by teachers to the students. Theoretical underpinning: Social‐ecological model, operant learning theory, social cognitive theory, organisational change and diffusions of innovation. Description of control: Not reported but assume usual practice. |
|
| Outcomes |
Outcome relating to the implementation of school policies, practices or programs: Continuous ‐ Average number of physical activity programs Dichotomous ‐ Students were encouraged for out‐of‐PE‐class physical activity (percentage of classes) ‐ Teacher used strategies to minimise management time (% classes) ‐ Students were provided with choices (percentage of classes) ‐ Students were encouraged for in‐class physical activity (% classes) ‐ Student equipment ratio was appropriate for activity (% classes) ‐ Group sizes were appropriate for activity (percentage of classes) ‐ Percentage of school reporting collaborations Data collection method: Implementation of TAAG PE: Fidelity: Measured by observation. Implementation variable was observed ‘some’, ‘most’ or ‘all’ of class. Intervention goal = observation of 50% for item 1, 80% for all other items. Collaboration: Interview with Principal. Average number PE programs: Measured by surveys of physical activity program leaders at intervention and control schools. Validity of measures used: Trial used a combination of objective and self‐report components to assess implementation outcome. The self‐report components are reported as validated. Outcome relating to staff knowledge, skills or attitudes: Non‐assessed between groups. Outcome relating to cost: Not reported. Outcome relating to adverse consequences: Not reported. Outcome relating to child diet, physical activity or weight status: Physical activity and body composition. Data collection method: Physical activity: Assessed by accelerometer (Daily MET weighted minutes of MVPA). Sedentary minutes were defined as the number of minutes with less than light activity. Anthropometry: BMI, height, weight and percentage body fat. Standing height was measured without shoes using a portable stadiometer (Shorr Productions) to the nearest 0.1 cm. Body weight was assessed using a digital scale (Seca 880) and measured to the nearest 0.1 kg while the girl was dressed in light clothing without shoes. Triceps skinfold thickness was measured in triplicate on the right side of the body to the nearest 0.1 mm. BMI was calculated as weight (kg)/height (m2). Percentage body fat was estimated from anthropometric measures using an equation that was developed for use in girls in this age range. Validity of measure: Physical activity: Not reported. Anthropometry: Valid. |
|
| Notes |
Research funding: National Heart, Lung and Blood Institute; National Institutes of Health (U01HL66858, U01HL66857, U01HL66845, U01HL66856, U01HL66855, U01HL66853 and U01HL66852). Conflicts of interest: Authors report no conflicts of interest. |
|
| Risk of bias | ||
| Bias | Authors' judgement | Support for judgement |
| Random sequence generation (selection bias) | Unclear risk | Randomisation was stratified by field centre and by school district. The random sequence generation is not described. |
| Allocation concealment (selection bias) | Unclear risk | There is no information provided about allocation concealment and therefore it is unclear if allocation was concealed. |
| Blinding of participants and personnel (performance bias) All outcomes | High risk | Outcome group: There is no mention that participants or personnel were blinded to experimental group and therefore at high risk of performance bias. |
| Blinding of outcome assessment (detection bias) All outcomes | High risk | Outcome group: It is not reported that observers or participants were blind to group allocation. |
| Incomplete outcome data (attrition bias) All outcomes | Low risk | Outcome group: Low school attrition rate reported. All 36 schools participated in the measurements in 2003 and 2005 and 34 schools participated in 2006. |
| Selective reporting (reporting bias) | Low risk | There were no unreported implementation outcomes according to those planned in the published protocol. |
| Recruitment to cluster | Low risk | Individuals within each randomised cluster participated. |
| Baseline imbalance | Low risk | Schools were randomly allocated to condition and so risk of baseline imbalance is low. |
| Loss of cluster | Low risk | Two of the 36 schools in Louisiana were closed due to damage from Hurricane Katrina. There is no mention though to which condition these were assigned. |
| Incorrect analysis | Low risk | All analyses took into account the expected positive intraclass correlation among responses for students, teachers and classes in the same school and school‐ or community‐level responses within the same site. |
| Contamination | Low risk | The unit of randomisation is the school and so risk of contamination is low. |
| Compatibility with individually randomised RCTs | Unclear risk | Unable to determine if a herd effect exists. |
Characteristics of excluded studies [ordered by study ID]
| Study | Reason for exclusion |
|---|---|
| Aarestrup 2015 | Inappropriate outcomes |
| Adamowicz 2015 | Inappropriate outcomes |
| Amini 2015 | Inappropriate outcomes |
| Andersen 2015 | Inappropriate outcomes |
| Angelico 1991 | Inappropriate outcomes |
| Audrey 2004 | Inappropriate outcomes |
| Auld 1998 | Inappropriate outcomes |
| Auld 1999 | Inappropriate outcomes |
| Banchonhattakit 2009 | Inappropriate outcomes |
| Banning 2015 | Inappropriate outcomes |
| Baranowski 1997 | Non‐controlled study/inappropriate comparator |
| Baranowski 2000 | Non‐controlled study/inappropriate comparator |
| Baranowski 2000a | Inappropriate outcomes |
| Belansky 2010 | Non‐controlled study/inappropriate comparator |
| Belansky 2013 | Inappropriate participants OR inappropriate setting |
| Bere 2005 | Inappropriate outcomes |
| Bere 2006 | Inappropriate outcomes |
| Bindler 2009 | Inappropriate outcomes |
| Bindler 2012 | Inappropriate outcomes |
| Bogart 2016 | Inappropriate outcomes |
| Bourdeaudhuij 2015 | Inappropriate outcomes |
| Bourdeaudhuij 2015a | Inappropriate outcomes |
| Boyle‐Holmes 2010 | Inappropriate outcomes |
| Brandstetter 2012 | Inappropriate outcomes |
| Bukhari 2011 | Inappropriate outcomes |
| Burghardt 1993 | Does not report results of a trial |
| Burghardt 1995 | Inappropriate outcomes |
| Burke 1998 | Inappropriate outcomes |
| Busch 2015 | Inappropriate outcomes |
| Caballero 1998 | Does not report results of a trial |
| Campbell 2015 | Inappropriate outcomes |
| Cass 2003 | Inappropriate outcomes |
| Chatzisarantis 2015 | Inappropriate outcomes |
| Christian 2012 | Inappropriate outcomes |
| Coleman 2012 | Inappropriate outcomes |
| Condit 2015 | Inappropriate outcomes |
| Connell 1985 | Inappropriate outcomes |
| Conner 2013 | Inappropriate outcomes |
| Costigan 2015 | Inappropriate outcomes |
| da Costa 2014 | Inappropriate outcomes |
| Davis 1999 | Does not report results of a trial |
| Davis 2016 | Inappropriate outcomes |
| Day 2008 | Inappropriate outcomes |
| de Barros 2009 | Inappropriate outcomes |
| de Greeff 2016 | Inappropriate outcomes |
| DeVault 2009 | Inappropriate outcomes |
| Dewar 2013 | Inappropriate outcomes |
| Dishman 2005 | Inappropriate outcomes |
| Domel 1993 | Inappropriate outcomes |
| Donnelly 1996 | No baseline data, non‐randomised |
| Drapeau 2016 | Inappropriate outcomes |
| Dreyhaupt 2012 | Inappropriate outcomes |
| Dunn 2012 | Inappropriate participants OR inappropriate setting |
| Dunton 2014 | Inappropriate outcomes |
| Dwyer 1983 | Inappropriate outcomes |
| Dwyer 1996 | Inappropriate outcomes |
| Dzewaltowski 2002 | Inappropriate outcomes |
| Dzewaltowski 2009 | Inappropriate outcomes |
| Eather 2011 | Inappropriate outcomes |
| Eather 2013 | Inappropriate outcomes |
| Eather 2016 | Inappropriate outcomes |
| Edmundson 1996 | Inappropriate outcomes |
| Edmundson 1996a | Inappropriate outcomes |
| Eisenmann 2008 | Inappropriate outcomes |
| Elder 1996 | Inappropriate outcomes |
| Elinder 2012 | Inappropriate outcomes |
| Ellison 1989 | Inappropriate outcomes |
| Eriksen 2003 | Inappropriate outcomes |
| Ermetici 2016 | Inappropriate outcomes |
| Fardy 1996 | Inappropriate outcomes |
| Farias 2015 | Inappropriate outcomes |
| Farris 2014 | Non‐controlled study/inappropriate comparator |
| Flay 1989 | Inappropriate outcomes |
| Flynn 1992 | Inappropriate outcomes |
| Foster 2008 | Inappropriate outcomes |
| French 1997 | Non‐controlled study/inappropriate comparator |
| Fulkerson 2004 | Non‐controlled study/inappropriate comparator |
| Gatto 2015 | Inappropriate outcomes |
| Glover 2010 | Inappropriate outcomes |
| Going 2003 | Inappropriate outcomes |
| Gonzalvez 2015 | Inappropriate outcomes |
| Gordon 1995 | Inappropriate outcomes |
| Gortmaker 1999 | Inappropriate outcomes |
| Gortmaker 1999a | Inappropriate outcomes |
| Graham 2008 | Inappropriate intervention |
| Grasten 2015 | Inappropriate outcomes |
| Gray 2015 | Inappropriate outcomes |
| Griffin 2014 | Non‐controlled study/inappropriate comparator |
| Griffin 2015 | Inappropriate participants OR inappropriate setting |
| Gruber 2015 | Inappropriate outcomes |
| Grydeland 2014 | Inappropriate outcomes |
| Gunawardena 2016 | Inappropriate participants OR inappropriate setting |
| Guo 2015 | Inappropriate outcomes |
| Habib‐Mourad 2013 | Inappropriate outcomes |
| Habib‐Mourad 2014 | Inappropriate outcomes |
| Haerens 2007 | Inappropriate outcomes |
| Hamilton 2005 | Non‐controlled study/inappropriate comparator |
| Harrell 1996 | Inappropriate outcomes |
| Hartstein 2011 | Inappropriate outcomes |
| Harvey‐Berino 1998 | No baseline data, non‐randomised |
| Havas 1995 | Does not report results of a trial |
| Hayes 2015 | Inappropriate outcomes |
| Heath 2003 | Does not report results of a trial |
| Henauw 2015 | Inappropriate outcomes |
| Hodder 2012 | Inappropriate outcomes |
| Hoelscher 2001 | Does not report results of a trial |
| Hoelscher 2003 | No baseline data, non‐randomised |
| Hoelscher 2004 | No baseline data, non‐randomised |
| Hoelscher 2016 | Inappropriate outcomes |
| Hyndman 2014 | Inappropriate outcomes |
| Isensee 2014 | Inappropriate outcomes |
| Isensee 2015 | Inappropriate outcomes |
| Jago 2015 | Inappropriate intervention |
| Jamner 2004 | Inappropriate outcomes |
| Janssen 2015 | Inappropriate outcomes |
| Jarani 2016 | Inappropriate outcomes |
| Jemmott 2011 | Inappropriate outcomes |
| Jones 2014 | Inappropriate outcomes |
| Jurg 2006 | Inappropriate outcomes |
| Kaushik 2012 | Non‐controlled study/inappropriate comparator |
| Kelder 2003 | No baseline data, non‐randomised |
| Kellam 1998 | Inappropriate participants OR inappropriate setting |
| Kelly 2015 | Inappropriate outcomes |
| Killen 1996 | Inappropriate outcomes |
| Kim 2012 | Inappropriate outcomes |
| Kobel 2014 | Inappropriate outcomes |
| Kocken 2016 | Inappropriate outcomes |
| Kolbe 1995 | Does not report results of a trial |
| Krolner 2012 | Inappropriate outcomes |
| Krolner 2013 | Non‐controlled study/inappropriate comparator |
| Kustiani 2015 | Inappropriate outcomes |
| Larsen 2015 | Inappropriate outcomes |
| Laurence 2007 | Inappropriate outcomes |
| Lazorick 2015 | Inappropriate outcomes |
| Leatherdale 2014 | Non‐controlled study/inappropriate comparator |
| Leatherdale 2015 | Non‐controlled study/inappropriate comparator |
| Lee 2014 | Inappropriate outcomes |
| Lehto 2014 | Inappropriate intervention |
| Leiva 2014 | Inappropriate outcomes |
| Leme 2016 | Inappropriate participants OR inappropriate setting |
| Lerner‐Geva 2015 | Inappropriate outcomes |
| Li 2010 | Inappropriate outcomes |
| Li 2014 | Inappropriate outcomes |
| Lien 2010 | Inappropriate outcomes |
| Lionis 1991 | Inappropriate participants OR inappropriate setting |
| Lovato 2007 | Non‐controlled study/inappropriate comparator |
| Lubans 2005 | Inappropriate outcomes |
| Lubans 2010 | Inappropriate outcomes |
| Lubans 2014 | Inappropriate outcomes |
| Lubans 2015 | Inappropriate outcomes |
| Luepker 1988 | Inappropriate outcomes |
| Lytle 2003 | Does not report results of a trial |
| Madsen 2015 | Inappropriate intervention |
| Maher 2014 | Inappropriate outcomes |
| Mammen 2014 | Inappropriate outcomes |
| Manios 1999 | Inappropriate outcomes |
| Mayorga‐Vega 2015 | Inappropriate outcomes |
| McKenzie 2001 | Inappropriate outcomes |
| McKenzie 2004 | Inappropriate outcomes |
| Melnyk 2015 | Inappropriate outcomes |
| Midford 2014 | Inappropriate outcomes |
| Miller 2016 | Inappropriate outcomes |
| Moller 2014 | Inappropriate outcomes |
| Moore 2007 | Inappropriate outcomes |
| Moore 2008a | Inappropriate outcomes |
| Moore 2008b | Inappropriate outcomes |
| Morrill 2016 | Inappropriate outcomes |
| Moskowitz 1980 | Inappropriate outcomes |
| Moskowitz 1981 | Inappropriate outcomes |
| Moskowitz 1982 | Inappropriate intervention |
| Murphy 2011 | Inappropriate outcomes |
| Nadar 1996 | Inappropriate outcomes |
| Nader 1999 | Inappropriate outcomes |
| Nettlefold 2012 | Inappropriate outcomes |
| Newton 2016 | Inappropriate participants OR inappropriate setting |
| Nicklas 1997 | Does not report results of a trial |
| Nicklas 2000 | Inappropriate outcomes |
| Olsen 1976 | Non‐controlled study/inappropriate comparator |
| Oosthuizen 2011 | Inappropriate outcomes |
| Osganian 2003 | No baseline data, non‐randomised |
| Osganian 2003a | Non‐controlled study/inappropriate comparator |
| O’Brien 2010 | No baseline data, non‐randomised |
| Parcel 1995 | Inappropriate outcomes |
| Parcel 2003 | Inappropriate outcomes |
| Parham 1993 | Inappropriate outcomes |
| Passmore 2005 | Inappropriate outcomes |
| Patton 2003 | Inappropriate outcomes |
| Pearlman 2005 | Non‐controlled study/inappropriate comparator |
| Pentz, 1990 | Non‐controlled study/inappropriate comparator |
| Perez‐Rodrigo 2013 | Inappropriate outcomes |
| Perry 1992 | Inappropriate outcomes |
| Perry 1996 | Inappropriate outcomes |
| Perry 1998 | Inappropriate outcomes |
| Perry 2009 | Inappropriate outcomes |
| Peterson 2000 | Inappropriate outcomes |
| Peterson 2001 | Inappropriate outcomes |
| Peterson 2002 | Inappropriate outcomes |
| Pivarnik 1994 | Inappropriate outcomes |
| Plotnikoff 1999 | Inappropriate outcomes |
| Prelip 2012 | Inappropriate outcomes |
| Prell 2005 | Inappropriate outcomes |
| Presti 2015 | Inappropriate outcomes |
| Price 1998 | Inappropriate outcomes |
| Probart 1997 | Inappropriate outcomes |
| Puska 1982 | Inappropriate participants OR inappropriate setting |
| Radcliffe 2005 | Inappropriate outcomes |
| Rafferty 2014 | Inappropriate outcomes |
| Raizman 1994 | Does not report results of a trial |
| Raj 2009 | Inappropriate outcomes |
| Ramseier 2013 | Inappropriate participants OR inappropriate setting |
| Rao 2006 | Inappropriate outcomes |
| Raphael 2000 | Non‐controlled study/inappropriate comparator |
| Reddy 2002 | Inappropriate outcomes |
| Redmond 2009 | Inappropriate outcomes |
| Resnicow 1992 | Inappropriate outcomes |
| Resnicow 1993 | Inappropriate outcomes |
| Reynolds 2000 | Inappropriate outcomes |
| Reynolds 2000a | Inappropriate outcomes |
| Rhodes 2010 | Non‐controlled study/inappropriate comparator |
| Ridgers 2007 | Inappropriate outcomes |
| Riley 2016 | Inappropriate outcomes |
| Ringwalt 2009 | Inappropriate outcomes |
| Rissel 2012 | Inappropriate outcomes |
| Robbins 2012 | Inappropriate outcomes |
| Robbins 2014 | Inappropriate outcomes |
| Robert 2006 | Inappropriate participants OR inappropriate setting |
| Rogers 2007 | Inappropriate outcomes |
| Romero 1994 | Inappropriate outcomes |
| Rosario 2012 | Inappropriate outcomes |
| Rosario 2012a | Inappropriate outcomes |
| Rosario 2013 | Inappropriate outcomes |
| Rosario 2016 | Inappropriate outcomes |
| Rosenbaum 2007 | Inappropriate outcomes |
| Rosenkranz 2012 | Inappropriate outcomes |
| Roseveare 1999 | Inappropriate outcomes |
| Rothwell 2011 | Inappropriate outcomes |
| Rowlands 2008 | Inappropriate participants OR inappropriate setting |
| Ruzita 2007 | Inappropriate outcomes |
| Sahota 2001 | Inappropriate outcomes |
| Sahota 2001a | Non‐controlled study/inappropriate comparator |
| Saint‐Maurice 2014 | Inappropriate outcomes |
| Sallis 2003 | Inappropriate outcomes |
| Salmon 2005 | Inappropriate outcomes |
| Salmon 2011 | Inappropriate outcomes |
| Sanchez 2007 | Inappropriate outcomes |
| Sanigorski 2008 | Inappropriate outcomes |
| Schneider 2009 | Inappropriate outcomes |
| Seaman 1995 | Inappropriate outcomes |
| Shahnazi 2016 | Inappropriate outcomes |
| Sharma 2015 | Inappropriate outcomes |
| Sheetz 2003 | Non‐controlled study/inappropriate comparator |
| Shensa 2016 | Inappropriate outcomes |
| Singh 2006 | Inappropriate outcomes |
| Singh 2009 | Inappropriate outcomes |
| Singhal 2010 | Inappropriate outcomes |
| Sirikulchayanonta 2011 | Non‐controlled study/inappropriate comparator |
| Smith 2001 | Does not report results of a trial |
| Smith 2015 | Non‐controlled study/inappropriate comparator |
| Somsri 2016 | Inappropriate outcomes |
| Springer 2013 | Inappropriate outcomes |
| Stead 2007 | Inappropriate outcomes |
| Steckler 2003 | Inappropriate outcomes |
| Stone 1994 | Inappropriate outcomes |
| Story 2002 | Inappropriate outcomes |
| Stratton 2005 | Inappropriate outcomes |
| Suchert 2015 | Inappropriate outcomes |
| Sussman 1993 | Inappropriate outcomes |
| Sussman 2007 | Inappropriate outcomes |
| Sutherland 2016 | Inappropriate outcomes |
| Sy 2008 | Non‐controlled study/inappropriate comparator |
| Tahlil 2015 | Inappropriate outcomes |
| Taylor 2007 | Inappropriate outcomes |
| Te Velde 2008 | Inappropriate outcomes |
| Telford 2013 | Non‐controlled study/inappropriate comparator |
| Telford 2016 | Inappropriate participants OR inappropriate setting |
| Toftager 2014 | Inappropriate outcomes |
| Uys 2016 | Inappropriate outcomes |
| Valente 2006 | Inappropriate intervention |
| Vardanjani 2015 | Inappropriate outcomes |
| Velicer 2007 | Inappropriate outcomes |
| Verbestel 2015 | Inappropriate outcomes |
| Vetter, 2015 | Inappropriate outcomes |
| Veugelers 2005 | Non‐controlled study/inappropriate comparator |
| Viggiano 2015 | Inappropriate outcomes |
| Villa‐González 2016 | Inappropriate outcomes |
| Volpe 2013 | Non‐controlled study/inappropriate comparator |
| Walter 1988 | Inappropriate outcomes |
| Wang 2015 | Inappropriate outcomes |
| Wang 2015a | Inappropriate outcomes |
| Wechsler 1998 | Inappropriate participants OR inappropriate setting |
| Wechsler 2001 | Inappropriate outcomes |
| Weichold 2016 | Inappropriate outcomes |
| Weiss 2015 | Inappropriate participants OR inappropriate setting |
| Welk 2015 | Inappropriate intervention |
| Werch 1998 | Inappropriate participants OR inappropriate setting |
| Whitt‐Glover 2011 | Non‐controlled study/inappropriate comparator |
| Whittemore 2013 | Non‐controlled study/inappropriate comparator |
| Williams 2011 | Inappropriate outcomes |
| Williamson 2013 | Inappropriate outcomes |
| Wind 2008 | Non‐controlled study/inappropriate comparator |
| Xu 2015 | Inappropriate outcomes |
| Zask 2012 | Inappropriate participants OR inappropriate setting |
| Zebregs 2015 | Inappropriate outcomes |
| Zive 2002 | Inappropriate outcomes |
| Zota 2016 | Inappropriate outcomes |
Characteristics of ongoing studies [ordered by study ID]
Lonsdale 2016.
| Trial name or title | Scaling‐up an efficacious school‐based physical activity intervention: Study protocol for the ‘Internet‐based Professional Learning to help teachers support Activity in Youth’ (iPLAY) cluster randomized controlled trial and scale‐up implementation evaluation |
| Methods | Study design: Two complementary studies will be conducted and evaluated alongside each other. |
| Participants |
School type: Primary. Region: New South Wales (NSW), Australia. |
| Interventions |
Number of experimental conditions: 2 (1 intervention, 1 control). Policies, practices or programs targeted by the intervention: The program targeted by the intervention is a modified version of the SCORES program. SCORES was a comprehensive, multicomponent physical activity and fundamental movement skills program for primary schools. The modified intervention centres around online delivery of professional learning to teachers. The modified intervention will be known as iPLAY (Internet‐based Professional Learning to help teachers to support Activity in Youth) and will be facilitated by various implementation strategies/interventions. Implementation strategies: ‐ Professional learning ‐ Rewards for teachers ‐ Action plan ‐ Individualised mentoring to primary teachers and feedback ‐ Peer observations and group discussions ‐ Prompts and self‐reflection ‐ Online learning and resources ‐ Social marketing |
| Outcomes |
Outcome relating to the implementation of childcare service policies, practices or programs: ‐ A range of implementation outcomes will be collected and may be appropriate for inclusion. |
| Starting date | Enrolments began: 13/06/2016 |
| Contact information | A/Prof Chris Lonsdale, Institute for Positive Psychology and Education, Australian Catholic University, Locked Bag 2002, Strathfield NSW 2135 |
| Notes |
Trial registration: Australia and New Zealand Clinical Trials Registry ( ACTRN12616000731493 ). Date of registration: June 3, 2016. |
Differences between protocol and review
While the reference lists of included trials were searched, we did not perform forward citation searches.
While a search of the grey literature was conducted, we did not execute a search of the Healthcare Management Information Consortium (HMIC) as we could not obtain access to this database. Moreover, the Applied Social Sciences Index and Abstracts (ASSIA) database was not searched. In their absence, we ran searches in additional databases not listed in the protocol including SCOPUS, Dissertations and Theses, ERIC, Embase Classic and MEDLINE In Progress.
Given the considerable heterogeneity and complexity of the included studies we did not make a judgement about the overall risk of bias of included studies. Instead we simply reportED risk of bias against each criteria described in the methods for each included study.
A newer version of the EPOC taxonomy was published in 2015 and we used this version in preference to its predecessor to classify implementation strategies in the review.
We utilised data provided on request by trial authors where such information was not reported in the study manuscript. However, we did not attempt to impute missing data to facilitate pooled analysis as meta‐analysis of trial outcomes was not performed.
We identified any cluster‐trials with unit of analysis issues in the 'Risk of bias' tables. We did not calculate the effective sample size of such trials or attempt to re‐calculate the effects of such interventions as no pooled analysis was conducted.
Contributions of authors
All review authors contributed to the conception and conduct of the research. LW and CW led the development of the review. DB developed the search strategy. CW, AF, AG, LW, NN, RS, RW, RH, SY, and TD contributed to the selection of studies. CW, LW, NN, PB, RS, RW, SY, RH and TD contributed to data extraction and management. AG, AF, FT, LW and TCM contributed to the assessment of the risk of bias of included studies. LW, RH and CW contributed to the assessment of the overall quality of evidence. LW led the drafting of the manuscript. All authors provided critical comment on drafts.
Sources of support
Internal sources
-
University of Newcastle, Australia.
Salary support for review authors
-
Hunter New England Population Health, Australia.
Salary support for review authors
-
Hunter Medical Research Institute, Australia.
Salary support for review authors
-
University of Sydney, Australia.
Salary support for review authors
-
NSW Ministry of Health, Australia.
Salary support for review authors
-
NSW Cancer Council, Australia.
Salary support for review authors
External sources
-
The Australian Prevention Partnership Council, Australia.
This research was supported by The Australian Prevention Partnership Centre through the NHMRC partnership centre grant scheme (Grant ID: GNT9100001) with the Australian Government Department of Health, NSW Ministry of Health, ACT Health, HCF and the HCF Research Foundation.
-
National Health and Medical Research Council, Australia.
Author LW is supported by a NHMRC Career Development Fellowship (Grant ID: APP1128348) and Heart Foundation Future Leader Fellowship (Grant ID: 101175)
-
National Health and Medical Research Council, Australia.
Author NN is supported by a NHMRC Translating Research into Practice Fellowship (APP1132450)
-
Heart Foundation, Australia.
Author SY is supported by a Heart Foundation Postdoctoral Fellowship (ID: 100547)
-
Cancer Institute New South Wales, Australia.
Author FT is supported by a Cancer Institute New South Wales Early Career Fellowship (15/ECF/1‐44)
-
National Health and Medical Research Council, Australia.
Author CW is supported by a NHMRC Early Career Fellowship (ID: APP1113272)
Declarations of interest
Some members of the review team are currently undertaking a series of randomised trials aiming to facilitate the implementation of healthy eating and physical activity policies and practices by schools. Authors LW, NN, RS, SLY, RH, RW, TD, PB, JW, AM, CMW are authors on one or more of the five trials conducted in Australia (Nathan 2012; Nathan 2016; Sutherland 2017; Wolfenden 2017; Yoong 2016). For such trials, data were extracted by review authors who were not directly involved in these studies. The authors have not received any benefit, in cash or kind, any hospitality, or any subsidy derived from any source perceived to have an interest in the outcome of the review. All authors have contributed to the development of evaluation of trials examining the impact of implementation strategies in community settings, including those conducted in schools. All authors declare no other potential conflicts of interest.
Edited (no change to conclusions)
References
References to studies included in this review
Alaimo 2015 {published data only}
- Alaimo K, Oleksyk S, Golzynski D, Drzal N, Lucarelli J, Reznar M, et al. The Michigan healthy school action tools process generates improvements in school nutrition policies and practices, and student dietary intake. Health Promotion Practice 2015;16(3):401‐10. [DOI] [PubMed] [Google Scholar]
- Alaimo K, Oleksyk SC, Drzal NB, Golzynski DL, Lucarelli JF, Wen Y, et al. Effects of changes in lunch‐time competitive foods, nutrition practices, and nutrition policies on low‐income middle‐school children's diets. Childhood Obesity 2013;9(6):509‐23. [DOI] [PubMed] [Google Scholar]
Cunningham‐Sabo 2003 {published data only}
- Caballero B, Clay T, Davis SM, Ethelbah B, Rock BH, Lohman T, et al. Pathways: a school‐based, randomized controlled trial for the prevention of obesity in American Indian schoolchildren. American Journal of Clinical Nutrition 2003;78(5):1030‐8. [DOI] [PMC free article] [PubMed] [Google Scholar]
- Cunningham‐Sabo L, Snyder MP, Anliker J, Thompson J, Weber JL, Thomas O, et al. Impact of the Pathways food service intervention on breakfast served in American‐Indian schools. Preventive Medicine 2003;37:S46‐54. [DOI] [PubMed] [Google Scholar]
- Davis CE, Hunsberger S, Murray DM, Fabsitz RR, Himes JH, Stephenson LK, et al. Design and statistical analysis for the Pathways study. American Journal of Clinical Nutrition 1999;69(4):S760‐3. [DOI] [PubMed] [Google Scholar]
- Stevens J, Story M, Ring K, Murray DM, Cornell CE, Gittelsohn J. The impact of the Pathways intervention on psychosocial variables related to diet and physical activity in American Indian schoolchildren. Preventive Medicine 2003;37:S70‐9. [DOI] [PubMed] [Google Scholar]
- Story M, Snyder MP, Anliker J, Weber JL, Cunningham‐Sabo L, Stone EJ, et al. Changes in the nutrient content of school lunches: results from the Pathways study. Preventive Medicine 2003;37:S35‐45. [DOI] [PubMed] [Google Scholar]
Delk 2014 {published data only}
- Delk J, Springer AE, Kelder SH, Grayless M. Promoting teacher adoption of physical activity breaks in the classroom: findings of the Central Texas CATCH Middle School Project. Journal of School Health 2014;84(11):722‐30. [DOI] [PubMed] [Google Scholar]
De Villiers 2015 {published data only}
- Draper CE, Villiers A, Lambert EV, Fourie J, Hill J, Dalais L, et al. HealthKick: a nutrition and physical activity intervention for primary schools in low‐income settings. BMC Public Health 2010;10:398. [DOI] [PMC free article] [PubMed] [Google Scholar]
- Steyn NP, Villiers A, Gwebushe N, Draper CE, Hill J, Waal M, et al. Did HealthKick, a randomised controlled trial primary school nutrition intervention improve dietary quality of children in low‐income settings in South Africa?. BMC Public Health 2015;15:948. [DOI] [PMC free article] [PubMed] [Google Scholar]
- Villiers A, Steyn NP, Draper CE, Hill J, Dalais L, Fourie J, et al. Implementation of the HealthKick intervention in primary schools in low‐income settings in the Western Cape Province, South Africa: a process evaluation. BMC Public Health 2015;15:818. [DOI] [PMC free article] [PubMed] [Google Scholar]
French 2004 {published data only}
- French SA, Story M, Fulkerson JA, Hannan P. An environmental intervention to promote lower‐fat food choices in secondary schools: outcomes of the TACOS Study. American Journal of Public Health 2004;94(9):1507‐12. [DOI] [PMC free article] [PubMed] [Google Scholar]
Gingiss 2006 {published data only}
- Boerm M, Gingiss P. Status of school tobacco prevention and control two years after the beginning of the Texas Tobacco Prevention Initiative: comparisons of intervention and comparison schools. Available at: http://uh.edu/hnets/TobaccoSchEval.html. Accessed April 25 2003.
- Gingiss P, Boerm M, Roberts‐Gray C. Follow‐up comparisons of intervention and comparison schools in a state tobacco prevention and control Initiative. Journal of School Health 2006;76(3):98‐103. [DOI] [PubMed] [Google Scholar]
Heath 2002 {published data only}
- Brown HS, Perez A, Li YP, Hoelscher DM, Kelder SH, Rivera R. The cost‐effectiveness of a school‐based overweight program. International Journal of Behavioral Nutrition and Physical Activity 2007;4(1):47. [DOI] [PMC free article] [PubMed] [Google Scholar]
- Coleman KJ, Tiller CL, Sanchez J, Heath EM, Sy O, Milliken G, et al. Prevention of the epidemic increase in child risk of overweight in low‐income schools: the El Paso coordinated approach to child health. Archives of Pediatrics & Adolescent Medicine 2005;159(3):217‐24. [DOI] [PubMed] [Google Scholar]
- Heath EM, Coleman KJ. Evaluation of the institutionalization of the coordinated approach to child health (CATCH) in a US/Mexico border community. Health Education & Behavior 2002;29(4):444‐60. [DOI] [PubMed] [Google Scholar]
Hoelscher 2010 {published data only}
- Hoelscher DM, Springer AE, Ranjit N, Perry CL, Evans AE, Stigler M, et al. Reductions in child obesity among disadvantaged school children with community involvement: the Travis County CATCH Trial. Obesity 2010;18(S1):S36‐44. [DOI] [PubMed] [Google Scholar]
Lytle 2006 {published data only}
- Birnbaum AS, Lytle LA, Story M, Perry CL, Murray DM. Are differences in exposure to a multicomponent school‐based intervention associated with varying dietary outcomes in adolescents?. Health Education & Behavior 2002;29(4):427‐43. [DOI] [PubMed] [Google Scholar]
- Lytle LA, Kubik MY, Perry C, Story M, Birnbaum AS, Murray DM. Influencing healthful food choices in school and home environments: results from the TEENS study. Preventive Medicine 2006;43(1):8‐13. [DOI] [PubMed] [Google Scholar]
- Lytle LA, Murray DM, Perry CL, Story M, Birnbaum AS, Kubik MY, et al. School‐based approaches to affect adolescents’ diets: results from the TEENS study. Health Education & Behavior 2004;31(2):270‐87. [DOI] [PubMed] [Google Scholar]
Mathur 2016 {published data only}
- Mathur N, Pednekar M, Sorensen G, Nagler E, Stoddard A, Lando H. Adoption and Implementation of Tobacco Control Policies in Schools in India: Results of the Bihar School Teachers Study. Asian Pacific Journal of Cancer Prevention 2016;17(6):2821‐6. [PubMed] [Google Scholar]
- Nagler EM, Pednekar MS, Viswanath K, Sinha DN, Aghi MB, Pischke CR. Designing in the social context: using the social contextual model of health behavior change to develop a tobacco control intervention for teachers in India. Health Education Research 2012;28(1):113‐29. [DOI] [PMC free article] [PubMed] [Google Scholar]
- Pawar PS, Nagler EM, Gupta PC, Stoddard AM, Lando HA, Shulman L. Tracking intervention delivery in the ‘Tobacco‐Free Teachers/Tobacco‐Free Society’program, Bihar, India. Health Education Research 2015;30(5):731‐41. [DOI] [PMC free article] [PubMed] [Google Scholar]
- Sorensen G, Pednekar MS, Sinha DN, Stoddard AM, Nagler E, Aghi MB. Effects of a tobacco control intervention for teachers in India: results of the Bihar school teachers study. American Journal of Public Health 2013;103(11):2035‐40. [DOI] [PMC free article] [PubMed] [Google Scholar]
McCormick 1995 {published data only}
- McCormick LK, Steckler AB, McLeroy KR. Diffusion of innovations in schools: A study of adoption and implementation of school‐based tobacco prevention curricula. American Journal of Health Promotion 1995;9(3):210‐9. [DOI] [PubMed] [Google Scholar]
- Smith DW, McCormick LK, Steckler AB, McLeroy KR. Teachers' use of health curricula: implementation of Growing Healthy, Project SMART, and the Teenage Health Teaching Modules. Journal of School Health 1993;63(8):349‐54. [DOI] [PubMed] [Google Scholar]
Mobley 2012 {published data only}
- DeBar LL, Schneider M, Ford EG, Hernandez AE, Showell B, Drews KL, et al. Social marketing‐based communications to integrate and support the HEALTHY study intervention. International Journal of Obesity 2009;33:S52‐9. [DOI] [PMC free article] [PubMed] [Google Scholar]
- Drews KL, Harrell JS, Thompson D, Mazzuto SL, Ford EG, Carter M, et al. Recruitment and retention strategies and methods in the HEALTHY study. International Journal of Obesity 2009;33:S21‐8. [DOI] [PMC free article] [PubMed] [Google Scholar]
- Gillis B, Mobley C, Stadler DD, Hartstein J, Virus A, Volpe SL. Rationale, design and methods of the HEALTHY study nutrition intervention component. International Journal of Obesity 2009;33:29‐36. [DOI] [PMC free article] [PubMed] [Google Scholar]
- HEALTHY Study Group. A school‐based intervention for diabetes risk reduction. New England Jorunal of Medicine 2010;363:443‐53. [DOI] [PMC free article] [PubMed] [Google Scholar]
- HEALTHY Study Group. HEALTHY study rationale, design and methods: moderating risk of type 2 diabetes in multi‐ethnic middle school students. International Journal of Obesity 2009;33:S4. [DOI] [PMC free article] [PubMed] [Google Scholar]
- Hernandez AE, Marcus MD, Hirst K, Faith MS, Goldberg L, Trevino RP. Impact of implementation and conduct of the HEALTHY primary prevention trial on student performance. American Journal of Health Promotion 2014;29(1):55‐8. [DOI] [PMC free article] [PubMed] [Google Scholar]
- Mobley CC, Stadler DD, Staten MA, Gillis B, Hartstein J, Siega‐Riz AM, et al. Effect of nutrition changes on foods selected by students in a middle school‐based diabetes prevention intervention program: The HEALTHY Experience. Journal of School Health 2012;82(2):82‐90. [DOI] [PMC free article] [PubMed] [Google Scholar]
- Siega‐Riz AM, Ghormli L, Mobley C, Gillis B, Stadler D, Hartstein J. The effects of the HEALTHY study intervention on middle school student dietary intakes. International Journal of Behavioral Nutrition and Physical Activity 2011;8(1):7. [DOI] [PMC free article] [PubMed] [Google Scholar]
- Trevino RP, Pham T, Mobley C, Hartstein J, Ghormli LE, Songer T. HEALTHY study school food service revenue and expense report. Journal of School Health 2012;82(9):417‐23. [DOI] [PMC free article] [PubMed] [Google Scholar]
Nathan 2012 {published data only}
- Nathan N, Wolfenden L, Bell AC, Wyse R, Morgan PJ, Butler M, et al. Effectiveness of a multi‐strategy intervention in increasing the implementation of vegetable and fruit breaks by Australian primary schools: a non‐randomized controlled trial. BMC Public Health 2012;12:651. [DOI] [PMC free article] [PubMed] [Google Scholar]
Nathan 2016 {published data only}
- Nathan N, Yoong SL, Sutherland R, Reilly K, Delaney T, Janssen L. Effectiveness of a multicomponent intervention to enhance implementation of a healthy canteen policy in Australian primary schools: a randomised controlled trial. International Journal of Behavioral Nutrition and Physical Activity 2016;13(1):106. [DOI] [PMC free article] [PubMed] [Google Scholar]
Naylor 2006 {published data only}
- Kravetsky LB. Targeting childhood obesity through a school‐based physical activity intervention: Action Schools! BC [Masters thesis]. Targeting Childhood Obesity Through a School‐Based Physical Activity Intervention: Action Schools! BC [Masters thesis]. University of British Columbia, 2006. [Google Scholar]
- Naylor PJ, Macdonald HM, Reed KE, McKay HA. Action Schools! BC: a socioecological approach to modifying chronic disease risk factors in elementary school children. Preventing Chronic Disease: Public Health Research, Practice and Policy 2006;3(2):60. [PMC free article] [PubMed] [Google Scholar]
- Naylor PJ, Macdonald HM, Warburton DE, Reed KE, McKay HA. An active school model to promote physical activity in elementary schools: action schools! BC. British Journal of Sports Medicine 2008;42(5):338‐43. [DOI] [PubMed] [Google Scholar]
- Naylor PJ, Macdonald HM, Zebedee JA, Reed KE, McKay HA. Lessons learned from Action Schools! BC—–An‘active school’ model to promote physicalactivity in elementary schools. Journal of Science and Medicine in Sport 2006;9(5):413‐23. [DOI] [PubMed] [Google Scholar]
- Reed KE, Warburton DE, Macdonald HM, Naylor PJ, McKay HA. Action Schools! BC: a school‐based physical activity intervention designed to decrease cardiovascular disease risk factors in children. Preventive Medicine 2008;46(6):525‐31. [DOI] [PubMed] [Google Scholar]
Perry 1997 {published data only}
- Edmundson EW, Luton SC, McGraw SA, Kelder SH, Layman AK, Smyth MH, et al. CATCH: classroom process evaluation in a multicenter trial. Health Education & Behavior 1994;21(S1):S27‐50. [DOI] [PubMed] [Google Scholar]
- Luepker RV, Perry CL, McKinlay SM, Nader PR, Parcel GS, Stone EJ, et al. Outcomes of a field trial to improve children's dietary patterns and physical activity: the Child and Adolescent Trial for Cardiovascular Health (CATCH). JAMA 1996;275(10):768‐76. [DOI] [PubMed] [Google Scholar]
- Luepker RV, Perry CL, Osganian V, Nader PR, Parcel GS, Stone EJ, et al. The child and adolescent trial for cardiovascular health (CATCH). Journal of Nutritional Biochemistry 1998;9(9):525‐34. [Google Scholar]
- Lytle LA, Johnson CC, Bachman K, Wambsgans K, Perry CL, Stone EJ, et al. Successful recruitment strategies for school‐based health promotion: experiences from CATCH. Journal of School Health 1994;64(10):405‐9. [DOI] [PubMed] [Google Scholar]
- Lytle LA, Stone EJ, Nichaman MZ, Perry CL, Montgomery DH, Nicklas TA, et al. Changes in nutrient intakes of elementary school children following a school‐based intervention: results from the CATCH Study. Preventive Medicine 1996;25(4):465‐77. [DOI] [PubMed] [Google Scholar]
- McKenzie TL, Nader PR, Strikmiller PK, Yang M, Stone EJ, Perry CL, et al. School physical education: effect of the Child and Adolescent Trial for Cardiovascular Health. Preventive Medicine 1996;25(4):423‐31. [DOI] [PubMed] [Google Scholar]
- Nicklas TA, Dwyer J, Mitchell P, Zive M, Montgomery D, Lytle L, et al. Impact of fat reduction on micronutrient density of children's diets: the CATCH Study. Preventive Medicine 1996;25(4):478‐85. [DOI] [PubMed] [Google Scholar]
- Osganian SK, Ebzery MK, Montgomery DH, Nicklas TA, Evans MA, Mitchell PD, et al. Changes in the nutrient content of school lunches: results from the CATCH Eat Smart Food service Intervention. Preventive Medicine 1996;25(4):400‐12. [DOI] [PubMed] [Google Scholar]
- Perry CL, Sellers DE, Johnson C, Pedersen S, Bachman KJ, Parcel GS, et al. The Child and Adolescent Trial for Cardiovascular Health (CATCH): intervention, implementation, and feasibility for elementary schools in the United States. Health Education & Behavior 1997;24(6):716‐35. [DOI] [PubMed] [Google Scholar]
- Webber LS, Osganian SK, Feldman HA, Wu M, McKenzie TL, Nichaman M, et al. Cardiovascular risk factors among children after a 2 1/2‐year intervention—the CATCH study. Preventive Medicine 1996;25(4):432‐41. [DOI] [PubMed] [Google Scholar]
Perry 2004 {published data only}
- Perry CL, Bishop DB, Taylor GL, Davis M, Story M, Gray C, et al. A randomized school trial of environmental strategies to encourage fruit and vegetable consumption among children. Health Education & Behavior 2004;31(1):65‐76. [DOI] [PubMed] [Google Scholar]
Sallis 1997 {published data only}
- McKenzie TL, Sallis JF, Faucette N, Roby JJ, Kolody B. Effects of a curriculum and inservice program on the quantity and quality of elementary physical education classes. Research Quarterly for Exercise and Sport 1993;64(2):178‐87. [DOI] [PubMed] [Google Scholar]
- McKenzie TL, Sallis JF, Kolody B, Faucette FN. Long‐term effects of a physical education curriculum and staff development program: SPARK. Research Quarterly for Exercise and Sport 1997;68(4):280‐91. [DOI] [PubMed] [Google Scholar]
- Sallis JE, McKencie TL, Alcarez JE, Kolody B, Hovell MF, Nader PR. Project Spark‐Effects of Physical exercise on adiposity in children. Prevention and treatment of childhood obesity. Annuals of the New York Academy of Sciences 1993;299:127‐36. [DOI] [PubMed] [Google Scholar]
- Sallis JF, McKenzie TL, Alcaraz JE, Kolody B, Faucette N, Hovell MF. The effects of a 2‐year physical education program (SPARK) on physical activity and fitness in elementary school students. Sports, Play and Active Recreation for Kids. American Journal of Public Health 1997;87(8):1328‐34. [DOI] [PMC free article] [PubMed] [Google Scholar]
Saraf 2015 {published data only}
- Saraf DS, Gupta SK, Pandav CS, Nongkinrih B, Kapoor SK, Pradhan SK, et al. Effectiveness of a school based intervention for prevention of non‐communicable diseases in middle school children of rural North India: a randomized controlled trial. Indian Journal of Pediatrics 2015;82(4):354‐62. [DOI] [PubMed] [Google Scholar]
Saunders 2006 {published data only}
- Pate RR, Ward DS, Saunders RP, Felton G, Dishman RK, Dowda M. Promotion of physical activity among high‐school girls: a randomized controlled trial. American Journal of Public Health 2005;95(9):1582‐7. [DOI] [PMC free article] [PubMed] [Google Scholar]
- Saunders RP, Ward D, Felton GM, Dowda M, Pate RR. Examining the link between program implementation and behavior outcomes in the lifestyle education for activity program (LEAP). Evaluation and Program Planning 2006;29(4):352‐64. [DOI] [PubMed] [Google Scholar]
- Ward DS, Saunders R, Felton GM, Williams E, Epping JN, Pate RR. Implementation of a school environment intervention to increase physical activity in high school girls. Health Education Research 2006;21(6):896‐910. [DOI] [PubMed] [Google Scholar]
Simons‐Morton 1988 {published data only}
- Parcel GS, Simons‐Morton B, O'Hara NM, Baranowski T, Wilson B. School promotion of healthful diet and physical activity: impact on learning outcomes and self‐reported behavior. Health Education Quarterly 1989;16(2):181‐99. [DOI] [PubMed] [Google Scholar]
- Parcel GS, Simons‐Morton BG, O'Hara NM, Baranowski T, Kolbe LJ, Bee DE. School promotion of healthful diet and exercise behavior: an integration of organizational change and social learning theory interventions. Journal of School Health 1987;57(4):150‐6. [DOI] [PubMed] [Google Scholar]
- Simons‐Morton BG, Parcel GS, Baranowski T, Forthofer R, O'Hara NM. Promoting physical activity and a healthful diet among children: results of a school‐based intervention study. American Journal of Public Health 1991;81(8):986‐91. [DOI] [PMC free article] [PubMed] [Google Scholar]
- Simons‐Morton BG, Parcel GS, O'Hara NM. Implementing organizational changes to promote healthful diet and physical activity at school. Health Education Quarterly 1988;15(1):115‐30. [DOI] [PubMed] [Google Scholar]
Story 2000 {published data only}
- Perry CL, Bishop DB, Taylor G, Murray DM, Mays RW, Dudovitz BS, et al. Changing fruit and vegetable consumption among children: the 5‐a‐Day Power Plus program in St. Paul, Minnesota. American Journal of Public Health. 1998;88(4):603‐9. [DOI] [PMC free article] [PubMed] [Google Scholar]
- Story M, Mays RW, Bishop DB, Perry CL, Taylor G, Smyth M, et al. 5‐a‐day Power Plus: process evaluation of a multicomponent elementary school program to increase fruit and vegetable consumption. Health Education & Behavior 2000;27(2):187‐200. [DOI] [PubMed] [Google Scholar]
Sutherland 2017 {published data only}
- Sutherland RL, Wolfenden L, Lubans DR, Cohen K, Davies LJ, Desmet C. A randomized trial of an intervention to facilitate the implementation of school‐based practices known to increase students' moderate‐to‐vigorous physical activity. American Journal of Preventive Medicine (in press). [DOI] [PubMed]
Whatley Blum 2007 {published data only}
- Davee AM, Whatley Blum JE, Devore RL, Beaudoin CM, Kaley LA, Leiter JL. The vending and a la carte policy intervention in Maine public high schools. Preventing Chronic Disease 2005;2:Spec no:A14. Epub 2005 Nov 1. [PMC free article] [PubMed] [Google Scholar]
- Whatley Blum JE, Davee AM, Beaudoin CM, Jenkins PL, Kaley LA, Wigand DA. Reduced availability of sugar‐sweetened beverages and diet soda has a limited impact on beverage consumption patterns in Maine high school youth. Journal of Nutrition Education and Behavior 2008;40(6):341‐7. [DOI] [PubMed] [Google Scholar]
- Whatley Blum JE, Davee AM, Devore RL, Beaudoin CM, Jenkins PL, Kaley LA, et al. Implementation of low‐fat, low‐sugar, and portion‐controlled nutrition guidelines in competitive food venues of Maine public high schools. Journal of School Health 2007;77(10):687‐93. [DOI] [PubMed] [Google Scholar]
Wolfenden 2017 {published data only}
- Wolfenden L, Nathan N, Janssen LM, Wiggers J, Reilly K, Delaney T. Multi‐strategic intervention to enhance implementation of healthy canteen policy: a randomised controlled trial. Implementation Science 2017;12(1):6. [DOI] [PMC free article] [PubMed] [Google Scholar]
- Wolfenden L, Nathan N, Williams CM, Delaney T, Reilly KL, Freund M. A randomised controlled trial of an intervention to increase the implementation of a healthy canteen policy in Australian primary schools: study protocol. Implementation Science 2014;9(1):147. [DOI] [PMC free article] [PubMed] [Google Scholar]
Yoong 2016 {published data only}
- Williams CM, Nathan N, Delaney T, Yoong SL, Wiggers J, Preece S. CAFÉ: a multicomponent audit and feedback intervention to improve implementation of healthy food policy in primary school canteens: protocol of a randomised controlled trial. BMJ Open 2015;5(6):e006969. [DOI] [PMC free article] [PubMed] [Google Scholar]
- Yoong SL, Nathan N, Wolfenden L, Wiggers J, Reilly K, Oldmeadow C. CAFÉ: a multicomponent audit and feedback intervention to improve implementation of healthy food policy in primary school canteens: a randomised controlled trial. International Journal of Behavioral Nutrition and Physical Activity 2016;13(1):126. [DOI] [PMC free article] [PubMed] [Google Scholar]
Young 2008 {published data only}
- Elder JP, Lytle L, Sallis JF, Young DR, Steckler A, Simons‐Morton D. A description of the social–ecological framework used in the trial of activity for adolescent girls (TAAG). Health Education Research 2007;22(2):155‐65. [DOI] [PMC free article] [PubMed] [Google Scholar]
- Elder JP, Shuler L, Moe SG, Grieser M, Pratt C, Cameron S. Recruiting a diverse group of middle school girls into the trial of activity for adolescent girls. Journal of School Health 2008;78(10):523‐31. [DOI] [PMC free article] [PubMed] [Google Scholar]
- Stevens J, Murray DM, Catellier DJ, Hannan PJ, Lytle LA, Elder JP, et al. Design of the trial of activity in adolescent girls (TAAG). Contemporary Clinical Trials 2005;26(2):223‐33. [DOI] [PMC free article] [PubMed] [Google Scholar]
- Webber LS, Catellier DJ, Lytle LA, Murray DM, Pratt CA, Young DR, et al. Promoting physical activity in middle school girls: Trial of Activity for Adolescent Girls. American Journal of Preventive Medicine 2008;34(3):173‐84. [DOI] [PMC free article] [PubMed] [Google Scholar]
- Young DR, Steckler A, Cohen S, Pratt C, Felton G, Moe SG. Process evaluation results from a school‐and community‐linked intervention: the Trial of Activity for Adolescent Girls (TAAG). Health Education Research 2008;23(6):976‐86. [DOI] [PMC free article] [PubMed] [Google Scholar]
References to studies excluded from this review
Aarestrup 2015 {published data only}
- Aarestrup AK, Suldrup Jorgensen T, Jorgensen SE, Hoelscher DM, Due P, Krolner R. Implementation of strategies to increase adolescents' access to fruit and vegetables at school: process evaluation findings from the Boost study. BMC Public Health 2015;15:86. [DOI] [PMC free article] [PubMed] [Google Scholar]
Adamowicz 2015 {published data only}
- Adamowicz K, Zalewska M, Majkowicz M, Zaucha JM. Evaluation of the impact of different types of health education on the adoption and preservation of prohealth attitudes in preventing cancer in juveniles younger than 18 years. Journal of Cancer Education 2015;30(3):432‐8. [DOI] [PMC free article] [PubMed] [Google Scholar]
Amini 2015 {published data only}
- Amini M, Djazayery A, Majdzadeh R, Taghdisi MH, Sadrzadeh‐Yeganeh H, Abdollahi Z, et al. A school‐based intervention to reduce excess weight in overweight and obese primary school children. Annals of Nutrition and Metabolism 2015;67:409. [DOI] [PubMed] [Google Scholar]
Andersen 2015 {published data only}
- Andersen HB, Pawlowski CS, Scheller HB, Troelsen J, Toftager M, Schipperijn J. Activating schoolyards: study design of a quasi‐experimental schoolyard intervention study. BMC Public Health 2015;15:523. [DOI] [PMC free article] [PubMed] [Google Scholar]
Angelico 1991 {published data only}
- Angelico F, Ben M, Fabiani L, Lentini P, Pannozzo F, Urbinati G, et al. Management of childhood obesity through a school‐based programme of general health and nutrition education. Public Health 1991;105(5):393‐8. [DOI] [PubMed] [Google Scholar]
Audrey 2004 {published data only}
- Audrey S, Cordall K, Moore L, Cohen D, Campbell R. The development and implementation of a peer‐led intervention to prevent smoking among secondary school students using their established social networks. Health Education Journal 2004;63(3):266‐84. [Google Scholar]
Auld 1998 {published data only}
- Auld GW, Romaniello C, Heimendinger J, Hambidge C, Hambidge M. Outcomes from a school‐based nutrition education program using resource teachers and cross‐disciplinary models. Journal of Nutrition Education 1998;30(5):268‐80. [Google Scholar]
Auld 1999 {published data only}
- Auld GW, Romaniello C, Heimendinger J, Hambidge C, Hambidge M. Outcomes from a school‐based nutrition education program alternating special resource teachers and classroom teachers. Journal of School Health 1999;69(10):403‐8. [DOI] [PubMed] [Google Scholar]
Banchonhattakit 2009 {published data only}
- Banchonhattakit P, Tanasugarn C, Pradipasen M, Miner KR, Nityasuddhi D. Effectiveness of school network for childhood obesity prevention (snocop) in primary schools of Saraburi province, Thailand. Southeast Asian Journal of Tropical Medicine and Public Health 2009;40(4):816. [PubMed] [Google Scholar]
Banning 2015 {published data only}
- Banning J. Measuring the Impacts of a School Garden‐Based Nutrition Intervention [Masters thesis]. The University of Vermont and State Agricultural College, 2015. [Google Scholar]
Baranowski 1997 {published data only}
- Baranowski T, Cullen KW, Basen‐Engquist K, Wetter DW, Cummings S, Martineau DS, et al. Transitions out of high school: time of increased cancer risk?. Preventive Medicine 1997;26(5):694‐703. [DOI] [PubMed] [Google Scholar]
Baranowski 2000 {published data only}
- Baranowski T, Davis M, Resnicow K, Baranowski J, Doyle C, Lin LS, et al. Gimme 5 fruit, juice, and vegetables for fun and health: outcome evaluation. Health Education & Behavior 2000;27(1):96‐111. [DOI] [PubMed] [Google Scholar]
Baranowski 2000a {published data only}
- Baranowski T, Stables G. Process evaluations of the 5‐a‐day projects. Health Education & Behavior 2000;27(2):157‐66. [DOI] [PubMed] [Google Scholar]
Belansky 2010 {published data only}
- Belansky ES, Cutforth N, Delong E, Litt J, Gilbert L, Scarbro S, et al. Early effects of the federally mandated Local Wellness Policy on school nutrition environments appear modest in Colorado's rural, low‐income elementary schools. Journal of the American Dietetic Association 2010;110(11):1712‐7. [DOI] [PubMed] [Google Scholar]
Belansky 2013 {published data only}
- Belansky ES, Cutforth N, Chavez R, Crane LA, Waters E, Marshall JA. Adapted intervention mapping: a strategic planning process for increasing physical activity and healthy eating opportunities in schools via environment and policy change. Journal of School Health 2013;83(3):194‐205. [DOI] [PubMed] [Google Scholar]
Bere 2005 {published data only}
- Bere E, Veierod MB, Klepp KI. The Norwegian School Fruit Programme: evaluating paid vs. no‐cost subscriptions. Preventive Medicine 2005;41(2):463‐70. [DOI] [PubMed] [Google Scholar]
Bere 2006 {published data only}
- Bere E, Veierod MB, Bjelland M, Klepp KI. Outcome and process evaluation of a Norwegian school‐randomized fruit and vegetable intervention: Fruits and Vegetables Make the Marks (FVMM). Health Education Research 2006;21(2):258‐67. [DOI] [PubMed] [Google Scholar]
Bindler 2009 {published data only}
- Bindler R, Daratha K. "Teams" study‐how do the diets of middle school students measure up?. Communicating Nursing Research 2009;42:306. [Google Scholar]
Bindler 2012 {published data only}
- Bindler RC, Goetz S, Butkus SN, Power TG, Ullrich‐French S, Steele M. The process of curriculum development and implementation for an adolescent health project in middle schools. Journal of School Nursing 2012;28(1):13‐23. [DOI] [PubMed] [Google Scholar]
Bogart 2016 {published data only}
- Bogart LM, Elliott MN, Cowgill BO, Klein DJ, Hawes‐Dawson J, Uyeda K, et al. Two‐year BMI outcomes from a school‐based intervention for nutrition and exercise: A randomized trial. Pediatrics 2016;137(5):e20152493. [DOI] [PMC free article] [PubMed] [Google Scholar]
Bourdeaudhuij 2015 {published data only}
- Bourdeaudhuij I, Verbestel V, Henauw S, Maes L, Huybrechts I, Marild S, et al. Behavioural effects of a community‐oriented setting‐based intervention for prevention of childhood obesity in eight European countries. Main results from the IDEFICS study. Obesity Reviews 2015;16:30‐40. [DOI] [PubMed] [Google Scholar]
Bourdeaudhuij 2015a {published data only}
- Bourdeaudhuij I, Verbestel V, Henauw S, Maes L, Marild S, Moreno LA, et al. Implementation of the IDEFICS intervention across European countries: Perceptions of parents and relationship with BMI. Obesity Reviews 2015;16:78‐88. [DOI] [PubMed] [Google Scholar]
Boyle‐Holmes 2010 {published data only}
- Boyle‐Holmes T, Grost L, Russell L, Laris BA, Robin L, Haller E, et al. Promoting elementary physical education: Results of a school‐based evaluation study. Health Education & Behavior 2010;37(3):377‐89. [DOI] [PubMed] [Google Scholar]
Brandstetter 2012 {published data only}
- Brandstetter S, Klenk J, Berg S, Galm C, Fritz M, Peter R, et al. Overweight prevention implemented by primary school teachers: a randomised controlled trial. Obesity Facts 2012;5(1):1‐11. [DOI] [PubMed] [Google Scholar]
Bukhari 2011 {published data only}
- Bukhari A, Federicks L, Wylie‐Rosett J. Strategies to promote high school students' healthful food choices. Journal of Nutrition Education & Behavior 2011;43(5):414‐8. [DOI] [PMC free article] [PubMed] [Google Scholar]
Burghardt 1993 {published data only}
- Burghardt J, Gordon A, Chapman N, Gleason P, Fraker T. The School Nutrition Dietary Assessment Study: School food service, meals offered, and dietary intakes. Princeton, NJ: Mathematica Policy Research, Inc; 1993.
Burghardt 1995 {published data only}
- Burghardt JA, Gordon AR, Fraker TM. Meals offered in the National School Lunch Program and the School Breakfast Program. American Journal of Clinical Nutrition 1995;61(1):187‐98. [DOI] [PubMed] [Google Scholar]
Burke 1998 {published data only}
- Burke V, Milligan R, Thompson C, Taggart A, Dunbar D, Spencer M, et al. A controlled trial of health promotion programs in 11‐year‐olds using physical activity “enrichment” for higher risk children. Journal of Pediatrics 1998;132(5):840‐8. [DOI] [PubMed] [Google Scholar]
Busch 2015 {published data only}
- Busch V, Leeuw JR, Zuithoff NP, Yperen TA, Schrijvers AJ. A controlled health promoting school study in the Netherlands: Effects after 1 and 2 years of intervention. Health Promotion Practice 2015;16(4):592‐600. [DOI] [PubMed] [Google Scholar]
Caballero 1998 {published data only}
- Caballero B, Davis S, Davis CE, Ethelbah B, Evans M, Lohman T, et al. Pathways: A school‐based program for the primary prevention of obesity in American Indian children. Journal of Nutritional Biochemistry 1998;9(9):535‐43. [DOI] [PMC free article] [PubMed] [Google Scholar]
Campbell 2015 {published data only}
- Campbell R, Rawlins E, Wells S, Kipping RR, Chittleborough CR, Peters TJ, et al. Intervention fidelity in a school‐based diet and physical activity intervention in the UK: Active for Life Year 5. International journal of Behavioral Nutrition and Physical Activity 2015;12:141. [DOI] [PMC free article] [PubMed] [Google Scholar]
Cass 2003 {published data only}
- Cass Y, Price P. Moorefit‐increasing physical activity in adolescent girls using the Health Promoting Schools framework. Health Promotion Journal of Australia 2003;14(3):159‐64. [Google Scholar]
Chatzisarantis 2015 {published data only}
- Chatzisarantis NL, Kamarova S, Kawabata M, Wang J, Hagger MS. Developing and evaluating utility of school‐based intervention programs in promoting leisure‐time physical activity: An application of the theory of planned behavior. International Journal of Sport Psychology 2015;46(2):95‐116. [Google Scholar]
Christian 2012 {published data only}
- Christian MS, Evans CEL, Ransley JK, Greenwood DC, Thomas JD, Cade JE. Process evaluation of a cluster randomised controlled trial of a school‐based fruit and vegetable intervention: Project Tomato. Public Health Nutrition 2012;15(3):459‐65. [DOI] [PubMed] [Google Scholar]
Coleman 2012 {published data only}
- Coleman KJ, Shordon M, Caparosa SL, Pomichowski ME, Dzewaltowski DA. The healthy options for nutrition environments in schools (Healthy ONES) group randomized trial: using implementation models to change nutrition policy and environments in low income schools. International Journal of Behavioral Nutrition & Physical Activity 2012;9:80. [DOI] [PMC free article] [PubMed] [Google Scholar]
Condit 2015 {published data only}
- Condit J, Caballero M, Papanek P. A pilot study to analyze a multisport/triathlon program as a mechanism to promote self‐determined exercise among an overweight inner‐city middle school Latino population. International Journal of Child and Adolescent Health 2015;8(4):497‐509. [Google Scholar]
Connell 1985 {published data only}
- Connell DB, Turner RR. School Health Education Evaluation. The impact of instructional experience and the effects of cumulative instruction. Journal of School Health 1985;55(8):324‐31. [DOI] [PubMed] [Google Scholar]
Conner 2013 {published data only}
- Conner M, Grogan S, Lawton R, Armitage C, West R, Siddiqi K, et al. Study protocol: A cluster randomised controlled trial of implementation intentions to reduce smoking initiation in adolescents. BMC Public Health 2013;13:54. [DOI] [PMC free article] [PubMed] [Google Scholar]
Costigan 2015 {published data only}
- Costigan SA, Eather N, Plotnikoff RC, Taaffe DR, Pollock E, Kennedy SG, et al. Preliminary efficacy and feasibility of embedding high intensity interval training into the school day: A pilot randomized controlled trial. Preventive Medicine Reports 2015;2:973‐9. [DOI] [PMC free article] [PubMed] [Google Scholar]
da Costa 2014 {published data only}
- Costa FF, Altenburg de Assis MA, González‐Chica D, Bernardo C, Gomes de Barros MV, Vinicius Nahas M. Effect of school‐based intervention on diet in high school students. Brazilian Journal of Kineanthropometry & Human Performance 2014;16:37‐45. [Google Scholar]
Davis 1999 {published data only}
- Davis SM, Going SB, Helitzer DL, Teufel NI, Snyder P, Gittelsohn J, et al. Pathways: a culturally appropriate obesity‐prevention program for American Indian schoolchildren. American Journal of Clinical Nutrition 1999;69(4 Suppl):796‐802. [DOI] [PMC free article] [PubMed] [Google Scholar]
Davis 2016 {published data only}
- Davis JN, Martinez LC, Spruijt‐Metz D, Gatto NM. LA Sprouts: A 12‐week gardening, nutrition, and cooking randomized control trial improves determinants of dietary behaviors. Journal of Nutrition Education and Behavior 2016;48(1):2‐11. [DOI] [PMC free article] [PubMed] [Google Scholar]
Day 2008 {published data only}
- Day ME, Strange KS, McKay HA, Naylor P. Action schools! BC–healthy eating: Effects of a whole‐school model to modifying eating behaviours of elementary school children. Canadian Journal of Public Health 2008;99(4):328‐31. [DOI] [PMC free article] [PubMed] [Google Scholar]
de Barros 2009 {published data only}
- Barros MV, Nahas MV, Hallal PC, Farias Júnior JC, Florindo AA, Barros SS. Effectiveness of a school‐based intervention on physical activity for high school students in Brazil: the Saude na Boa project. Journal of Physical Activity and Health 2009;6(2):163‐9. [DOI] [PubMed] [Google Scholar]
de Greeff 2016 {published data only}
- Greeff JW, Hartman E, Mullender‐Wijnsma MJ, Bosker RJ, Doolaard S, Visscher C. Long‐term effects of physically active academic lessons on physical fitness and executive functions in primary school children. Health Education Research 2016;31(2):185‐94. [DOI] [PubMed] [Google Scholar]
DeVault 2009 {published data only}
- DeVault N, Kennedy T, Hermann J, Mwavita M, Rask P, Jaworsky A. It's all about kids: Preventing overweight in elementary school children in Tulsa, OK. Journal of the American Dietetic Association 2009;109(4):680‐7. [DOI] [PubMed] [Google Scholar]
Dewar 2013 {published data only}
- Dewar DL, Morgan PJ, Plotnikoff RC, Okely AD, Collins CE, Batterham M, et al. The nutrition and enjoyable activity for teen girls study: a cluster randomized controlled trial. American Journal of Preventive Medicine 2013;45(3):313‐7. [DOI] [PubMed] [Google Scholar]
Dishman 2005 {published data only}
- Dishman RK, Motl RW, Saunders R, Felton G, Ward DS, Dowda M, et al. Enjoyment mediates effects of a school‐based physical‐activity intervention. Medicine & Science in Sports & Exercise 2005;37(3):478‐87. [DOI] [PubMed] [Google Scholar]
Domel 1993 {published data only}
- Domel SB, Baranowski T, Davis H, Thompson WO, Leonard SB, Riley P, et al. Development and evaluation of a school intervention to increase fruit and vegetable consumption among 4th and 5th grade students. Journal of Nutrition Education 1993;25(6):345‐9. [Google Scholar]
Donnelly 1996 {published data only}
- Donnelly JE, Jacobsen DJ, Whatley JE, Hill JO, Swift LL, Cherrington A, et al. Nutrition and physical activity program to attenuate obesity and promote physical and metabolic fitness in elementary school children. Obesity Research 1996;4(3):229‐43. [DOI] [PubMed] [Google Scholar]
Drapeau 2016 {published data only}
- Drapeau V, Savard M, Gallant A, Nadeau L, Gagnon J. The effectiveness of a school‐based nutrition intervention on children's fruit, vegetables, and dairy product intake. Journal of School Health 2016;86(5):353‐62. [DOI] [PubMed] [Google Scholar]
Dreyhaupt 2012 {published data only}
- Dreyhaupt J, Koch B, Wirt T, Schreiber A, Brandstetter S, Kesztyus D, et al. Evaluation of a health promotion program in children: Study protocol and design of the cluster‐randomized Baden‐Wurttemberg primary school study. BMC Public Health 2012;12:157. [DOI] [PMC free article] [PubMed] [Google Scholar]
Dunn 2012 {published data only}
- Dunn LL, Venturanza JA, Walsh RJ, Nonas CA. An observational evaluation of move‐to‐improve, a classroom‐based physical activity program, New York City schools, 2010. Preventing Chronic Disease 2012;9:146. [DOI] [PMC free article] [PubMed] [Google Scholar]
Dunton 2014 {published data only}
- Dunton GF, Liao Y, Grana R, Lagloire R, Riggs N, Chou C‐P, et al. State‐wide dissemination of a school‐based nutrition education programme: a RE‐AIM (Reach, Efficacy, Adoption, Implementation, Maintenance) analysis. Public Health Nutrition 2014;17(2):422‐30. [DOI] [PMC free article] [PubMed] [Google Scholar]
Dwyer 1983 {published data only}
- Dwyer T, Coonan WE, Leitch DR, Hetzel BS, Baghurst RA. An investigation of the effects of daily physical activity on the health of primary school students in South Australia. International Journal of Epidemiology 1983;12(3):308‐13. [DOI] [PubMed] [Google Scholar]
Dwyer 1996 {published data only}
- Dwyer JT, Hewes LV, Mitchell PD, Nicklas TA, Montgomery DH, Lytle LA, et al. Improving school breakfasts: effects of the CATCH Eat Smart Program on the nutrient content of school breakfasts. Preventive Medicine 1996;25(4):413‐22. [DOI] [PubMed] [Google Scholar]
Dzewaltowski 2002 {published data only}
- Dzewaltowski DA, Estabrooks PA, Johnston JA. Healthy youth places promoting nutrition and physical activity. Health Education Research 2002;17(5):541‐51. [DOI] [PubMed] [Google Scholar]
Dzewaltowski 2009 {published data only}
- Dzewaltowski DA, Estabrooks PA, Welk G, Hill J, Milliken G, Karteroliotis K, et al. Healthy youth places: A randomized controlled trial to determine the effectiveness of facilitating adult and youth leaders to promote physical activity and fruit and vegetable consumption in middle schools. Health Education & Behavior 2009;36(3):583‐600. [DOI] [PMC free article] [PubMed] [Google Scholar]
Eather 2011 {published data only}
- Eather N, Morgan PJ, Lubans DR. Improving health‐related fitness in children: the Fit‐4‐Fun randomized controlled trial study protocol. BMC Public Health 2011;11:902. [DOI] [PMC free article] [PubMed] [Google Scholar]
Eather 2013 {published data only}
- Eather N, Morgan PJ, Lubans DR. Improving the fitness and physical activity levels of primary school children: results of the Fit‐4‐Fun group randomized controlled trial. Preventive Medicine 2013;56(1):12‐9. [DOI] [PubMed] [Google Scholar]
Eather 2016 {published data only}
- Eather N, Morgan PJ, Lubans DR. Improving health‐related fitness in adolescents: the CrossFit TeensTM randomised controlled trial. Journal of Sports Sciences 2016;34(3):209‐23. [DOI] [PubMed] [Google Scholar]
Edmundson 1996 {published data only}
- Edmundson E, Parcel GS, Perry CL, Feldman HA, Smyth M, Johnson CC, et al. The effects of the child and adolescent trial for cardiovascular health intervention on psychosocial determinants of cardiovascular disease risk behavior. Preventive Medicine 1996;25(4):442‐54. [DOI] [PubMed] [Google Scholar]
Edmundson 1996a {published data only}
- Edmundson E, Parcel GS, Perry CL, Feldman HA, Smyth M, Johnson CC, et al. The effects of the child and adolescent trial for cardiovascular health intervention on psychosocial determinants of cardiovascular disease risk behavior among third‐grade students. American Journal of Health Promotion 1996;10(3):217‐25. [DOI] [PubMed] [Google Scholar]
Eisenmann 2008 {published data only}
- Eisenmann JC, Gentile DA, Welk GJ, Callahan R, Strickland S, Walsh M, et al. SWITCH: Rationale, design, and implementation of a community, school, and family‐based intervention to modify behaviors related to childhood obesity. BMC Public Health 2008;8:223. [DOI] [PMC free article] [PubMed] [Google Scholar]
Elder 1996 {published data only}
- Elder JP, Perry CL, Stone EJ, Johnson CC, Yang M, Edmundson EW, et al. Tobacco use measurement, prediction, and intervention in elementary schools in four states: the CATCH Study. Preventive Medicine 1996;25(4):486‐94. [DOI] [PubMed] [Google Scholar]
Elinder 2012 {published data only}
- Elinder LS, Heinemans N, Hagberg J, Quetel A‐K, Hagstromer M. A participatory and capacity‐building approach to healthy eating and physical activity‐ SCIP‐school: A 2‐year controlled trial. International Journal of Behavioral Nutrition & Physical Activity 2012;9:145. [DOI] [PMC free article] [PubMed] [Google Scholar]
Ellison 1989 {published data only}
- Ellison RC, Capper AL, Goldberg RJ, Witschi JC, Stare FJ. The environmental component: changing school food service to promote cardiovascular health encouraging the installation of rollover protective structures in New York State: the design of a social marketing intervention. Health Education Quarterly 1989;16:285‐97. [DOI] [PubMed] [Google Scholar]
Eriksen 2003 {published data only}
- Eriksen K, Haraldsdottir J, Pederson R, Flyger HV. Effect of a fruit and vegetable subscription in Danish schools. Public Health Nutrition 2003;6(1):57‐63. [DOI] [PubMed] [Google Scholar]
Ermetici 2016 {published data only}
- Ermetici F, Zelaschi RF, Briganti S, Dozio E, Gaeta M, Ambrogi F, et al. Association between a school‐based intervention and adiposity outcomes in adolescents: The Italian "EAT" project. Obesity 2016;24(3):687‐95. [DOI] [PubMed] [Google Scholar]
Fardy 1996 {published data only}
- Fardy PS, White RE, Haltiwanger‐Schmitz K, Magel JR, McDermott KJ, Clark LT, et al. Coronary disease risk factor reduction and behavior modification in minority adolescents: The PATH program. Journal of Adolescent Health 1996;18(4):247‐53. [DOI] [PubMed] [Google Scholar]
Farias 2015 {published data only}
- Farias Edos S, Gonçalves EM, Morcillo AM, Guerra‐Júnior G, Amancio OM. Effects of programmed physical activity on body composition in post‐pubertal schoolchildren. Jornal de Pediatria 2015;91(2):122‐9. [DOI] [PubMed] [Google Scholar]
Farris 2014 {published data only}
- Farris AR, Misyak S, Duffey KJ, Davis GC, Hosig K, Atzaba‐Poria N, et al. Nutritional comparison of packed and school lunches in pre‐kindergarten and kindergarten children following the implementation of the 2012–2013 National School Lunch Program Standards. Journal of Nutrition Education & Behavior 2014;46(6):621‐6. [DOI] [PubMed] [Google Scholar]
Flay 1989 {published data only}
- Flay BR, Koepke D, Thomson SJ, Santi S, Best JA, Brown KS. Six‐year follow‐up of the first Waterloo school smoking prevention trial. American Journal of Public Health 1989;79(10):1371‐6. [DOI] [PMC free article] [PubMed] [Google Scholar]
Flynn 1992 {published data only}
- Flynn BS, Worden JK, Secker‐Walker RH, Badger GJ, Geller BM, Costanza MC. Prevention of cigarette smoking through mass media intervention and school programs. American Journal of Public Health 1992;82(6):827‐34. [DOI] [PMC free article] [PubMed] [Google Scholar]
Foster 2008 {published data only}
- Foster GD, Sherman S, Borradaile KE, Grundy KM, Vander Veur SS, Nachmani J, et al. A policy‐based school intervention to prevent overweight and obesity. Pediatrics 2008;121(4):794‐802. [DOI] [PubMed] [Google Scholar]
French 1997 {published data only}
- French SA, Peterson CB, Story M, Anderson N, Mussell MP, Mitchell JE. Agreement between survey and interview measures of weight control practices in adolescents. International Journal of Eating Disorders 1997;23(1):45‐56. [DOI] [PubMed] [Google Scholar]
Fulkerson 2004 {published data only}
- Fulkerson JA, French SA, Story M, Nelson H, Hannan PJ. Promotions to increase lower‐fat food choices among students in secondary schools: Description and outcomes of TACOS (Trying Alternative Cafeteria Options in Schools). Public Health Nutrition 2004;7(5):665‐74. [DOI] [PubMed] [Google Scholar]
Gatto 2015 {published data only}
- Gatto NM, Martinez LC, Spruijt‐Metz D, Davis JN. LA sprouts randomized controlled nutrition and gardening program reduces obesity and metabolic risk in latino youth. Obesity 2015;23(6):1244‐51. [DOI] [PMC free article] [PubMed] [Google Scholar] [Retracted]
Glover 2010 {published data only}
- Glover M, Scragg R, Nosa V, Bullen C, McCool J, Kira A. Keeping kids smokefree: Rationale, design, and implementation of a community, school, and family‐based intervention to modify behaviors related to smoking among Maori and Pacific Island children in New Zealand. International Quarterly of Community Health Education 2010;30(3):205‐22. [DOI] [PubMed] [Google Scholar]
Going 2003 {published data only}
- Going S, Thompson J, Cano S, Stewart D, Stone E, Harnack L, et al. The effects of the Pathways Obesity Prevention Program on physical activity in American Indian children. Preventive Medicine 2003;37:62‐9. [DOI] [PubMed] [Google Scholar]
Gonzalvez 2015 {published data only}
- Gonzalvez MT, Espada JP, Orgiles M, Soto D, Sussman S. One‐year effects of Project EX in Spain: A classroom‐based smoking prevention and cessation intervention program. PLOS One 2015;10:e0130595. [DOI] [PMC free article] [PubMed] [Google Scholar]
Gordon 1995 {published data only}
- Gordon AR, Devaney BL, Burghardt JA. Dietary effects of the National School Lunch Program and the School Breakfast Program. American Journal of Clinical Nutrition 1995;61(1 Suppl):221‐31. [DOI] [PubMed] [Google Scholar]
Gortmaker 1999 {published data only}
- Gortmaker SL, Cheung LW, Peterson KE, Chomitz G, Cradle JH, Dart H, et al. Impact of a school‐based interdisciplinary intervention on diet and physical activity among urban primary school children: Eat well and keep moving. Archives of Pediatrics & Adolescent Medicine 1999;153(9):975‐83. [DOI] [PubMed] [Google Scholar]
Gortmaker 1999a {published data only}
- Gortmaker SL, Peterson K, Wiecha J, Sobol AM, Dixit S, Fox MK, et al. Reducing obesity via a school‐based interdisciplinary intervention among youth: Planet Health. Archives of Pediatrics & Adolescent Medicine 1999;153(4):409‐18. [DOI] [PubMed] [Google Scholar]
Graham 2008 {published data only}
- Graham D, Appleton S, Rush E, McLennan S, Reed P, Simmons D. Increasing activity and improving nutrition through a schools‐based programme: Project Energize. 1. Design, programme, randomisation and evaluation methodology. Public Health Nutrition 2008;11(10):1076‐84. [DOI] [PubMed] [Google Scholar]
Grasten 2015 {published data only}
- Grasten A, Yli‐Piipari S, Watt A, Jaakkola T, Liukkonen J. Effectiveness of school‐initiated physical activity program on secondary school students' physical activity participation. Journal of School Health 2015;85(2):125‐34. [DOI] [PubMed] [Google Scholar]
Gray 2015 {published data only}
- Gray HL, Contento IR, Koch PA. Linking implementation process to intervention outcomes in a middle school obesity prevention curriculum, 'Choice, Control and Change'. Health Education Research 2015;30(2):248‐61. [DOI] [PMC free article] [PubMed] [Google Scholar]
Griffin 2014 {published data only}
- Griffin TL, Pallan MJ, Clarke JL, Lancashire ER, Lyon A, Parry JM, et al. Process evaluation design in a cluster randomised controlled childhood obesity prevention trial: the WAVES study. International Journal of Behavioral Nutrition & Physical Activity 2014;11:112. [DOI] [PMC free article] [PubMed] [Google Scholar]
Griffin 2015 {published data only}
- Griffin TL, Jackson DM, McNeill G, Aucott LS, Macdiarmid JI. A brief educational intervention increases knowledge of the sugar content of foods and drinks but does not decrease intakes in Scottish children aged 10‐12 Years. Journal of Nutrition Education & Behavior 2015;47(4):367‐73. [DOI] [PubMed] [Google Scholar]
Gruber 2015 {published data only}
- Gruber R, Somerville G. Preliminary results from a multicomponent obesity prevention school based program. Sleep 2015;38:392‐3. [Google Scholar]
Grydeland 2014 {published data only}
- Grydeland M, Bjelland M, Anderssen SA, Klepp KI, Bergh IH, Andersen LF, et al. Effects of a 20‐month cluster randomised controlled school‐based intervention trial on BMI of school‐aged boys and girls: the HEIA study. British Journal of Sports Medicine 2014;48(9):768‐73. [DOI] [PMC free article] [PubMed] [Google Scholar]
Gunawardena 2016 {published data only}
- Gunawardena N, Kurotani K, Indrawansa S, Nonaka D, Mizoue T, Samarasinghe D. School‐based intervention to enable school children to act as change agents on weight, physical activity and diet of their mothers: A cluster randomized controlled trial. International Journal of Behavioral Nutrition and Physical Activity 2016;13(1):45. [DOI] [PMC free article] [PubMed] [Google Scholar]
Guo 2015 {published data only}
- Guo JL, Lee TC, Liao JY, Huang CM. Prevention of illicit drug use through a school‐based program: results of a longitudinal, cluster‐randomized controlled trial. Journal of Adolescent Health 2015;56(3):314‐22. [DOI] [PubMed] [Google Scholar]
Habib‐Mourad 2013 {published data only}
- Habib‐Mourad C. An intervention to promote healthy eating and physical activity in Lebanese school children: Health‐E‐PALS a pilot cluster randomised controlled trial [Doctor of Philosophy]. United Kingdom: Durham University, 2013. Ann Arbor: University of Durham.
Habib‐Mourad 2014 {published data only}
- Habib‐Mourad C, Ghandour LA, Moore HJ, Nabhani‐Zeidan M, Adetayo K, Hwalla N, et al. Promoting healthy eating and physical activity among school children: findings from Health‐E‐PALS, the first pilot intervention from Lebanon. BMC Public Health 2014;14:940. [DOI] [PMC free article] [PubMed] [Google Scholar]
Haerens 2007 {published data only}
- Haerens L, Bourdeaudhuij I, Maes L, Cardon G, Deforche B. School‐based randomized controlled trial of a physical activity intervention among adolescents. Journal of Adolescent Health 2007;40(3):258‐65. [DOI] [PubMed] [Google Scholar]
Hamilton 2005 {published data only}
- Hamilton G, Cross D, Resnicow K, Hall M. A school‐based harm minimization smoking intervention trial: outcome results. Addiction 2005;100(5):689‐700. [DOI] [PubMed] [Google Scholar]
Harrell 1996 {published data only}
- Harrell JS, McMurray RG, Bangdiwala SI, Frauman AC, Gansky SA, Bradley CB. Effects of a school‐based intervention to reduce cardiovascular disease risk factors in elementary‐school children: the Cardiovascular Health in Children (CHIC) study. Journal of Pediatrics 1996;128(6):797‐805. [DOI] [PubMed] [Google Scholar]
Hartstein 2011 {published data only}
- Hartstein J, Cullen KW, Virus A, Ghormli L, Volpe SL, Staten MA, et al. Impact of the HEALTHY study on vending machine offerings in middle schools. Journal of Child Nutrition & Management 2011;35(2):pii: 16353. [PMC free article] [PubMed] [Google Scholar]
Harvey‐Berino 1998 {published data only}
- Harvey‐Berino J, Ewing JF, Flynn B, Royer J. Statewide dissemination of a nutrition program: Show the way to 5‐a‐day. Journal of Nutrition Education 1998;30(1):29‐36. [Google Scholar]
Havas 1995 {published data only}
- Havas S, Heimendinger J, Damron D, Nicklas TA, Cowan A, Beresford SA, et al. 5 a day for better health—nine community research projects to increase fruit and vegetable consumption. Public Health Reports 1995;110(1):68‐79. [PMC free article] [PubMed] [Google Scholar]
Hayes 2015 {published data only}
- Hayes RM, Thompson LM, Gress T, Cottrell L, Pino I, Gilkerson CL, et al. Effects of a brief physical activity program on young students' physical fitness. Clinical Pediatrics 2015;54(12):1145‐52. [DOI] [PubMed] [Google Scholar]
Heath 2003 {published data only}
- Heath EM, Coleman KJ. Adoption and institutionalization of the child and adolescent trial for cardiovascular health (CATCH) in El Paso, Texas. Health Promotion Practice 2003;4(2):157‐64. [DOI] [PubMed] [Google Scholar]
Henauw 2015 {published data only}
- Henauw S, Huybrechts I, Bourdeaudhuij I, Bammann K, Barba G, Lissner L, et al. Effects of a community‐oriented obesity prevention programme on indicators of body fatness in preschool and primary school children. Main results from the IDEFICS study. Obesity Reviews 2015;16:16‐29. [DOI] [PubMed] [Google Scholar]
Hodder 2012 {published data only}
- Hodder RK, Freund M, Bowman J, Wolfenden L, Campbell E, Wye P, et al. A cluster randomised trial of a school‐based resilience intervention to decrease tobacco, alcohol and illicit drug use in secondary school students: study protocol. BMC Public Health 2012;12:1009. [DOI] [PMC free article] [PubMed] [Google Scholar]
Hoelscher 2001 {published data only}
- Hoelscher DM, Kelder SH, Murray N, Cribb PW, Conroy J, Parcel GS. Dissemination and adoption of the Child and Adolescent Trial for Cardiovascular Health (CATCH): a case study in Texas. Journal of Public Health Management & Practice 2001;7(2):90‐100. [DOI] [PubMed] [Google Scholar]
Hoelscher 2003 {published data only}
- Hoelscher DM, Mitchell P, Dwyer J, Elder J, Clesi A, Snyder P. How the CATCH Eat Smart Program helps implement the USDA regulations in school cafeterias. Health Education & Behavior 2003;30(4):434‐46. [DOI] [PubMed] [Google Scholar]
Hoelscher 2004 {published data only}
- Hoelscher DM, Feldman HA, Johnson CC, Lytle LA, Osganian SK, Parcel GS, et al. School‐based health education programs can be maintained over time: results from the CATCH Institutionalization study. Preventive Medicine Reports 2004;38(5):594‐606. [DOI] [PubMed] [Google Scholar]
Hoelscher 2016 {published data only}
- Hoelscher D, Ory M, Dowdy D, Miao J, Atteberry H, Nichols D, et al. Effects of funding allocation for Safe Routes to School programs on active commuting to school and related behavioral, knowledge, and psychosocial outcomes: Results from the Texas Childhood Obesity Prevention Policy Evaluation (T‐COPPE) study. Environment and Behavior 2016;48(1):210‐29. [Google Scholar]
Hyndman 2014 {published data only}
- Hyndman BP, Benson AC, Ullah S, Telford A. Evaluating the effects of the Lunchtime Enjoyment Activity and Play (LEAP) school playground intervention on children's quality of life, enjoyment and participation in physical activity. BMC Public Health 2014;14(1):164. [DOI] [PMC free article] [PubMed] [Google Scholar]
Isensee 2014 {published data only}
- Isensee B, Hansen J, Maruska K, Hanewinkel R. Effects of a school‐based prevention programme on smoking in early adolescence: A 6‐month follow‐up of the 'Eigenstandig werden' cluster randomised trial. BMJ Open 2014;4(1):e004422. [DOI] [PMC free article] [PubMed] [Google Scholar]
Isensee 2015 {published data only}
- Isensee B, Maruska K, Hanewinkel R. Long‐term effects of the prevention program Klasse2000 on substance use: Results of a controlled study in students in Hesse. Sucht: Zeitschrift fur Wissenschaft und Praxis 2015;61(3):127‐37. [Google Scholar]
Jago 2015 {published data only}
- Jago R, Sebire SJ, Davies B, Wood L, Banfield K, Edwards MJ, et al. Increasing children's physical activity through a teaching‐assistant led extracurricular intervention: Process evaluation of the action 3:30 randomised feasibility trial. BMC Public Health 2015;15:156. [DOI] [PMC free article] [PubMed] [Google Scholar]
Jamner 2004 {published data only}
- Jamner MS, Spruijt‐Metz D, Bassin S, Cooper DM. A controlled evaluation of a school‐based intervention to promote physical activity among sedentary adolescent females: Project FAB. Journal of Adolescent Health 2004;34(4):279‐89. [DOI] [PubMed] [Google Scholar]
Janssen 2015 {published data only}
- Janssen M, Twisk JW, Toussaint HM, Mechelen W, Verhagen EA. Effectiveness of the PLAYgrounds programme on PA levels during recess in 6‐year‐old to 12‐year‐old children. British Journal of Sports Medicine 2015;49(4):259‐64. [DOI] [PubMed] [Google Scholar]
Jarani 2016 {published data only}
- Jarani J, Grontved A, Muca F, Spahi A, Qefalia D, Ushtelenca K, et al. Effects of two physical education programmes on health‐ and skill‐related physical fitness of Albanian children. Journal of Sports Sciences 2016;34(1):35‐46. [DOI] [PubMed] [Google Scholar]
Jemmott 2011 {published data only}
- Jemmott JB 3rd, Jemmott LS, O’Leary A, Ngwane Z, Icard L, Bellamy S, et al. Cognitive‐behavioural health‐promotion intervention increases fruit and vegetable consumption and physical activity among South African adolescents: a cluster‐randomised controlled trial. Psychology and Health 2011;26(2):167‐85. [DOI] [PMC free article] [PubMed] [Google Scholar]
Jones 2014 {published data only}
- Jones BA, Madden GJ, Wengreen HJ, Aguilar SS, Desjardins EA. Gamification of dietary decision‐making in an elementary‐school cafeteria. PLOS One 2014;9(4):e93872. [DOI] [PMC free article] [PubMed] [Google Scholar]
Jurg 2006 {published data only}
- Jurg ME, Kremers SP, Candel MJ, Wal MF, Meij JS. A controlled trial of a school‐based environmental intervention to improve physical activity in Dutch children: JUMP‐in, kids in motion. Health Promotion International 2006;21(4):320‐30. [DOI] [PubMed] [Google Scholar]
Kaushik 2012 {published data only}
- Kaushik U, Shrivastav R, Arora M, Reddy KS. Scaling up a successful school based tobacco use prevention program in India: from efficacy to effectiveness. Circulation 2012;125 (19):e898. [Google Scholar]
Kelder 2003 {published data only}
- Kelder SH, Mitchell PD, McKenzie TL, Derby C, Strikmiller PK, Luepker RV, et al. Long‐term implementation of the Catch Physical Education Program. Health Education & Behavior 2003;30(4):463‐75. [DOI] [PubMed] [Google Scholar]
Kellam 1998 {published data only}
- Kellam SG, Anthony JC. Targeting early antecedents to prevent tobacco smoking: Findings from an epidemiologically based randomized field trial. American Journal of Public Health 1998;88(10):1490‐5. [DOI] [PMC free article] [PubMed] [Google Scholar]
Kelly 2015 {published data only}
- Kelly AB, Evans‐Whipp TJ, Smith R, Chan GCK, Toumbourou JW, Patton GC, et al. A longitudinal study of the association of adolescent polydrug use, alcohol use and high school non‐completion. Addiction 2015;110(4):627‐35. [DOI] [PMC free article] [PubMed] [Google Scholar]
Killen 1996 {published data only}
- Killen JD. Development and evaluation of a school‐based eating disorder symptoms prevention program. In: Smolak L, Striegel‐Moore RH, Levine MP editor(s) editor(s). The Developmental Psychopathology of Eating Disorders: Implications of Research, Prevention, and Treatment. Mahwah (NJ): Lawrence Erlbaum Assoc, 1996:313‐39. [Google Scholar]
Kim 2012 {published data only}
- Kim K, Hong SA, Yun SH, Ryou HJ, Lee SS, Kim MK. The effect of a healthy school tuck shop program on the access of students to healthy foods. Nutrition Research & Practice 2012;6(2):138‐45. [DOI] [PMC free article] [PubMed] [Google Scholar]
Kobel 2014 {published data only}
- Kobel S, Wirt T, Schreiber A, Kesztyus D, Kettner S, Erkelenz N, et al. Intervention effects of a school‐based health promotion programme on obesity related behavioural outcomes. Journal of Obesity 2014;129(3):237‐43. [DOI] [PMC free article] [PubMed] [Google Scholar]
Kocken 2016 {published data only}
- Kocken PL, Scholten AM, Westhoff E, Kok BPH, Taal EM, Goldbohm RA. Effects of a theory‐based education program to prevent overweightness in primary school children. Nutrients 2016;8(1):12. [DOI] [PMC free article] [PubMed] [Google Scholar]
Kolbe 1995 {published data only}
- Kolbe LJ, Kann L, Collins JL, Small ML, Pateman BC, Warren CW. The School Health Policies and Programs Study (SHPPS): Context, methods, general findings, and future efforts. Journal of School Health 1995;65(8):339‐43. [DOI] [PubMed] [Google Scholar]
Krolner 2012 {published data only}
- Krolner R, Suldrup Jorgensen T, Aarestrup AK, Hjollund Christiansen A, Christensen AM, Due P. The Boost study: Design of a school‐ and community‐based randomised trial to promote fruit and vegetable consumption among teenagers. BMC Public Health 2012;12:191. [DOI] [PMC free article] [PubMed] [Google Scholar]
Krolner 2013 {published data only}
- Krolner R, Thygesen LC, Andersen A, Jorgensen SE, Aarestrup AK, Jorgensen TS, et al. Promoting fruit and vegetable consumption among teenagers: First year results from the multi‐component cluster‐randomised Boost study. European Journal of Epidemiology 2013;1:227. [Google Scholar]
Kustiani 2015 {published data only}
- Kustiani AI, Madanijah S, Baliwati YF. Changes in fiber intake and body weight of multi‐component intervention program among bogor obese children, Indonesia. Pakistan Journal of Nutrition 2015;14(11):785‐91. [Google Scholar]
Larsen 2015 {published data only}
- Larsen AL, Robertson T, Dunton G. Re‐aim analysis of a randomized school‐based nutrition intervention among fourth‐grade classrooms in California. Translational Behavioral Medicine 2015;5(3):315‐26. [DOI] [PMC free article] [PubMed] [Google Scholar]
Laurence 2007 {published data only}
- Laurence S, Peterken R, Burns C. Fresh Kids: the efficacy of a health promoting schools approach to increasing consumption of fruit and water in Australia. Health Promotion International 2007;22(3):218‐26. [DOI] [PubMed] [Google Scholar]
Lazorick 2015 {published data only}
- Lazorick S, Fang X, Hardison GT, Crawford Y. Improved body mass index measures following a middle school‐based obesity intervention‐the MATCH program. Journal of School Health 2015;85(10):680‐7. [DOI] [PubMed] [Google Scholar]
Leatherdale 2014 {published data only}
- Leatherdale ST, Brown KS, Carson V, Childs RA, Dubin JA, Elliott SJ, et al. The COMPASS study: A longitudinal hierarchical research platform for evaluating natural experiments related to changes in school‐level programs, policies and built environment resources. BMC Public Health 2014;14(1):331. [DOI] [PMC free article] [PubMed] [Google Scholar]
Leatherdale 2015 {published data only}
- Leatherdale ST, Cole A. Examining the impact of changes in school tobacco control policies and programs on current smoking and susceptibility to future smoking among youth in the first two years of the COMPASS study: Looking back to move forward. Tobacco Induced Diseases 2015;13:8. [DOI] [PMC free article] [PubMed] [Google Scholar]
Lee 2014 {published data only}
- Lee RM, Okechukwu C, Emmons KM, Gortmaker SL. Impact of implementation factors on children's water consumption in the out‐of‐school nutrition and physical activity group‐randomized trial. New Directions for Youth Development 2014;2014(143):79‐101. [DOI] [PMC free article] [PubMed] [Google Scholar]
Lehto 2014 {published data only}
- Lehto R, Määttä S, Lehto E, Ray C, Velde S, Lien N, et al. The PRO GREENS intervention in Finnish schoolchildren – the degree of implementation affects both mediators and the intake of fruits and vegetables. British Journal of Nutrition 2014;112(7):1185‐94. [DOI] [PubMed] [Google Scholar]
Leiva 2014 {published data only}
- Leiva A, Estela A, Torrent M, Calafat A, Bennasar M, Yáñez A. Effectiveness of a complex intervention in reducing the prevalence of smoking among adolescents: study design of a cluster‐randomized controlled trial. BMC Public Health 2014;14:373. [DOI] [PMC free article] [PubMed] [Google Scholar]
Leme 2016 {published data only}
- Leme ACB, Lubans DR, Guerra PH, Dewar D, Toassa EC, Philippi ST. Preventing obesity among Brazilian adolescent girls: Six‐month outcomes of the Healthy Habits, Healthy Girls‐Brazil school‐based randomized controlled trial. Preventive Medicine 2016;86:77‐83. [DOI] [PubMed] [Google Scholar]
Lerner‐Geva 2015 {published data only}
- Lerner‐Geva L, Bar‐Zvi E, Levitan G, Boyko V, Reichman B, Pinhas‐Hamiel O. An intervention for improving the lifestyle habits of kindergarten children in Israel: a cluster‐randomised controlled trial investigation. Public Health Nutrition 2015;18(9):1537‐44. [DOI] [PMC free article] [PubMed] [Google Scholar]
Li 2010 {published data only}
- Li Y, Hu X, Zhang Q, Liu A, Fang H, Hao L, et al. The nutrition‐based comprehensive intervention study on childhood obesity in China (NISCOC): a randomised cluster controlled trial. BMC Public Health 2010;10:229. [DOI] [PMC free article] [PubMed] [Google Scholar]
Li 2014 {published data only}
- Li XH, Lin S, Guo H, Huang Y, Wu L, Zhang Z, et al. Effectiveness of a school‐based physical activity intervention on obesity in school children: a nonrandomized controlled trial. BMC Public Health 2014;14:1282. [DOI] [PMC free article] [PubMed] [Google Scholar]
Lien 2010 {published data only}
- Lien N, Bjelland M, Bergh IH, Grydeland M, Anderssen SA, Ommundsen Y, et al. Design of a 20‐month comprehensive, multicomponent school‐based randomised trial to promote healthy weight development among 11‐13 year olds: The HEalth In Adolescents study. Scandinavian Journal of Public Health 2010;38(5 Suppl):38‐51. [DOI] [PubMed] [Google Scholar]
Lionis 1991 {published data only}
- Lionis C, Kafatos A, Vlachonikolis J, Vakaki M, Tzortzi M, Petraki A. The effects of a health education intervention program among Cretan adolescents. Preventive Medicine 1991;20:685‐99. [DOI] [PubMed] [Google Scholar]
Lovato 2007 {published data only}
- Lovato CY, Sabiston CM, Hadd V, Nykiforuk CIJ, Campbell HS. The impact of school smoking policies and student perceptions of enforcement on school smoking prevalence and location of smoking. Health Education Research 2007;22(6):782‐93. [DOI] [PubMed] [Google Scholar]
Lubans 2005 {published data only}
- Lubans DR. Promoting Physical Activity in the Secondary School Setting: Evaluation of the Lifetime Activity Programme [Doctoral thesis]. Ann Arbor: University of Oxford (United Kingdom), 2005. [Google Scholar]
Lubans 2010 {published data only}
- Lubans D, Morgan P, Aguiar E, Callister R. Randomised controlled trial of the Physical Activity Leaders (PALs) program for low‐active adolescent boys from disadvantaged secondary schools. Journal of Science and Medicine in Sport 2010;13:12. [DOI] [PubMed] [Google Scholar]
Lubans 2014 {published data only}
- Lubans D, Cohen K, Plotnikoff R, Callister R, Morgan P. The SCORES physical activity intervention for children attending schools in low‐income communities: A cluster RCT. Journal of Science and Medicine in Sport 2014;18:121. [Google Scholar]
Lubans 2015 {published data only}
- Lubans D, Smith J, Morgan P, Beauchamp M, Miller A, Lonsdale C, et al. Improving muscular fitness enhances psychological well‐being in low‐income adolescent boys: Findings from the ATLAS cluster RCT. Journal of Science and Medicine in Sport 2015;19:75. [Google Scholar]
Luepker 1988 {published data only}
- Luepker RV, Perry CL, Murray DM, Mullis R. Hypertension prevention through nutrition education in youth: A school‐based program involving parents. Health Psychology 1988;7:233‐45. [PubMed] [Google Scholar]
Lytle 2003 {published data only}
- Lytle LA, Ward J, Nader PR, Pedersen S, Williston BJ. Maintenance of a health promotion program in elementary schools: results from the CATCH‐ON study key informant interviews. Health Education & Behavior 2003;30(4):503‐18. [DOI] [PubMed] [Google Scholar]
Madsen 2015 {published data only}
- Madsen K, Linchey J, Gerstein D, Ross M, Myers E, Brown K, et al. Energy Balance 4 Kids with Play: Results from a two‐year cluster‐randomized trial. Childhood Obesity 2015;11(4):375‐83. [DOI] [PubMed] [Google Scholar]
Maher 2014 {published data only}
- Maher C, Crettenden A, Evans K, Thiessen M, Toohey M, Dollman J. A pedometer based physical activity self‐management program for children and adolescents with physical disability ‐ design and methods of the StepUp study. BMC Pediatrics 2014;14(1):31. [DOI] [PMC free article] [PubMed] [Google Scholar]
Mammen 2014 {published data only}
- Mammen G, Stone MR, Faulkner G, Ramanathan S, Buliung R, O'Brien C, et al. Active school travel: an evaluation of the Canadian school travel planning intervention. Preventive Medicine 2014;60:55‐9. [DOI] [PubMed] [Google Scholar]
Manios 1999 {published data only}
- Manios Y, Kafatos A. Health and nutrition education in elementary schools: changes in health knowledge, nutrient intakes and physical activity over a six year period. Public Health Nutrition 1999;2(3):445‐8. [DOI] [PubMed] [Google Scholar]
Mayorga‐Vega 2015 {published data only}
- Mayorga‐Vega D, Montoro‐Escaño J, Merino‐Marban R, Viciana J. Effects of a physical education‐based programme on health‐related physical fitness and its maintenance in high school students: A cluster‐randomized controlled trial. European Physical Education Review 2015;22(2):243‐59. [Google Scholar]
McKenzie 2001 {published data only}
- McKenzie TL, Stone EJ, Feldman HA, Epping JN, Yang M, Strikmiller PK, et al. Effects of the CATCH physical education intervention: teacher type and lesson location. American Journal of Preventive Medicine 2001;21(2):101‐9. [DOI] [PubMed] [Google Scholar]
McKenzie 2004 {published data only}
- McKenzie TL, Sallis JF, Prochaska JJ, Conway TL, Marshall SJ, Rosengard P. Evaluation of a two‐year middle‐school physical education intervention: M‐SPAN. Medicine & Science in Sports & Exercise 2004;36(8):1382‐8. [DOI] [PubMed] [Google Scholar]
Melnyk 2015 {published data only}
- Melnyk BM, Jacobson D, Kelly SA, Belyea MJ, Shaibi GQ, Small L, et al. Twelve‐month effects of the COPE Healthy Lifestyles TEEN Program on overweight and depressive symptoms in high school adolescents. Journal of School Health 2015;85(12):861‐70. [DOI] [PMC free article] [PubMed] [Google Scholar]
Midford 2014 {published data only}
- Midford R, Mitchell J, Lester L, Cahill H, Foxcroft D, Ramsden R, et al. Preventing alcohol harm: Early results from a cluster randomised, controlled trial in Victoria, Australia of comprehensive harm minimisation school drug education. International Journal of Drug Policy 2014;25(1):142‐50. [DOI] [PubMed] [Google Scholar]
Miller 2016 {published data only}
- Miller A, Christensen E, Eather N, Gray S, Sproule J, Keay J, et al. Can physical education and physical activity outcomes be developed simultaneously using a game‐centered approach?. European Physical Education Review 2016;22(1):113‐33. [Google Scholar]
Moller 2014 {published data only}
- Moller NC, Tarp J, Kamelarczyk EF, Brond JC, Klakk H, Wedderkopp N. Do extra compulsory physical education lessons mean more physically active children‐findings from the childhood health, activity, and motor performance school study Denmark (The CHAMPS‐study DK). International Journal of Behavioral Nutrition & Physical Activity 2014;11:121. [DOI] [PMC free article] [PubMed] [Google Scholar]
Moore 2007 {published data only}
- Moore L, Moore GF, Tapper K, Lynch R, Desousa C, Hale J, et al. Free breakfasts in schools: Design and conduct of a cluster randomised controlled trial of the Primary School Free Breakfast Initiative in Wales. BMC Public Health 2007;7:258. [DOI] [PMC free article] [PubMed] [Google Scholar]
Moore 2008a {published data only}
- Moore T. The Physical Activity Habits and Body Image Perceptions of Students in a Rural Healthy Ontarian Elementary School [Doctoral thesis]. Ann Arbor: University of Ottawa (Canada), 2008.
Moore 2008b {published data only}
- Moore L, Moore GF, Tapper K, Lynch R, Desousa C, Hale J, et al. The impact of school fruit tuck shops and school food policies on children's fruit consumption: a cluster randomised trial of schools in deprived areas. Journal of Epidemiology & Community Health 2008;62(10):258. [DOI] [PubMed] [Google Scholar]
Morrill 2016 {published data only}
- Morrill BA, Madden GJ, Wengreen HJ, Fargo JD, Aguilar SS. A randomized controlled trial of the Food Dudes Program: tangible rewards are more effective than social rewards for increasing short‐ and long‐term fruit and vegetable consumption. Journal of the Academy of Nutrition and Dietetics 2016;116(4):618‐29. [DOI] [PubMed] [Google Scholar]
Moskowitz 1980 {published data only}
- Moskowitz JM, Schaps E, Malvin J. A process and outcome evaluation of a magic circle primary prevention program. Napa (CA): Pacific Institute for Research and Evaluation; 1980:53. Institute of Education Sciences.
Moskowitz 1981 {published data only}
- Moskowitz JM, Malvin J, Schaeffer GA, Schaps E, Condon JW. A process and outcome evaluation of a peer teaching primary prevention program. Napa (CA): Pacific Institute for Research and Evaluation; 1981:45. Institute of Education Sciences.
Moskowitz 1982 {published data only}
- Moskowitz JM, Schaps E, Malvin JH. Process and outcome evaluation in primary prevention: The Magic Circle program. Evaluation Review 1982;6(6):775‐88. [Google Scholar]
Murphy 2011 {published data only}
- Murphy S, Moore GF, Tapper K, Lynch R, Clarke R, Raisanen L, et al. Free healthy breakfasts in primary schools: a cluster randomised controlled trial of a policy intervention in Wales, UK. Public Health Nutrition 2011;14(2):219‐26. [DOI] [PubMed] [Google Scholar]
Nadar 1996 {published data only}
- Nader PR, Sellers DE, Johnson CC, Perry CL, Stone EJ, Cook KC, et al. The effect of adult participation in a school‐based family intervention to improve children's diet and physical activity: the Child and Adolescent Trial for Cardiovascular Health. Preventive Medicine 1996;25(4):455‐64. [DOI] [PubMed] [Google Scholar]
Nader 1999 {published data only}
- Nader PR, Stone EJ, Lytle LA, Perry CL, Osganian SK, Kelder S, et al. Three‐year maintenance of improved diet and physical activity: the CATCH cohort. Archives of Pediatrics & Adolescent Medicine 1999;153(7):695‐704. [DOI] [PubMed] [Google Scholar]
Nettlefold 2012 {published data only}
- Nettlefold L, McKay H, McGuire A, Warburton D, Bredin S, Naylor P. Action Schools! BC: A whole‐school physical activity model to increase children's physical activity. Journal of Science and Medicine in Sport 2012;15:114. [Google Scholar]
Newton 2016 {published data only}
- Newton NC, Conrod PJ, Slade T, Carragher N, Champion KE, Barrett EL, et al. The long‐term effectiveness of a selective, personality‐targeted prevention program in reducing alcohol use and related harms: A cluster randomized controlled trial. Journal of Child Psychology and Psychiatry and Allied Disciplines 2016;57(9):1056‐65. [DOI] [PubMed] [Google Scholar]
Nicklas 1997 {published data only}
- Nicklas TA, Johnson CC, Webber LS, Berenson GS. School‐based programs for health‐risk reduction. Annals of the New York Academy of Sciences 1997;817(1):208‐24. [DOI] [PubMed] [Google Scholar]
Nicklas 2000 {published data only}
- Nicklas TA, O'Neil CE. Process of conducting a 5‐a‐day intervention with high school students: Gimme 5 (Louisiana). Health Education & Behavior 2000;27(2):201‐12. [DOI] [PubMed] [Google Scholar]
Olsen 1976 {published data only}
- Olsen K, Atkins W. Supplementary services and guided instruction for graduates of high school special education programs. Report and evaluation of Project SERVE (Year 1). Eau Claire (WI): District 1 Technical Inst; 1976.
Oosthuizen 2011 {published data only}
- Oosthuizen D, Oldewage‐Theron WH, Napier C. The impact of a nutrition programme on the dietary intake patterns of primary school children. South African Journal of Clinical Nutrition 2011;24(2):75‐81. [Google Scholar]
Osganian 2003 {published data only}
- Osganian SK, Hoelscher DM, Zive M, Mitchell PD, Snyder P, Webber LS. Maintenance of effects of the eat smart school food service program: results from the CATCH‐ON study. Health Education & Behavior 2003;30(4):418‐33. [DOI] [PubMed] [Google Scholar]
Osganian 2003a {published data only}
- Osganian SK, Parcel GS, Stone EJ. Introduction. Institutionalization of a school health promotion program: background and rationale of the CATCH‐ON study. Health Education & Behavior 2003;30(4):410‐7. [DOI] [PubMed] [Google Scholar]
O’Brien 2010 {published data only}
- O’Brien LM, Polacsek M, MacDonald PB, Ellis J, Berry S, Martin M. Impact of a school health coordinator intervention on health?related school policies and student behavior. Journal of School Health 2010;80(4):176‐85. [DOI] [PubMed] [Google Scholar]
Parcel 1995 {published data only}
- Parcel GS, O'Hara‐Tompkins NM, Harrist RB, Basen‐Engquist KM, McCormick LK, Gottlieb NH, et al. Diffusion of an effective tobacco prevention program. Part II: Evaluation of the adoption phase. Health Education Research 1995;10(3):297‐307. [DOI] [PubMed] [Google Scholar]
Parcel 2003 {published data only}
- Parcel GS, Perry CL, Kelder SH, Elder JP, Mitchell PD, Lytle LA, et al. School climate and the institutionalization of the CATCH program. Health Education & Behavior 2003;30(4):489‐502. [DOI] [PubMed] [Google Scholar]
Parham 1993 {published data only}
- Parham DL, Goodman RM, Steckler A, Schmid J, Koch G. Adoption of health education‐tobacco use prevention curricula in North Carolina school districts. Family & Community Health 1993;16(3):56‐67. [Google Scholar]
Passmore 2005 {published data only}
- Passmore S, Harris G. School Nutrition Action Groups and their effect upon secondary school‐aged pupils’ food choices. Nutrition Bulletin 2005;30(4):364‐9. [Google Scholar]
Patton 2003 {published data only}
- Patton G, Bond L, Butler H, Glover S. Changing schools, changing health? Design and implementation of the Gatehouse Project. Journal of Adolescent Health 2003;33(4):231‐9. [DOI] [PubMed] [Google Scholar]
Pearlman 2005 {published data only}
- Pearlman DN, Dowling E, Bayuk C, Cullinen K, Thacher AK. From concept to practice: Using the School Health Index to create healthy school environments in Rhode Island elementary schools. Preventing Chronic Disease 2005;2:1‐16. [PMC free article] [PubMed] [Google Scholar]
Pentz, 1990 {published data only}
- Pentz MA, Trebow EA, Hansen, William B, et al. Effects of program implementation on adolescent drug use behavior: The Midwestern Prevention Project (MPP). Evaluation Review 1990;14(3):264‐89. [Google Scholar]
Perez‐Rodrigo 2013 {published data only}
- Perez‐Rodrigo C, Calderon V, Campos Amado J, Aranceta J. Perseo project: Process evaluation, level of implementation and effectiveness. Annals of Nutrition and Metabolism 2013;63:1115. [Google Scholar]
Perry 1992 {published data only}
- Perry CL, Kelder SH, Murray DM, Klepp KI. Communitywide smoking prevention: long‐term outcomes of the Minnesota Heart Health Program and the Class of 1989 Study. American Journal of Public Health 1992;82(9):1210‐6. [DOI] [PMC free article] [PubMed] [Google Scholar]
Perry 1996 {published data only}
- Perry CL, Williams CL, Veblen‐Mortenson S, Toomey TL, Komro KA, Anstine PS, et al. Project Northland: outcomes of a communitywide alcohol use prevention program during early adolescence. American Journal of Public Health 1996;86(7):956‐65. [DOI] [PMC free article] [PubMed] [Google Scholar]
Perry 1998 {published data only}
- Perry CL, Lytle LA, Feldman H, Nicklas T, Stone E, Zive M, et al. Effects of the Child and Adolescent Trial for Cardiovascular Health (CATCH) on fruit and vegetable intake. Journal of Nutrition Education 1998;30(6):354‐60. [Google Scholar]
Perry 2009 {published data only}
- Perry CL, Stigler MH, Arora M, Reddy KS. Preventing tobacco use among young people in India: Project MYTRI. American Journal of Public Health 2009;99(5):899‐906. [DOI] [PMC free article] [PubMed] [Google Scholar]
Peterson 2000 {published data only}
- Peterson AV, Mann SL, Kealey KA, Marek PM. Experimental design and methods for school‐based randomized trials: Experience from the Hutchinson Smoking Prevention Project (HSPP). Controlled Clinical Trials 2000;21(2):144‐65. [DOI] [PubMed] [Google Scholar]
Peterson 2001 {published data only}
- Peterson K, Davison M, Wahlstrom K, Himes J, Hjelseth L, Ross J, et al. Fast Break to Learning School Breakfast Program: A report of the first year results, 1999‐2000. Minneapolis (MN): Minnesota Univ., Center for Applied Research and Educational Improvement 2001.
Peterson 2002 {published data only}
- Peterson K, Davison M, Wahlstrom K, Himes J, Irish ML. Fast Break to Learning School Breakfast Program: A report of the second year results, 2000‐2001. Minneapolis (MN): Minnesota Univ., Center for Applied Research and Educational Improvement; 2002.
Pivarnik 1994 {published data only}
- Pivarnik LF, Patnoad MS, Giddings M. A food‐safety curriculum for second‐and third‐grade elementary students. Journal of the American Dietetic Association 1994;94(8):865‐8. [DOI] [PubMed] [Google Scholar]
Plotnikoff 1999 {published data only}
- Plotnikoff R, Williams P, Fein A. Effects of a school capacity‐building intervention on children's heart health: evaluation of the Coalfields Healthy Heartbeat School Project in New South Wales, Australia. Health Education Journal 1999;58(4):389‐400. [Google Scholar]
Prelip 2012 {published data only}
- Prelip M, Kinsler J, Thai C, Erausquin JT, Slusser W. Evaluation of a school‐based multi‐component education program to improve young children’s fruit and vegetable consumption. Journal of Nutrition Education and Behavior 2012;44(4):310‐8. [DOI] [PubMed] [Google Scholar]
Prell 2005 {published data only}
- Prell HC, Berg MC, Jonsson LM, Lissner L. A school‐based intervention to promote dietary change. Journal of Adolescent Health 2005;36(6):529‐30. [DOI] [PubMed] [Google Scholar]
Presti 2015 {published data only}
- Presti G, Cau S, Oppo A, Moderato P. Increased classroom consumption of home‐provided fruits and vegetables for normal and overweight children: Results of the food dudes program in Italy. Journal of Nutrition Education & Behavior 2015;47(4):338‐44. [DOI] [PubMed] [Google Scholar]
Price 1998 {published data only}
- Price JH, Beach P, Everett S, Telljohann SK, Lewis L. Evaluation of a three?year urban elementary school tobacco prevention program. Journal of School Health 1998;68(1):26‐31. [DOI] [PubMed] [Google Scholar]
Probart 1997 {published data only}
- Probart C, McDonnell E, Achterberg C, Anger S. Evaluation of implementation of an interdisciplinary nutrition curriculum in middle schools. Journal of Nutrition Education 1997;29(4):203‐9. [Google Scholar]
Puska 1982 {published data only}
- Puska P, Vartiainen E, Pallonen U, Salonen JT, Pöyhiä P, Koskela K, et al. The North Karelia youth project: evaluation of two years of intervention on health behavior and CVD risk factors among 13‐to 15‐year old children. Preventive Medicine 1982;11(5):550‐70. [DOI] [PubMed] [Google Scholar]
Radcliffe 2005 {published data only}
- Radcliffe B, Ogden C, Welsh J, Carroll S, Coyne T, Craig P. The Queensland School Breakfast Project: a health promoting schools approach. Nutrition & Dietetics 2005;62(1):33‐40. [Google Scholar]
Rafferty 2014 {published data only}
- Rafferty JR. Where are the boys... using peer leadership to address barriers to male adolescent utilization of an urban school‐based health center. Journal of Adolescent Health 2014;1:73‐4. [Google Scholar]
Raizman 1994 {published data only}
- Raizman DJ, Montgomery DH, Osganian SK, Ebzery MK, Evans MA, Nicklas TA, et al. CATCH: food service program process evaluation in a multicenter trial. Health Education Quarterly 1994;2:51‐71. [DOI] [PubMed] [Google Scholar]
Raj 2009 {published data only}
- Raj M, Sundaram KR, Paul M, Sudhakar A, Kumar RK. Dynamics of growth and weight transitions in a pediatric cohort from India. Nutrition Journal 2009;8:55. [DOI] [PMC free article] [PubMed] [Google Scholar]
Ramseier 2013 {published data only}
- Ramseier CA, Burri M, Berres F, Davis JM. The implementation of a tobacco dependence education curriculum in a Swiss Dental Hygiene School ‐ an 8‐year review. International Journal of Dental Hygiene 2013;11(2):142‐50. [DOI] [PubMed] [Google Scholar]
Rao 2006 {published data only}
- Rao GMS, Rao DR, Venkaiah K, Dube AK, Sarma KVR. Evaluation of the Food and Agriculture Organization's global school‐based nutrition education initiative, Feeding Minds, Fighting Hunger (FMFH), in schools of Hyderabad, India. Public Health Nutrition 2006;9(8):991‐5. [DOI] [PubMed] [Google Scholar]
Raphael 2000 {published data only}
- Raphael J. Formative report on the DC 21st Century Community Learning Center After‐School Program. Washington (DC): Urban Institute; 2000;46. Institute of Education Sciences.
Reddy 2002 {published data only}
- Reddy KS, Arora M, Perry CL, Nair B, Kohli A, Lytle LA, et al. Tobacco and alcohol use outcomes of a school‐based intervention in New Delhi. American Journal of Health Behavior 2002;26(3):173‐81. [DOI] [PubMed] [Google Scholar]
Redmond 2009 {published data only}
- Redmond C, Spoth RL, Shin C, Schainker LM, Greenberg MT, Feinberg M. Long‐term protective factor outcomes of evidence‐based interventions implemented by community teams through a community‐university partnership. Journal of Primary Prevention 2009;30(5):513‐30. [DOI] [PMC free article] [PubMed] [Google Scholar]
Resnicow 1992 {published data only}
- Resnicow K, Cohn L, Reinhardt J, Cross D, Futterman R, Kirschner E, et al. A three‐year evaluation of the Know Your Body Program in inner‐city schoolchildren. Health Education Quarterly 1992;19(4):463‐80. [DOI] [PubMed] [Google Scholar]
Resnicow 1993 {published data only}
- Resnicow K, Cross D. The Know Your Body program: a review of evaluation studies. Bulletin of the New York Academy of Medicine 1993;70(3):188. [PMC free article] [PubMed] [Google Scholar]
Reynolds 2000 {published data only}
- Reynolds KD, Franklin FA, Binkley D, Raczynski JM, Harrington KF, Kirk KA, et al. Increasing the fruit and vegetable consumption of fourth‐graders: results from the high 5 project. Preventive Medicine Reports 2000;30(4):309‐19. [DOI] [PubMed] [Google Scholar]
Reynolds 2000a {published data only}
- Reynolds KD, Franklin FA, Leviton LC, Maloy J, Harrington KF, Yaroch AL, et al. Methods, results, and lessons learned from process evaluation of the high 5 school‐based nutrition intervention. Health Education & Behavior 2000;27(2):177‐86. [DOI] [PubMed] [Google Scholar]
Rhodes 2010 {published data only}
- Rhodes W, Lounsbery M. Empowering students through leadership: Gymleaders ‐ a program that works. Strategies: A Journal for Physical and Sport Educators 2010;23(6):28‐32. [Google Scholar]
Ridgers 2007 {published data only}
- Ridgers ND, Stratton G, Fairclough SJ, Twisk JW. Long‐term effects of a playground markings and physical structures on children's recess physical activity levels. Preventive Medicine 2007;44(5):393‐7. [DOI] [PubMed] [Google Scholar]
Riley 2016 {published data only}
- Riley N, Lubans DR, Holmes K, Morgan PJ. Findings from the EASY minds cluster randomized controlled trial: Evaluation of a physical activity integration program for mathematics in primary schools. Journal of Physical Activity and Health 2016;13(2):198‐206. [DOI] [PubMed] [Google Scholar]
Ringwalt 2009 {published data only}
- Ringwalt CL, Pankratz MM, Hansen WB, Dusenbury L, Jackson‐Newsom J, Giles SM, et al. The potential of coaching as a strategy to improve the effectiveness of school‐based substance use prevention curricula. Health Education & Behavior 2009;36(4):696‐710. [DOI] [PubMed] [Google Scholar]
Rissel 2012 {published data only}
- Rissel C, Laws R, George A, Hector D, Milat AJ, Baur LA. Research to practice: Application of an evidence building framework to a childhood obesity prevention initiative in New South Wales. Health Promotion Journal of Australia 2012;23(1):16‐24. [DOI] [PubMed] [Google Scholar]
Robbins 2012 {published data only}
- Robbins LB, Pfeiffer KA, Maier KS, Ladrig SM, Berg‐Smith SM. Treatment fidelity of motivational interviewing delivered by a school nurse to increase girls' physical activity. Journal of School Nursing 2012;28(1):70‐8. [DOI] [PMC free article] [PubMed] [Google Scholar]
Robbins 2014 {published data only}
- Robbins LB, Pfeiffer KA, Wesolek SM, Lo Y‐J. Process evaluation for a school‐based physical activity intervention for 6th‐and 7th‐grade boys: Reach, dose, and fidelity. Evaluation and Program Planning 2014;42:21‐31. [DOI] [PubMed] [Google Scholar]
Robert 2006 {published data only}
- Robert RC, Gittelsohn J, Creed‐Kanashiro HM, Penny ME, Caulfield L, Narro MR, et al. Process evaluation determines the pathway of success for a health center‐delivered, nutrition education intervention for infants in Trujillo, Peru. Journal of Nutrition 2006;136(3):634‐41. [DOI] [PubMed] [Google Scholar]
Rogers 2007 {published data only}
- Rogers IS, Ness AR, Hebditch K, Jones LR, Emmett PM. Quality of food eaten in English primary schools: school dinners vs packed lunches. European Journal of Clinical Nutrition 2007;61(7):856‐64. [DOI] [PubMed] [Google Scholar]
Romero 1994 {published data only}
- Romero F. California programs to prevent and reduce drug, alcohol, and tobacco use among school youth: 1992‐93 Annual Evaluation Report. Los Alamitos (CA): Southwest Regional Laboratory; 1994: 108. Institute of Education Sciences.
Rosario 2012 {published data only}
- Rosario R, Araujo A, Oliveira B, Padrao P, Lopes O, Teixeira V, et al. The impact of an intervention taught by trained teachers on childhood fruit and vegetable intake: A randomized trial. Journal of Obesity 2012;2012:1‐8. [DOI] [PMC free article] [PubMed] [Google Scholar]
Rosario 2012a {published data only}
- Rosario R, Oliveira B, Araujo A, Lopes O, Padrao P, Moreira A, et al. The impact of an intervention taught by trained teachers on childhood overweight. International Journal of Environmental Research & Public Health 2012;9(4):1355‐67. [DOI] [PMC free article] [PubMed] [Google Scholar]
Rosario 2013 {published data only}
- Rosario R, Araujo A, Oliveira B, Padrao P, Lopes O, Teixeira V, et al. Impact of an intervention through teachers to prevent consumption of low nutrition, energy‐dense foods and beverages: a randomized trial. Preventive Medicine 2013;57(1):20‐5. [DOI] [PubMed] [Google Scholar]
Rosario 2016 {published data only}
- Rosário R, Araújo A, Padrão P, Lopes O, Moreira A, Abreu S. Impact of a school‐based intervention to promote fruit intake: a cluster randomized controlled trial. Public Health 2016;136:94‐100. [DOI] [PubMed] [Google Scholar]
Rosenbaum 2007 {published data only}
- Rosenbaum M, Nonas C, Weil R, Horlick M, Fennoy I, Vargas I, et al. School‐based intervention acutely improves insulin sensitivity and decreases inflammatory markers and body fatness in junior high school students. Journal of Clinical Endocrinology & Metabolism 2007;92(2):504‐8. [DOI] [PubMed] [Google Scholar]
Rosenkranz 2012 {published data only}
- Rosenkranz RR, Lubans DR, Peralta LR, Bennie A, Sanders T, Lonsdale C. A cluster‐randomized controlled trial of strategies to increase adolescents' physical activity and motivation during physical education lessons: the Motivating Active Learning in Physical Education (MALP) trial. BMC Public Health 2012;12:834. [DOI] [PMC free article] [PubMed] [Google Scholar]
Roseveare 1999 {published data only}
- Roseveare CA, Brown JM, Barclay McIntosh JM, Chalmers DJ. An intervention to reduce playground equipment hazards. Injury Prevention 1999;5(2):124‐8. [DOI] [PMC free article] [PubMed] [Google Scholar]
Rothwell 2011 {published data only}
- Rothwell H, Segrott J. Preventing alcohol misuse in young people aged 9‐11 years through promoting family communication: an exploratory evaluation of the Kids, Adults Together (KAT) Programme. BMC Public Health 2011;11:810. [DOI] [PMC free article] [PubMed] [Google Scholar]
Rowlands 2008 {published data only}
- Rowlands A, Esliger DW, Pilgrim EL, Middlebrooke AR, Eston RG. Physical activity content of Motive8 PE compared to primary school PE lessons in the context of children's overall daily activity levels. Journal of Obesity. Elsevier, 2008:1‐8.
Ruzita 2007 {published data only}
- Ruzita AT, Wan Azdie M, Ismail M. The effectiveness of nutrition education programme for primary school children. Malaysian Journal of Nutrition 2007;13(1):45‐54. [PubMed] [Google Scholar]
Sahota 2001 {published data only}
- Sahota P, Rudolf MC, Dixey R, Hill AJ, Barth JH, Cade J. Randomised controlled trial of primary school based intervention to reduce risk factors for obesity. BMJ 2001;323(7320):1029‐32. [DOI] [PMC free article] [PubMed] [Google Scholar]
Sahota 2001a {published data only}
- Sahota P, Rudolf MC, Dixey R, Hill AJ, Barth JH, Cade J. Evaluation of implementation and effect of primary school based intervention to reduce risk factors for obesity. BMJ 2001;323(7320):1027‐9. [DOI] [PMC free article] [PubMed] [Google Scholar]
Saint‐Maurice 2014 {published data only}
- Saint‐Maurice PF, Welk GJ, Russell DW, Huberty J. Moderating influences of baseline activity levels in school physical activity programming for children: the Ready for Recess project. BMC Public Health 2014;14:103. [DOI] [PMC free article] [PubMed] [Google Scholar]
Sallis 2003 {published data only}
- Sallis JF, McKenzie TL, Conway TL, Elder JP, Prochaska JJ, Brown M, et al. Environmental interventions for eating and physical activity: a randomized controlled trial in middle schools. American Journal of Preventive Medicine 2003;24(3):209‐17. [DOI] [PubMed] [Google Scholar]
Salmon 2005 {published data only}
- Salmon J, Ball K, Crawford D, Booth M, Telford A, Hume C, et al. Reducing sedentary behaviour and increasing physical activity among 10‐year‐old children: overview and process evaluation of the 'Switch‐Play' intervention. Health Promotion International 2005;20(1):7‐17. [DOI] [PubMed] [Google Scholar]
Salmon 2011 {published data only}
- Salmon J, Jorna M, Hume C, Arundell L, Chahine N, Tienstra M, et al. A translational research intervention to reduce screen behaviours and promote physical activity among children: Switch‐2‐Activity. Health Promotion International 2011;26(3):311‐21. [DOI] [PubMed] [Google Scholar]
Sanchez 2007 {published data only}
- Sanchez V, Steckler A, Nitirat P, Hallfors D, Cho H, Brodish P. Fidelity of implementation in a treatment effectiveness trial of Reconnecting Youth. Health Education Research 2007;22(1):95‐107. [DOI] [PubMed] [Google Scholar]
Sanigorski 2008 {published data only}
- Sanigorski AM, Bell AC, Kremer PJ, Cuttler R, Swinburn BA. Reducing unhealthy weight gain in children through community capacity‐building: results of a quasi‐experimental intervention program, Be Active Eat Well. International Journal of Obesity 2008;32(7):1060‐7. [DOI] [PubMed] [Google Scholar]
Schneider 2009 {published data only}
- Schneider M, Hall WJ, Hernandez AE, Hindes K, Montez G, Pham T, et al. Rationale, design and methods for process evaluation in the HEALTHY study. International Journal of Obesity 2009; Vol. 33:S60‐7. [DOI] [PMC free article] [PubMed]
Seaman 1995 {published data only}
- Seaman C, Kirk T. Nutrition education for schoolchildren ‐ the Nutri‐Programme approach. British Food Journal 1995;97(1):11‐6. [Google Scholar]
Shahnazi 2016 {published data only}
- Shahnazi H, Bee Koon P, Abd Talib R, Lubis SH, Ganjali Dashti M, Khatooni E, et al. Can the BASNEF model help to develop self‐administered healthy behavior in Iranian youth?. Iranian Red Crescent Medical Journal 2016;18(3):e23847. [DOI] [PMC free article] [PubMed] [Google Scholar]
Sharma 2015 {published data only}
- Sharma SV, Shegog R, Chow J, Finley C, Pomeroy M, Smith C, et al. Effects of the Quest to Lava Mountain computer game on dietary and physical activity behaviors of elementary school children: A pilot group‐randomized controlled trial. Journal of the Academy of Nutrition & Dietetics 2015;115(8):1260‐71. [DOI] [PubMed] [Google Scholar]
Sheetz 2003 {published data only}
- Sheetz AH. Developing school health services in Massachusetts: A public health model. Journal of School Nursing 2003;19(4):204‐11. [DOI] [PubMed] [Google Scholar]
Shensa 2016 {published data only}
- Shensa A, Phelps‐Tschang J, Miller E, Primack BA. A randomized crossover study of web‐based media literacy to prevent smoking. Health Education Research 2016;31(1):48‐59. [DOI] [PMC free article] [PubMed] [Google Scholar]
Singh 2006 {published data only}
- Singh AS, Chin APMJM, Kremers SPJ, Visscher TLS, Brug J, Mechelen W. Design of the Dutch Obesity Intervention in Teenagers (NRG‐DOiT): Systematic development, implementation and evaluation of a school‐based intervention aimed at the prevention of excessive weight gain in adolescents. BMC Public Health 2006;6:304. [DOI] [PMC free article] [PubMed] [Google Scholar]
Singh 2009 {published data only}
- Singh AS, Chinapaw MJ, Brug J, Mechelen W. Process evaluation of a school‐based weight gain prevention program: the Dutch Obesity Intervention in Teenagers (DOiT). Health Education Research 2009;24(5):772‐7. [DOI] [PubMed] [Google Scholar]
Singhal 2010 {published data only}
- Singhal N, Misra A, Shah P, Gulati S. Effects of controlled school‐based multi‐component model of nutrition and lifestyle interventions on behavior modification, anthropometry and metabolic risk profile of urban Asian Indian adolescents in North India. European Journal of Clinical Nutrition 2010;64(4):364‐73. [DOI] [PubMed] [Google Scholar]
Sirikulchayanonta 2011 {published data only}
- Sirikulchayanonta C, Pavadhgul P, Chongsuwat R, Klaewkla J. Participatory action project in reducing childhood obesity in Thai primary schools. Asia‐Pacific Journal of Public Health 2011;23(6):917‐27. [DOI] [PubMed] [Google Scholar]
Smith 2001 {published data only}
- Smith KW, Hoelscher DM, Lytle LA, Dwyer JT, Nicklas TA, Zive MM, et al. Reliability and validity of the Child and Adolescent Trial for Cardiovascular Health (CATCH) Food Checklist: a self‐report instrument to measure fat and sodium intake by middle school students. Journal of the American Dietetic Association 2001;101(6):635‐47. [DOI] [PubMed] [Google Scholar]
Smith 2015 {published data only}
- Smith NJ, Monnat SM, Lounsbery MA. Physical activity in physical education: are longer lessons better?. Journal of School Health 2015;85(3):141‐8. [DOI] [PMC free article] [PubMed] [Google Scholar]
Somsri 2016 {published data only}
- Somsri P, Satheannoppakao W, Tipayamongkholgul M, Vatanasomboon P, Kasemsup R. A cosmetic content–based nutrition education program improves fruit and vegetable consumption among grade 11 thai students. Journal of Nutrition Education & Behavior 2016;48(3):190‐8. [DOI] [PubMed] [Google Scholar]
Springer 2013 {published data only}
- Springer AE, Kelder SH, Byrd‐Williams CE, Pasch KE, Ranjit N, Delk JE, et al. Promoting energy‐balance behaviors among ethnically diverse adolescents: overview and baseline findings of The Central Texas CATCH Middle School Project. Health Education & Behavior 2013;40(5):559‐70. [DOI] [PubMed] [Google Scholar]
Stead 2007 {published data only}
- Stead M, Stradling R, MacNeil M, MacKintosh AM, Minty S. Implementation evaluation of the Blueprint multi‐component drug prevention programme: Fidelity of school component delivery. Drug and Alcohol Review 2007;26(6):653‐64. [DOI] [PubMed] [Google Scholar]
Steckler 2003 {published data only}
- Steckler A, Ethelbah B, Martin CJ, Stewart D, Pardilla M, Gittelsohn J, et al. Pathways process evaluation results: a school‐based prevention trial to promote healthful diet and physical activity in American Indian third, fourth, and fifth grade students. Preventive Medicine 2003;37(6 Pt 2):80‐90. [DOI] [PubMed] [Google Scholar]
Stone 1994 {published data only}
- Stone CS. Critique of Changing adolescent propensities to use drugs: results from project ALERT [original article by Ellickson P et al appears in HEALTH EDUC Q 1993;20(2):227‐42]. Nursing Scan in Research 1994;7(2):13‐4. [DOI] [PubMed] [Google Scholar]
Story 2002 {published data only}
- Story M, Lytle LA, Birnbaum AS, Perry CL. Peer‐led, school‐based nutrition education for young adolescents: Feasibility and process evaluation of the teens study. Journal of School Health 2002;72(3):121‐7. [DOI] [PubMed] [Google Scholar]
Stratton 2005 {published data only}
- Stratton G, Mullan E. The effect of multicolor playground markings on children's physical activity level during recess. Preventive Medicine 2005;41(5‐6):828‐33. [DOI] [PubMed] [Google Scholar]
Suchert 2015 {published data only}
- Suchert V, Isensee B, Sargent J, Weisser B, Hanewinkel R. Prospective effects of pedometer use and class competitions on physical activity in youth: A cluster‐randomized controlled trial. Preventive Medicine 2015;81:399‐404. [DOI] [PubMed] [Google Scholar]
Sussman 1993 {published data only}
- Sussman S, Dent CW, Stacy AW, Hodgson CS, Burton D, Flay BR. Project Towards No Tobacco Use: Implementation, process and post‐test knowledge evaluation. Health Education Research 1993;8(1):109‐23. [DOI] [PubMed] [Google Scholar]
Sussman 2007 {published data only}
- Sussman S, Miyano J, Rohrbach LA, Dent CW, Sun P. Six‐month and one‐year effects of project EX‐4: a classroom‐based smoking prevention and cessation intervention program. Addictive Behaviors 2007;32(12):3005‐14. [DOI] [PMC free article] [PubMed] [Google Scholar]
Sutherland 2016 {published data only}
- Sutherland R, Campbell E, Lubans DR, Morgan PJ, Okely AD, Nathan N. ‘Physical Activity 4 Everyone’school‐based intervention to prevent decline in adolescent physical activity levels: 12 month (mid‐intervention) report on a cluster randomised trial. British Journal of Sports Medicine 2016;50(8):488‐95. [DOI] [PMC free article] [PubMed] [Google Scholar]
Sy 2008 {published data only}
- Sy A, Glanz K. Factors influencing teachers' implementation of an innovative tobacco prevention curriculum for multiethnic youth: Project SPLASH. Journal of School Health 2008;78(5):264‐73. [DOI] [PMC free article] [PubMed] [Google Scholar]
Tahlil 2015 {published data only}
- Tahlil T, Woodman RJ, Coveney J, Ward PR. Six‐months follow‐up of a cluster randomized trial of school‐based smoking prevention education programs in Aceh, Indonesia. BMC Public Health 2015;15:1088. [DOI] [PMC free article] [PubMed] [Google Scholar]
Taylor 2007 {published data only}
- Taylor RW, McAuley KA, Barbezat W, Strong A, Williams SM, Mann JI. APPLE Project: 2‐y findings of a community‐based obesity prevention program in primary school age children. American Journal of Clinical Nutrition 2007;86(3):735‐42. [DOI] [PubMed] [Google Scholar]
Telford 2013 {published data only}
- Telford A, Casey M, Smyth J, Harvey J, Eime R, Mooney A, et al. An evaluation of a school community‐linked sport and recreation program for adolescent girls. Journal of Science and Medicine in Sport 2013;16:35. [Google Scholar]
Telford 2016 {published data only}
- Telford RM, Olive LS, Cochrane T, Davey R, Telford RD. Outcomes of a four‐year specialist‐taught physical education program on physical activity: A cluster randomized controlled trial, the LOOK study. International Journal of Behavioral Nutrition and Physical Activity 2016;13:64. [DOI] [PMC free article] [PubMed] [Google Scholar]
Te Velde 2008 {published data only}
- Velde S, Brug J, Wind M, Hildonen C, Bjelland M, Perez‐Rodrigo C, et al. Effects of a comprehensive fruit‐and vegetable‐promoting school‐based intervention in three European countries: the Pro Children Study. British Journal of Nutrition 2008;99(4):893‐903. [DOI] [PubMed] [Google Scholar]
Toftager 2014 {published data only}
- Toftager M, Christiansen LB, Ersboll AK, Kristensen PL, Due P, Troelsen J. Intervention effects on adolescent physical activity in the multicomponent SPACE study: A cluster randomized controlled trial. PLOS One 2014;9(6):e99369. [DOI] [PMC free article] [PubMed] [Google Scholar]
Uys 2016 {published data only}
- Uys M, Draper CE, Hendricks S, Villiers A, Fourie J, Steyn NP, et al. Impact of a South African school‐based intervention, HealthKick, on fitness correlates. American Journal of Health Behavior 2016;40(1):55‐66. [DOI] [PubMed] [Google Scholar]
Valente 2006 {published data only}
- Valente TW, Unger JB, Ritt‐Olson A, Cen SY, Anderson Johnson C. The interaction of curriculum type and implementation method on 1‐year smoking outcomes in a school‐based prevention program. Health Education Research 2006;21(3):315‐24. [DOI] [PubMed] [Google Scholar]
Vardanjani 2015 {published data only}
- Vardanjani AE, Reisi M, Javadzade H, Pour ZG, Tavassoli E. The effect of nutrition education on knowledge, attitude, and performance about junk food consumption among students of female primary schools. Journal of Education & Health Promotion 2015;4:53. [DOI] [PMC free article] [PubMed] [Google Scholar]
Velicer 2007 {published data only}
- Velicer WF, Redding CA, Anatchkova MD, Fava JL, Prochaska JO. Identifying cluster subtypes for the prevention of adolescent smoking acquisition. Addictive Behaviors 2007;32(2):228‐47. [DOI] [PubMed] [Google Scholar]
Verbestel 2015 {published data only}
- Verbestel V, Henauw S, Barba G, Eiben G, Gallois K, Hadjigeorgiou C, et al. Effectiveness of the IDEFICS intervention on objectively measured physical activity and sedentary time in European children. Obesity Reviews 2015;16:57‐67. [DOI] [PubMed] [Google Scholar]
Vetter, 2015 {published data only}
- Vetter, O'Connor H, O'Dwyer N, Orr R. Active learning: Effectiveness of learning a numeracy skill with physical activity, reducing sedentary time in school children. Journal of Science and Medicine in Sport 2015;19:12. [Google Scholar]
Veugelers 2005 {published data only}
- Veugelers PJ, Fitzgerald AL. Effectiveness of school programs in preventing childhood obesity: A multilevel comparison. American Journal of Public Health 2005;95(3):432‐5. [DOI] [PMC free article] [PubMed] [Google Scholar]
Viggiano 2015 {published data only}
- Viggiano A, Viggiano E, Costanzo A, Viggiano A, Andreozzi E, Romano V, et al. Kaledo, a board game for nutrition education of children and adolescents at school: cluster randomized controlled trial of healthy lifestyle promotion. European Journal of Pediatrics 2015;174(2):217‐28. [DOI] [PubMed] [Google Scholar]
Villa‐González 2016 {published data only}
- Villa‐González E, Ruiz JR, Ward DS, Chillón P. Effectiveness of an active commuting school‐based intervention at 6‐month follow‐up. European Journal of Public Health 2016;26(2):272‐6. [DOI] [PubMed] [Google Scholar]
Volpe 2013 {published data only}
- Volpe SL, Hall WJ, Steckler A, Schneider M, Thompson D, Mobley C, et al. Process evaluation results from the HEALTHY nutrition intervention to modify the total school food environment. Health Education Research 2013;28(6):970‐8. [DOI] [PMC free article] [PubMed] [Google Scholar]
Walter 1988 {published data only}
- Walter HJ, Hofman A, Vaughan RD, Wynder EL. Modification of risk factors for coronary heart disease. Five‐year results of a school‐based intervention trial. New England Journal of Medicine 1988;318(17):1093‐100. [DOI] [PubMed] [Google Scholar]
Wang 2015 {published data only}
- Wang D, Stewart D, Yuan Y, Chang C. Do health‐promoting schools improve nutrition in China?. Health Promotion International 2015;30(2):359‐68. [DOI] [PubMed] [Google Scholar]
Wang 2015a {published data only}
- Wang JJ, Lau WC, Wang HJ, Ma J. Evaluation of a comprehensive intervention with a behavioural modification strategy for childhood obesity prevention: a nonrandomized cluster controlled trial. BMC Public Health 2015;15:1206. [DOI] [PMC free article] [PubMed] [Google Scholar]
Wechsler 1998 {published data only}
- Wechsler H, Basch CE, Zybert P, Shea S. Promoting the selection of low‐fat milk in elementary school cafeterias in an inner‐city Latino community: evalaution of an intervention. American Journal of Public Health 1998;88(3):427‐33. [DOI] [PMC free article] [PubMed] [Google Scholar]
Wechsler 2001 {published data only}
- Wechsler H, Brener ND, Kuester S, Miller C. Food service and foods and beverages available at school: results from the School Health Policies and Programs Study 2000. Journal of School Health 2001;71(7):313‐24. [DOI] [PubMed] [Google Scholar]
Weichold 2016 {published data only}
- Weichold K, Blumenthal A. Long‐term effects of the life skills program IPSY on substance use: Results of a 4.5‐year longitudinal study. Prevention Science 2016;17(1):13‐23. [DOI] [PubMed] [Google Scholar]
Weiss 2015 {published data only}
- Weiss MR, Phillips AC, Kipp LE. Effectiveness of a school‐based fitness program on youths' physical and psychosocial health outcomes. Pediatric Exercise Science 2015;27(4):547‐57. [DOI] [PubMed] [Google Scholar]
Welk 2015 {published data only}
- Welk GJ, Chen S, Nam YH, Weber TE. A formative evaluation of the SWITCH obesity prevention program: print versus online programming. BMC Obesity 2015;2:20. [DOI] [PMC free article] [PubMed] [Google Scholar]
Werch 1998 {published data only}
- Werch CE, Pappas DM, Carlson JM, DiClemente CC. Short‐and long‐term effects of a pilot prevention program to reduce alcohol consumption. Substance Use & Misuse 1998;33(11):2303‐21. [DOI] [PubMed] [Google Scholar]
Whittemore 2013 {published data only}
- Whittemore R, Chao A, Jang M, Jeon S, Liptak T, Popick R, et al. Implementation of a school‐based internet obesity prevention program for adolescents. Journal of Nutrition Education and Behavior 2013;45(6):586‐94. [DOI] [PMC free article] [PubMed] [Google Scholar]
Whitt‐Glover 2011 {published data only}
- Whitt‐Glover MC, Ham SA, Yancey AK. Instant Recess: a practical tool for increasing physical activity during the school day. Progress in Community Health Partnerships 2011;5(3):289‐97. [DOI] [PubMed] [Google Scholar]
Williams 2011 {published data only}
- Williams AD, Warrington V. Get Fit Kids: A feasibility study of a pedometer‐based walking program. Bariatric Nursing and Surgical Patient Care 2011;6(3):139‐43. [Google Scholar]
Williamson 2013 {published data only}
- Williamson DA, Han H, Johnson WD, Martin CK, Newton RL Jr. Modification of the school cafeteria environment can impact childhood nutrition. Results from the Wise Mind and LA Health studies. Appetite 2013;61(1):77‐84. [DOI] [PMC free article] [PubMed] [Google Scholar]
Wind 2008 {published data only}
- Wind M, Bjelland M, Perez‐Rodrigo C, Velde SJ, Hildonen C, Bere E, et al. Appreciation and implementation of a school‐based intervention are associated with changes in fruit and vegetable intake in 10‐ to 13‐year old schoolchildren—the Pro Children study. Health Education Research 2008;23(6):997‐1007. [DOI] [PubMed] [Google Scholar]
Xu 2015 {published data only}
- Xu F, Ware RS, Leslie E, Tse LA, Wang Z, Li J, et al. Effectiveness of a randomized controlled lifestyle intervention to prevent obesity among Chinese primary school students: CLICK‐Obesity Study. PLOS One 2015;10(10):e0141421. [DOI] [PMC free article] [PubMed] [Google Scholar]
Zask 2012 {published data only}
- Zask A, Adams JK, Brooks LO, Hughes DF. Tooty Fruity Vegie: An obesity prevention intervention evaluation in Australian preschools. Health Promotion Journal of Australia 2012;23(1):10‐5. [DOI] [PubMed] [Google Scholar]
Zebregs 2015 {published data only}
- Zebregs S, Putte B, Graaf A, Lammers J, Neijens P. The effects of narrative versus non‐narrative information in school health education about alcohol drinking for low educated adolescents. BMC Public Health 2015;15:1‐12. [DOI] [PMC free article] [PubMed] [Google Scholar]
Zive 2002 {published data only}
- Zive MM, Pelletier RL, Sallis JF, Elder JP. An environmental intervention to improve a la carte foods at middle schools. Journal of the American Dietetic Association 2002;102(3):76‐8. [DOI] [PubMed] [Google Scholar]
Zota 2016 {published data only}
- Zota D, Dalma A, Petralias A, Lykou A, Kastorini CM, Yannakoulia M, et al. Promotion of healthy nutrition among students participating in a school food aid program: A randomized trial. International Journal of Public Health 2016;61(5):583‐92. [DOI] [PubMed] [Google Scholar]
References to ongoing studies
Lonsdale 2016 {published data only}
- Lonsdale C, Sanders T, Cohen KE, Parker P, Noetel M, Hartwig T. Scaling‐up an efficacious school‐based physical activity intervention: study protocol for the ‘Internet‐based Professional Learning to help teachers support Activity in Youth’(iPLAY) cluster randomized controlled trial and scale‐up implementation evaluation. BMC Public Health 2016;16(1):873. [DOI] [PMC free article] [PubMed] [Google Scholar]
Additional references
AONSW 2012
- Audit Office of New South Wales (AONSW). New South Wales Auditor‐General's Report, Performance Audit, Physical Activity in Government Primary Schools, Department of Education and Communities. www.audit.nsw.gov.au/ArticleDocuments/246/01_PAB_Physical_Activity_Full_Report.pdf.aspx?Embed=Y (accessed prior to 22 March 2017).
Arditi 2017
- Arditi C, Rège‐Walther M, Durieux P, Burnand B. Computer‐generated reminders delivered on paper to healthcare professionals: effects on professional practice and healthcare outcomes. Cochrane Database of Systematic Reviews 2017, Issue 7. [DOI: 10.1002/14651858.CD001175.pub4] [DOI] [PMC free article] [PubMed] [Google Scholar]
Buller 2010
- Buller DB. Continuing issues for dissemination and implementation of cancer prevention interventions. American Journal of Preventive Medicine 2010;38(4):462‐3. [DOI] [PubMed] [Google Scholar]
Cane 2012
- Cane J, Connor D, Michie S. Validation of the theoretical domains framework for use in behaviour change and implementation research. Implementation Science 2012;7:37. [DOI] [PMC free article] [PubMed] [Google Scholar]
CPHG 2011
- Cochrane Public Health Group (CPHG). Guide for Developing a Cochrane Protocol. www.ph.cochrane.org/sites/ph.cochrane.org/files/public/uploads/Guide%20for%20PH%20protocol_Nov%202011_final%20for%20website.pdf (accessed prior to 22 March 2017).
Damschroder 2009
- Damschroder LJ, Aron DC, Keith RE, Kirsh SR, Alexander JA, Lowery JC. Fostering implementation of health services research findings into practice: a consolidated framework for advancing implementation science. Implementation Science 2009;4:50. [DOI] [PMC free article] [PubMed] [Google Scholar]
De Silva‐Sanigorski 2011
- Silva‐Sanigorski A, Breheny T, Jones L, Lacy K, Kremer P, Carpenter L, et al. Government food service policies and guidelines do not create healthy school canteens. Australian and New Zealand Journal of Public Health 2011;35(2):117‐21. [DOI] [PubMed] [Google Scholar]
Dobbins 2013
- Dobbins M, Husson H, DeCorby K, LaRocca RL. School‐based physical activity programs for promoting physical activity and fitness in children and adolescents aged 6 to 18. Cochrane Database of Systematic Reviews 2013, Issue 2. [DOI: 10.1002/14651858.CD007651.pub2] [DOI] [PMC free article] [PubMed] [Google Scholar]
Downs 2012
- Downs SM, Farmer A, Quintanilha M, Berry TR, Mager DR, Willows ND, et al. From paper to practice: barriers to adopting nutrition guidelines in schools. Journal of Nutrition Education and Behavior 2012;44(2):114‐22. [DOI] [PubMed] [Google Scholar]
Durlak 2008
- Durlak JA, DuPre EP. Implementation matters: A review of research on the influence of implementation on program outcomes and the factors affecting implementation. American Journal of Community Psychology 2008;41:327‐50. [DOI] [PubMed] [Google Scholar]
Dusenbury 2003
- Dusenbury L, Brannigan R, Falco M, Hansen WB. A review of research on fidelity of implementation: implications for drug abuse prevention in school settings. Health Education Research 2003;18(2):237‐56. [DOI] [PubMed] [Google Scholar]
Eccles 2009
- Eccles MP, Armstrong D, Baker R, Cleary K, Davies H, Davies S, et al. An implementation research agenda. Implementation Science 2009;4:18. [DOI] [PMC free article] [PubMed] [Google Scholar]
Ennett 2003
- Ennett ST, Ringwalt CL, Thorne J, Rohrbach LA, Vincus A, Simons‐Rudolph A, et al. A comparison of current practice in school‐based substance use prevention programs with meta‐analysis findings. Prevention Science 2003;4(1):1‐14. [DOI] [PubMed] [Google Scholar]
EPOC 2015
- Effective Practice, Organisation of Care (EPOC). EPOC Taxonomy. www.epoc.cochrane.org/epoc‐taxonomy (accessed prior to 22 March 2017).
Forsetlund 2009
- Forsetlund L, Bjørndal A, Rashidian A, Jamtvedt G, O'Brien MA, Wolf FM, et al. Continuing education meetings and workshops: effects on professional practice and health care outcomes. Cochrane Database of Systematic Reviews 2009, Issue 2. [DOI: 10.1002/14651858.CD003030.pub2] [DOI] [PMC free article] [PubMed] [Google Scholar]
Foxcroft 2011
- Foxcroft DR, Tsertsvadze A. Universal school‐based prevention programs for alcohol misuse in young people. Cochrane Database of Systematic Reviews. Cochrane Database of Systematic Reviews 2011, Issue Issue 5. Art. No.: CD009113.. [DOI: 10.1002/14651858.CD009113] [DOI] [PubMed] [Google Scholar]
French 2012
- French SD, Green SE, O’Connor DA, McKenzie JE, Francis JJ, Michie S, et al. Developing theory‐informed behaviour change interventions to implement evidence into practice: a systematic approach using the Theoretical Domains Framework. Implementation Science 2012;7:38. [DOI] [PMC free article] [PubMed] [Google Scholar]
Gabriel 2009
- Gabriel CG, Vasconcelos FA, Andrade DF, Schmitz BA. First law regulating school canteens in Brazil: evaluation after seven years of implementation. Archivos Latinoamericanos de Nutricion 2009;59(2):128‐38. [PubMed] [Google Scholar]
Glasgow 1999
- Glasgow RE, Vogt TM, Boles SM. Evaluating the public health impact of health promotion interventions: the RE‐AIM framework. American Journal of Public Health 1999;89(9):1322‐7. [DOI] [PMC free article] [PubMed] [Google Scholar]
Glasgow 2012
- Glasgow RE, Vinson C, Chambers D, Khoury MJ, Kaplan RM, Hunter C. National Institutes of Health approaches to dissemination and implementation science: current and future directions. American Journal of Public Health 2012;102(7):1274‐81. [DOI] [PMC free article] [PubMed] [Google Scholar]
Greene 2008
- Greene J, Speizer H, Wiitala W. Telephone and web: Mixed‐mode challenge. Health Services Research 2008;43(1):230‐48. [DOI] [PMC free article] [PubMed] [Google Scholar]
Grimshaw 2004
- Grimshaw J, Thomas R, MacLennan G, Fraser CR, Ramsay CR, Vale LE, et al. Effectiveness and efficiency of guideline dissemination and implementation strategies. Health Technology Assessment 2004;8(6):1‐72. [DOI] [PubMed] [Google Scholar]
Guerra 2014
- Guerra PH, Nobre MR, Silveira JA, Taddei JA. School‐based physical activity and nutritional education interventions on body mass index: A meta‐analysis of randomised community trials ‐ Project PANE. Preventive Medicine 2014;61:81‐9. [DOI] [PubMed] [Google Scholar]
Higgins 2008
- Higgins J, Thompson SG, Spiegelhalter DJ. A re‐evaluation of random‐effects meta‐analysis. Journal of the Royal Statistical Society: Series A (Statistics in Society) 2009;172(1):137‐59. [DOI] [PMC free article] [PubMed] [Google Scholar]
Higgins 2011
- Higgins JPT, Green S (editors). Cochrane Handbook for Systematic Reviews of Interventions Version 5.1.0 [updated March 2011]. The Cochrane Collaboration, 2011. Available from handbook.cochrane.org.
IHME 2013
- Institute for Health Metrics and Evaluation (IHME). Global Burden of Disease Study 2013. www.healthdata.org/gbd (accessed prior to 22 March 2017).
Ivers 2012
- Ivers N, Jamtvedt G, Flottorp S, Young JM, Odgaard‐Jensen J, French SD, et al. Audit and feedback: effects on professional practice and healthcare outcomes. Cochrane Database of Systematic Reviews 2012, Issue 6. [DOI: 10.1002/14651858.CD000259.pub3] [DOI] [PMC free article] [PubMed] [Google Scholar]
Jaime 2009
- Jaime PC, Lock K. Do school based food and nutrition policies improve diet and reduce obesity?. Preventive Medicine 2009;48(1):45‐53. [DOI] [PubMed] [Google Scholar]
Kahn 2002
- Kahn EB, Ramsey LT, Brownson RC, Heath GW, Howze EH, Powell KE, et al. The effectiveness of interventions to increase physical activity: A systematic review. American Journal of Preventive Medicine 2002;22(4):73‐107. [DOI] [PubMed] [Google Scholar]
Khoury 2010
- Khoury MJ, Gwinn M, Ioannidis JP. The emergence of translational epidemiology: from scientific discovery to population health impact. American Journal of Epidemiology 2010;172(5):517‐24. [DOI] [PMC free article] [PubMed] [Google Scholar]
Lau 2015
- Lau R, Stevenson F, Ong BN, Dziedzic K, Treweek S, Eldridge S, et al. Achieving change in primary care—effectiveness of strategies for improving implementation of complex interventions: systematic review of reviews. BMJ Open 2015;5:12. [DOI] [PMC free article] [PubMed] [Google Scholar]
Lim 2012
- Lim SS, Vos T, Flaxman AD, Danaei G, Shibuya K, Adair‐Rohani H, et al. A comparative risk assessment of burden of disease and injury attributable to 67 risk factors and risk factor clusters in 21 regions, 1990–2010: a systematic analysis for the Global Burden of Disease Study 2010. Lancet 2012;380(9859):2224‐60. [DOI] [PMC free article] [PubMed] [Google Scholar]
Mazza 2013
- Mazza D, Bairstow P, Buchan H, Paubrey Chakraborty S, Hecke O, Grech C, et al. Refining a taxonomy for guideline implementation: results of an exercise in abstract classification. Implementation Science 2013;8(32):1‐10. [DOI] [PMC free article] [PubMed] [Google Scholar]
Milat 2016
- Milat AJ, Newson R, King L, Rissel C, Wolfenden L, Bauman A. A guide to scaling up population health interventions. Public Health Research & Practice 2016;26(1):e2611604. [DOI] [PubMed] [Google Scholar]
Nathan 2011
- Nathan N, Wolfenden L, Butler M, Bell A, Wyse R, Campbell E, et al. Adoption of vegetable and fruit breaks in Australian primary Schools: prevalence, attitudes, barriers and implementation strategies. Health Education Research 2011;26(4):722‐31. [DOI] [PubMed] [Google Scholar]
Naylor 2015
- Naylor PJ, Nettlefold L, Race D, Hoy C, Ashe MC, Higgins JW, et al. Implementation of school based physical activity interventions: a systematic review. Preventive Medicine 2015;31(72):95‐115. [DOI] [PubMed] [Google Scholar]
Pettigrew 2012
- Pettigrew S, Pescud M, Donovan RJ. Outcomes of the West Australian school healthy food and drink policy. Nutrition & Dietetics 2012;69(1):20‐5. [Google Scholar]
Pinnock 2017
- Pinnock H, Barwick M, Carpenter CR, Eldridge S, Grandes G, Griffiths CJ, et al. Standards for Reporting Implementation Studies (StaRI) Statement. BMJ 2017;356:i6795. [DOI] [PMC free article] [PubMed] [Google Scholar]
Rabin 2008
- Rabin BA, Brownson RC, Haire‐Joshu D, Kreuter MW, Weaver NL. A glossary for dissemination and implementation research in health. Journal of Public Health Management and Practice 2008;14(2):117‐23. [DOI] [PubMed] [Google Scholar]
Rabin 2010
- Rabin BA, Glasgow RE, Kerner JF, Klump MP, Brownson RC. Dissemination and implementation research on community‐based cancer prevention: a systematic review. American Journal of Preventive Medicine 2010;38(4):443‐56. [DOI] [PubMed] [Google Scholar]
Scott 2011
- Scott A, Sivey P, Ait Ouakrim D, Willenberg L, Naccarella L, Furler J, et al. The effect of financial incentives on the quality of health care provided by primary care physicians. Cochrane Database of Systematic Reviews 2011, Issue 9. [DOI: 10.1002/14651858.CD008451.pub2] [DOI] [PubMed] [Google Scholar]
Swinburn 2011
- Swinburn BA, Sacks G, Hall KD, McPherson K, Finegood DT, Moodie ML, et al. The global obesity pandemic: shaped by global drivers and local environments. Lancet 2011;378(9793):804‐14. [DOI] [PubMed] [Google Scholar]
Thomas 2013
- Thomas RE, McLellan J, Perera R. School‐based programmes for preventing smoking. Cochrane Database of Systematic Reviews 2013, Issue 4. [DOI: 10.1002/14651858.CD001293.pub3] [DOI] [PMC free article] [PubMed] [Google Scholar]
Waters 2011
- Waters E, Sliva‐Sanigorski A, Hall BJ, Brown T, Campbell Kj, Gao Y, et al. Interventions for preventing obesity in children. Cochrane Database of Systematic Reviews 2011, Issue 12. [DOI: 10.1002/14651858.CD001871.pub3] [DOI] [PubMed] [Google Scholar]
Watts 2014
- Watts AW, Mâsse LC, Naylor PJ. Changes to the school food and physical activity environment after guideline implementation in British Columbia, Canada. International Journal of Behavioral Nutrition and Physical Activity 2014;11(1):50. [DOI] [PMC free article] [PubMed] [Google Scholar]
WHO 2011
- World Health Organization. Global status report on noncommunicable diseases 2010. Publication date: April 2011. Available from http://www.who.int/nmh/publications/ncd_report2010/en/.
WHO 2012
- World Health Organization. Population‐based approaches to childhood obesity prevention. 2012. Global Strategy on Diet, Physical Activity and Health. Available from http://www.who.int/dietphysicalactivity/childhood/approaches/en/.
Wolfenden 2010
- Wolfenden L, Wiggers J, Tursan d'Espaignet E, Bell AC. How useful are systematic reviews of child obesity interventions?. Obesity Reviews 2010;11:159‐65. [DOI] [PubMed] [Google Scholar]
Wolfenden 2015
- Wolfenden L, Ziersch A, Robinson P, Lowe J, Wiggers J, Lowe J. Reducing research waste and improving research impact. Australian and New Zealand Journal of Public Health 2015;39(4):303‐4. [DOI] [PubMed] [Google Scholar]
Wolfenden 2016
- Wolfenden L, Jones J, Williams CM, Finch M, Wyse RJ, Kingsland M, et al. Strategies to improve the implementation of healthy eating, physical activity and obesity prevention policies, practices or programmes within childcare services. Cochrane Database of Systematic Reviews 2016, Issue 10. [DOI: 10.1002/14651858.CD011779.pub2] [DOI] [PMC free article] [PubMed] [Google Scholar]
Wolfenden 2016b
- Wolfenden L, Milat AJ, Lecathelinais C, Skelton E, Clinton‐McHarg T, Williams C, et al. A bibliographic review of public health dissemination and implementation research output and citation rates. Preventive Medicine Reports 2016;4:441‐3. [DOI] [PMC free article] [PubMed] [Google Scholar]
Wolfenden 2016c
- Wolfenden L, Williams CM, Wiggers J, Nathan N, Yoong SL. Improving the translation of health promotion interventions using effectiveness–implementation hybrid designs in program evaluations. Health Promotion Journal of Australia 2016;27(3):204‐7. [DOI] [PubMed] [Google Scholar]