Abstract
Background
Diabetes mellitus type 1 is a chronic disease with short and long term complications. Its goals of therapy are to eliminate the symptoms of hyperglycaemia, reduce the long term microvascular and macrovascular complications and allow the patients to achieve a normal life‐style. Basal insulin replacement for insulin dependent patients can be achieved with either intermediate or long acting insulin preparations.
Objectives
To assess the effects of intermediate acting versus long acting insulin preparations for basal insulin replacement in type 1 diabetic patients.
Search methods
We searched MEDLINE, EMBASE and The Cochrane Library, as well as reference lists, databases of ongoing trials, and requests from authors of included trials.
Selection criteria
Randomised controlled trials, assessing long acting insulin preparations compared to intermediate acting insulin preparations, in type 1 diabetic patients.
Data collection and analysis
Two reviewers independently scanned the titles. Data were extracted and analysed accordingly.
Main results
Twenty‐three randomised controlled trials were identified. A total of 3872 and 2915 participants in the intervention and in the control group, respectively, were analysed. The weighted mean difference (WMD) for the level of glycosylated haemoglobin was ‐0.08 (95% confidence interval (CI) ‐0.12 to ‐0.04) in favour of the long acting insulin arm. The WMD between the groups in fasting plasma and blood glucose levels was ‐0.63 (95% CI ‐0.86 to ‐0.40) and ‐0.86 (95% CI ‐1.00 to ‐0.72) in favour of the long acting insulins. The odds ratio for a patient on long acting insulin to develop any type of hypoglycaemia was 0.93 (95% CI 0.8 to 1.08) compared to that of a patient on intermediate acting insulins. The OR for severe hypoglycaemic episodes was 0.73 (95% CI 0.61 to 0.87), and 0.70 (95% CI of 0.63 to 0.79) for nocturnal episodes. The WMD between the long and intermediate insulin groups for hypoglycaemic events per 100 patient follow up days was ‐0.77 (95% CI ‐0.89 to ‐0.65), ‐0.0 (95% CI ‐0.02 to 0.02) and ‐0.40 (95% CI ‐0.45 to ‐0.34) for overall, severe, and nocturnal hypoglycaemic episodes. Weight gain was more prominent in the control group. No difference was noted in the quantity or quality of severe adverse events or deaths.
Authors' conclusions
Long acting insulin preparations seem to exert a beneficial effect on nocturnal glucose levels. Their effect on the overall diabetes control is clinically unremarkable. Their use as a basal insulin regimen for type 1 diabetes mellitus warrants further substantiation.
Plain language summary
Intermediate acting versus long acting insulin for type 1 diabetes mellitus
Diabetes mellitus type 1 is a chronic disease with short and long term complications. The treatment for this disease is insulin administration, with basal and bolus insulin preparations being its main stay. Neutral Protamine Hagedorn (NPH) insulin had previously been considered the standard of care for basal insulin replacement in blood glucose lowering for people with type 1 diabetes mellitus. Over the years, newer and longer acting insulins with a more physiological action profile became available: insulin ultralente, and later insulin glargine and insulin detemir. Their theoretical advantages lead to the thought of a beneficial effect on glucose level and rate of complications, such as very low levels of glucose or long term complications. The aim of this review was to assess whether this theoretical advantage is translated into real‐life benefits, by comparing the effect of long acting insulins to intermediate acting insulins on diabetes control. Twenty‐three studies fulfilled our inclusion criteria with a total of 3872 and 2915 participants in the intervention and in the control group, respectively. The methodological quality of all the studies was rated intermediate to low. Trials duration was no longer than one year. The level of glycosylated haemoglobin, a marker of diabetes control, was lower in the long acting insulin group, but the observed difference was of doubtful clinical significance. Longer acting insulins were superior mostly in their nocturnal effect, which resulted in a lower level of fasting glucose levels and fewer episodes of nocturnal hypoglycaemia. No data on long term complications were available. The currently available data can not substantiate conclusions on the benefits and risks of long acting insulins, and long‐term data are of need.
Background
Description of the condition
Diabetes mellitus is a metabolic disorder resulting from a defect in insulin secretion, insulin action, or both. A consequence of this is chronic hyperglycaemia (i.e. elevated levels of plasma glucose) with disturbances of carbohydrate, fat and protein metabolism. Long‐term complications of diabetes mellitus include retinopathy, nephropathy, neuropathy, and increased risk of cardiovascular disease. For a detailed overview of diabetes mellitus, please see under 'Additional information' in the information on the Metabolic and Endocrine Disorders Group in The Cochrane Library (see 'About the Cochrane Collaboration', 'Collaborative review groups‐CRGs'). For an explanation of methodological terms, see the main Glossary in The Cochrane Library.
Type 1 diabetes mellitus is characterised by a progressive destruction of pancreatic beta cells, which leads to insulin deficiency and overt diabetes. The goals of therapy for type 1 diabetic patients are to eliminate the symptoms of hyperglycaemia, reduce the long term microvascular and macrovascular complications and allow the patients to achieve a normal life‐style. The care of a type 1 diabetic patient requires, among other things, ongoing insulin replacement therapy. Variable insulin regimens are available to match glucose intake and insulin requirements, and the right regimen for an individual patient should be tailored according to patient's glycaemic status and co‐operation. In most regimens, basal insulin replacement is achieved via intermediate or long acting insulin, with supplemental prandial and correction‐dose of short acting insulin bolus injections.
Description of the intervention
Basal insulin replacement for insulin dependent patients with type 1 diabetes mellitus has been achieved since the 1950s with either neutral protamine Hagedorn (NPH) or insulin zinc (Lente). Currently, they are provided as a suspension of human or purified porcine insulin with protamine and zinc (NPH) or zinc alone (Lente), which provide a slower onset of action and a longer duration of activity than that of regular insulin. Insulin ultralente is a longer‐acting insulin with zinc. It has a slower onset and a prolonged duration of activity when compared to intermediate insulins. It has been used as basal insulin replacement. While the beef‐pork preparation of ultralente has no peak and lasts at least 24 hours (Rizza 1986), currently available human ultralente peaks at 8 to 16 hours, and its duration of action ranges between 20 and 36 hours (Hirsch 1998). It has a wide intra and inter‐individual variability in pharmacokinetics and pharmacodynamics (Hirsch 1998; Rosskamp 1999). In 2000, the first long acting insulin analogue (insulin glargine) was introduced, with a more physiological pharmacokinetic profile. The amino‐acid changes have shifted its isoelectric point toward a neutral pH. As a result, insulin glargine has a delayed and prolonged absorption after subcutaneous administration (Bolli 1999), with a prolonged metabolic activity of 22 to 30 hours (Heinemann 2000; Lepore 2000). Insulin detemir is another new long acting insulin analogue currently available for use in which the amino acid threonine at position 30 of the B‐region has been omitted and a fatty acid acylated to lysin at position B 29 was added. It has been shown to have a slow absorption from the subcutaneous tissue and a protracted action (Havelund 2004), and lower degree of intra patient variability of action compared with NPH insulin and insulin glargine (Heise 2004).
Why it is important to do this review
Both insulin detemir and insulin glargine were shown in vitro properties that differed significantly from human insulin. Insulin glargine showed elevated insulin‐like growth factor I (IGF‐I) receptor affinity, while insulin detemir was less potent than human insulin in binding to the IGF‐I receptor and stimulating mitogenesis as well as in binding to the insulin receptor and stimulating lipogenesis (Kurtzhals 2000). Although long term insulins are considered to be of low potential for such effect, the clinical implications of this observation has not yet been fully explored.
Many studies comparing the various types of long and intermediate insulin analogues for basal insulin replacement in type 1 diabetic patients have been published, mostly involving insulin analogues compared to NPH. Their theoretical superiority has not been obvious in the clinical setting. A recently published meta‐analysis showed that insulin glargine given once daily reduces the risk of hypoglycaemia compared with NPH insulin, with similar glycaemic control in type 2 diabetic patients (Rosenstock 2005). A review on Insulin glargine versus NPH insulin concluded that insulin glargine may also improve glycaemic control and satisfaction in type 1 diabetic patients (Ratner 2003). Clinically, it is yet to be determined whether long acting insulin as a group (glargine, detemir and ultralente) can and should substitute intermediate acting insulin (NPH, Lente) for basal insulin replacement in type 1 diabetic patients, with special focus on insulin analogues in view of their action profile. This should be assessed in terms of better glycaemic control, elimination of the symptoms of hyperglycaemia or hypoglycaemia, reduction in side‐effect rate, thus enabling more aggressive insulin treatment, as well as a reduction of the long term microvascular and macrovascular complications, as well as attention to mitogenic potential.
Objectives
To assess the effects of intermediate acting versus long acting insulin preparations for basal insulin replacement in type 1 diabetic patients.
Methods
Criteria for considering studies for this review
Types of studies
Inclusion criteria
Trial design
Attempts were made to identify all truly controlled randomised trials, in which treatment with long acting insulin preparations (glargine, detemir and ultralente) was compared to an intermediate‐acting insulin preparation (NPH, Lente), in type 1 diabetic patients. Trials with more than two treatment groups were included and analysed accordingly. We also considered cross‐over trial design (ideally, with a wash‐out period of at least one week for measurements of blood or plasma fasting glucose levels, and three months for measurements of glycosylated haemoglobin levels).
Trial duration
Trials with interventions and follow‐up periods of at least four weeks were included, to allow stabilization of glycaemic control. For glycosylated haemoglobin levels, we focused on data from trials with at least three months duration of intervention.
Exclusion criteria
Controlled randomised trials in which allocation to treatment or control group was not truly random or in which treatment allocation was not concealed, were excluded. After allocation, further concealment of treatment was impossible due to the difference between insulin preparations (insulin analogues are clear whereas NPH is a cloudy suspension). Thus, despite recognising that this may lead to biased treatment or reporting, post‐allocation blinding could not be a prerequisite. It is acknowledged that useful information about this problem might be gained from non‐randomised studies or other randomisation methods (e.g. cluster randomisation). However, for the scope of this review, such studies were not considered.
Types of participants
Inclusion criteria
Patients known to have type 1 diabetes mellitus, treated with either intermediate or long acting insulin preparations for basal insulin supplementation.
Diagnostic criteria for diabetes mellitus
Ideally, the diagnostic criteria for type 1 diabetes mellitus should have been described in the trial. To be consistent with changes in classification and diagnostic criteria of the disease through the years, the diagnosis should have been established using the standard criteria valid at the time of the beginning of the trial (ADA 1997; ADA 1999; WHO 1980; WHO 1985; WHO 1998).
Exclusion criteria
Patients treated with other modes of basal insulin supplementation (e.g. insulin pumps).
Types of interventions
Intermediate versus long acting insulin preparations for basal insulin replacement in type 1 diabetic patients, administered subcutaneously once daily or more.
(1) Intermediate insulin preparations a. NPH b. Lente (2) Long acting insulin preparations a. Ultralente b. Glargine c. Detemir
Premixed insulin preparations were also considered.
Types of outcome measures
Primary outcomes
glycaemic control (assessed primarily through measurements of glycosylated haemoglobin, as well as fasting plasma glucose or fasting blood glucose, and others);
adverse effect profile (primarily hypoglycaemia ‐ defined as low glucose measurements or hypoglycaemic related symptoms), as well as episodes of nocturnal and severe hypoglycaemia, weight gain, and others;
treatment related mortality (hyperglycaemia or hypoglycaemia), diabetes related mortality (death from myocardial infarction, stroke, peripheral vascular disease, renal disease or sudden death) and all‐cause mortality, were considered.
Secondary outcomes
long term diabetes‐related complications: non‐fatal myocardial infarction, angina pectoris, heart failure, stroke, peripheral vascular disease, renal failure, amputation (of at least one digit), vitreous haemorrhage, retinal photocoagulation, blindness in one eye or cataract extraction, or neuropathy;
health‐related quality of life (ideally measured using a validated instrument).
Covariates thought to be effect modifiers
(a) patients compliance; (b) change in concomitant medications throughout trial duration; and (c) blood pressure control.
Timing of outcome assessment
Assessment of outcome measurements was executed at three time intervals: (a) short‐term outcome measures includes data collected less than three month into trial duration; (b) intermediate‐term outcome measures includes data collected three to six months into trial duration; and (c) long‐term outcome measures includes data collected more than six months into trial duration.
Search methods for identification of studies
Electronic searches
We used electronic search strategies to identify relevant trials (as defined under 'type of studies'), as well as reviews/meta‐analyses (for identification of additional trials). The following databases were searched:
The Cochrane Library (latest issue);
MEDLINE (until recent);
EMBASE (until recent).
We also searched databases for ongoing trials:
Current Controlled Trials (http://www.controlled‐trials.com)
UK National Research Register (http://www.update‐software.com/national/nrr‐frame.html)
Center Watch Clinical Trials Listing Service (http://www.CenterWatch.com/)
National Institute of Health (http://clinicalstudies.info.nih.gov/)
The described search strategy (for a detailed search strategy see under 'Appendix 1) was used for MEDLINE. For use with EMBASE and The Cochrane Library this strategy was slightly adapted.
Searching other resources
We tried to identify additional studies by searching the reference lists of relevant trials and reviews identified. We tried to identify and contact researchers of published and conducting ongoing trials. Three of the authors replied, and some additional data were provided. Search for identification of studies was not restricted by language.
Data collection and analysis
Selection of studies
Two authors (MV, EJ) independently scanned the titles, abstract sections and keywords of every record retrieved. Full articles were retrieved for further assessment if the information given suggested that the study fulfilled the insertion criteria and did not meet the exclusion criteria. If there was any doubt regarding these criteria from the information given in the title and abstract, the full article was retrieved for clarification. Interrater agreement for study selection was measured using the kappa statistic (Cohen 1960). Where differences in opinion existed, they were resolved through open discussion. In the case of further dispute, the article would have been added to those 'awaiting assessment' and the authors were to be contacted for clarification. If no clarification was provided, the review group editorial base would have been consulted. An adapted QUOROM (quality of reporting of meta‐analyses) flow‐chart of study selection is attached (Moher 1999).
Data extraction and management
For studies that fulfilled inclusion criteria, authors extracted relevant population and intervention characteristics using standard data extraction templates (for details see Characteristics of included studies and Appendix 2, Appendix 3). The following data were extracted: (1) General information: author, title, publication (type, unpublished), language of publication, year of publication, country, complete reference or source, contact details, duplicate publication, multiple publication, rural or city, single centre versus multi centre, setting, stated aim of the study, sponsor, ethic committee approval and description of conflict of interests. (2) Trial design: prospective study, control group, parallel study, placebo controlled, active medication controlled, cross‐over study, run‐in period, wash‐out period (for cross‐over trials), carryover effect described (for cross‐over trials), period effect described, sampling method, power calculation, selection bias (randomisation, unit of randomisation and allocation concealment adequacy), performance bias (blinding of patients and caregivers, method of blinding, check of blinding, check of blinding method), attrition bias (intention‐to‐treat analysis, withdrawals description, drop‐outs description, losses to follow‐up description, change of groups (cross‐overs), number of drop‐out and withdrawals and losses to follow‐up, reasons for drop‐outs or withdrawals or losses to follow‐up description), detection bias (blinding of outcome assessors), overall quality assessment, definition of inclusion criteria, definition of exclusion criteria, specification of exclusion criteria, predefined subgroups, posthoc defined subgroups and specification of subgroups. (3) Participants: diabetes mellitus diagnostic criteria description, diabetes mellitus diagnostic criteria validity, exclusion criteria definition, baseline characteristics i.e. number of participants, age, gender, race, body mass index, glycosylated haemoglobin, fasting plasma glucose, fasting blood glucose, pre prandial glucose, bedtime glucose, duration of diabetes mellitus, age of diabetes mellitus onset, diabetes mellitus related complications (neuropathy, nephropathy, retinopathy, large vessel disease), diabetes mellitus related treatment (i.e. insulin treatment duration, total daily insulin dose, total daily basal insulin dose, number of daily basal insulin injections, total daily bolus insulin injections, number of daily bolus insulin injections), co‐morbidities, other medications, identical treatment of groups (apart from intervention). (4) Intervention: nature of basal and bolus insulin therapy (type of insulin preparation, premixed or not), basal and bolus insulin dose, basal and bolus insulin daily injections, basal insulin schedule, duration of therapy, length of follow‐up, compliance. (5) Outcomes (assessed for short, intermediate and long terms as defines above): glycaemic control (i.e. glycosylated haemoglobin, fasting plasma glucose, fasting blood glucose, pre prandial glucose, bedtime glucose), adverse effects (i.e. hypoglycaemia, nocturnal hypoglycaemia, weight gain, injection site pain), treatment related mortality, diabetic related mortality and all cause mortality. For long term time point we also collected data regarding diabetic related complications (i.e. non‐fatal myocardial infarction, angina, heart failure, stroke, peripheral vascular disease, renal failure, amputation (of at least one digit), vitreous haemorrhage, retinal photocoagulation, blindness in one eye or cataract extraction). (6) Effect modifiers: compliance, change of concomitant medication.
Any relevant missing information on the trial was sought from the original author(s) of the article, if required.
Assessment of risk of bias in included studies
The quality of reporting each trial was assessed based largely on the quality criteria specified by Schulz and by Jadad (Jadad 1996; Schulz 1995). In particular, the following factors were studied: (1) Minimisation of selection bias ‐ was the randomisation procedure adequate? was the allocation concealment adequate? (2) Minimisation of performance bias ‐ were the patients and people administering the treatment blind to the intervention? Performance bias is anticipated due to the different nature of insulin preparations (for example, clear versus cloudy). (3) Minimisation of attrition bias ‐ were withdrawals and dropouts completely described? was analysis by intention‐to‐treat? (4) Minimisation of detection bias ‐ were outcome assessors blind to the intervention?
Based on these criteria, studies were broadly subdivided into the following three categories: (A) all quality criteria met: low risk of bias; (B) one or more of the quality criteria only partly met: moderate risk of bias; and (C) one or more criteria not met: high risk of bias.
This classification was used as the basis of a sensitivity analysis. Additionally, we explored the influence of individual quality criteria in a sensitivity analysis.
Measures of treatment effect
The main outcome data, i.e. glycaemic control assessed through measurements of glycosylated haemoglobin and blood or plasma glucose, were of continuous nature. Other data presented as counts or rates, e.g. the number of adverse episodes.
Unit of analysis issues
Dichotomous data
Effect measures for count and rates data were assessed according to their prevalence. Rare events such as death or long term complications were measured with the rate‐ratio statistic. The rate‐ratio compares the rate of events in the two groups by dividing one by the other. More common events such as the number of hypoglycaemic episodes per 100 days were measured as continuous data, with weighted mean difference.
Continuous data
Effect measures for continuous data were assessed through measurements of the mean difference (weighted mean difference), as results were expected to be on a unified scale (e.g. glycosylated haemoglobin level). The weighted mean difference was used for each of the parameters assessed, after assuring parameters reported by the different trials point towards a single direction. Dichotomizing results was not possible.
Short‐, intermediate‐ and long‐term (three months, three to six months, and over six months, respectively) assessments of effect in the case of repeated observations were performed.
Intention‐to‐treat analysis aims to include all participants randomised into a trial irrespective of what happened subsequently. This means that ideally, trial participants should be analysed in the group to which they were randomised regardless of which treatment they actually received or other protocol irregularities and all participants should be included regardless of whether their outcomes were actually collected. In this review we adopted an available‐case‐analysis, in which only the former criterion is met, and analysis is performed for every participant for whom data are available, thus filling‐in for missing data was not conducted. Special attention was given for three types of exclusions: (a) participants excluded for predefined exclusion criteria using information collected before randomisation‐ were considered as legitimate; (b) participants excluded immediately after randomisation‐ illegitimate; (c) very high dropout rates or inconsistency across study groups, which may indicate low quality of trial conduction.
Dealing with missing data
Relevant missing data were sought from authors. Evaluation of important numerical data such as screened, eligible and randomised patients as well as intention‐to‐treat (ITT) and per‐protocol (PP) population was carefully performed. Drop‐outs, misses to follow‐up and withdrawn study participants were investigated. Issues of missing data, ITT and PP were critically appraised and compared to specification of primary outcome parameters and power calculation.
Assessment of heterogeneity
Heterogeneity is a term used to describe variability among trials encountered in a meta‐analysis. In our review, we anticipated some clinical diversity, e.g. baseline diabetes status and treatment, as well as methodological diversity, both giving rise to statistical heterogeneity. On the one hand, the scope of our review is relatively confined; therefore heterogeneity is not inherently large. On the other hand, disease status may be variable among participants and bolus insulin injections in the study groups may differ by type and intensity. Methodologically there was no promise for comparable quality. Heterogeneity was identified using the formal chi‐square test, which is intended to assess whether observed differences in results are compatible with chance alone. Chi‐squared test has low power when trials have small sample size or are few in number. Therefore a P value of 0.10 was considered statistically significant. We will also tried to quantify the amount of heterogeneity and its impact on the meta‐analysis by describing the percentage of the variability in effect estimates that is due to heterogeneity rather than chance (Higgins 2002; Higgins 2003). I2‐values of 50% and more indicate a substantial level of heterogeneity (Higgins 2003). When heterogeneity was found, we attempted to determine potential reasons for it by examining individual study characteristics and those of subgroups of the main body of evidence. A negative chi‐square did not necessarily mean that no heterogeneity existed or should not be further explored. In this regard, a subgroup analysis was performed as discussed below.
Assessment of reporting biases
Publication bias was analysed with the funnel plot method. It is, however, important to realise that publication bias is only one of a number of possible causes of funnel‐plot asymmetry.
Dealing with duplicate publications
In the case of duplicate publications and companion papers of a primary study, we would have tried to maximise yield of information by simultaneous evaluation of all available data. In cases of doubt, the original publication (usually the oldest version) obtained priority.
Data synthesis
Data were summarised statistically when available, sufficiently similar and of sufficient quality. Statistical analysis was performed according to the statistical guidelines referenced in the newest version of the Cochrane Handbook for Systematic Reviews of Interventions (Higgins 2005). In the case of significant heterogeneity, a random‐effects model was to be used. Otherwise, a fixed‐effect meta‐analytic model was planned. When addressing continuous data, inverse variance method was utilized for conducting a fixed‐effect analysis, whereas DerSimonian and Laird method was utilized for a random‐effects meta‐analysis. For counts and rates data with rare prevalence of events, the generic inverse variance method was used to combine the log transformation of the rate‐ratio across trials. For more common events for which the summery statistic is the weighted mean difference, analysis was performed as in the case of continuous data. In the case of dichotomous data types, we expressed the effect of treatment with relative effect measures, i.e. risk‐ratio and odds‐ratio, which are more consistent than absolute measures. These were calculated for an event (rather then for a non‐event) and re‐expressed as absolute measures which are more interpretable by clinicians.
Subgroup analysis and investigation of heterogeneity
Subgroup analyses were to be performed if one of the primary outcome parameters demonstrated statistically significant differences between treatment groups. To further explore heterogeneity and investigate the effect modification of participants and treatment types, we performed a subgroup analysis, according to the following clinically logical predefined groups. A post‐hoc analysis was performed for additional meaningful characteristics that were found during the investigation.
(1) Participants a. gender ‐ male versus female; b. diabetes status‐ mild to moderate versus severe (according to clinical status and treatment). (2) Intervention a. number of daily basal intermediate acting insulin injections (reflecting routine versus tight control); b. type of long acting insulin preparation‐ glargine versus detemir versus ultralente; c. type of intermediate insulin preparation‐ NPH versus lente; d. type of short acting insulin‐ regular versus insulin analogues; e. type of insulin treatment‐ separate basal and bolus injections versus mixed preparations.
A dose‐response analysis was not performed, nor any indirect comparisons between groups not directly evaluated head to head in a clinical trial.
Sensitivity analysis
We performed sensitivity analyses in order to explore the influence of the following factors on effect size:
repeating the analysis excluding unpublished studies;
repeating the analysis taking account of study quality, as specified above;
repeating the analysis excluding any very long or large studies to establish how much they dominate the results;
repeating the analysis excluding studies using the following filters: diagnostic criteria, language of publication, source of funding (industry versus other), country.
The robustness of the results was also tested by repeating the analysis using different measures of effects size (relative risk, odds ratio etc.) and different statistical models (fixed and random effects models).
Results
Description of studies
Results of the search
The initial search identified 1187 records, from these, 41 full papers were identified for further examination. The other studies were excluded on the basis of their abstracts because they were not relevant to the question under investigation (see Figure 1 for details). After screening the full text of the selected papers, 24 publications finally met the inclusion criteria. Two of these publications address different aspects of the same trial population and were therefore considered as one study (Home 2005; Witthaus 2001). One study was declared as an extension phase of another study (De Leeuw 2005; Russell‐Jones 2004). However, their description of patients and methods differed considerably and they were considered as two separate trials. Contact authors of these trials were not available for clarifications. A search through databases for ongoing clinical trials yielded two additional records (Alcolado 2001; Page 2001). The contact authors did not reply to our inquiry and a specific search through MEDLINE did not yield any further information. We therefore consider this analysis to include 23 RCTs.
1.
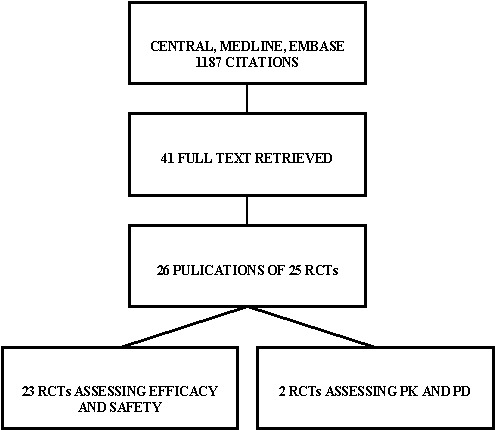
Figure 1: Trials identified
Assessment of publication bias inter‐rater agreement The kappa statistic for the inter‐rater agreement for study selection, that is qualifying a study as 'included' or 'potentially' relevant was 0.64.
Included studies
Interventions
Comparisons
For detailed description see Appendix 2. Eleven studies compared glargine with NPH (Ashwell 2006; Fulcher 2005; Home 2005; Murphy 2003; Pieber 2000; Porcellati 2004; Raskin 2000; Ratner 2000; Rosenstock 2000; Rossetti 2003; Schober 2001), eight studies compared detemir with NPH (Chatterjee 2007; De Leeuw 2005; Hermansen 2004; Home 2004; Kolendorf 2006; Robertson 2007; Russell‐Jones 2004; Vague 2003), and four studies compared ultralente with lente or NPH (Francis 1986; Hermansen 2001; Tunbridge 1989; Zinman 1999), as basal insulins. Only two of the studies involved non‐NPH intermediate acting insulin (Francis 1986; Tunbridge 1989). For bolus insulin injections one study utilised porcine regular insulin (Francis 1986), ten studies utilizes humanized regular insulin (Ashwell 2006;Hermansen 2001; Home 2005; Murphy 2003; Pieber 2000; Ratner 2000; Rosenstock 2000; Russell‐Jones 2004; Schober 2001; Tunbridge 1989), and 14 utilized insulin analogues (Ashwell 2006; Chatterjee 2007; De Leeuw 2005; Fulcher 2005; Hermansen 2004; Home 2004; Kolendorf 2006; Murphy 2003; Porcellati 2004; Raskin 2000; Robertson 2007; Rossetti 2003; Vague 2003; Zinman 1999). Two studies utilised an insulin analogue in the interventional arm and a humanized regular insulin on the control arm (Ashwell 2006; Murphy 2003).
Number of study centres and countries
Five studies were performed in a single centre (Chatterjee 2007; Francis 1986; Murphy 2003; Porcellati 2004; Rossetti 2003). The others were multicenter in design, and included sites in Europe, North‐America, South‐Africa and Australia.
Setting
All studies were performed in an out‐patient setting. Ten studies involved admission for efficacy profile recordings (Ashwell 2006; Francis 1986; Hermansen 2001; Murphy 2003; Porcellati 2004; Rosenstock 2000; Rossetti 2003; Russell‐Jones 2004; Vague 2003; Zinman 1999).
Treatment before study
All patients were pre‐treated with insulin prior to study enrolment.
Methods
16 studies had a parallel design (De Leeuw 2005; Fulcher 2005; Hermansen 2004; Home 2004; Home 2005; Pieber 2000; Porcellati 2004; Raskin 2000; Ratner 2000; Robertson 2007; Rosenstock 2000; Rossetti 2003; Russell‐Jones 2004; Schober 2001; Vague 2003; Zinman 1999). Seven studies were crossover in design (Ashwell 2006; Chatterjee 2007; Francis 1986; Hermansen 2001; Kolendorf 2006; Murphy 2003; Tunbridge 1989. All were randomised controlled trials.
Duration of the intervention
The duration of the intervention was considered short for studies with a treatment arm of less then three months (Pieber 2000; Raskin 2000; Rosenstock 2000; Rossetti 2003), intermediate for studies of three to six months (Ashwell 2006; Chatterjee 2007; Francis 1986; Hermansen 2004; Home 2004; Kolendorf 2006; Murphy 2003; Raskin 2000; Tunbridge 1989; Vague 2003), and long for longer interventions (De Leeuw 2005; Fulcher 2005; Home 2005; Porcellati 2004; Ratner 2000; Robertson 2007; Russell‐Jones 2004; Schober 2001; Zinman 1999).
Duration of follow‐up
Follow‐up length was as long as the intervention duration.
Run‐in period
Most studies employed a run‐in period of four weeks for glucose control on current treatment before randomisation into interventional arms.
Language of publication
All studies included in this review were published in English. None of the non‐English publications fulfilled the inclusion criteria.
Participants
A total of 3872 patients in the intervention group and 2915 patients in the control group were included. For detailed description of participants, inclusion and exclusion criteria see Characteristics of included studies.
Who participated
Type 1 diabetic patients were recruited. Three of the trials included involved children under the age of 20 (Murphy 2003; Robertson 2007; Schober 2001).
Diagnostic criteria
Formal diagnostic criteria for type 1 diabetes mellitus were missing in all the included studies. Some authors stated a C‐peptide deficient state as a diagnostic measure.
Co‐morbidities and co‐medications
Not described.
Outcomes
Primary outcomes
Primary outcomes, when described, involved efficacy as measured from glycosylated haemoglobin levels in most trials included. One study investigated the area under the curve of glucose level (Hermansen 2001) and one assessed fasting plasma glucose as its primary end point (Rosenstock 2000). Two studies assessed primarily the rate of hypoglycaemia (Kolendorf 2006; Murphy 2003). One publication assessed quality of life as its primary outcome in a cohort of patients described in another publication (Home 2005; Witthaus 2001).
Secondary and additional outcomes
Additional efficacy outcomes involved fasting self measured blood glucose (SMBG), fasting plasma glucose, SMBG average, 24 hours glucose profile plus area‐under‐the‐curve calculations, overnight glucose profile plus area‐under‐the‐curve calculations, percent of patients below target efficacy measure, within patient variability, weight and metabolic markers, and quality of life. Hypoglycaemia was addressed through the percentage of patiens experiencing an hypoglycaemic episode and the number of events per patient in a given time. Hypoglycaemic events were recorded as usual, severe, and nocturnal with a diversity of definitions. Adverse events were described by most authors with emphasis on events considered to be severe.
Excluded studies
Seventeen studies had to be excluded after careful evaluation of the full publication. Main reasons for exclusion were a non‐randomised methodology, non‐controlled trials, trials assessing different interventions outside the scope of this review etc. Two were RCTs but assessed pharmacokinetics and dynamics and were therefore not included (for details see Characteristics of excluded studies).
Risk of bias in included studies
Allocation
All included studies were randomised‐controlled trials by declaration. Nevertheless, randomisation or allocation concealment were adequately described by ten authors only (Ashwell 2006; Chatterjee 2007; Hermansen 2004; Home 2004; Home 2005; Porcellati 2004; Raskin 2000; Robertson 2007; Tunbridge 1989; Vague 2003).
Blinding
Blinding of patients and caregivers was considered impossible by most authors due to the milky nature of the intermediate acting insulin suspension. Tunbridge 1989 and Zinman 1999 employed a double‐blind study design. Fulcher 2005 employed a single blind study‐design where caregivers were blinded to patients' treatment. Pieber 2000 and Rosenstock 2000 employed double blind methodology between different long‐acting insulin suspensions but not between these interventions and the control.
Incomplete outcome data
Intention‐to‐treat (ITT) was not performed in two studies (Chatterjee 2007; Murphy 2003). It was not described in a straight forward manner and was therefore considered inadequate in additional nine of the included studies (Francis 1986; Hermansen 2001; Home 2005; Kolendorf 2006; Pieber 2000; Porcellati 2004; Raskin 2000; Rossetti 2003; Schober 2001). Other authors declared and described ITT sufficiently. Missing data handling was not described in most instances.
Other potential sources of bias
Definition of primary endpoint and secondary endpoints
Primary endpoint (mostly glycosylated haemoglobin) was accurately defined in 15 studies (Ashwell 2006; Chatterjee 2007; Fulcher 2005; Hermansen 2001; Hermansen 2004; Home 2004; Home 2005; Kolendorf 2006; Murphy 2003; Porcellati 2004;Robertson 2007 ;Rosenstock 2000; Rossetti 2003; Schober 2001; Vague 2003). All studies included multiple endpoints (range four to 13).
Power calculation
Power calculation was not employed or was not adequately described in eight of the included studies (Fulcher 2005; Murphy 2003; Pieber 2000; Raskin 2000; Rossetti 2003; Schober 2001; Tunbridge 1989; Zinman 1999).
Screened and randomised patients
Most of the included studies gave a detailed description of the inflow of patients with the number of recruits and the number of patients receiving at least one dose of interventional drug.
Discontinuing participants
Discontinuation rates were considered equally distributed between the intervention arms and the control arms in the included studies. Reasons for discontinuation were not described in five trials (Pieber 2000; Porcellati 2004; Rossetti 2003; Schober 2001;Zinman 1999) and only partially described in one additional trial (Raskin 2000).
Compliance measures
Compliance was not measured in any of the studies included.
Funding
Most of the included studies were funded by drug manufacturers. Only three of the included studies were sponsored by non‐industrial sources (Francis 1986; Porcellati 2004; Rossetti 2003).
Publication status
All studies included were published in peer‐review‐journals in English.
Effects of interventions
Baseline characteristics
For details of baseline characteristics see Appendix 2.
Primary outcomes
For details of outcomes see Data and analyses.
Glycaemic control was assessed through measurements of glycosylated haemoglobin, fasting plasma glucose, fasting blood glucose, and the mean daily self measured blood glucose (SMBG) averaging seven to eight points. Other efficacy parameters were not available or insufficiently described to be addressed within the scope of this review.
Glycosylated haemoglobin
Glycosylated haemoglobin was addressed in all 22 of the 23 included studies in a total of 6666 patients. Overall, the use of long acting insulins resulted in a significant weighted mean difference of ‐0.08 (95% confidence interval (CI) ‐0.12 to ‐0.04) when compared to intermediate acting insulins. This difference was prominent in studies with an intermediate follow‐up period (three to six months, ‐0.17, 95% CI ‐0.23 to ‐0.10). Interestingly, in the longer follow‐up periods (over six months), a non‐significant trend towards NPH superiority was noted (WMD 0.01, 95% CI ‐0.06 to 0.08). Studies assessing shorter follow‐up periods did not reach a statistical significance.
Fasting plasma glucose
Fasting plasma glucose was assessed in 11 studies, in a total of 4868 patients. The WMD between the groups resulted in a significant ‐0.63 (95% CI ‐0.86 to ‐0.40) in favour of the long acting insulins. This significance was noted in short, intermediate and long follow‐up periods.
Fasting blood glucose
Fasting self measured blood glucose was assessed in 17 studies in 5409 patients. The WMD between the groups was ‐0.86 with a significant 95% CI of ‐1.00 to ‐0.72 in favour of the long acting insulins, with statistically significant results in all periods of follow‐up.
Mean SMBG
The mean SMBG was assessed by five studies in a total of 739 patients. The weighted mean difference between the groups favoured the long acting insulins but without statistical significance (‐0.25, 95% CI ‐0.55 to 0.05).
Hypoglycaemia
3010 of 3537 patients and 2171 of 2594 patients in the long and intermediate acting insulin groups, respectively, developed at least one event of hypoglycaemia during the overall follow‐up periods of the trials included. The odds ratio for a patient on long acting insulins to develop any type of hypoglycaemia was 0.93 without statistical significance (95% CI 0.8 to 1.08) compared to that of a patient on intermediate acting insulins. Severe hypoglycaemic episodes were noted in 283 of 3356 and 271 of 2471 patients in these groups, respectively. The OR was 0.73 with 95% CI of 0.61 to 0.87. Nocturnal hypoglycaemic episodes were noted in 1784 of 3135 and 1405 of 2271, with a significant OR of 0.70 with 95% CI of 0.63 to 0.79. We also looked at hypoglycaemic events per 100 patient follow‐up days. The WMD between the long and intermediate insulin groups was ‐0.77 (95% CI ‐0.89 to ‐0.65), ‐0.0 (95% CI ‐0.02 to 0.02) and ‐0.40 (95% CI ‐0.45 to ‐0.34) for overall hypoglycaemic episodes, severe episodes and nocturnal episodes, respectively.
Adverse events
Adverse events classified by authors as serious were described in 14 trials. These events occurred in 97 of 2840 patients in the long acting insulin groups compared to 87 of 2038 patients in the control group, yielding a non‐significant OR of 0.89 (95% CI 0.66 to 1.21). The types of serious adverse events are given in Analysis 3.2. Most authors described serious adverse events whether or not they were treatment related, including severe hypoglycaemic episodes considered serious. However, in some reports, serious hypoglycaemic episodes or events considered not to be treatment related were omitted (Fulcher 2005; Ratner 2000 and Russell‐Jones 2004). Weight gain (kilograms) was described in eight studies and was more prominent in the control group with a significant WMD between the interventional and control groups of ‐0.67 (95% CI of ‐0.87 to ‐0.45). One study assessing insulin detemir versus NPH in children described a gain in body mass index in the NPH group which was statistically larger than in the detemir group (difference 0.18, 95% CI 0.1 to 0.26) (Robertson 2007). Other adverse events were considered mild to moderate. Death occurred in two patients in the control group and none in the interventional arm. The reasons for death were lung tumour and myocardial infarction and were not considered treatment related.
3.2. Analysis.
Comparison 3 Adverse Events, Outcome 2 Type of serious adverse events and reasons for death.
| Type of serious adverse events and reasons for death | |||
|---|---|---|---|
| Study | Treatment | Control | Death |
| Ashwell 2006 | insulin overdose | urinary tract infection | NA |
| Chatterjee 2007 | not defined | not defined | N |
| De Leeuw 2005 | retinal edema, macula lutea degeneration, hyperglycemia | hypoglycemia, retinal disorder | NA |
| Francis 1986 | not defined | not defined | NA |
| Fulcher 2005 | not defined | not defined | NA |
| Hermansen 2001 | hypoglycemia | NA | NA |
| Hermansen 2004 | hyperglycemia, allergic reaction, inejction site reaction | not defined | lung tumor |
| Home 2004 | hypoglycemia | hypoglycemia | NA |
| Home 2005 | not defined | not defined | NA |
| Kolendorf 2006 | NA | NA | myocardial infarction |
| Murphy 2003 | NA | gastroenteritis | NA |
| Pieber 2000 | NA | NA | NA |
| Porcellati 2004 | NA | NA | NA |
| Raskin 2000 | hypoglycemia | hypoglycemia | NA |
| Ratner 2000 | hypoglycemia, fall | hypoglycemia, fall | NA |
| Robertson 2007 | ketoacidosis | ketoacidosis | NA |
| Rosenstock 2000 | NA | NA | NA |
| Rossetti 2003 | not defined | not definned | NA |
| Russell‐Jones 2004 | hypoglycemia | hypoglycemia, hyperglycemia | NA |
| Schober 2001 | not defined | not defined | NA |
| Tunbridge 1989 | NA | NA | NA |
| Vague 2003 | headache vomiting and malaise, uterine carcinoma, severe hypoglycaemia | severe hypoglycaemia | NA |
| Zinman 1999 | NA | NA | NA |
Secondary outcomes
Only one study addressed long term microvascular complications (i.e. retinopathy) in a follow‐up period of 28 weeks without observed differences (Home 2005). This reflects the relatively short period of follow‐up in the identified trials with a maximum of one year. One patient in the intermediate acting insulin group died of myocardial infarction but this event was recorded by the authors as not related to treatment. Health‐related quality of life was assessed in two trials: Chatterjee 2007 et al. utilised the Diabetes Treatment Satisfaction Questionnaire (DTSQ) and Audit of Diabetes‐Dependent Quality of Life questionnaire (ADDQoL) while comparing insulin glargine with NPH in a crossover designed trial. A statistically significant difference between treatments ( P = 0.001) was only observed in analysis of DTSQ for the second period of the trial. Overall, satisfaction was greater with glargine by a mean of 4 points on the change scale compared with NPH. There was no difference in overall quality of life and overall impact of diabetes on quality of life using ADDQoL. Witthaus 2001 et al. report better outcomes with insulin glargine for the DTSQ items, perceived frequency of hyperglycaemia and hypoglycaemia, compared to NPH. No difference in psychological well being between the treatment groups was observed, with mean scores increasing in both.
Heterogeneity
The chi‐squared test was performed with a P value of less than 0.10. All the efficacy parameters assessed in this meta‐analysis yielded a significant inherent statistical heterogeneity. When addressing glycosylated haemoglobin, the chi‐squared test yielded a P value of 0.002 with I2=53.8%. Fasting blood glucose estimation also yielded heterogeneity with a P value of <0.00001 and I2=74.1%. for these parameters, long term studies were the main contributors to heterogeneity. Fasting plasma glucose estimation yielded heterogeneity with a P value of <0.00001 and I2=86.2%. This heterogeneity was observed in intermediate and long term studies. Mean self measured blood glucose heterogeneity analysis yielded a P value of 0.006 with I2=72.2%.
Hypoglycaemic events per 100 patient days yielded a significant heterogeneity for all episodes, severe episodes, and nocturnal episodes. The percentage of people experiencing at least one nocturnal hypoglycaemic episode also showed an inherent heterogeneity. The only parameters with no heterogeneity were the percentage of people experiencing at least one hypoglycaemic episode, the percentage of people experiencing at least one severe hypoglycaemic episode, and weight gain analysis.
Assessment of heterogeneity
Data extraction was reassessed to explore heterogeneity. A search for standard errors that have been mistakenly entered as standard deviation was performed. We also employed a random effect meta analysis model in an attempt to address the question 'what is the average treatment effect?' rather then 'what is the best estimate of the effect?' as posed by the fixed effect model. Utilisation of the random effect meta analysis model did not reduce the heterogeneity in any of the assessed parameters.
Subgroup analyses
In an attempt to further explore heterogeneity subgroup analyses were carried out. Since some of the studies presented efficacy parameters in terms of final values and some as change from baseline, we performed a post‐hoc subgroup analysis exploring this issue. Heterogeneity disappeared for fasting blood glucose evaluation when values of change from baseline were omitted without compromise of the statistical significance of the measured effects. A subgroup analysis for clinical variables was also carried out. Variables regarding participants were pre‐defined as gender and baseline diabetes mellitus status. Subgroup analysis according to gender was impossible to implement as studies did not present data on the patient's gender.
Diabetes status
Studies were categorized according to their reported mean baseline glycosylated haemoglobin levels (see Table 1). Hermansen 2001; Home 2005; Kolendorf 2006; Porcellati 2004; Raskin 2000, Ratner 2000 and Rossetti 2003 report fare diabetes control at baseline (<8%). De Leeuw 2005 and Francis 1986 report poor diabetes control (>12%). Others reported intermediate control (10% to 12%). Glycosylated haemoglobin showed statistically significant decline with long acting insulins in the intermediate and poorly controlled subgroups but not in the trials with fairly controlled diabetes, in which heterogeneity was present. Fasting blood and plasma glucose were lower with long acting insulins in all diabetic subgroups. Mean daily measured blood glucose was not different in the long acting insulins when compared to the intermediate acting insulins and stratified according to diabetes control. The percentage of participants experiencing at least one severe or nocturnal hypoglycaemic episode was significantly lower in the intermediately controlled group, without heterogeneity. The number of total and nocturnal episodes per 100 patient's days was also higher in the long acting insulin groups in all diabetes control groups. Heterogeneity was not influenced significantly by these analyses.
1. Diabetes mellitus status at entry.
| Study | Diabetes status |
| Ashwell 2006 | Intermediate |
| Chatterjee 2007 | Intermediate |
| De Leeuw 2005 | Poor |
| Francis 1986 | Poor |
| Fulcher 2005 | Intermediate |
| Hermansen 2001 | Fare |
| Hermansen 2004 | Intermediate |
| Home 2004 | Intermediate |
| Home 2005 | Fare |
| Kolendorf 2006 | Fare |
| Murphy 2003 | Intermediate |
| Pieber 2000 | Intermediate |
| Porcellati 2004 | Fare |
| Raskin 2000 | Fare |
| Ratner 2000 | Fare |
| Robertson 2007 | Intermediate |
| Rosenstock 2000 | Intermediate |
| Rossetti 2003 | Fare |
| Russell‐Jones 2004 | Intermediate |
| Schober 2001 | Unknown |
| Tunbridge 1989 | Intermediate |
| Vague 2003 | Intermediate |
| Zinman 1999 | Intemediate |
| Fare = glycosylated haemoglobin < 8%; Intermediate= glycosylated haemoglobin 8% to 10%, Poor = glycosylated haemoglobin > 10% | |
| Diabetes status was determined according to baseline glycosylated haemoglobin mean/median as reported. |
Insulin type
Pre‐defined parameters reflecting intervention were type of insulins (long, intermediate and short acting), and number of basal insulin doses per day. Only one of the studies presented data for pre‐mixed insulin preparations (Porcellati 2004). Glycosylated haemoglobin level was significantly lower with both insulin detemir and glargine, but not with ultralente. Heterogeneity was evident in the glargine and ultralente groups. Fasting blood and plasma glucose levels were lower with all types of long acting insulins. Significant heterogeneity disappeared when analysing fasting blood glucose in the detemir recipients. Mean self measured glucose level was lower with glargine but not with the other insulins. The number of patients experiencing at least one severe or nocturnal episode of hypoglycaemia was lower in both detemir and glargine groups, but the number of total episodes did not differ. Insulin detemir had a greater influence on this parameter, with lower heterogeneity. The number of episodes per 100 days was lower with both detemir and glargine for the total and nocturnal episodes but not for the severe episodes. The effect of the type of intermediate insulin preparation was not assessed in view of the limited amount of studies assessing types other than NPH. When analysing the effect of the short acting insulin given as bolus injections, glycosylated haemoglobin was lower with insulin analogues but not with human or porcine insulins, without significant heterogeneity. There were less patients experiencing nocturnal and severe episodes with short acting insulin analogues, and less patients experiencing severe episodes with human insulin. The number of hypoglycaemic events per 100 days analysis showed wide inherent heterogeneity.
Number of bolus injections
Glycosylated haemoglobin was statistically lower in the once daily and in the more than once daily (range two to four) long acting insulin injection groups. In the latter group heterogeneity was absent. Fasting plasma and blood glucose levels were lower in the long acting insulin group regardless of the number of daily injections, with high heterogeneity. There were less nocturnal hypoglycaemic episodes but a tendency towards more severe hypoglycaemic episodes in the twice of more daily basal injections group, with high heterogeneity.
It seems from our analysis that combining two type of data presentation, i.e. final values and change from baseline, was a major determinant of heterogeneity found in this meta‐analysis. Analysis of parallel and crossover studies together may have also contributed. Subgroup analysis did not point to any major clinical and interventional factor as a major source of this heterogeneity. For this reason, the overall effect of treatment for these variables must be interpreted cautiously, as observed differences in results are probably not compatible with chance alone, and statistical heterogeneity exists.
Sensitivity analyses
Unpublished data
No unpublished data were available for analysis.
Study quality
The influence of quality of studies was assessed by a sensitivity analysis. All but two (Tunbridge 1989; Zinman 1999) of the included studies were classified as high risk for bias due to the inability to incorporate a double‐blind study configuration. When discarding this issue, seven trials remained with high risk for bias (Chatterjee 2007; Hermansen 2001; Murphy 2003; Pieber 2000; Porcellati 2004; Rossetti 2003; Schober 2001). Ommiting these trials did not influence the results.
Specific quality criteria
We repeated the analysis taking account of specific quality criteria (for details see Table 2 and Appendix 3). Selection was reported appropriately in ten studies (Ashwell 2006; Chatterjee 2007; Hermansen 2004; Home 2004; Home 2005; Porcellati 2004; Raskin 2000; Robertson 2007; Tunbridge 1989; Vague 2003). When repeating the analysis after excluding the studies in which selection bias was not adequately reported, mean SMBG was lower in the long acting insulin groups with statistical significance. Performance was adequate in two studies which involved a double‐blind setup (Tunbridge 1989; Zinman 1999). Their outcomes were not assessed separately. Attrition was reported adequately in 11 studies (Ashwell 2006; De Leeuw 2005; Fulcher 2005; Hermansen 2004; Home 2004; Porcellati 2004; Raskin 2000; Robertson 2007; Tunbridge 1989; Vague 2003; Zinman 1999). Repeating the analysis while taking account of attrition quality resulted in a significantly lower percentage of patients experiencing at least one episode of hypoglycaemia (total, severe and nocturnal episodes) in the long acting insulin group. Detection was reported adequately by one study (Hermansen 2001) and its outcome was not assessed separately.
2. Study quality (summary).
| Study | Selection bias | Patients blinding | Caregiver blinding | Attrition bias | Detection bias | Overall incl. perfor | Overall excl. perfor |
| Aswell 2006 | + | ‐ | ‐ | + | unknown | C | B |
| De Leeuw 2005 | unknown | ‐ | ‐ | + | unknown | C | B |
| Francis 1986 | unknown | ‐ | ‐ | unknown | unknown | C | B |
| Fulcher 2005 | unknown | ‐ | + | + | unknown | C | B |
| Hermansen 2001 | ‐ (blocks of 4) | ‐ | ‐ | ‐ | + | C | C |
| Hermansen 2004 | + | ‐ | ‐ | + | unknown | C | B |
| Home 2004 | + | ‐ | ‐ | + | unknown | C | B |
| Home 2005 | + | ‐ | ‐ | unknown | unknown | C | B |
| Kolendorf 2006 | unknown | ‐ | ‐ | unknown | unknown | C | B |
| Murphy 2003 | unknown | ‐ | ‐ | ‐ | unknown | C | C |
| Pieber 2000 | unknown | ‐ | ‐ | ‐ | unknown | C | C |
| Porcellati 2004 | + | ‐ | ‐ | ‐ | unknown | C | C |
| Raskin 2000 | + | ‐ | ‐ | unknown | unknown | C | B |
| Ratner 2000 | unknown | ‐ | ‐ | + | unknown | C | B |
| Rosenstock 2000 | unknown | ‐ | ‐ | unknown | unknown | C | B |
| Russel‐Jones 2004 | unknown | ‐ | ‐ | + | unknown | C | B |
| Schober 2001 | unknown | ‐ | ‐ | ‐ | unknown | C | C |
| Tunbridge 1989 | + | + | + | + | unknown | B | B |
| Zinman 1999 | unknown | + | + | + | unknown | B | B |
| Chatterjee 2007 | + | ‐ | ‐ | ‐ | unknown | C | C |
| Robertson 2007 | + | ‐ | ‐ | + | unknown | C | B |
| Rossetti 2003 | unknown | ‐ | ‐ | ‐ | unknown | C | C |
| Vague 2003 | + | ‐ | ‐ | + | unknown | C | B |
Studies were separated into three groups according to the length of follow up (less than three months, three to six month or more than six months). Results according to this categorization are given above. The numbers of participants ranged from six to 747. The weight given to the smallest trial was insignificant. Exclusion of trials with over 600 participants (Raskin 2000; Russell‐Jones 2004) did not influence the results.
None of the trials reported the diabetes mellitus diagnostic criteria used. Language of publication was English in all of the included trials. Source of funding was not an influencing factor ‐ only three of the studies were not sponsored by the industry, one with limited number of patients (Francis 1986), and two with positive results regarding the effects of long acting insulins (Porcellati 2004; Rossetti 2003).
The robustness of the results was tested by repeating the analysis using different measures of effects size for dichotomous data (continuous data could not be assessed with standardised mean difference in view of the combination of final and change from baseline values), and different statistical models. These analyses did not influence the results.
Publication and small study bias
The visual inspection of the funnel plot does not support small publication bias (Figure 2). Interestingly, it reveals that most of the included studies have high precision, while they differ considerably. This could be a sign of heterogeneity.
2.
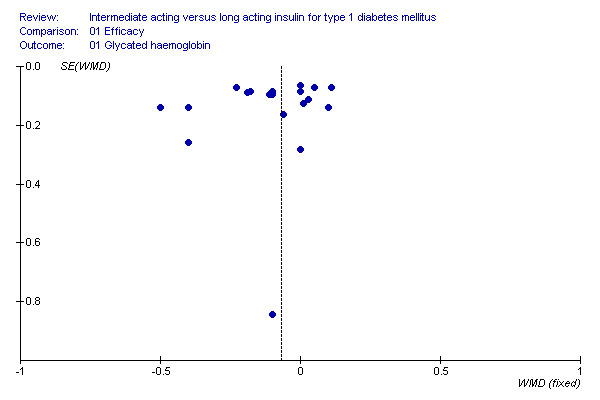
Intermediate acting versus long acting insulin
Discussion
Type 1 diabetes mellitus is a prevalent disease with short and long term complications. Diabetes control is essential to decrease the rate of these complications, but over‐vigorous glucose lowering treatment can result in severe and sometimes life threatening adverse effects. The introduction of the new long acting insulins, and specifically, the long acting insulin analogues, aims to better mimic the physiological basal insulin release, and when complemented by bolus insulin injections, promises a theoretical advantage over older insulin administration strategies. In this systematic review and meta‐analysis we aimed to assess this presumed benefit. Our review summarises the effect of all randomised controlled trials comparing long term insulin preparations with intermediate term insulin preparations for basal insulin administration. The effect of these agents over their comparatives was significant for both efficacy and safety parameters. The glycosylated haemoglobin, being the most important marker for long term diabetes control, was found to be lower with statistical significance by a weighted mean difference of 0.08. This observation was mostly evident in trials of three to six months duration but not in shorter or longer trials. It was also more prominent with more than once daily basal insulin administration, in patients using newer insulin analogues (glargine and detemir), in patients using short acting insulin analogues for bolus injections rather then humanised or porcine insulins, and in patients with uncontrolled diabetes. Undoubtedly, this effect is far from being clinically satisfactory in terms of complication reduction.
Parameters assessing short term control such as fasting (morning) blood or plasma glucose, values were better controlled with long acting insulins. Indeed, the percentage of people experiencing nocturnal hypoglycaemia was significantly lower in this group, with a clinically significant lower OR of 0.70. The number of nocturnal hypoglycaemic events per 100 patient's days was also lower in this group. This finding implies a more physiological blood insulin level, which is important for nocturnal complications. Nevertheless, the percent of patients experiencing an hypoglycaemic episode not restricted to certain hours was not lower with long acting insulins, which implies that short acting bolus insulins are the main determinants of day‐time complications. Adverse effects profile was similar in both groups. When interpreting our results one must account for several confounding factors. The quality of the included studies was at most intermediate due to the lack of blinding and inappropriate description of quality markers. Inherent heterogeneity was also discovered in our analysis. This heterogeneity was studied extensively. Our view is that it is mostly due to the combination of final and change from baseline values. The significance of the different results was not significantly jeopardised by the separation of these data sets, while heterogeneity decreased in some but not all of the analyses. Another confounding factor lies in the source of funding, which came mostly from the makers of the long acting insulins, and gives rise to possible bias driven by market forces. Due to the limited number of non‐industry sponsored trials this problem could not be addressed statistically. In terms of applicability, the presented results do not fully reflect real life scenarios. In this regard, studies aimed at diabetes control may mask the hypoglycaemia avoidance strategies which are common in reality. They also present rigorous follow‐up and adherence to treatment which may not reflect daily routines. Long acting insulins, despite their potential once daily use (which is less efficacious), require three separate bolus injections, while NPH can be injected with short acting insulin as a premixed preparation. In this view, one should not consider them superior in terms of adherence, and their superiority may be primarily related to achieving the same efficacy with less risk of hypoglycaemia. It seems from our report that long acting insulin preparations in the right dose and schedule, given to the right patients, with the right additive bolus insulin injections, are efficacious and safe. Their presumed mitogenic effect could not be addressed, nor could their long term reduction of diabetic complications. When compared to intermediate acting insulins, their effect on glucose control seems to be subtle, if at all, but important for the control of nocturnal hypoglycaemia. These results are in concordance with a recent review on the effect of long acting insulin analogues in diabetes mellitus type 2 (Horvath 2007).
Authors' conclusions
Implications for practice.
Our analysis suggests only a modest clinical benefit of treatment with long‐acting insulin preparations rather then intermediate acting insulin preparations for patients with diabetes mellitus type 1. Their effect is more prominent for the control of nocturnal hypoglycaemia. We suggest a cautious approach to their use in view of their potential mitogenic effect.
Implications for research.
More research is needed to assess the cost effectiveness of long term insulin preparations for type 1 diabetic patients. Long term follow‐up is also necessary for the investigation of end‐organ involvement and mitogenic effects, with a more rigorous approach on study quality and reporting.
What's new
| Date | Event | Description |
|---|---|---|
| 7 May 2008 | Amended | Converted to new review format. |
Acknowledgements
We thank Prof P. Home and Prof. J.W. Elte for their helpful comments.
Appendices
Appendix 1. Search strategy
| Electronic searches |
| Unless otherwise stated, search terms are free text terms; MeSH = Medical subject heading (Medline medical index term); exp = exploded MeSH; the dollar sign ($) stands for any character(s); the question mark (?) = to substitute for one or no characters; tw = text word; pt = publication type; sh = MeSH; adj = adjacent. Diabetes mellitus, type 1: 1 exp diabetes mellitus, insulin dependent/ 2 exp Diabetic Ketoacidosis/ 3 IDDM.tw. 4 (insulin? depend$ or insulin?depend$).tw. 5 ((typ$ 1 or typ$ I) adj diabet$).tw. 6 (earl$ adj diabet$).tw. 7 ((juvenil$ or child$ or keto$ or Labil$ or brittl$) adj diabet$).tw. 8 ((auto?immun$ or sudden onset) adj diabet$).tw. 9 (insulin? defic$ adj absolut$).tw. 10 1 or 2 or 3 or 4 or 5 or 6 or 7 or 8 or 9 11 exp diabetes insipidus/ 12 diabet$ insipidus.tw. 13 11 or 12 14 10 not 13 Controlled or randomised clinical trials: Phase I 1 randomised controlled trial.pt. 2 controlled clinical trial.pt. 3 Randomised Controlled Trials/ 4 Random Allocation/ 5 Double‐Blind Method/ 6 Single Blind Method/ 7 1 or 2 or 3 or 4 or 5 or 6 8 Animal/ not Human/ 9 7 not 8 Phase II 10 clinical trial.pt. 11 exp Clinical Trials/ 12 (clinic$ adj25 trial$).tw. 13 ((singl$ or doubl$ or trebl$ or tripl$) adj (mask$ or blind$)).tw. 14 Placebos/ 15 placebo$.tw. 16 random$.tw. 17 Research Design/ 18 (latin adj square).tw. 19 10 or 13 or 12 or 13 or 14 or 15 or 16 or 17 or 18 20 19 not 8 21 20 not 9 Phase III 22 Comparative Study/ 23 exp Evaluation Studies/ 24 Follow‐Up Studies/ 25 Prospective Studies/ 26 (control$ or prospectiv$ or volunteer$).tw. 27 Cross‐Over Studies/ 28 22 or 23 or 24 or 25 or 26 or 27 29 28 not 8 30 29 not (9 or 21) All phases 33 9 or 21 or 30 Meta‐analysis or systematic reviews: 1 exp meta‐analysis/ 2 exp Review Literature/ 3 meta‐analysis.pt. 4 review.pt. 5 1 or 2 or 3 or 4 6 letter.pt. 7 comment.pt. 8 editorial.pt. 9 historical‐article.pt. 10 6 or 7 or 8 or 9 11 5 not 10 12 ((systematic$ or quantitativ$ or methodologic$) adj (review$ or overview$)).tw. 13 meta?anal$.tw. 14 (integrativ$ research review$ or research integration$).tw. 15 quantitativ$ synthes$.tw. 16 (pooling$ or pooled analys$ or mantel$ haenszel$).tw. 17 (peto$ or der?simonian$ or fixed effect$ or random effect$).tw. 18 12 or 13 or 14 or 15 or 16 or 17 19 11 or 18 20 limit 19 to human [Limit not valid in: Pre‐MEDLINE; records were retained] Long acting or intermediate acting insulin: 1 exp Insulin, Long‐Acting/ 2 exp Insulin, Isophane/ 3 glargine.tw 4 ultralente.tw 5 detemir.tw 6 lantus.tw 7 levemir.tw 8 lente.tw 9 NPH.tw 10 1 or 2 or 3 or 4 or 5or 6 or 7 or 8 or 9 |
Appendix 2. Baseline characteristics
| Characteristic | Ashwell 2006 | Chatterjee 2007 | De Leeuw 2005 | Francis 1986 | Fulcher 2005 | Hermansen 2001 | Hermansen 2004 | Home 2004 | Home 2005 |
| Intervention 1 (I1) / intervention 2 (I2) / control 1 (C1) | I1: Glargine + Lispro C1: NPH + HI | I1: detemir + Aspart C1: NPH + Aspart | I1: detemir + Aspart C1: NPH + Aspart | I1: Ultralente + Porcine Insulin C1: NPH + Porcine Insulin | I1: Glargine + Lispro C1: NPH + Lispro | I1: detemir + HI C1: NPH + HI | I1: detemir + Aspart C1: NPH + HI | I1: detemir (Q12hr) + Aspart I2: detemir (breakfast+bedtime) + Aspart C1: NPH + Aspart | I1: Glargine + Hi C1: NPH + HI |
| [n] (I1/ I2 / C1 / total) | 56/56/56 | 57/57/57 | 217/99/316 | 6/6/6 | 62/63/125 | 59/59/59 | 298/297/595 | 137/139/132/408 | 292/293/585 |
| Sex (males) [n, %] | 20, 37% | 35, 58% | 116, 53.7% / 52, 52.5% | 1, 17% | 24, 38.7% / 25, 39.7% | 46, 82% | 183, 61.4% / 193, 65.0% | 71, 51.8% / 79, 56.8% / 70, 53% | 160, 54.8% / 166, 56.7% |
| Age [years] mean (SD) | 41.1 (12.2) | 42.9 (12.5) | 40.1 (12.8) / 40.8 (13.2) | 31.3 (8.8) | 41.6 (12.9) / 39.3 (13.9) | 34.5 (range 19‐52) | 38.8 (13.5) / 39.3 (12.9) | 40.9 (13.0) / 41.3 (11.4) / 38.3 (12.4) | 39 (12) / 39 (12) |
| Ethnic groups [%] | NA | 97% White European, 3% South Asian | NA | NA | Caucasian (98.4%) | Caucasian (100%) | European extraction (99.8%) | NA | NA |
| Duration of disease [years] mean (SD) | 21.6 (13.1) | 18.2 (11.8) | 17.8 (9.7) / 16.6 (10.2) | 10.2 (5.8) | 17.9 (10.5) / 17.1 (9.7) | 14.8 (range 2.6–47.8) | 15.4 (10.1) / 15.1 (10.4) | 17.1 (10.6) / 17.6 (10.7) / 15.1 (10.6) | 16 (12) / 15 (9) |
| Body mass index [kg/m2] mean (SD) Weight [kg] mean (SD) | 25.9 (2.9) Kg: 73.3 (10.4) | 27 (4.2) Kg: 81.0 (14.0) | 24.4 (2.9) / 24.6 (3.5) Kg: 71.3 (10.7) / 71.7 (12.4) | 23.7 (1.7) | 27.0 (3.6) / 26.0 (3.9) | 23.8 (2.0) Kg: 77.1 (8.9) | 24.8 (3.0) / 24.9 (3.2) Kg: 73.5 (11.4) / 74.2 (12.2) | 25.1 (3.3) / 25.2 (3.6) / 25.2 (3.7) Kg: 74.2 (12.6) / 75.0 (12.3) / 75.5 (14.0) | 24.6 (3.1) / 25.1 (3.3) Kg: 73.2 (11.8) / 74.8 (12.5) |
| Pharmaco‐naive patients [n,%] | 0 / 0 | 0 / 0 | 0 / 0 | 0 / 0 | 0 / 0 | 0 / 0 | 0 / 0 | 0 / 0 | 0 / 0 |
| HbA1c [%] mean (SD) | 8.0 (0.8) | 8.53 (1.15) | 8.18 (1.14) / 8.03 (1.11) | ? | 9.2 (1.1) / 9.7 (1.3) | 7.9 (range 5.7–8.7) | 8.48 (1.12) / 8.29 (1.19) | 8.55 (1.20) / 8.74 (1.20) / 8.52 (1.19) | 7.9 (1.2) / 8.0 (1.2) |
| Fasting blood glucose [mmol/L] | ? | ? | ? | >10 | 11.2 (3.5) / 11.4 (4.1) | ? | ? | ? | 9.3 (2.7) / 9.2 (2.4) |
| Fasting plasma glucose [mmol/L] mean (SD) | ? | 11.5 (5.4) | 11.85 (5.28) / 11.51 (5.16) | ? | ? | ? | 8.83 (4.31) / 9.17 (4.07) | 11.57 (4.65) / 11.65 (4.61) / 12.20 (5.49) | 12.7 (5.0) / 12.1 (4.9) |
| Basal insulin dose (IU/day) | NA | NA | 26.3 (12.1) / 26.2 (14.0) | NA | 28.0 (13.7) / 27.4 (14.7) | NA (<40) | 24.2 (11.0) / 24.5 (11.3) | 26.4 (10.8) / 28.1 (12.5) / 29.5 (13.7) | 20 (range 5‐63) / 21 (range 4‐64) |
| Bolus insulin dose (IU/day) | NA | NA | 31.3 (14.3) / 30.6 (15.1) | NA | 30.2 (16.1) / 29.3 (12.1) | NA | 28.5 (12.3) / 27.8 (13.3) | 30.9 (12.9) / 29.4 (13.4) / 30.5 (13.4) | 26 (NA) / 28 (NA) |
| Clinically different baseline characteristics (Y/N) | NA | NA | NA | NA | Y (significant difference in mean HbA1c) | NA | ? (slightly higher HbA1c level and a slightly lower fasting plasma glucose level in the insulin detemir/insulin aspart group compared with the NPH/regular human insulin group) | N | N |
| Notes | crossover trial | crossover trial | crossover trial | crossover trial | crossover trial |
| Characteristic | Kolendorf 2006 | Murphy 2003 | Pieber 2000 | Porcellati 2004 | Raskin 2000 | Ratner 2000 | Robertson 2007 | Rosenstock 2000 | Russel‐Jones 2004 |
| Intervention 1 (I1) / intervention 2 (I2) / control 1 (C1) | I1: Determir + Aspart C1: NPH + Aspart | I1: Glargine + Lispro C1: NPH + HI | I1: Glargine 30 + HI I2: Glargine 80 + HI I3: NPH + HI | I1: Glargine + Lispro I2: NPH + Lispro | I1: Glargine + Lispro I2: NPH + Lispro | I1: Glargine + HI C1: NPH + HI | I1: Determir + Aspart C1: NPH + Aspart | I1: Glargine 30 + HI I2: Glargine 80 + HI I3: NPH + HI | I1: Determir + HI C1: NPH + HI |
| [n] (I1/ I2 / C1 / total) | 127/130/130 | 26/26/26 | 110/113/110/333 | 61/60/121 | 310/309/619 | 264/270/534 | 232/115/347 | 82/87/88/257 | 491/256/747 |
| Sex (male) [n,%] | 34, 51.5% / 36, 56.3% | 11, 44% | 61, 56% / 74, 66% / 68, 62% | 33, 55% / 34, 55.7% | 151, 48.7% / 162, 52.4% | 141, 53.4% / 129, 47.8% | 119, 51.3% / 55, 47.8% | 42, 51.2% / 44, 51.2% / 47, 53.4% | 322, 65.6% / 157, 61.3% |
| Age [years] mean (SD) | 38.5 (12.3) / 39.9 (12.4) | 14.8 (range 12‐18) | 35.6 (range 18–68) / 37.5 (range 19–70) / 35.7 (range 20–61) | 34 (1.0) / 36 (1.0) | 38.9 (12.2) / 39.5 (12.2) | 38.2 (12.2) / 38.9 (11.9) | 11.9 (2.8) / 11.7 (2.7) | 37.5 (11.7) / 37.0 (11.5) / 37.9 (12.5) | 40.9 (12.4) / 39.8 (12.3) |
| Ethnic groups [%] | White 61 (92.4%) / White 61 (95.3%) | ? | ? | ? | White 299 (96.5%) / 301 (97.4%) Black 10 (3.2%) / 6 (1.9%) Hispanic 3 (1.0%) / 6 (1.9%) Other 1 (0.3%) / 2 (0.6%) | ? | ? | White 93.8% | ? |
| Duration of disease [years] mean (SD) | 16.5 (10.0) / 16.6 (10.6) | 7.3 (range 1.8–15) | median (range) 11.0 (1.0–36.0) / 8.0 (1.0–48.0) / 11.0 (2.0–48.0) | 15 (0.3) / 13 (0.3) | 18.7 (11.5) / 18.4 (11.8) | 17.9 (11.66 ) / 16.9 (10.0) | 5.1 (3.1) / 4.8 (2.8) | 16.7 (11.3) / 15.8 (10.0) / 16.3 (10.8) | 17.1 (11.3) / 16.4 (9.5) |
| Body mass index [kg/m2] mean (SD) Weight [kg] mean (SD) | 25.1 (3.4) / 25.6 (3.5) Kg: 76.2 (13.1) / 77.5 (14.7) | 23.2 (range 18.1–30.4) | 24.0 (range 18.7–28.3) / 24.0 (range 18.6–30.3) / 24.0 (range 18.9–29.1) | 23.2 (0.15) / 22.9 (0.14) | 25.5 (3.4) / 25.7 (3.9) | 25.63 (4.01) / 25.93 (4.55) | Z‐score: 0.15 (range ‐2.0–1.7) / 0.16 (range ‐2.6–1.7) 46.3 (13.6) / 46.2 (15.0) | 23.9 (2.5) / 24.4 (2.5) / 24.5 (2.7) | 25.1 (3.4) / 25.4 (3.4) Kg: 76.5 (12.3) / 76.1 (12.5) |
| Pharmaco‐naive patients [n,%] | 0 / 0 | 0 / 0 | 0 / 0 | 0 / 0 | 0 / 0 | 0 / 0 | 0 / 0 | 0 / 0 | 0 / 0 |
| HbA1c [%] mean (SD) | 7.9 (0.7) / 7.9 (0.8) | 9.3 (range 7.1–12) | 8.09 (0.11) / 7.96 (0.11) / 7.85 (0.11) | 7.1 (0.2) / 7.1 (0.1) | 7.6 (1.2) / 7.7 (1.2) | 7.7 (1.2) / 7.7 (1.1) | 8.8 (1.2) / 8.7 (1.1) | 7.8 (1.1) / 7.9 (1.2) / 8.0 (1.2) | 8.35 (1.20) / 8.35 (1.21) |
| Fasting blood glucose | ? | ? | 8.22 (0.22) / 7.97 (0.24) / 8.06 (0.25) | ? | 9.7 (3.3) / 9.6 (2.6) | 9.2 (2.7) / 9.7 (3.0) | ? | ? | 8.81 (4.22) / 9.09 (4.44) |
| Fasting plasma glucose | ? | ? | 12.76 (0.49) / 11.55 (0.42) / 11.91 (0.49 ) | ? | 11.9 (5.5) / 12.1 (5.1) | median (range) 11.0 (1.1–25.3) / 11.3 (2.2–36.8) | 11.2 (5.1) / 11.1 (5.0) | ? | 11.88 (5.31) / 11.55 (4.96) |
| Basal insulin dose (IU/day) | 0.35 (0.12) / 0.36 (0.12) IU/kg | ? | ? | ? | 28.4 (13.3) / 28.3 (14.4) | ? | Once‐daily (66): 0.38 (0.19) / 0.36 (0.16) Twice or three times daily (97): 0.55 (0.20) / 0.56 (0.22) | ? | ? |
| Bolus insulin dose (IU/day) | NA (0.41 (0.13) / 0.38 (0.13) U/kg) | ? | ? | ? | ? | ? | Once‐daily (66): 0.65 (0.18) / 0.60 (0.21) Twice or three times daily (94): 0.42 (0.19) / 0.40 (0.22) | ? | ? |
| Clinically different baseline characteristics (Y/N) | NA | NA | NA | NA | NA | N | N | N | N |
| Notes | crossover trial | crossover trial | 35 participants used pretrial premix insulin: 0.82 (0.30) / 0.76 (0.21) U/kg |
| Characteristic | Schober 2001 | Tunbridge 1989 | Zinman 1999 | Rossetti 2003 | Vague 2003 |
| Intervention 1 (I1) / intervention 2 (I2) / control 1 (C1) | I1: Glargine + HI C1: NPH + HI | I1: Ultralente + HI C1: Lente + HI | I1: Ultralente + Lispro C1: NPH + Lispro | I1: Glargine dinnertime + Lispro I2: Glargine bedtime + Lispro C: NPH + Lispro | I1: Detemir + Aspart C: NPH + Aspart |
| [n] (I1/ I2 / C1 / total) | 174/175/349 | 66/66/66 | 87/91/178 | 17/17/17/54 | 301/146/447 |
| Sex (male) [n,%] | ? | 37, 56% | 41, 47% / 35, 38* | 9, 52% / 8, 47% / 10, 58% | 162, 53% / 74, 50.7% |
| Age [years] mean (SD) | 11.8 (2) / 11.5 (2) | 38 (range 18‐62) | 35 (1) / 35 (1) | 32 (3) / 31.3 (3.4) / 34 (3.1) | 38.9 (13.3) / 41.8 (14.2) |
| Ethnic groups [%] | ? | ? | ? | ? | ? |
| Duration of disease [years] mean (SD) | ? | 14 (range 3‐30) | 13.6 (0.8) / 16.1 (1.1) | 13.1 (1.9) / 12.9 (2.3) / 14.8 (2.3) | 17.1 (9.9) / 17.4 (11) |
| Body mass index [kg/m2] mean (SD) Weight [kg] mean (SD) | 18.8 (2) / 18.9 ( 2) | 25.3 (range 18.6‐33.4) Kg: 73.0 (range 45.6‐99.0) | 25 (1) / 25 (1) Kg: 74 (1) / 75 (1) | 23.1 (0.8) / 22.9 (1) / 23.2 (0.9) | 24.5 (3.2) / 24.6 (3.4) Kg: 71.5 (11.9) / 71.2 (11.5) |
| Pharmaco‐naive patients [n,%] | 0 / 0 | 0 / 0 | 0 / 0 | 0/0/0 | 0/0/0 |
| HbA1c [%] mean (SD) | ? (all <12%) | 9.0 (range 6.6‐11.4) | 8.2 (0.1) / 8.2 (0.1) | 6.9 (0.1) / 6.8 (0.2) / 7 (0.2) | 8.18 (1.14) / 8.11 (1.12) |
| Fasting blood glucose | ? | ? | ? | ? | ? |
| Fasting plasma glucose | ? | ? | ? | ? | 11.6 (5.21) / 11.6 (5.27) |
| Basal insulin dose (IU/day) | ? | ? | ? | ? | 27.4 (12.5) / 25.2 (13.7) |
| Bolus insulin dose (IU/day) | ? | ? | ? | ? | 30.9 (15.5) / 29.6 (15.8) |
| Clinically different baseline characteristics (Y/N) | N | NA | NA | N | N |
| Notes | letter publication | crossover trial | |||
| Symbols & abbreviations: Y = yes; N = no; ? = unclear I = intervention; C = control |
Appendix 3. Study quality (details)
| Characteristic | Ashwell 2006 | De Leeuw 2005 | Francis 1986 | Fulcher 2005 | Hermansen 2001 | Hermansen 2004 | Home 2004 | Home 2005 | Kolendorf 2006 |
| Intervention 1 (I1) / intervention 2 (I2) / control 1 (C1) | I1: Glargine + Lispro C1: NPH + HI | I1: Determir + Aspart C1: NPH + Aspart | I1: Ultralente + Porcine Insulin C1: NPH + Porcine Insulin | I1: Glargine + Lispro C1: NPH + Lispro | I1: Determir + HI C1: NPH + HI | I1: Determir + Aspart C1: NPH + HI | I1: Determir (Q12hr) + Aspart I2: Determir (breakfast+bedtime) + Aspart C1: NPH + Aspart | I1: Glargine + Hi C1: NPH + HI | I1: Determir + Aspart C1: NPH + Aspart |
| Randomised controlled clinical trial (RCT) | Y | Y | Y | Y | Y | Y | Y | Y | Y |
| Non‐inferiority / equivalence trial | Y | Y | Y | Y | Y | Y | Y | Y | Y |
| Controlled clinical trial | Y | Y | Y | Y | Y | Y | Y | Y | Y |
| Design: parallel, crossover, factorial RCT | Crossover | Parallel | Crossover | Parallel | Crossover | Parallel | Parallel | Parallel | Crossover |
| Crossover study: wash‐out phase | N | N | N | N | |||||
| Crossover study: carryover effect tested | N | N | N | N | |||||
| Method of randomisation | Central computer | ? | ? | ? | ? | ? | Remote telephone | Central telephone | ? |
| Unit of randomisation (individuals, cluster ‐ specify) | Individual | Individual | Individual | Individual | Clusters of 4 | Individual | Individual | Individual | Individual |
| Randomisation stratified for centres | N | N | N | N | N | N | N | N | N |
| Randomisation ratio | 1:1 | 2:1 | 1:1 | 1:1 | 1:1 | 1:1 | 1:1:1 | 1:1 | 1:1 |
| Concealment of allocation | Y | ? | ? | ? | ? | ? | ? | ? | ? |
| Stated blinding (open; single, double, triple blind) | Open | Open | Open | Single blinding | Open | Open | Open | Open | Open |
| Actual blinding: participant | N | N | N | N | N | N | N | N | N |
| Actual blinding: caregiver / treatment administrator | N | N | N | Y | N | N | N | N | N |
| Actual blinding: outcome assessor | ? | ? | ? | ? | Y | ? | ? | ? | ? |
| Actual blinding: others | ? | ? | ? | ? | ? | ? | ? | ? | ? |
| Blinding checked: participant | NA | NA | NA | NA | NA | NA | NA | NA | NA |
| Blinding checked: caregiver / treatment administrator | NA | NA | NA | ? | NA | NA | NA | NA | NA |
| Primary endpoint defined | Y | N | N | Y | Y | Y | N | Y | Y |
| [n] of primary endpoint(s) | 1 | ? | ? | 1 | 1 | 1 | ? | 1 | 1 |
| [n] of secondary endpoints | 5 | ? | ? | 7 | 6 | 4 | ? | 4 | 3 |
| Total [n] of endpoints | 6 | 5 | 14 | 8 | 7 | 5 | 6 | 5 | 4 |
| Prior publication of study design | N | N | N | N | N | N | N | N | N |
| Outcomes of prior / current publication identical | NA | NA | NA | NA | NA | NA | NA | NA | NA |
| Power calculation | Y | Y | N | Y | Y | Y | Y | Y | Y |
| [n] participants per group calculated | 54 | ? | NA | 48 | 49 | 281 per group | 366 total | ? | 132 |
| Non‐inferiority trial: interval for equivalence specified | Y | Y | N | Y | Y | Y | Y | ? | Y |
| Intention‐to‐treat analysis (ITT) | Y | Y | ? | Y | ? | Y | Y | ? | ? |
| ITT defined | Y | Y | N | Y | N | Y | Y | N | N |
| Analysis stratified for centres | N | N | N | N | N | N | N | N | N |
| Missing data: last‐observation‐carried‐forward (LOCF) | ? | ? | ? | ? | ? | ? | N | ? | ? |
| Missing data: other methods | ? | ? | ? | ? | ? | ? | ? | ? | ? |
| LOCF defined | ? | ? | ? | ? | ? | ? | N | ? | ? |
| [n] of screened participants (I1/ I2 / C1 / total) | 71 | ? | ? | ? | ? | ? | 441 total | 655 total | 207 total |
| [n] treated with at least one dose (I1/I2/C1/Total) | 56/56/56 | 217/99/316 | 6/6/6 | 62/63/125 | 59/59/59 | 298/297/595 | 137/139/132/408 | 292/293/585 | 127/130/130 |
| [n] of participants finishing the study | 51/51/51 | 212/96/308 | 6/6/6 | 58/49/107 | 56/56/56 | 289/286/575 | 135/132/124/391 | 276/272/548 | 124 |
| [n] of patients analysed | 54/54/54 | 217/99/316 | 6/6/6 | 62/63/125 | 56/56/56 | 298/297/595 | 137/139/132/408 | 292/293/585 | 125/127 |
| Description of discontinuing participants | Y | Y | NA | Y | Y | Y | Y | Y | Y |
| Drop‐outs (reasons explained) | Y | Y | NA | Y | Y | Y | Y | Y | Y |
| Withdrawals (reasons explained) | Y | Y | NA | Y | Y | Y | Y | Y | Y |
| Losses‐to‐follow‐up (reasons explained) | Y | Y | NA | Y | Y | Y | Y | Y | Y |
| [n] of participants who discontinued | 3/3/3 | 5/3/8 | 0/0/0 | 4/14/18 | 3 total | 9/14/23 | 4/5/8/17 | 16/21/37 | 1/6/7 |
| [%] discontinuation rate | 5.5% | 3%/3% | 0% | 6.4%/22.2%/14.4% | 5% total | 3%/5% | 3%/4%/7%/ | 9% total | 5.3% total |
| Discontinuation rate similar between groups | Y | Y | Y | N | Y | Y | Y | Y | Y |
| [%] crossover between groups | ? | ? | ? | ? | ? | ? | ? | ? | ? |
| [n] of subgroups | 0 | 0 | 0 | 0 | 0 | 0 | 0 | 2 | 0 |
| Subgroups: pre‐defined | 0 | 0 | 0 | 0 | 0 | 0 | 0 | ? | 0 |
| Subgroups: post‐hoc | 0 | 0 | 0 | 0 | 0 | 0 | 0 | ? | 0 |
| Adjustment for multiple outcomes / repeated measurements | NA | NA | NA | NA | NA | NA | NA | NA | NA |
| Timing of outcomes' measurement comparable between groups | Y | Y | Y | Y | Y | Y | Y | Y | Y |
| Compliance measured | N | N | N | N | N | N | N | N | N |
| Other important covariates measured (specify) | N | N | N | N | N | N | N | N | N |
| Co‐morbidities measured | N | N | N | N | N | N | N | N | N |
| Co‐medications measured | N | N | N | N | N | N | N | N | N |
| Specific doubts about study quality | N | N | Y (very small study) | N | Y (no ITT) | N | N | N | N |
| Funding: commercial | Y | Y | N | Y | Y | Y | Y | Y | Y |
| Funding: non‐commercial | N | N | Y (novo laboratiries and British Diabetes Association) | N | N | N | N | N | N |
| Publication status: peer review journal | Y | Y | Y | Y | Y | Y | Y | Y | Y |
| Publication status: journal supplement | N | N | N | N | N | N | N | N | N |
| Publication status: abstract | N | N | N | N | N | N | N | N | N |
| Publication status: other | N | N | N | N | N | N | N | N | N |
| Single/multi‐center | Multi (5) | Multi (42) | Single | Multi (7) | Multi (7) | Multi (64) | Multi (52) | Multi (63) | Multi (11) |
| Countries | ? | Europe | UK | Australia | ? | Europe | Europe+Australia | Europe | Europe+Australia+South Africa |
| Diagnostic criteria for DM1 defined | N | N | N | N | N | N | N | N | N |
| Diagnostic criteria adequate | NA | NA | NA | NA | NA | NA | NA | NA | NA |
| Langauge of publication | English | English | English | English | English | English | English | English | English |
| Characteristic | Murphy 2003 | Pieber 2000 | Porcellati 2004 | Raskin 2000 | Ratner 2000 | Rosenstock 2000 | Russell‐Jones 2004 | Schober 2001 | Tunbridge 1989 |
| Intervention 1 (I1) / intervention 2 (I2) / control 1 (C1) | I1: Glargine + Lispro C1: NPH + HI | I1: Glargine 30 + HI I2: Glargine 80 + HI I3: NPH + HI | I1: Glargine + Lispro I2: NPH + Lispro | I1: Glargine + Lispro I2: NPH + Lispro | I1: Glargine + HI C1: NPH + HI | I1: Glargine 30 + HI I2: Glargine 80 + HI I3: NPH + HI | I1: Determir + HI C1: NPH + HI | I1: Glargine + HI C1: NPH + HI | I1: Ultralente + HI C1: Lente + HI |
| Randomised controlled clinical trial (RCT) | Y | Y | Y | Y | Y | Y | Y | Y | Y |
| Non‐inferiority / equivalence trial | Y | Y | Y | Y | Y | Y | Y | Y | Y |
| Controlled clinical trial | Y | Y | Y | Y | Y | Y | Y | Y | Y |
| Design: parallel, crossover, factorial RCT | Crossover | Parallel | Parallel | Parallel | Parallel | Parallel | Parallel | Parallel | Crossover |
| Crossover study: wash‐out phase | N | NA | NA | NA | NA | NA | NA | NA | N |
| Crossover study: carryover effect tested | N | NA | NA | NA | NA | NA | NA | NA | N |
| Method of randomisation | ? | ? | Y (computer generated randomization) | Y (telephone) | ? | ? | ? | ? | Y (code prepared elsewhere) |
| Unit of randomisation (individuals, cluster ‐ specify) | Individual | Individual | Individual | Individual | Individual | Individual | Individual | Individual | Individual |
| Randomisation stratified for centres | N | N | N | N | N | N | N | N | N |
| Randomisation ratio | 1:1 | 1:1:1 | 1:1 | 1:1 | 1:1 | 1:1:1 | 2:1 | 1:1 | 1:1 |
| Concealment of allocation | ? | ? | Y | ? | ? | ? | ? | ? | ? |
| Stated blinding (open; single, double, triple blind) | Open | Partially open | ? | Open | Open | Partially open | Open | Open | Double blind |
| Actual blinding: participant | N | N (double blind between glargine groups) | N | N | N | N (double blind between glargine groups) | N | N | Y |
| Actual blinding: caregiver / treatment administrator | N | N (double blind between glargine groups) | ? | N | N | N (double blind between glargine groups) | N | N | Y |
| Actual blinding: outcome assessor | ? | ? | ? | ? | ? | ? | ? | ? | ? |
| Actual blinding: others | ? | ? | ? | ? | ? | ? | ? | ? | ? |
| Blinding checked: participant | NA | NA | NA | NA | NA | NA | NA | NA | ? |
| Blinding checked: caregiver / treatment administrator | NA | NA | NA | NA | NA | NA | NA | NA | ? |
| Primary endpoint defined | Y | N | Y | N | N | Y | N | Y | N |
| [n] of primary endpoint(s) | 1 | ? | 1 | ? | ? | 1 | ? | 1 | ? |
| [n] of secondary endpoints | 3 | ? | 5 | ? | ? | 8 | ? | 2 | ? |
| Total [n] of endpoints | 4 | 8 | 6 | 4 | 5 | 9 | 6 | 3 | 8 |
| Prior publication of study design | N | N | N | N | N | N | N | N | N |
| Outcomes of prior / current publication identical | NA | NA | NA | NA | NA | NA | NA | NA | NA |
| Power calculation | N | N | Y | N | Y | Y | Y | ? | N |
| [n] participants per group calculated | NA | NA | 120 | N | 220/220/440 | ? | ? | ? | NA |
| Non‐inferiority trial: interval for equivalence specified | N | N | Y | N | Y | Y | Y | N | N |
| Intention‐to‐treat analysis (ITT) | N | ? | ? | ? | Y | Y | Y | ? | Y |
| ITT defined | NA | N | N | N | Y | Y | Y | N | Y |
| Analysis stratified for centres | N | N | N | N | N | N | N | N | N |
| Missing data: last‐observation‐carried‐forward (LOCF) | ? | ? | ? | ? | Y | ? | ? | ? | ? |
| Missing data: other methods | ? | ? | ? | ? | ? | ? | ? | ? | ? |
| LOCF defined | N | N | N | N | N | N | N | N | N |
| [n] of screened participants (I1/ I2 / C1 / total) | 47 | ? | ? | ? | ? | ? | ? | ? | ? |
| [n] treated with at least one dose (I1/I2/C1/Total) | 26/26/26 | 110/113/110/333 | 61/60/121 | 310/309/619 | 264/270/534 | 82/87/88/257 | 491/256/747 | 174/175/349 | 66/66/66 |
| [n] of participants finishing the study | 25/25/25 | ? | ? | 295/293/588 | 233/248/481 | 82/87/87/256 | 465/235/700 | ? | 65/65/65 |
| [n] of patients analysed | 25/25/25 | ? | ? | ? | ? | ? | 491/256/747 | ? | 66/66/66 |
| Description of discontinuing participants | Y | N | N | Partial | Y | Y | Y | N | Y |
| Drop‐outs (reasons explained) | Y | N | N | Y | Y | Y | Y | N | Y |
| Withdrawals (reasons explained) | Y | N | N | N | Y | Y | Y | N | Y |
| Losses‐to‐follow‐up (reasons explained) | Y | N | Y | N | Y | Y | Y | N | Y |
| [n] of participants who discontinued | 1/0 | ? | ? | 15/16/31 | 31/22/53 | 0/0/1/1 | 26/21/47 | ? | 1/0/1 |
| [%] discontinuation rate | 4% | ? | ? | 4.8%/5.1?/5% | 11.7%/8.1% | 0%/0%/1.2% | 5.4%/8.2% | ? | 1.5%/0%/1.5% |
| Discontinuation rate similar between groups | Y | ? | ? | Y | Y | Y | Y | ? | Y |
| [%] crossover between groups | ? | ? | ? | ? | ? | ? | ? | ? | ? |
| [n] of subgroups | 0 | 0 | 0 | 0 | 0 | 2 | 0 | 2 | 2 |
| Subgroups: pre‐defined | NA | NA | NA | NA | NA | ? | NA | 2 | 0 |
| Subgroups: post‐hoc | NA | NA | NA | NA | NA | ? | NA | 0 | 1 |
| Adjustment for multiple outcomes / repeated measurements | NA | NA | NA | NA | NA | NA | NA | NA | NA |
| Timing of outcomes' measurement comparable between groups | Y | Y | Y | Y | Y | Y | Y | Y | Y |
| Compliance measured | N | N | N | N | N | N | N | N | N |
| Other important covariates measured (specify) | N | N | N | N | N | N | N | N | N |
| Co‐morbidities measured | N | N | N | N | N | N | N | N | N |
| Co‐medications measured | N | N | N | N | N | N | N | N | N |
| Specific doubts about study quality | N | Y (dropouts not defined) | Y (dropouts not defined) | Y (dropouts not defined) | N | N | N | Y (dropouts and ITT not defined) | N |
| Funding: commercial | Y | Y | N | Y | Y | Y | Y | Y | Y |
| Funding: non‐commercial | N | N | National ministry of scientific research and the University of Perugia | N | N | N | N | N | N |
| Publication status: peer review journal | Y | Y | Y | Y | Y | Y | Y | Y | Y |
| Publication status: journal supplement | N | N | N | N | N | N | N | N | N |
| Publication status: abstract | N | N | N | N | N | N | N | N | N |
| Publication status: other | N | N | N | N | N | N | Presented in the 38th annual meeting of the European Association for the Study of Diabetes (2002) | Published as a letter. | N |
| Single/multi‐center | Single | Multi | Single | Multi (60) | Multi (49) | Multi | Multi (92) | Multi | Multi (4) |
| Countries | UK | Europe | Italy | ? | ? | ? | Europe + Australia | ? | UK |
| Diagnostic criteria for DM1 defined | N | N | N | N | N | N | N | N | N |
| Diagnostic criteria adequate | NA | NA | NA | NA | NA | NA | NA | NA | NA |
| Langauge of publication | English | English | English | English | English | English | English | English | English |
| Characteristic | Zinman 1999 | Chatterjee 2007 | Robertson 2007 | Rossetti 2003 | Vague 2003 |
| Intervention 1 (I1) / intervention 2 (I2) / control 1 (C1) | I1: Ultralente + Lispro C1: NPH + Lispro | I1: Determir + Aspart C1: NPH + Aspart | I1: Determir + Aspart C1: NPH + Aspart | I1: Glargine dinnertime + Lispro I2: Glargine bedtime + Lispro C: NPH + Lispro | I1: Detemir + Aspart C; NPH + Aspart |
| Randomised controlled clinical trial (RCT) | Y | Y | Y | Y | Y |
| Non‐inferiority / equivalence trial | Y | Y | Y | Y | Y |
| Controlled clinical trial | Y | Y | Y | Y | Y |
| Design: parallel, crossover, factorial RCT | Parallel | Crossover | Parallel | Parallel | Parallel |
| Crossover study: wash‐out phase | NA | N | NA | NA | NA |
| Crossover study: carryover effect tested | NA | N | NA | NA | NA |
| Method of randomisation | ? | Y (sealed envelopes) | Y (central telephone system) | ? | Y (interactive voice response system) |
| Unit of randomisation (individuals, cluster ‐ specify) | Individual | Individual | Blocks of three (2:1) | Individual | Individual |
| Randomisation stratified for centres | N | NA | N | N | N |
| Randomisation ratio | 1:1 | 1:1 | 2:1 | 1:1:1 | 2:1 |
| Concealment of allocation | ? | ? | ? | ? | ? |
| Stated blinding (open; single, double, triple blind) | Double blind | Open label | Open label | Not stated | Open |
| Actual blinding: participant | Y | N | N | N | N |
| Actual blinding: caregiver / treatment administrator | Y | N | N | N | N |
| Actual blinding: outcome assessor | ? | ? | ? | ? | ? |
| Actual blinding: others | ? | ? | ? | ? | ? |
| Blinding checked: participant | ? | NA | NA | NA | NA |
| Blinding checked: caregiver / treatment administrator | ? | NA | NA | NA | NA |
| Primary endpoint defined | N | Y | Y | Y | Y |
| [n] of primary endpoint(s) | ? | 1 | 1 | 1 | 1 |
| [n] of secondary endpoints | ? | 8 | 3 | 7 | 4 |
| Total [n] of endpoints | 5 | 9 | 4 | 8 | 5 |
| Prior publication of study design | N | N | N | N | N |
| Outcomes of prior / current publication identical | NA | NA | NA | NA | NA |
| Power calculation | ? | Y | Y | Y | ? |
| [n] participants per group calculated | N | 59 | Total 270 | Total 51 | NA |
| Non‐inferiority trial: interval for equivalence specified | N | Y | Y | Y | N |
| Intention‐to‐treat analysis (ITT) | Y | N | Y | ? | Y |
| ITT defined | N | NA | Y | N | Y |
| Analysis stratified for centres | N | NA | N | NA | N |
| Missing data: last‐observation‐carried‐forward (LOCF) | ? | ? | ? | ? | ? |
| Missing data: other methods | ? | ? | ? | ? | ? |
| LOCF defined | ? | ? | ? | ? | ? |
| [n] of screened participants (I1/ I2 / C1 / total) | ? | ? | 363 | ? | 448 |
| [n] treated with at least one dose (I1/I2/C1/Total) | 87/91/178 | 57/57/57 | 232/115/347 | 51 | 301/146/447 |
| [n] of participants finishing the study | 87/91/178 | 53/55 | 226/109/335 | ? | 284/141/425 |
| [n] of patients analysed | 87/91/178 | 53/55 | 232/115/347 | ? | 301/146/447 |
| Description of discontinuing participants | N | Y | Y | N | Y |
| Drop‐outs (reasons explained) | N | Y | Y | N | Y |
| Withdrawals (reasons explained) | N | Y | Y | N | Y |
| Losses‐to‐follow‐up (reasons explained) | N | Y | Y | N | Y |
| [n] of participants who discontinued | 0/0/0 | 4/2 | 6/6/12 | ? | 17/5/22 |
| [%] discontinuation rate | 0%/0%/0% | 6%/3% | 2.5%/5.5%/3.4% | ? | 5.4% / 3.4% |
| Discontinuation rate similar between groups | Y | Y | y | ? | Y |
| [%] crossover between groups | ? | ? | ? | ? | ? |
| [n] of subgroups | 1 | 0 | 0 | 2 | 0 |
| Subgroups: pre‐defined | ? | NA | NA | Y | NA |
| Subgroups: post‐hoc | ? | NA | NA | NA | NA |
| Adjustment for multiple outcomes / repeated measurements | NA | NA | NA | NA | NA |
| Baseline characteristics: clinically relevant differences | N | N | N | N | N |
| Treatment identical (apart from intervention) | ? | ? | ? | ? | ? |
| Timing of outcomes' measurement comparable between groups | Y | Y | Y | Y | Y |
| Compliance measured | N | N | N | N | N |
| Other important covariates measured (specify) | N | N | N | N | N |
| Co‐morbidities measured | N | N | N | N | N |
| Co‐medications measured | N | N | N | N | N |
| Specific doubts about study quality | Y (no description of dropouts) | Y (no ITT) | N | Y (no ITT, no description of drop‐outs) | N |
| Funding: commercial | Y (m/p) | Y | Y | N | Y |
| Funding: non‐commercial | ? | N | N | Y (National ministry of scientific research and university of Perugia) | N |
| Publication status: peer review journal | Y | Y | Y | Y | Y |
| Publication status: journal supplement | N | N | N | N | N |
| Publication status: abstract | N | N | N | N | N |
| Publication status: other | N | N | N | N | N |
| Single/multi‐center | ? | Single | Multi | Single | Multi |
| Countries | Canada | UK | Europe | Italy | ? |
| Diagnostic criteria for DM1 defined | N | N | N | N | N |
| Diagnostic criteria adequate | N | N | N | N | N |
| Langauge of publication | English | English | English | English | English |
| Symbols & abbreviations: Y = yes; N = no; ? = unclear I = intervention; C = control |
Data and analyses
Comparison 1. Efficacy.
| Outcome or subgroup title | No. of studies | No. of participants | Statistical method | Effect size |
|---|---|---|---|---|
| 1 Glycated haemoglobin | 22 | Mean Difference (IV, Fixed, 95% CI) | Subtotals only | |
| 1.1 Short term | 4 | 1259 | Mean Difference (IV, Fixed, 95% CI) | ‐0.08 [‐0.17, 0.00] |
| 1.2 Intermediate term | 10 | 2724 | Mean Difference (IV, Fixed, 95% CI) | ‐0.17 [‐0.23, ‐0.10] |
| 1.3 Long term | 9 | 3302 | Mean Difference (IV, Fixed, 95% CI) | 0.01 [‐0.06, 0.08] |
| 2 Fasting blood glucose | 17 | Mean Difference (IV, Fixed, 95% CI) | Subtotals only | |
| 2.1 Short term | 4 | 1326 | Mean Difference (IV, Fixed, 95% CI) | ‐0.94 [‐1.22, ‐0.66] |
| 2.2 Intermediate term | 8 | 2015 | Mean Difference (IV, Fixed, 95% CI) | ‐1.06 [‐1.29, ‐0.82] |
| 2.3 Long term | 6 | 2687 | Mean Difference (IV, Fixed, 95% CI) | ‐0.70 [‐0.89, ‐0.52] |
| 3 Fasting plasma glucose | 12 | Mean Difference (IV, Fixed, 95% CI) | Subtotals only | |
| 3.1 Short term | 3 | 1208 | Mean Difference (IV, Fixed, 95% CI) | ‐1.42 [‐1.94, ‐0.91] |
| 3.2 Intermediate term | 6 | 2211 | Mean Difference (IV, Fixed, 95% CI) | ‐1.06 [‐1.41, ‐0.70] |
| 3.3 Long term | 4 | 2182 | Mean Difference (IV, Fixed, 95% CI) | ‐0.81 [‐1.29, ‐0.32] |
| 4 Mean daily self measured blood glucose (SMBG) average (7‐8 points) | 6 | 790 | Mean Difference (IV, Fixed, 95% CI) | ‐0.47 [‐0.58, ‐0.36] |
| 4.1 Short term | 3 | 425 | Mean Difference (IV, Fixed, 95% CI) | ‐0.47 [‐0.58, ‐0.35] |
| 4.2 Intermediate term | 2 | 244 | Mean Difference (IV, Fixed, 95% CI) | ‐0.43 [‐1.09, 0.24] |
| 4.3 Long term | 1 | 121 | Mean Difference (IV, Fixed, 95% CI) | ‐0.5 [‐0.98, ‐0.02] |
| 5 Glycated haemoglobin‐ total | 22 | 6666 | Mean Difference (IV, Fixed, 95% CI) | ‐0.08 [‐0.12, ‐0.04] |
| 6 Fasting blood glucose‐total | 17 | 5409 | Mean Difference (IV, Fixed, 95% CI) | ‐0.86 [1.00, ‐0.72] |
| 7 Fasting plasma glucose‐ total | 11 | 4868 | Mean Difference (IV, Fixed, 95% CI) | ‐0.63 [‐0.86, ‐0.40] |
1.1. Analysis.
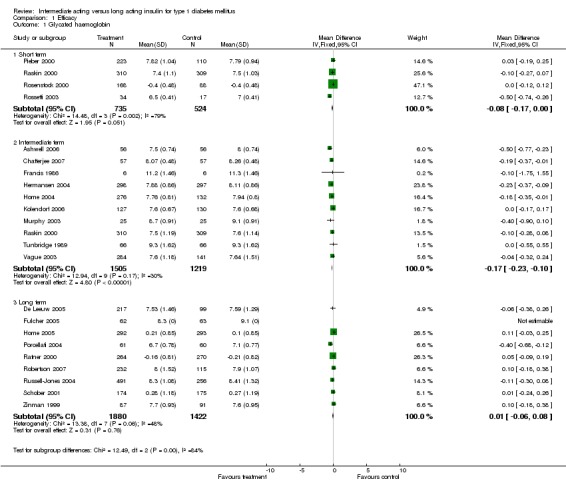
Comparison 1 Efficacy, Outcome 1 Glycated haemoglobin.
1.2. Analysis.
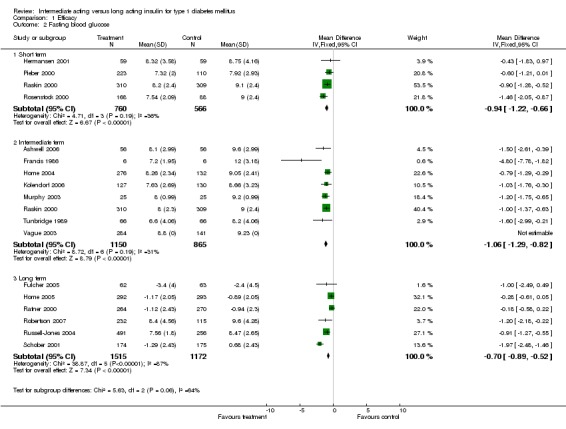
Comparison 1 Efficacy, Outcome 2 Fasting blood glucose.
1.3. Analysis.
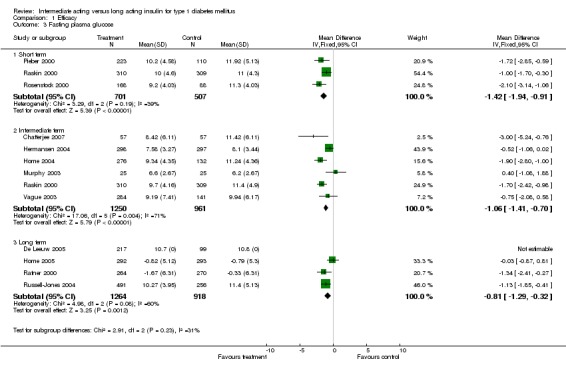
Comparison 1 Efficacy, Outcome 3 Fasting plasma glucose.
1.4. Analysis.
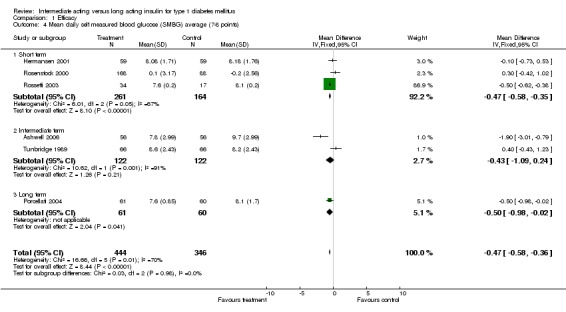
Comparison 1 Efficacy, Outcome 4 Mean daily self measured blood glucose (SMBG) average (7‐8 points).
1.5. Analysis.
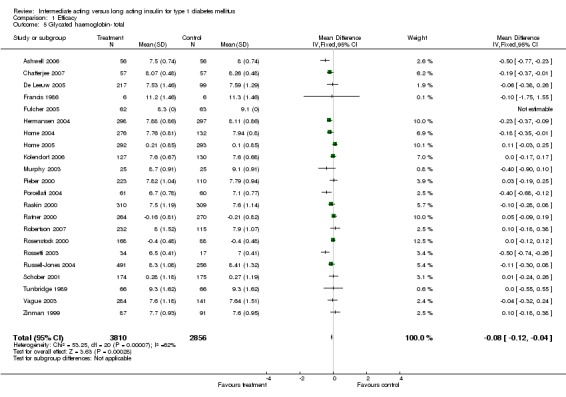
Comparison 1 Efficacy, Outcome 5 Glycated haemoglobin‐ total.
1.6. Analysis.
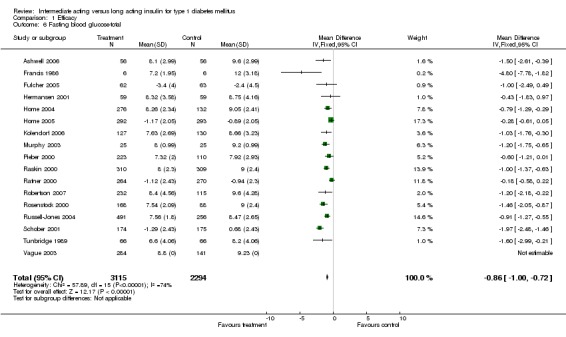
Comparison 1 Efficacy, Outcome 6 Fasting blood glucose‐total.
1.7. Analysis.
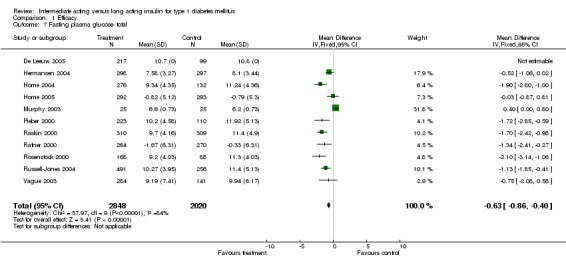
Comparison 1 Efficacy, Outcome 7 Fasting plasma glucose‐ total.
Comparison 2. Hypoglycemia.
| Outcome or subgroup title | No. of studies | No. of participants | Statistical method | Effect size |
|---|---|---|---|---|
| 1 Percent of participating experiencing hypoglycemia | 20 | Odds Ratio (M‐H, Fixed, 95% CI) | Subtotals only | |
| 1.1 Total episodes | 16 | 6131 | Odds Ratio (M‐H, Fixed, 95% CI) | 0.93 [0.80, 1.08] |
| 1.2 Severe episodes | 17 | 5827 | Odds Ratio (M‐H, Fixed, 95% CI) | 0.73 [0.61, 0.87] |
| 1.3 Nocturnal episodes | 13 | 5406 | Odds Ratio (M‐H, Fixed, 95% CI) | 0.70 [0.63, 0.79] |
| 2 Hypoglycemic events per 100 patient's days | 19 | Mean Difference (IV, Fixed, 95% CI) | Subtotals only | |
| 2.1 Total episodes | 15 | 4704 | Mean Difference (IV, Fixed, 95% CI) | ‐0.77 [‐0.89, ‐0.65] |
| 2.2 Severe episodes | 15 | 4564 | Mean Difference (IV, Fixed, 95% CI) | ‐0.00 [‐0.02, 0.02] |
| 2.3 Nocturnal episodes | 17 | 4971 | Mean Difference (IV, Fixed, 95% CI) | ‐0.40 [‐0.45, ‐0.34] |
2.1. Analysis.
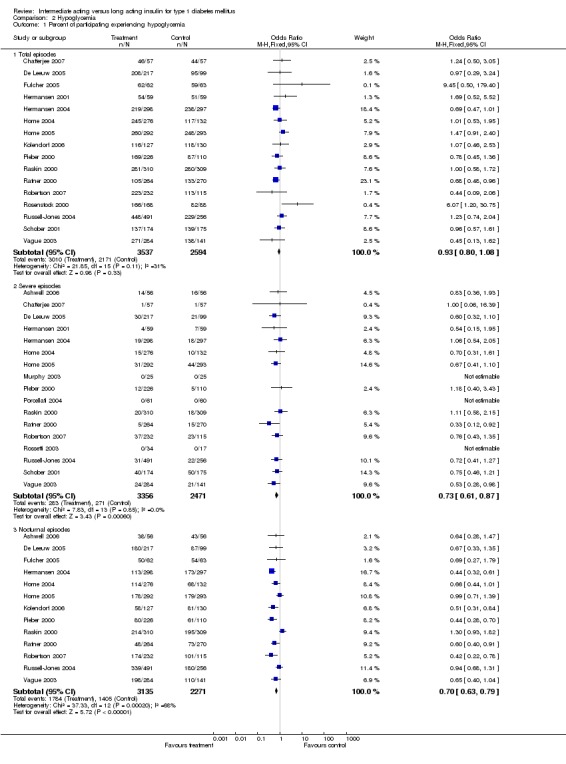
Comparison 2 Hypoglycemia, Outcome 1 Percent of participating experiencing hypoglycemia.
2.2. Analysis.
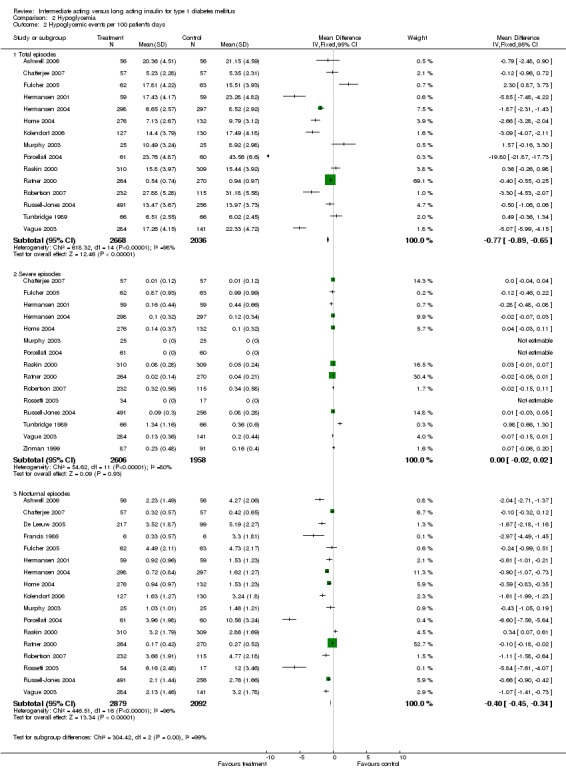
Comparison 2 Hypoglycemia, Outcome 2 Hypoglycemic events per 100 patient's days.
Comparison 3. Adverse Events.
| Outcome or subgroup title | No. of studies | No. of participants | Statistical method | Effect size |
|---|---|---|---|---|
| 1 Number of serious adverse events | 14 | 4878 | Odds Ratio (M‐H, Fixed, 95% CI) | 0.89 [0.66, 1.21] |
| 2 Type of serious adverse events and reasons for death | Other data | No numeric data | ||
| 3 Death | 23 | 6787 | Odds Ratio (M‐H, Fixed, 95% CI) | 0.33 [0.03, 3.23] |
3.1. Analysis.
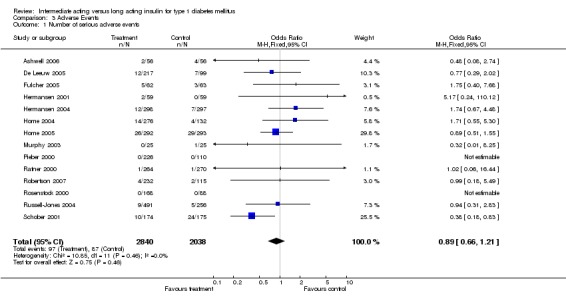
Comparison 3 Adverse Events, Outcome 1 Number of serious adverse events.
3.3. Analysis.
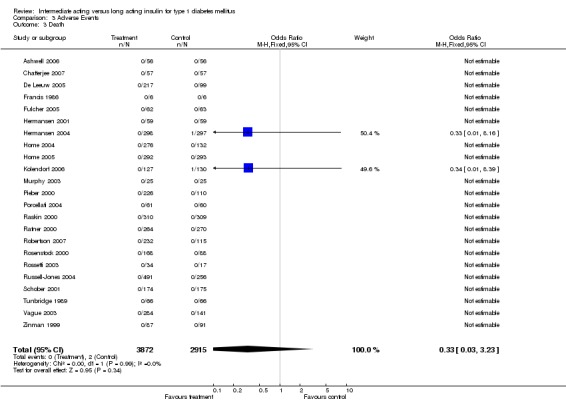
Comparison 3 Adverse Events, Outcome 3 Death.
Comparison 4. Weight gain.
| Outcome or subgroup title | No. of studies | No. of participants | Statistical method | Effect size |
|---|---|---|---|---|
| 1 Weight gain | 8 | 2862 | Mean Difference (IV, Fixed, 95% CI) | ‐0.67 [‐0.88, ‐0.45] |
| 1.1 Intermediate term | 5 | 1674 | Mean Difference (IV, Fixed, 95% CI) | ‐0.83 [‐1.10, ‐0.56] |
| 1.2 Long term | 3 | 1188 | Mean Difference (IV, Fixed, 95% CI) | ‐0.38 [‐0.74, ‐0.02] |
4.1. Analysis.
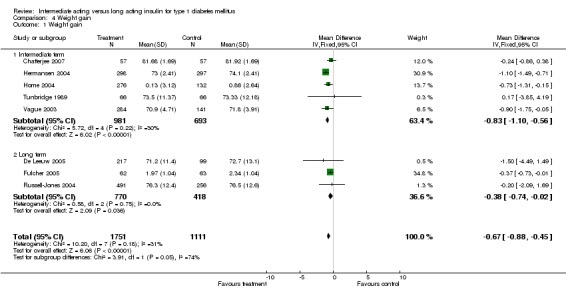
Comparison 4 Weight gain, Outcome 1 Weight gain.
Comparison 5. Insulin dose.
| Outcome or subgroup title | No. of studies | No. of participants | Statistical method | Effect size |
|---|---|---|---|---|
| 1 Basal Insulin dose | 18 | 5713 | Mean Difference (IV, Fixed, 95% CI) | ‐0.02 [‐0.03, ‐0.01] |
| 2 Bolus insulin dose | 16 | 4509 | Mean Difference (IV, Fixed, 95% CI) | 0.00 [‐0.01, 0.02] |
5.1. Analysis.
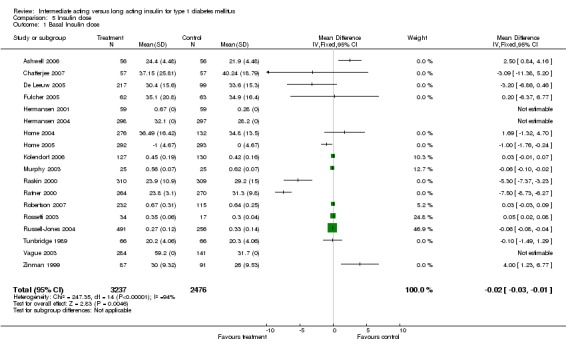
Comparison 5 Insulin dose, Outcome 1 Basal Insulin dose.
5.2. Analysis.
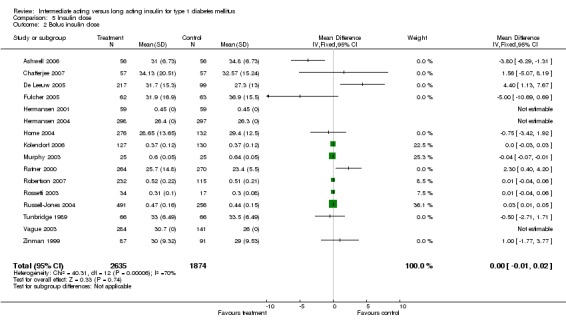
Comparison 5 Insulin dose, Outcome 2 Bolus insulin dose.
Comparison 6. Children‐ efficacy.
| Outcome or subgroup title | No. of studies | No. of participants | Statistical method | Effect size |
|---|---|---|---|---|
| 1 Glycated haemoglobin | 2 | Mean Difference (IV, Fixed, 95% CI) | Subtotals only | |
| 1.1 Children | 2 | 399 | Mean Difference (IV, Fixed, 95% CI) | ‐0.07 [‐0.29, 0.15] |
| 2 Fasting blood glucose | 2 | Mean Difference (IV, Fixed, 95% CI) | Subtotals only | |
| 2.1 Children | 2 | 399 | Mean Difference (IV, Fixed, 95% CI) | ‐0.88 [‐1.26, ‐0.51] |
| 3 Fasting plasma glucose | 1 | Mean Difference (IV, Fixed, 95% CI) | Subtotals only | |
| 3.1 Children | 1 | 50 | Mean Difference (IV, Fixed, 95% CI) | 0.40 [‐0.00, 0.80] |
6.1. Analysis.

Comparison 6 Children‐ efficacy, Outcome 1 Glycated haemoglobin.
6.2. Analysis.

Comparison 6 Children‐ efficacy, Outcome 2 Fasting blood glucose.
6.3. Analysis.

Comparison 6 Children‐ efficacy, Outcome 3 Fasting plasma glucose.
Comparison 7. Heterogeneity analyses.
| Outcome or subgroup title | No. of studies | No. of participants | Statistical method | Effect size |
|---|---|---|---|---|
| 1 Glycated haemoglobin‐ random effect model | 22 | Mean Difference (IV, Random, 95% CI) | Subtotals only | |
| 1.1 Short term | 4 | 1259 | Mean Difference (IV, Random, 95% CI) | ‐0.13 [‐0.33, 0.07] |
| 1.2 Intermediate term | 10 | 2724 | Mean Difference (IV, Random, 95% CI) | ‐0.17 [‐0.26, ‐0.08] |
| 1.3 Long term | 9 | 3302 | Mean Difference (IV, Random, 95% CI) | ‐0.01 [‐0.11, 0.10] |
| 2 Fasting blood glucose‐ random effect model | 17 | Mean Difference (IV, Random, 95% CI) | Subtotals only | |
| 2.1 Short term | 4 | 1326 | Mean Difference (IV, Random, 95% CI) | ‐0.94 [‐1.32, ‐0.55] |
| 2.2 Intermediate term | 8 | 2015 | Mean Difference (IV, Random, 95% CI) | ‐1.10 [‐1.42, ‐0.78] |
| 2.3 Long term | 6 | 2687 | Mean Difference (IV, Random, 95% CI) | ‐0.88 [‐1.47, ‐0.30] |
| 3 Fasting plasma glucose‐ random effect model | 12 | Mean Difference (IV, Random, 95% CI) | Subtotals only | |
| 3.1 Short term | 3 | 1208 | Mean Difference (IV, Random, 95% CI) | ‐1.51 [‐2.20, ‐0.81] |
| 3.2 Intermediate term | 6 | 2211 | Mean Difference (IV, Random, 95% CI) | ‐1.06 [‐1.99, ‐0.13] |
| 3.3 Long term | 4 | 2182 | Mean Difference (IV, Random, 95% CI) | ‐0.81 [‐1.60, ‐0.02] |
| 4 Mean daily self measured blood glucose (SMBG) average (7‐8 points)‐ random effect model | 6 | 790 | Mean Difference (IV, Random, 95% CI) | ‐0.33 [‐0.73, 0.07] |
| 4.1 Short term | 3 | 425 | Mean Difference (IV, Random, 95% CI) | ‐0.20 [‐0.68, 0.28] |
| 4.2 Intermediate term | 2 | 244 | Mean Difference (IV, Random, 95% CI) | ‐0.72 [‐2.97, 1.53] |
| 4.3 Long term | 1 | 121 | Mean Difference (IV, Random, 95% CI) | ‐0.5 [‐0.98, ‐0.02] |
| 5 Fasting blood glucose‐total‐ random effect model | 17 | 5409 | Mean Difference (IV, Random, 95% CI) | ‐1.01 [‐1.31, ‐0.70] |
| 6 Fasting plasma glucose‐ total‐ random effect model | 11 | 4868 | Mean Difference (IV, Random, 95% CI) | ‐1.03 [‐1.66, ‐0.41] |
| 7 Percent of participating experiencing hypoglycemia‐ random effect model | 20 | Odds Ratio (M‐H, Random, 95% CI) | Subtotals only | |
| 7.1 Total episodes | 16 | 6131 | Odds Ratio (M‐H, Random, 95% CI) | 0.97 [0.79, 1.19] |
| 7.2 Severe episodes | 17 | 5827 | Odds Ratio (M‐H, Random, 95% CI) | 0.73 [0.61, 0.87] |
| 7.3 Nocturnal episodes | 13 | 5406 | Odds Ratio (M‐H, Random, 95% CI) | 0.67 [0.53, 0.84] |
| 8 Hypoglycemic events per 100 patient's days‐ random effect model | 19 | Mean Difference (IV, Random, 95% CI) | Subtotals only | |
| 8.1 Total episodes | 15 | 4704 | Mean Difference (IV, Random, 95% CI) | ‐2.42 [‐3.53, ‐1.30] |
| 8.2 Severe episodes | 15 | 4564 | Mean Difference (IV, Random, 95% CI) | 0.01 [‐0.04, 0.05] |
| 8.3 Nocturnal episodes | 17 | 4971 | Mean Difference (IV, Random, 95% CI) | ‐1.25 [‐1.63, ‐0.87] |
| 9 Number of serious adverse events‐ random effect model | 14 | 4878 | Odds Ratio (M‐H, Random, 95% CI) | 0.89 [0.65, 1.22] |
| 10 Glycated haemoglobin‐ final values versus change from baseline | 22 | Mean Difference (IV, Fixed, 95% CI) | Subtotals only | |
| 10.1 Short term‐ final value | 3 | 1003 | Mean Difference (IV, Fixed, 95% CI) | ‐0.16 [‐0.28, ‐0.04] |
| 10.2 Short term‐ change from baseline | 1 | 256 | Mean Difference (IV, Fixed, 95% CI) | 0.0 [‐0.12, 0.12] |
| 10.3 Intermediate term‐ final value | 10 | 2724 | Mean Difference (IV, Fixed, 95% CI) | ‐0.17 [‐0.23, ‐0.10] |
| 10.4 Long term‐ final value | 6 | 1834 | Mean Difference (IV, Fixed, 95% CI) | ‐0.08 [‐0.20, 0.03] |
| 10.5 Long term‐ change from baseline | 3 | 1468 | Mean Difference (IV, Fixed, 95% CI) | 0.07 [‐0.02, 0.16] |
| 11 Fasting blood glucose‐total‐ final values versus change from baseline | 17 | 5409 | Mean Difference (IV, Fixed, 95% CI) | ‐0.86 [1.00, ‐0.72] |
| 11.1 Fasting blood glucose‐total‐ final values | 13 | 3816 | Mean Difference (IV, Fixed, 95% CI) | ‐1.01 [‐1.19, ‐0.84] |
| 11.2 Fasting blood glucose‐total‐ change from baseline | 4 | 1593 | Mean Difference (IV, Fixed, 95% CI) | ‐0.60 [‐0.82, ‐0.37] |
| 12 Fasting plasma glucose‐ total‐ final values versus change from baseline | 11 | 4868 | Mean Difference (IV, Fixed, 95% CI) | ‐0.63 [‐0.86, ‐0.40] |
| 12.1 Fasting plasma glucose‐ total‐ final values | 9 | 3749 | Mean Difference (IV, Fixed, 95% CI) | ‐0.64 [‐0.89, ‐0.40] |
| 12.2 Fasting plasma glucose‐ total‐ change from baseline | 2 | 1119 | Mean Difference (IV, Fixed, 95% CI) | ‐0.53 [‐1.20, 0.13] |
| 13 Glycated haemoglobin‐ long acting type | 22 | 6666 | Mean Difference (IV, Fixed, 95% CI) | ‐0.08 [‐0.12, ‐0.04] |
| 13.1 Glargine | 12 | 3249 | Mean Difference (IV, Fixed, 95% CI) | ‐0.07 [‐0.13, ‐0.01] |
| 13.2 Detemir | 7 | 3095 | Mean Difference (IV, Fixed, 95% CI) | ‐0.11 [‐0.19, ‐0.04] |
| 13.3 Ultralente | 3 | 322 | Mean Difference (IV, Fixed, 95% CI) | 0.08 [‐0.17, 0.32] |
| 14 Mean daily self measured blood glucose (SMBG) average (7‐8 points)‐ long acting type | 6 | 790 | Mean Difference (IV, Fixed, 95% CI) | ‐0.47 [‐0.58, ‐0.36] |
| 14.1 Glargine | 4 | 540 | Mean Difference (IV, Fixed, 95% CI) | ‐0.49 [‐0.61, ‐0.38] |
| 14.2 Detemir | 1 | 118 | Mean Difference (IV, Fixed, 95% CI) | ‐0.10 [‐0.73, 0.53] |
| 14.3 Ultralente | 1 | 132 | Mean Difference (IV, Fixed, 95% CI) | 0.40 [‐0.43, 1.23] |
| 15 Fasting blood glucose‐total‐ long acting type | 17 | 5409 | Mean Difference (IV, Fixed, 95% CI) | ‐0.86 [1.00, ‐0.72] |
| 15.1 Glargine | 9 | 2963 | Mean Difference (IV, Fixed, 95% CI) | ‐0.82 [‐0.99, ‐0.65] |
| 15.2 Detemir | 6 | 2302 | Mean Difference (IV, Fixed, 95% CI) | ‐0.90 [‐1.15, ‐0.64] |
| 15.3 Ultralente | 2 | 144 | Mean Difference (IV, Fixed, 95% CI) | ‐2.17 [‐3.42, ‐0.91] |
| 16 Fasting plasma glucose‐ total‐ long acting type | 11 | 4868 | Mean Difference (IV, Fixed, 95% CI) | ‐0.63 [‐0.86, ‐0.40] |
| 16.1 Glargine | 6 | 2377 | Mean Difference (IV, Fixed, 95% CI) | ‐0.45 [‐0.73, ‐0.16] |
| 16.2 Detemir | 5 | 2491 | Mean Difference (IV, Fixed, 95% CI) | ‐0.94 [‐1.31, ‐0.57] |
| 17 Percent of participating experiencing hypoglycemia‐ long acting type | 20 | Odds Ratio (M‐H, Fixed, 95% CI) | Subtotals only | |
| 17.1 Glargine‐ total episodes | 8 | 2918 | Odds Ratio (M‐H, Fixed, 95% CI) | 0.96 [0.79, 1.17] |
| 17.2 Glargine‐ severe episodes | 10 | 2871 | Odds Ratio (M‐H, Fixed, 95% CI) | 0.76 [0.58, 0.98] |
| 17.3 Glargine‐ nocturnal episodes | 6 | 2311 | Odds Ratio (M‐H, Fixed, 95% CI) | 0.84 [0.70, 1.00] |
| 17.4 Detemir‐ total episodes | 8 | 3213 | Odds Ratio (M‐H, Fixed, 95% CI) | 0.87 [0.69, 1.11] |
| 17.5 Detemir‐ severe episodes | 7 | 2956 | Odds Ratio (M‐H, Fixed, 95% CI) | 0.70 [0.54, 0.90] |
| 17.6 Detemir‐ nocturnal episodes | 7 | 3095 | Odds Ratio (M‐H, Fixed, 95% CI) | 0.61 [0.52, 0.72] |
| 18 Number of serious adverse events‐ long acting type | 14 | 4878 | Odds Ratio (M‐H, Fixed, 95% CI) | 0.89 [0.66, 1.21] |
| 18.1 Glargine | 8 | 2347 | Odds Ratio (M‐H, Fixed, 95% CI) | 0.69 [0.46, 1.04] |
| 18.2 Detemir | 6 | 2531 | Odds Ratio (M‐H, Fixed, 95% CI) | 1.27 [0.78, 2.05] |
| 19 Hypoglycemic events per 100 patient's days‐ long acting type | 19 | Mean Difference (IV, Fixed, 95% CI) | Subtotals only | |
| 19.1 Glargine‐ total episodes | 7 | 1675 | Mean Difference (IV, Fixed, 95% CI) | ‐0.41 [‐0.54, ‐0.27] |
| 19.2 Glargine‐ severe episodes | 7 | 1614 | Mean Difference (IV, Fixed, 95% CI) | ‐0.00 [‐0.02, 0.02] |
| 19.3 Glargine‐ nocturnal episodes | 8 | 1746 | Mean Difference (IV, Fixed, 95% CI) | ‐0.14 [‐0.21, ‐0.07] |
| 19.4 Detemir‐ total episodes | 7 | 2897 | Mean Difference (IV, Fixed, 95% CI) | ‐2.24 [‐2.51, ‐1.97] |
| 19.5 Detemir‐ severe episodes | 6 | 2640 | Mean Difference (IV, Fixed, 95% CI) | ‐0.01 [‐0.04, 0.02] |
| 19.6 Detemir‐ nocturnal episodes | 8 | 3213 | Mean Difference (IV, Fixed, 95% CI) | ‐0.89 [‐0.99, ‐0.79] |
| 19.7 Ultralente‐ total episodes | 1 | 132 | Mean Difference (IV, Fixed, 95% CI) | 0.49 [‐0.36, 1.34] |
| 19.8 Ultralente‐ severe episodes | 2 | 310 | Mean Difference (IV, Fixed, 95% CI) | 0.20 [0.08, 0.32] |
| 19.9 Ultralente‐ nocturnal episodes | 1 | 12 | Mean Difference (IV, Fixed, 95% CI) | ‐2.97 [‐4.49, ‐1.45] |
| 20 Glycated haemoglobin‐ intermediate acting type | 22 | 6666 | Mean Difference (IV, Fixed, 95% CI) | ‐0.08 [‐0.12, ‐0.04] |
| 20.1 NPH | 20 | 6522 | Mean Difference (IV, Fixed, 95% CI) | ‐0.08 [‐0.13, ‐0.04] |
| 20.2 Lente | 2 | 144 | Mean Difference (IV, Fixed, 95% CI) | ‐0.01 [‐0.53, 0.51] |
| 21 Mean daily self measured blood glucose (SMBG) average (7‐8 points)‐ intermediate acting type | 6 | 790 | Mean Difference (IV, Fixed, 95% CI) | ‐0.47 [‐0.58, ‐0.36] |
| 21.1 NPH | 5 | 658 | Mean Difference (IV, Fixed, 95% CI) | ‐0.48 [‐0.59, ‐0.37] |
| 21.2 Lente | 1 | 132 | Mean Difference (IV, Fixed, 95% CI) | 0.40 [‐0.43, 1.23] |
| 22 Fasting blood glucose‐total‐ intermediate acting type | 17 | 5409 | Mean Difference (IV, Fixed, 95% CI) | ‐0.86 [1.00, ‐0.72] |
| 22.1 NPH | 15 | 5265 | Mean Difference (IV, Fixed, 95% CI) | ‐0.84 [‐0.98, ‐0.70] |
| 22.2 Lente | 2 | 144 | Mean Difference (IV, Fixed, 95% CI) | ‐2.17 [‐3.42, ‐0.91] |
| 23 Hypoglycemic events per 100 patient's days‐ intermediate acting type | 19 | Mean Difference (IV, Fixed, 95% CI) | Subtotals only | |
| 23.1 NPH‐ total episodes | 14 | 4572 | Mean Difference (IV, Fixed, 95% CI) | ‐0.80 [‐0.92, ‐0.68] |
| 23.2 NPH‐ severe episodes | 14 | 4432 | Mean Difference (IV, Fixed, 95% CI) | ‐0.00 [‐0.02, 0.01] |
| 23.3 NPH‐ nocturnal episodes | 16 | 4959 | Mean Difference (IV, Fixed, 95% CI) | ‐0.39 [‐0.45, ‐0.33] |
| 23.4 Lente‐ total episodes | 1 | 132 | Mean Difference (IV, Fixed, 95% CI) | 0.49 [‐0.36, 1.34] |
| 23.5 Lente‐ severe episodes | 1 | 132 | Mean Difference (IV, Fixed, 95% CI) | 0.98 [0.66, 1.30] |
| 23.6 Lente‐ nocturnal episodes | 1 | 12 | Mean Difference (IV, Fixed, 95% CI) | ‐2.97 [‐4.49, ‐1.45] |
| 24 Glycated haemoglobin‐ short acting type | 22 | 6666 | Mean Difference (IV, Fixed, 95% CI) | ‐0.08 [‐0.12, ‐0.04] |
| 24.1 Porcine insulin | 1 | 12 | Mean Difference (IV, Fixed, 95% CI) | ‐0.10 [‐1.75, 1.55] |
| 24.2 Human insulin versus insulin analogues | 3 | 757 | Mean Difference (IV, Fixed, 95% CI) | ‐0.29 [‐0.41, ‐0.17] |
| 24.3 Human insulin | 7 | 2936 | Mean Difference (IV, Fixed, 95% CI) | 0.03 [‐0.04, 0.09] |
| 24.4 Insulin analogues | 11 | 2961 | Mean Difference (IV, Fixed, 95% CI) | ‐0.13 [‐0.20, ‐0.06] |
| 25 Fasting blood glucose‐total‐ short acting type | 17 | 5409 | Mean Difference (IV, Fixed, 95% CI) | ‐0.86 [1.00, ‐0.72] |
| 25.1 Human insulin | 8 | 3054 | Mean Difference (IV, Fixed, 95% CI) | ‐0.75 [‐0.92, ‐0.58] |
| 25.2 Insulin analogues | 6 | 2181 | Mean Difference (IV, Fixed, 95% CI) | ‐0.96 [‐1.22, ‐0.70] |
| 25.3 Porcine insulin | 1 | 12 | Mean Difference (IV, Fixed, 95% CI) | ‐4.8 [‐7.78, ‐1.82] |
| 25.4 Human insulin versus insulin analogues | 2 | 162 | Mean Difference (IV, Fixed, 95% CI) | ‐1.26 [‐1.75, ‐0.77] |
| 26 Fasting plasma glucose‐ total‐ short acting type | 11 | 4868 | Mean Difference (IV, Fixed, 95% CI) | ‐0.63 [‐0.86, ‐0.40] |
| 26.1 Human insulin | 5 | 2455 | Mean Difference (IV, Fixed, 95% CI) | ‐1.13 [‐1.54, ‐0.72] |
| 26.2 Insulin analogues | 4 | 1768 | Mean Difference (IV, Fixed, 95% CI) | ‐1.62 [‐2.14, ‐1.11] |
| 26.3 Human insulin versus insulin analogues | 2 | 645 | Mean Difference (IV, Fixed, 95% CI) | 0.07 [‐0.26, 0.39] |
| 27 Mean daily self measured blood glucose (SMBG) average (7‐8 points)‐ short acting type | 6 | 790 | Mean Difference (IV, Fixed, 95% CI) | ‐0.47 [‐0.58, ‐0.36] |
| 27.1 Human insulin | 3 | 506 | Mean Difference (IV, Fixed, 95% CI) | 0.15 [‐0.26, 0.56] |
| 27.2 Insulin analogues | 2 | 172 | Mean Difference (IV, Fixed, 95% CI) | ‐0.5 [‐0.61, ‐0.39] |
| 27.3 Human insulin versus insulin analogues | 1 | 112 | Mean Difference (IV, Fixed, 95% CI) | ‐1.90 [‐3.01, ‐0.79] |
| 28 Percent of participating experiencing hypoglycemia‐ short acting type | 20 | Odds Ratio (M‐H, Fixed, 95% CI) | Subtotals only | |
| 28.1 Human insulin versus insulin analogues‐ severe episodes | 3 | 757 | Odds Ratio (M‐H, Fixed, 95% CI) | 0.96 [0.57, 1.62] |
| 28.2 Human insulin versus insulin analogues‐ nocturnal episodes | 2 | 707 | Odds Ratio (M‐H, Fixed, 95% CI) | 0.46 [0.34, 0.63] |
| 28.3 Human insulin‐ total episodes | 7 | 2925 | Odds Ratio (M‐H, Fixed, 95% CI) | 0.98 [0.80, 1.19] |
| 28.4 Human insulin‐ severe episodes | 6 | 2669 | Odds Ratio (M‐H, Fixed, 95% CI) | 0.68 [0.52, 0.89] |
| 28.5 Human insulin‐ nocturnal episodes | 5 | 2821 | Odds Ratio (M‐H, Fixed, 95% CI) | 0.87 [0.74, 1.03] |
| 28.6 Insulin analogues‐ total episodes | 10 | 3953 | Odds Ratio (M‐H, Fixed, 95% CI) | 0.91 [0.74, 1.14] |
| 28.7 Insulin analogues‐ severe episodes | 8 | 2401 | Odds Ratio (M‐H, Fixed, 95% CI) | 0.72 [0.54, 0.96] |
| 28.8 Insulin analogues‐ nocturnal episodes | 7 | 2497 | Odds Ratio (M‐H, Fixed, 95% CI) | 0.75 [0.63, 0.90] |
| 29 Number of serious adverse events‐ short acting type | 14 | 4878 | Odds Ratio (M‐H, Fixed, 95% CI) | 0.89 [0.66, 1.21] |
| 29.1 Human insulin | 7 | 2925 | Odds Ratio (M‐H, Fixed, 95% CI) | 0.73 [0.49, 1.09] |
| 29.2 Insulin analogues | 4 | 1196 | Odds Ratio (M‐H, Fixed, 95% CI) | 1.18 [0.64, 2.17] |
| 29.3 Human insulin versus insulin analogues | 3 | 757 | Odds Ratio (M‐H, Fixed, 95% CI) | 1.16 [0.54, 2.51] |
| 30 Hypoglycemic events per 100 patient's days‐ short acting type | 18 | Mean Difference (IV, Fixed, 95% CI) | Subtotals only | |
| 30.1 Human insulin‐ total episodes | 4 | 1531 | Mean Difference (IV, Fixed, 95% CI) | ‐0.42 [‐0.56, ‐0.28] |
| 30.2 Human insulin‐ severe episodes | 4 | 1531 | Mean Difference (IV, Fixed, 95% CI) | ‐0.01 [‐0.03, 0.02] |
| 30.3 Human insulin‐ nocturnal episodes | 3 | 1399 | Mean Difference (IV, Fixed, 95% CI) | ‐0.17 [‐0.25, ‐0.10] |
| 30.4 Insulin analogues‐ total episodes | 8 | 2416 | Mean Difference (IV, Fixed, 95% CI) | ‐2.07 [‐2.38, ‐1.75] |
| 30.5 Insulin analogues‐ severe episodes | 9 | 2388 | Mean Difference (IV, Fixed, 95% CI) | 0.01 [‐0.01, 0.04] |
| 30.6 Insulin analogues‐ nocturnal episodes | 10 | 2803 | Mean Difference (IV, Fixed, 95% CI) | ‐0.63 [‐0.74, ‐0.52] |
| 30.7 Human insulin versus insulin analogues‐ total episodes | 3 | 757 | Mean Difference (IV, Fixed, 95% CI) | ‐1.61 [‐2.02, ‐1.19] |
| 30.8 Human insulin versus insulin analogues‐ severe episodes | 2 | 645 | Mean Difference (IV, Fixed, 95% CI) | ‐0.02 [‐0.07, 0.03] |
| 30.9 Human insulin versus insulin analogues‐ nocturnal episodes | 3 | 757 | Mean Difference (IV, Fixed, 95% CI) | ‐0.94 [‐1.10, ‐0.77] |
| 31 Glycated haemoglobin‐ number of basal doses (long acting) | 22 | 6666 | Mean Difference (IV, Fixed, 95% CI) | ‐0.08 [‐0.12, ‐0.04] |
| 31.1 Once daily | 13 | 3996 | Mean Difference (IV, Fixed, 95% CI) | ‐0.07 [‐0.13, ‐0.02] |
| 31.2 Twice or more daily | 7 | 2145 | Mean Difference (IV, Fixed, 95% CI) | ‐0.13 [‐0.21, ‐0.05] |
| 31.3 According to glucose control | 2 | 525 | Mean Difference (IV, Fixed, 95% CI) | 0.10 [‐0.10, 0.30] |
| 32 Fasting blood glucose‐total‐ number of basal doses (long acting) | 17 | 5409 | Mean Difference (IV, Fixed, 95% CI) | ‐0.86 [1.00, ‐0.72] |
| 32.1 Once daily | 11 | 3828 | Mean Difference (IV, Fixed, 95% CI) | ‐0.83 [‐0.98, ‐0.68] |
| 32.2 Twice or more daily | 5 | 1234 | Mean Difference (IV, Fixed, 95% CI) | ‐0.99 [‐1.38, ‐0.60] |
| 32.3 According to glucose control | 1 | 347 | Mean Difference (IV, Fixed, 95% CI) | ‐1.20 [‐2.18, ‐0.22] |
| 33 Fasting plasma glucose‐ total‐ number of basal doses (long acting) | 11 | 4868 | Mean Difference (IV, Fixed, 95% CI) | ‐0.63 [‐0.86, ‐0.40] |
| 33.1 Once daily | 7 | 3124 | Mean Difference (IV, Fixed, 95% CI) | ‐0.54 [‐0.81, ‐0.27] |
| 33.2 Twice or more daily | 4 | 1744 | Mean Difference (IV, Fixed, 95% CI) | ‐0.87 [‐1.31, ‐0.43] |
| 34 Mean daily self measured blood glucose (SMBG) average (7‐8 points)‐ number of basal doses (long acting) | 6 | 790 | Mean Difference (IV, Fixed, 95% CI) | ‐0.47 [‐0.58, ‐0.36] |
| 34.1 Once daily | 4 | 607 | Mean Difference (IV, Fixed, 95% CI) | ‐0.35 [‐0.67, ‐0.03] |
| 34.2 Twice or more daily | 2 | 183 | Mean Difference (IV, Fixed, 95% CI) | ‐0.48 [‐0.60, ‐0.37] |
| 35 Percent of participating experiencing hypoglycemia‐ number of basal doses (long acting) | 20 | Odds Ratio (M‐H, Fixed, 95% CI) | Subtotals only | |
| 35.1 Once daily‐ total episodes | 10 | 3783 | Odds Ratio (M‐H, Fixed, 95% CI) | 1.01 [0.84, 1.21] |
| 35.2 Once daily‐ severe episodes | 12 | 3736 | Odds Ratio (M‐H, Fixed, 95% CI) | 0.74 [0.59, 0.94] |
| 35.3 Once daily‐ nocturnal episodes | 7 | 3058 | Odds Ratio (M‐H, Fixed, 95% CI) | 0.86 [0.73, 1.00] |
| 35.4 Twice or more daily‐ total episodes | 5 | 2001 | Odds Ratio (M‐H, Fixed, 95% CI) | 0.78 [0.58, 1.04] |
| 35.5 Twice or more daily‐ severe episodes | 5 | 2491 | Odds Ratio (M‐H, Fixed, 95% CI) | 0.69 [0.52, 0.93] |
| 35.6 Twice or more daily‐ nocturnal episodes | 4 | 1576 | Odds Ratio (M‐H, Fixed, 95% CI) | 0.53 [0.42, 0.65] |
| 35.7 According to glucose control‐ total episodes | 1 | 347 | Odds Ratio (M‐H, Fixed, 95% CI) | 0.44 [0.09, 2.06] |
| 35.8 According to glucose control‐ severe episodes | 1 | 347 | Odds Ratio (M‐H, Fixed, 95% CI) | 0.76 [0.43, 1.35] |
| 35.9 According to glucose control‐ severe episodes | 1 | 347 | Odds Ratio (M‐H, Fixed, 95% CI) | 0.42 [0.22, 0.78] |
| 36 Number of serious adverse events‐ number of basal doses (long acting) | 15 | 5303 | Odds Ratio (M‐H, Fixed, 95% CI) | 0.81 [0.63, 1.04] |
| 36.1 Once daily | 10 | 3212 | Odds Ratio (M‐H, Fixed, 95% CI) | 0.75 [0.52, 1.09] |
| 36.2 Twice or more daily | 4 | 1744 | Odds Ratio (M‐H, Fixed, 95% CI) | 0.86 [0.60, 1.23] |
| 36.3 ACcording to glucose control | 1 | 347 | Odds Ratio (M‐H, Fixed, 95% CI) | 0.99 [0.18, 5.49] |
| 37 Hypoglycemic events per 100 patient's days‐ number of basal doses (long acting) | 19 | Mean Difference (IV, Fixed, 95% CI) | Subtotals only | |
| 37.1 Once daily‐ total episodes | 9 | 2540 | Mean Difference (IV, Fixed, 95% CI) | ‐0.45 [‐0.58, ‐0.31] |
| 37.2 Once daily‐ severe episodes | 9 | 2479 | Mean Difference (IV, Fixed, 95% CI) | ‐0.00 [‐0.02, 0.02] |
| 37.3 Once daily‐ nocturnal episodes | 10 | 2611 | Mean Difference (IV, Fixed, 95% CI) | ‐0.20 [‐0.26, ‐0.13] |
| 37.4 Twice or more daily‐ total episodes | 5 | 1817 | Mean Difference (IV, Fixed, 95% CI) | ‐2.22 [‐2.51, ‐1.92] |
| 37.5 Twice or more daily‐ severe episodes | 4 | 1560 | Mean Difference (IV, Fixed, 95% CI) | 0.00 [‐0.04, 0.04] |
| 37.6 Twice or more daily‐ nocturnal episodes | 6 | 2013 | Mean Difference (IV, Fixed, 95% CI) | ‐0.97 [‐1.09, ‐0.85] |
| 37.7 According to glucose control‐ total episodes | 1 | 347 | Mean Difference (IV, Fixed, 95% CI) | ‐3.30 [‐4.53, ‐2.07] |
| 37.8 According to glucose control‐ severe episodes | 2 | 525 | Mean Difference (IV, Fixed, 95% CI) | 0.02 [‐0.07, 0.12] |
| 37.9 According to glucose control‐ nocturnal episodes | 1 | 347 | Mean Difference (IV, Fixed, 95% CI) | ‐1.11 [‐1.58, ‐0.64] |
| 38 Glycated haemoglobin‐ number of basal doses (intermediate acting) | 22 | 6666 | Mean Difference (IV, Fixed, 95% CI) | ‐0.08 [‐0.12, ‐0.04] |
| 38.1 Once daily | 3 | 922 | Mean Difference (IV, Fixed, 95% CI) | ‐0.15 [‐0.32, 0.03] |
| 38.2 Twice or more daily | 10 | 2431 | Mean Difference (IV, Fixed, 95% CI) | ‐0.19 [‐0.25, ‐0.12] |
| 38.3 According to glucose control | 9 | 3313 | Mean Difference (IV, Fixed, 95% CI) | 0.01 [‐0.05, 0.07] |
| 39 Fasting blood glucose‐total‐ number of basal doses (intermediate acting) | 17 | 5409 | Mean Difference (IV, Fixed, 95% CI) | ‐0.86 [1.00, ‐0.72] |
| 39.1 Once daily | 4 | 1040 | Mean Difference (IV, Fixed, 95% CI) | ‐0.97 [‐1.26, ‐0.68] |
| 39.2 Twice or more daily | 5 | 1234 | Mean Difference (IV, Fixed, 95% CI) | ‐0.99 [‐1.38, ‐0.60] |
| 39.3 According to glucose control | 8 | 3135 | Mean Difference (IV, Fixed, 95% CI) | ‐0.79 [‐0.96, ‐0.62] |
| 40 Fasting plasma glucose‐ total‐ number of basal doses (intermediate acting) | 11 | 4868 | Mean Difference (IV, Fixed, 95% CI) | ‐0.63 [‐0.86, ‐0.40] |
| 40.1 Once daily | 2 | 797 | Mean Difference (IV, Fixed, 95% CI) | 0.03 [‐0.32, 0.38] |
| 40.2 Twice or more daily | 4 | 1744 | Mean Difference (IV, Fixed, 95% CI) | ‐0.87 [‐1.31, ‐0.43] |
| 40.3 According to glucose control | 5 | 2327 | Mean Difference (IV, Fixed, 95% CI) | ‐1.32 [‐1.73, ‐0.91] |
| 41 Mean daily self measured blood glucose (SMBG) average (7‐8 points)‐ number of basal doses (intermediate acting | 6 | 790 | Mean Difference (IV, Fixed, 95% CI) | ‐0.47 [‐0.58, ‐0.36] |
| 41.1 Once daily | 1 | 118 | Mean Difference (IV, Fixed, 95% CI) | ‐0.10 [‐0.73, 0.53] |
| 41.2 Twice or more daily | 3 | 304 | Mean Difference (IV, Fixed, 95% CI) | ‐0.48 [‐0.60, ‐0.37] |
| 41.3 According to blood glucose | 2 | 368 | Mean Difference (IV, Fixed, 95% CI) | ‐0.35 [‐0.95, 0.25] |
| 42 Percent of participating experiencing hypoglycemia‐ number of basal doses (intermediate acting) | 20 | Odds Ratio (M‐H, Fixed, 95% CI) | Subtotals only | |
| 42.1 Once daily‐ total episodes | 3 | 990 | Odds Ratio (M‐H, Fixed, 95% CI) | 1.42 [0.90, 2.22] |
| 42.2 Once daily‐ severe episodes | 3 | 915 | Odds Ratio (M‐H, Fixed, 95% CI) | 0.68 [0.41, 1.15] |
| 42.3 Once daily‐ nocturnal episodes | 2 | 872 | Odds Ratio (M‐H, Fixed, 95% CI) | 0.91 [0.67, 1.24] |
| 42.4 Twice or more daily‐ total episodes | 6 | 2115 | Odds Ratio (M‐H, Fixed, 95% CI) | 0.81 [0.61, 1.07] |
| 42.5 Twice or more daily‐ severe episodes | 7 | 2030 | Odds Ratio (M‐H, Fixed, 95% CI) | 0.69 [0.50, 0.96] |
| 42.6 Twice or more daily‐ nocturnal episodes | 4 | 1744 | Odds Ratio (M‐H, Fixed, 95% CI) | 0.55 [0.45, 0.69] |
| 42.7 According to blood glucose‐ total episodes | 7 | 3026 | Odds Ratio (M‐H, Fixed, 95% CI) | 0.92 [0.75, 1.12] |
| 42.8 According to blood glucose‐ severe episodes | 7 | 2882 | Odds Ratio (M‐H, Fixed, 95% CI) | 0.76 [0.59, 0.96] |
| 42.9 According to blood glucose‐ nocturnal episodes | 7 | 2790 | Odds Ratio (M‐H, Fixed, 95% CI) | 0.76 [0.64, 0.89] |
| 43 Number of serious adverse events‐ number of basal doses (intermediate acting) | 14 | 4878 | Odds Ratio (M‐H, Fixed, 95% CI) | 0.89 [0.66, 1.21] |
| 43.1 Once daily | 4 | 1040 | Odds Ratio (M‐H, Fixed, 95% CI) | 1.24 [0.56, 2.74] |
| 43.2 Twice or more daily | 3 | 1319 | Odds Ratio (M‐H, Fixed, 95% CI) | 1.31 [0.74, 2.33] |
| 43.3 According to glucose control | 7 | 2519 | Odds Ratio (M‐H, Fixed, 95% CI) | 0.67 [0.44, 1.00] |
| 44 Hypoglycemic events per 100 patient's days‐ number of basal doses (intermediate acting) | 19 | Mean Difference (IV, Fixed, 95% CI) | Subtotals only | |
| 44.1 Once daily‐ total episodes | 4 | 1040 | Mean Difference (IV, Fixed, 95% CI) | ‐0.49 [‐0.97, ‐0.01] |
| 44.2 Once daily‐ severe episodes | 4 | 1040 | Mean Difference (IV, Fixed, 95% CI) | ‐0.00 [‐0.05, 0.04] |
| 44.3 Once daily‐ nocturnal episodes | 4 | 1040 | Mean Difference (IV, Fixed, 95% CI) | ‐0.60 [‐0.79, ‐0.41] |
| 44.4 Twice or more daily‐ total episodes | 7 | 2052 | Mean Difference (IV, Fixed, 95% CI) | ‐2.30 [‐2.58, ‐2.03] |
| 44.5 Twice or more daily‐ severe episodes | 7 | 1846 | Mean Difference (IV, Fixed, 95% CI) | 0.00 [‐0.03, 0.03] |
| 44.6 Twice or more daily‐ nocturnal episodes | 9 | 2319 | Mean Difference (IV, Fixed, 95% CI) | ‐0.86 [‐0.97, ‐0.76] |
| 44.7 According to glucose control‐ total episodes | 4 | 1612 | Mean Difference (IV, Fixed, 95% CI) | ‐0.40 [‐0.54, ‐0.26] |
| 44.8 According to glucose control‐ severe episodes | 4 | 1678 | Mean Difference (IV, Fixed, 95% CI) | ‐0.00 [‐0.02, 0.02] |
| 44.9 According to glucose control‐ nocturnal episodes | 4 | 1612 | Mean Difference (IV, Fixed, 95% CI) | ‐0.12 [‐0.19, ‐0.04] |
| 45 Glycated haemoglobin‐ diabetes status | 21 | 6633 | Mean Difference (IV, Fixed, 95% CI) | ‐0.08 [‐0.13, ‐0.04] |
| 45.1 Fare | 6 | 2167 | Mean Difference (IV, Fixed, 95% CI) | ‐0.04 [‐0.11, 0.03] |
| 45.2 Intermediate | 14 | 4138 | Mean Difference (IV, Fixed, 95% CI) | ‐0.11 [‐0.17, ‐0.05] |
| 45.3 Poor | 2 | 328 | Mean Difference (IV, Fixed, 95% CI) | ‐0.06 [‐0.38, 0.25] |
| 46 Fasting blood glucose‐total‐ diabetes status | 16 | 5060 | Mean Difference (IV, Fixed, 95% CI) | ‐0.77 [‐0.91, ‐0.63] |
| 46.1 Fare | 4 | 1856 | Mean Difference (IV, Fixed, 95% CI) | ‐0.48 [‐0.69, ‐0.28] |
| 46.2 Intermediate | 11 | 3192 | Mean Difference (IV, Fixed, 95% CI) | ‐1.01 [‐1.21, ‐0.81] |
| 46.3 Poor | 1 | 12 | Mean Difference (IV, Fixed, 95% CI) | ‐4.8 [‐7.78, ‐1.82] |
| 47 Fasting plasma glucose‐ total‐ diabetes status | 11 | 4868 | Mean Difference (IV, Fixed, 95% CI) | ‐0.63 [‐0.86, ‐0.40] |
| 47.1 Fare | 3 | 1738 | Mean Difference (IV, Fixed, 95% CI) | ‐1.07 [‐1.56, ‐0.58] |
| 47.2 Intermediate | 7 | 2814 | Mean Difference (IV, Fixed, 95% CI) | ‐0.51 [‐0.76, ‐0.25] |
| 47.3 Poor | 1 | 316 | Mean Difference (IV, Fixed, 95% CI) | 0.0 [0.0, 0.0] |
| 48 Mean daily self measured blood glucose (SMBG) average (7‐8 points)‐ diabetes status | 6 | 790 | Mean Difference (IV, Fixed, 95% CI) | ‐0.47 [‐0.58, ‐0.36] |
| 48.1 Fare | 3 | 290 | Mean Difference (IV, Fixed, 95% CI) | ‐0.49 [‐0.60, ‐0.38] |
| 48.2 Intermediate | 3 | 500 | Mean Difference (IV, Fixed, 95% CI) | ‐0.09 [‐0.58, 0.40] |
| 49 Percent of participating experiencing hypoglycemia‐ diabetes status | 19 | Odds Ratio (M‐H, Fixed, 95% CI) | Subtotals only | |
| 49.1 Fare‐ total episodes | 5 | 2113 | Odds Ratio (M‐H, Fixed, 95% CI) | 0.94 [0.75, 1.19] |
| 49.2 Fare‐ severe episodes | 6 | 2028 | Odds Ratio (M‐H, Fixed, 95% CI) | 0.69 [0.49, 0.98] |
| 49.3 Fare‐ nocturnal episodes | 4 | 1995 | Odds Ratio (M‐H, Fixed, 95% CI) | 0.88 [0.73, 1.07] |
| 49.4 Intermediate‐ total episodes | 9 | 3353 | Odds Ratio (M‐H, Fixed, 95% CI) | 0.90 [0.72, 1.13] |
| 49.5 Intermediate‐ severe episodes | 9 | 3134 | Odds Ratio (M‐H, Fixed, 95% CI) | 0.77 [0.59, 0.99] |
| 49.6 Intermediate‐ nocturnal episodes | 8 | 3095 | Odds Ratio (M‐H, Fixed, 95% CI) | 0.60 [0.51, 0.70] |
| 49.7 Poor‐ total episodes | 1 | 316 | Odds Ratio (M‐H, Fixed, 95% CI) | 0.97 [0.29, 3.24] |
| 49.8 Poor‐ severe episodes | 1 | 316 | Odds Ratio (M‐H, Fixed, 95% CI) | 0.60 [0.32, 1.10] |
| 49.9 Poor‐ nocturnal episodes | 1 | 316 | Odds Ratio (M‐H, Fixed, 95% CI) | 0.67 [0.33, 1.35] |
| 50 Number of serious adverse events‐ diabetes status | 13 | 4529 | Odds Ratio (M‐H, Fixed, 95% CI) | 1.06 [0.76, 1.49] |
| 50.1 Fare | 3 | 1237 | Odds Ratio (M‐H, Fixed, 95% CI) | 0.97 [0.57, 1.64] |
| 50.2 Intermediate | 9 | 2976 | Odds Ratio (M‐H, Fixed, 95% CI) | 1.25 [0.76, 2.04] |
| 50.3 Poor | 1 | 316 | Odds Ratio (M‐H, Fixed, 95% CI) | 0.77 [0.29, 2.02] |
| 51 Hypoglycemic events per 100 patient's days‐ diabetes status | 19 | Mean Difference (IV, Fixed, 95% CI) | Subtotals only | |
| 51.1 Fare‐ total episodes | 5 | 1649 | Mean Difference (IV, Fixed, 95% CI) | ‐0.55 [‐0.69, ‐0.41] |
| 51.2 Fare‐ severe episodes | 5 | 1443 | Mean Difference (IV, Fixed, 95% CI) | ‐0.01 [‐0.03, 0.02] |
| 51.3 Fare‐ nocturnal episodes | 6 | 1720 | Mean Difference (IV, Fixed, 95% CI) | ‐0.19 [‐0.26, ‐0.12] |
| 51.4 Intermediate‐ total episodes | 10 | 3055 | Mean Difference (IV, Fixed, 95% CI) | ‐1.46 [‐1.71, ‐1.22] |
| 51.5 Intermediate‐ severe episodes | 10 | 3121 | Mean Difference (IV, Fixed, 95% CI) | 0.00 [‐0.02, 0.03] |
| 51.6 Intermediate‐ nocturnal episodes | 9 | 2923 | Mean Difference (IV, Fixed, 95% CI) | ‐0.69 [‐0.78, ‐0.59] |
| 51.7 Poor‐ nocturnal episodes | 2 | 328 | Mean Difference (IV, Fixed, 95% CI) | ‐1.80 [‐2.29, ‐1.32] |
7.1. Analysis.
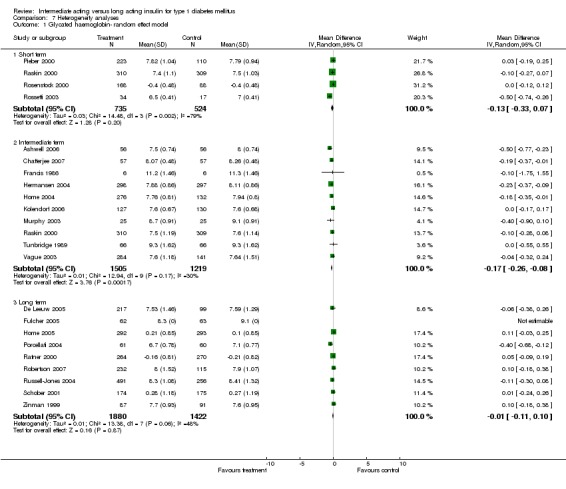
Comparison 7 Heterogeneity analyses, Outcome 1 Glycated haemoglobin‐ random effect model.
7.2. Analysis.
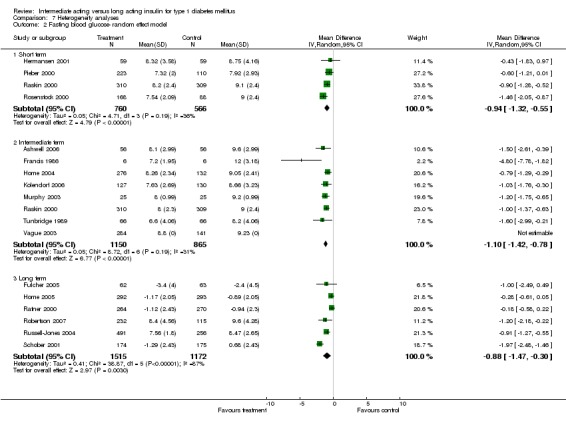
Comparison 7 Heterogeneity analyses, Outcome 2 Fasting blood glucose‐ random effect model.
7.3. Analysis.
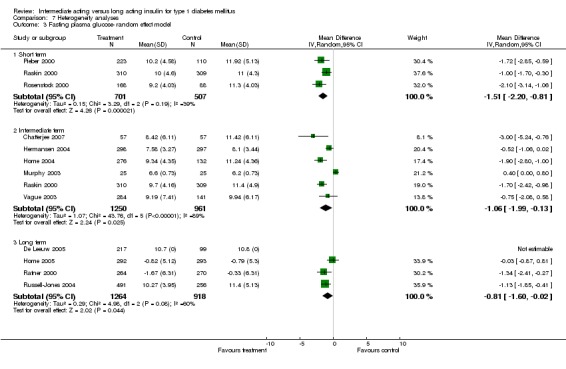
Comparison 7 Heterogeneity analyses, Outcome 3 Fasting plasma glucose‐ random effect model.
7.4. Analysis.
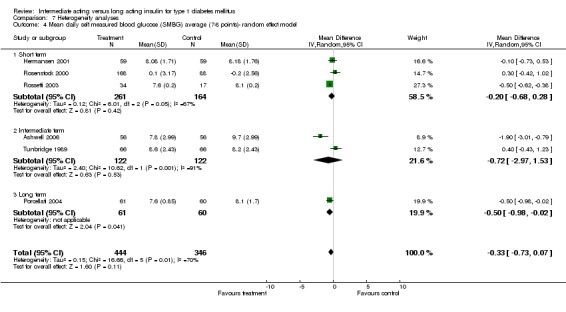
Comparison 7 Heterogeneity analyses, Outcome 4 Mean daily self measured blood glucose (SMBG) average (7‐8 points)‐ random effect model.
7.5. Analysis.
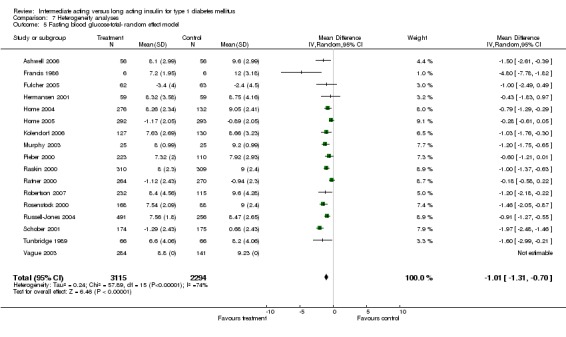
Comparison 7 Heterogeneity analyses, Outcome 5 Fasting blood glucose‐total‐ random effect model.
7.6. Analysis.
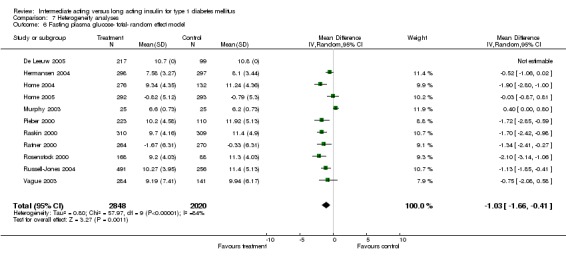
Comparison 7 Heterogeneity analyses, Outcome 6 Fasting plasma glucose‐ total‐ random effect model.
7.7. Analysis.
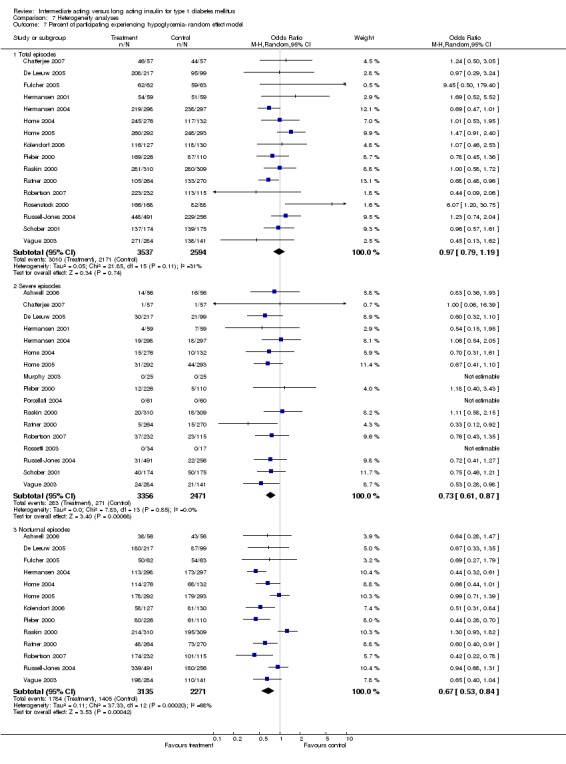
Comparison 7 Heterogeneity analyses, Outcome 7 Percent of participating experiencing hypoglycemia‐ random effect model.
7.8. Analysis.
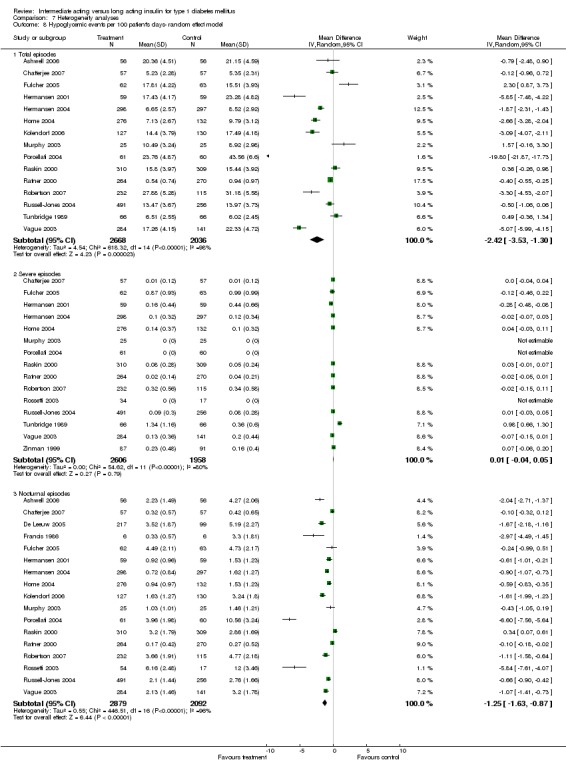
Comparison 7 Heterogeneity analyses, Outcome 8 Hypoglycemic events per 100 patient's days‐ random effect model.
7.9. Analysis.
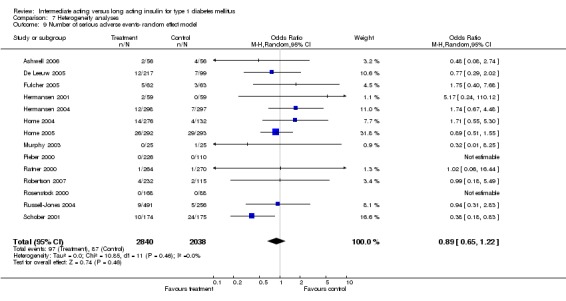
Comparison 7 Heterogeneity analyses, Outcome 9 Number of serious adverse events‐ random effect model.
7.10. Analysis.
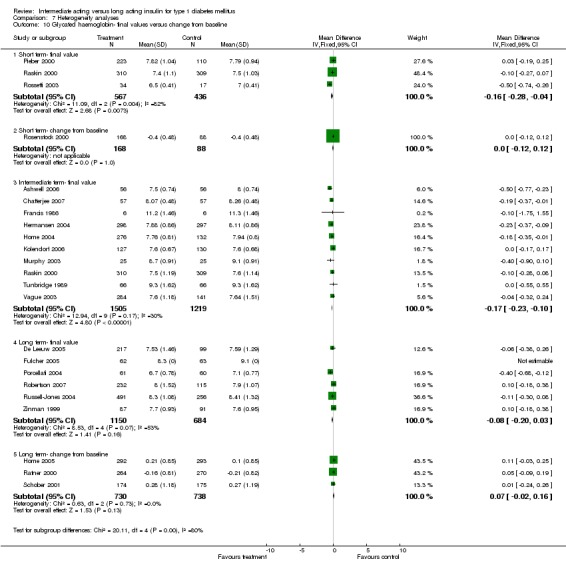
Comparison 7 Heterogeneity analyses, Outcome 10 Glycated haemoglobin‐ final values versus change from baseline.
7.11. Analysis.
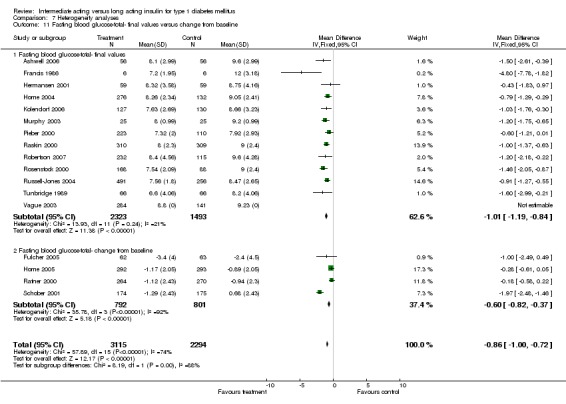
Comparison 7 Heterogeneity analyses, Outcome 11 Fasting blood glucose‐total‐ final values versus change from baseline.
7.12. Analysis.
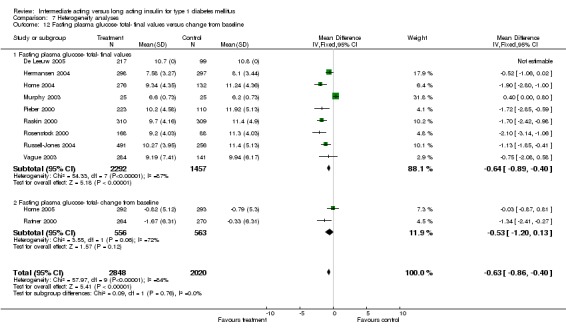
Comparison 7 Heterogeneity analyses, Outcome 12 Fasting plasma glucose‐ total‐ final values versus change from baseline.
7.13. Analysis.
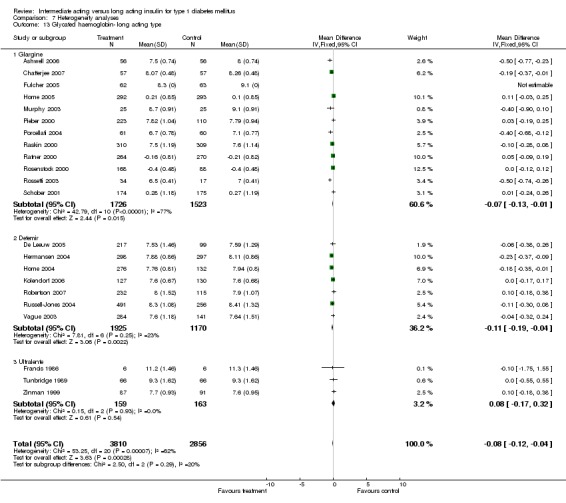
Comparison 7 Heterogeneity analyses, Outcome 13 Glycated haemoglobin‐ long acting type.
7.14. Analysis.
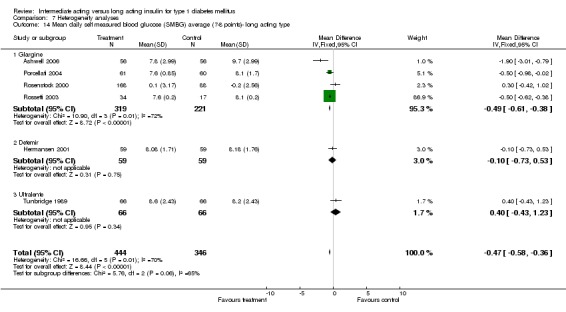
Comparison 7 Heterogeneity analyses, Outcome 14 Mean daily self measured blood glucose (SMBG) average (7‐8 points)‐ long acting type.
7.15. Analysis.
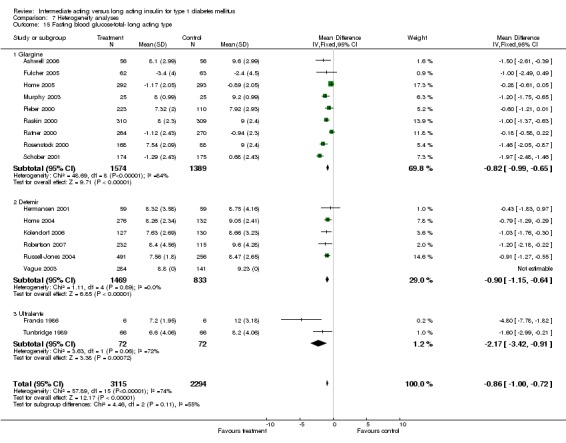
Comparison 7 Heterogeneity analyses, Outcome 15 Fasting blood glucose‐total‐ long acting type.
7.16. Analysis.
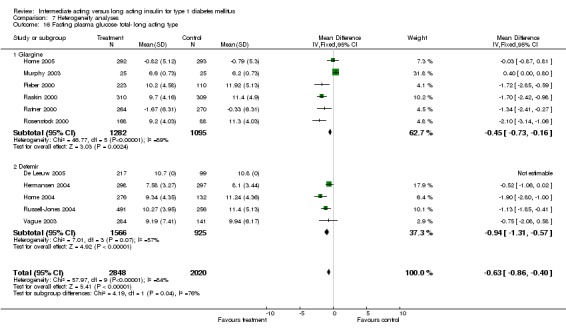
Comparison 7 Heterogeneity analyses, Outcome 16 Fasting plasma glucose‐ total‐ long acting type.
7.17. Analysis.
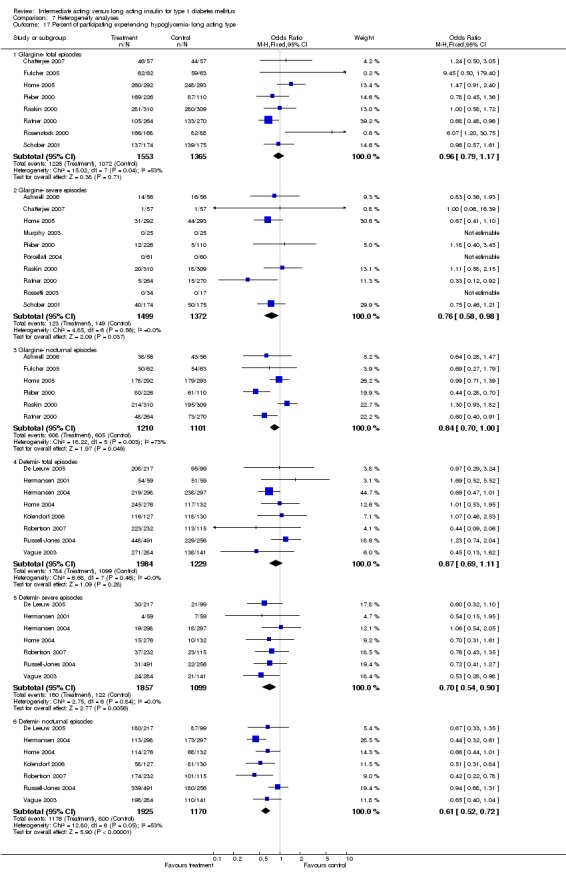
Comparison 7 Heterogeneity analyses, Outcome 17 Percent of participating experiencing hypoglycemia‐ long acting type.
7.18. Analysis.
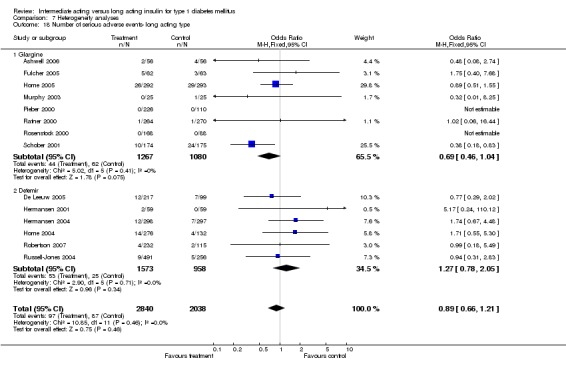
Comparison 7 Heterogeneity analyses, Outcome 18 Number of serious adverse events‐ long acting type.
7.19. Analysis.
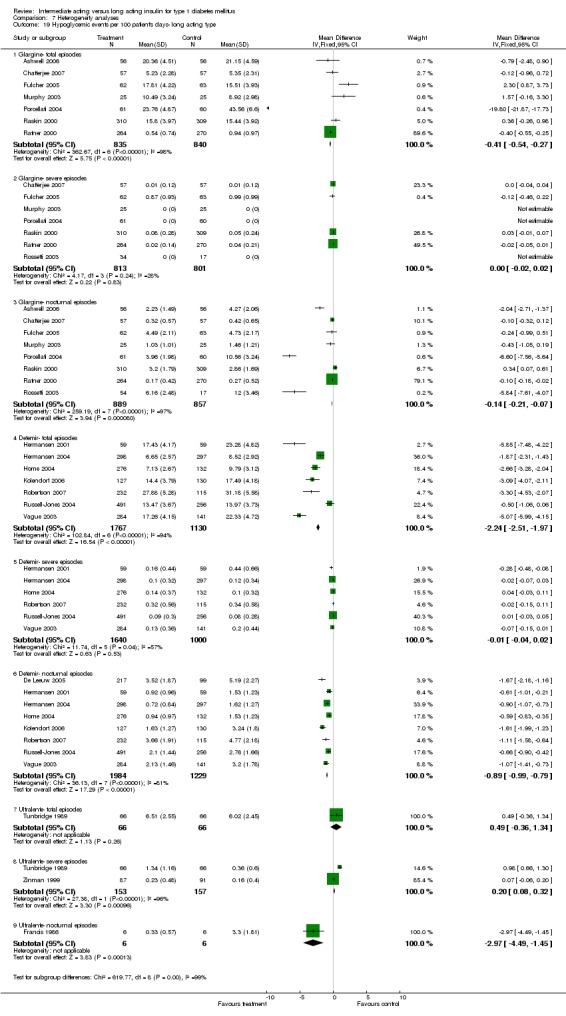
Comparison 7 Heterogeneity analyses, Outcome 19 Hypoglycemic events per 100 patient's days‐ long acting type.
7.20. Analysis.
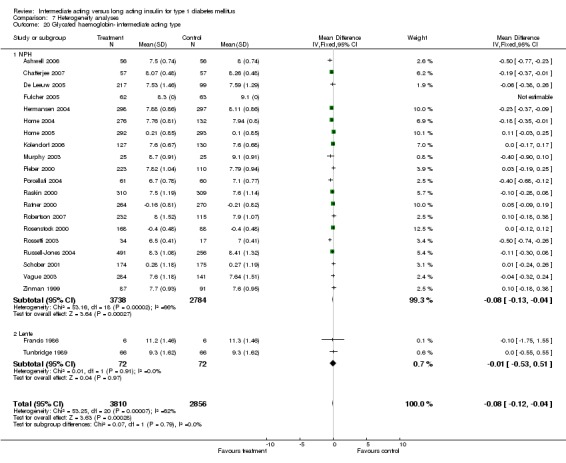
Comparison 7 Heterogeneity analyses, Outcome 20 Glycated haemoglobin‐ intermediate acting type.
7.21. Analysis.
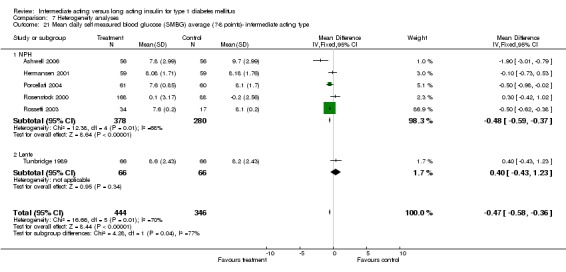
Comparison 7 Heterogeneity analyses, Outcome 21 Mean daily self measured blood glucose (SMBG) average (7‐8 points)‐ intermediate acting type.
7.22. Analysis.
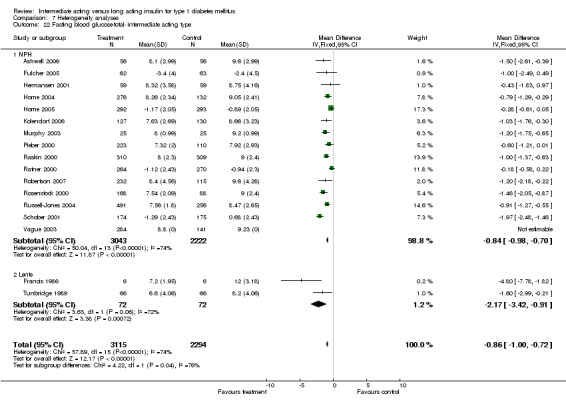
Comparison 7 Heterogeneity analyses, Outcome 22 Fasting blood glucose‐total‐ intermediate acting type.
7.23. Analysis.
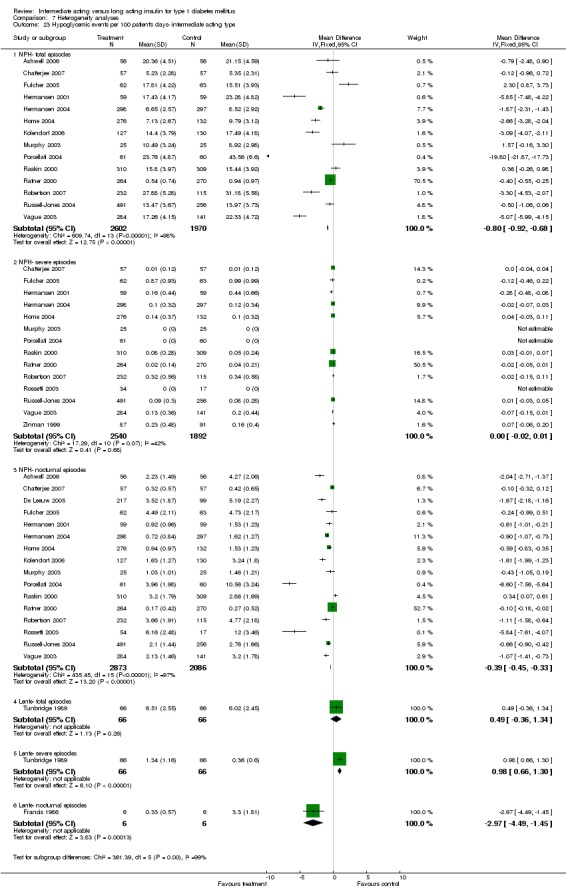
Comparison 7 Heterogeneity analyses, Outcome 23 Hypoglycemic events per 100 patient's days‐ intermediate acting type.
7.24. Analysis.
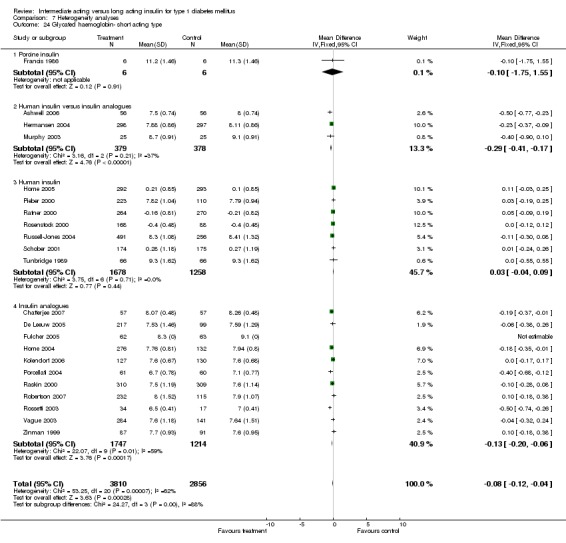
Comparison 7 Heterogeneity analyses, Outcome 24 Glycated haemoglobin‐ short acting type.
7.25. Analysis.
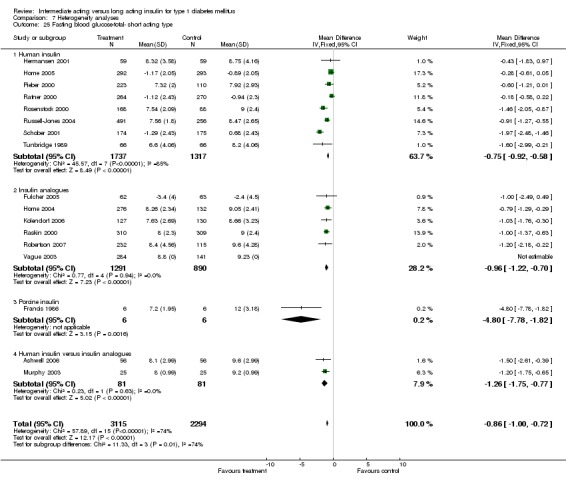
Comparison 7 Heterogeneity analyses, Outcome 25 Fasting blood glucose‐total‐ short acting type.
7.26. Analysis.
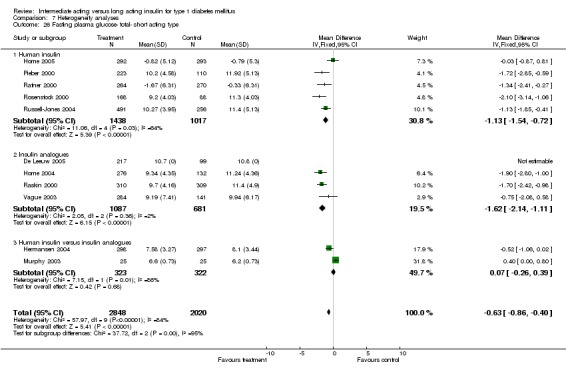
Comparison 7 Heterogeneity analyses, Outcome 26 Fasting plasma glucose‐ total‐ short acting type.
7.27. Analysis.
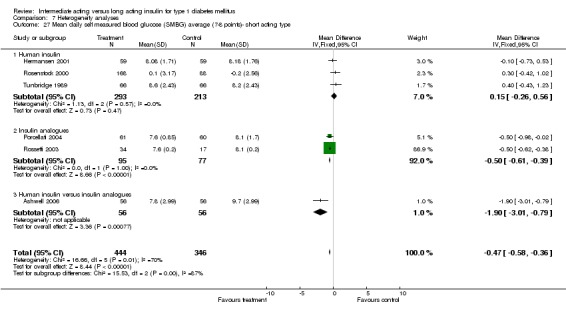
Comparison 7 Heterogeneity analyses, Outcome 27 Mean daily self measured blood glucose (SMBG) average (7‐8 points)‐ short acting type.
7.28. Analysis.
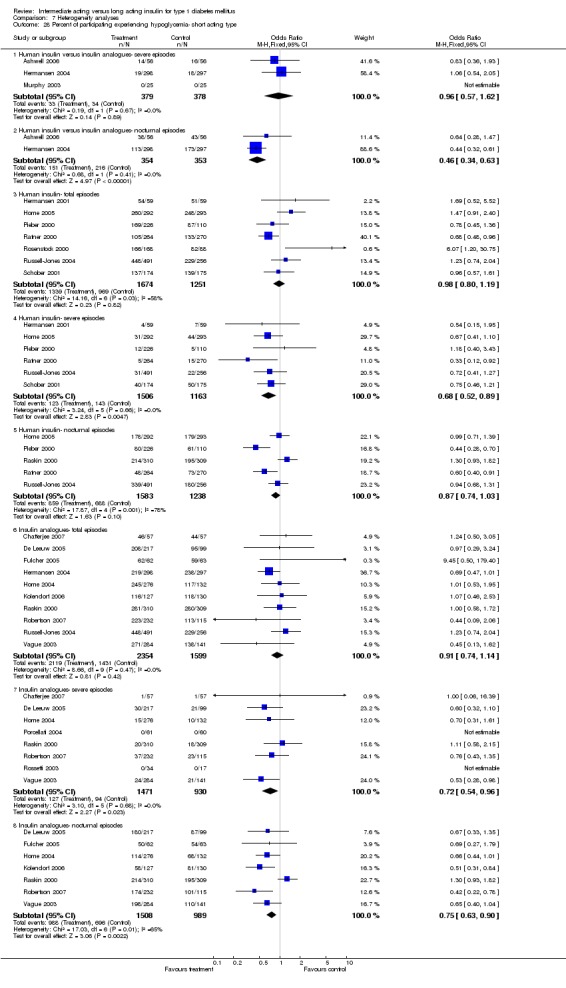
Comparison 7 Heterogeneity analyses, Outcome 28 Percent of participating experiencing hypoglycemia‐ short acting type.
7.29. Analysis.
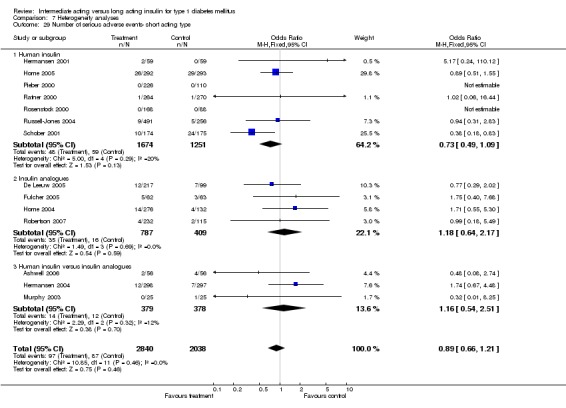
Comparison 7 Heterogeneity analyses, Outcome 29 Number of serious adverse events‐ short acting type.
7.30. Analysis.
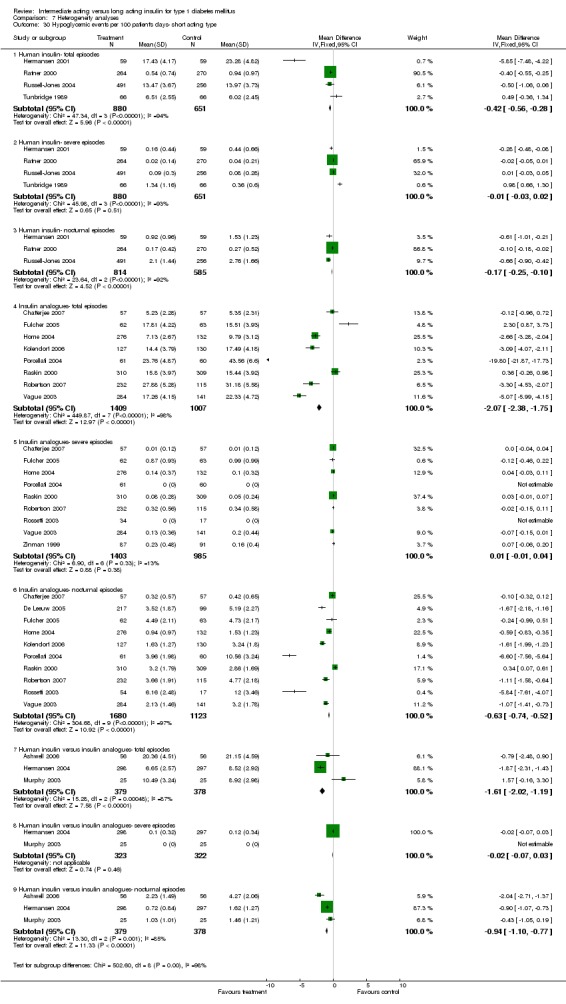
Comparison 7 Heterogeneity analyses, Outcome 30 Hypoglycemic events per 100 patient's days‐ short acting type.
7.31. Analysis.
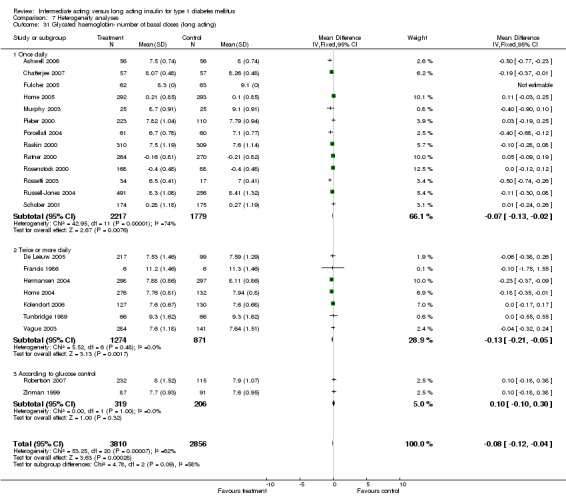
Comparison 7 Heterogeneity analyses, Outcome 31 Glycated haemoglobin‐ number of basal doses (long acting).
7.32. Analysis.
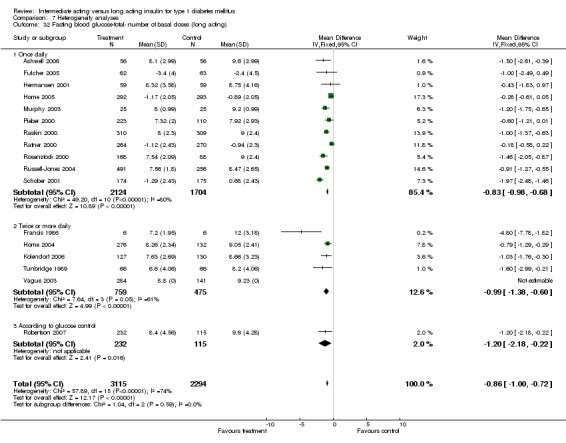
Comparison 7 Heterogeneity analyses, Outcome 32 Fasting blood glucose‐total‐ number of basal doses (long acting).
7.33. Analysis.
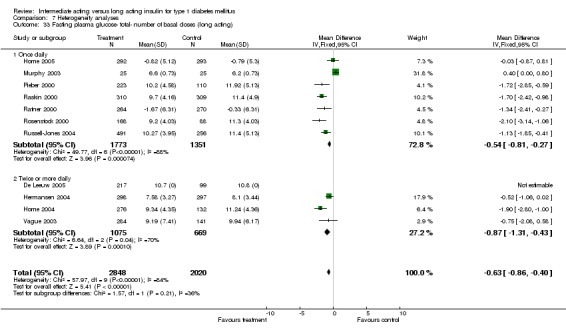
Comparison 7 Heterogeneity analyses, Outcome 33 Fasting plasma glucose‐ total‐ number of basal doses (long acting).
7.34. Analysis.
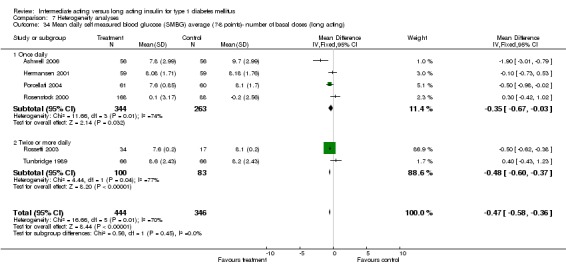
Comparison 7 Heterogeneity analyses, Outcome 34 Mean daily self measured blood glucose (SMBG) average (7‐8 points)‐ number of basal doses (long acting).
7.35. Analysis.
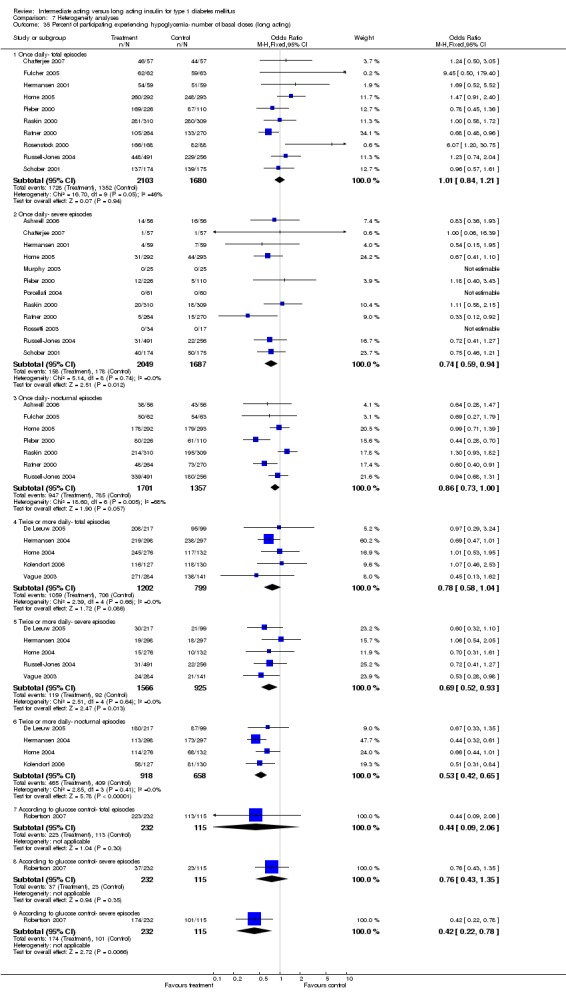
Comparison 7 Heterogeneity analyses, Outcome 35 Percent of participating experiencing hypoglycemia‐ number of basal doses (long acting).
7.36. Analysis.
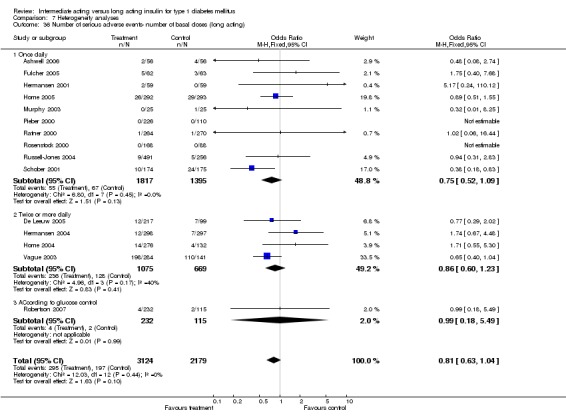
Comparison 7 Heterogeneity analyses, Outcome 36 Number of serious adverse events‐ number of basal doses (long acting).
7.37. Analysis.
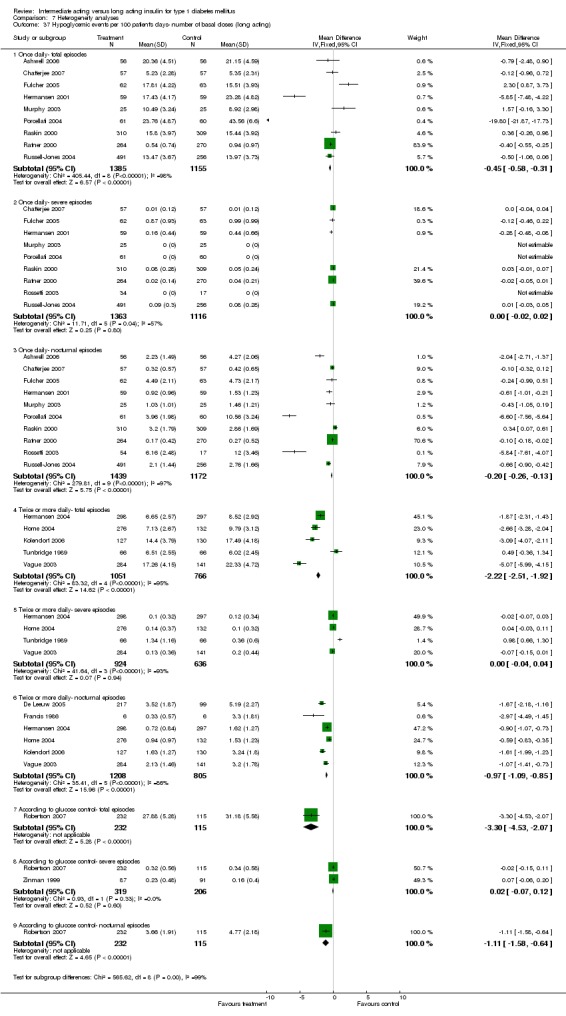
Comparison 7 Heterogeneity analyses, Outcome 37 Hypoglycemic events per 100 patient's days‐ number of basal doses (long acting).
7.38. Analysis.
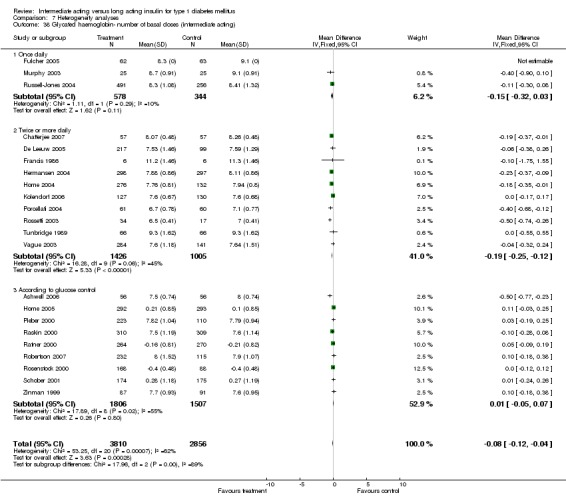
Comparison 7 Heterogeneity analyses, Outcome 38 Glycated haemoglobin‐ number of basal doses (intermediate acting).
7.39. Analysis.
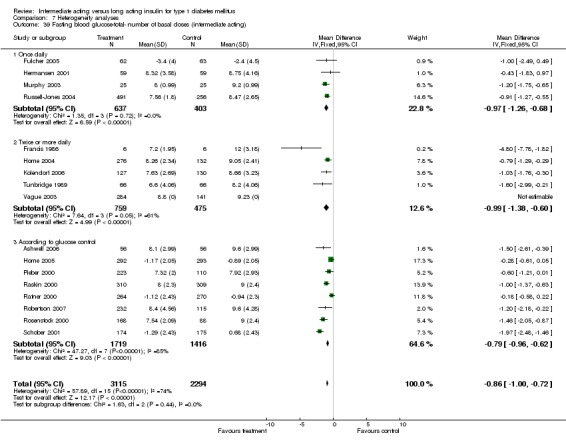
Comparison 7 Heterogeneity analyses, Outcome 39 Fasting blood glucose‐total‐ number of basal doses (intermediate acting).
7.40. Analysis.
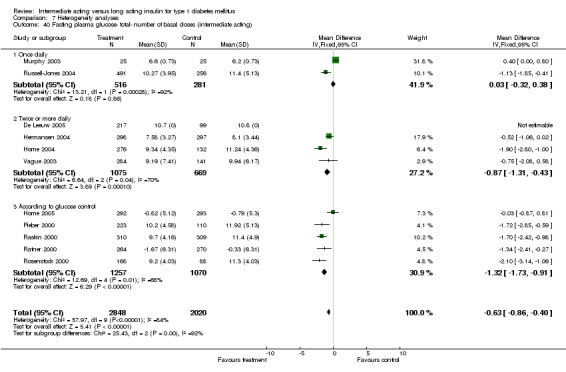
Comparison 7 Heterogeneity analyses, Outcome 40 Fasting plasma glucose‐ total‐ number of basal doses (intermediate acting).
7.41. Analysis.
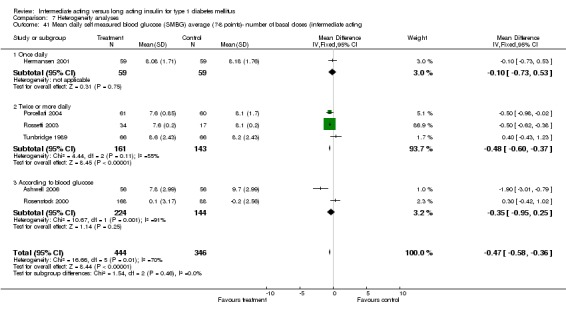
Comparison 7 Heterogeneity analyses, Outcome 41 Mean daily self measured blood glucose (SMBG) average (7‐8 points)‐ number of basal doses (intermediate acting.
7.42. Analysis.
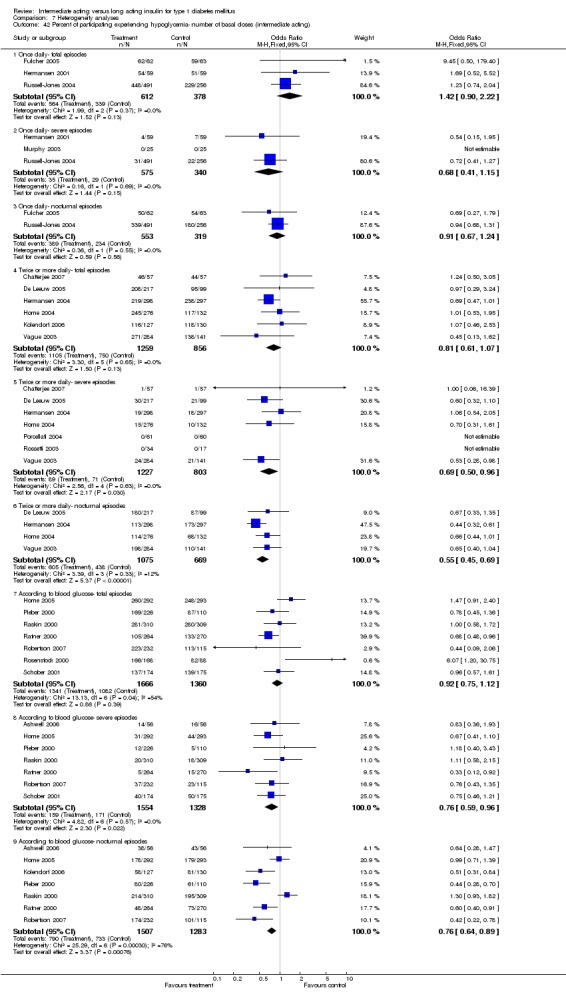
Comparison 7 Heterogeneity analyses, Outcome 42 Percent of participating experiencing hypoglycemia‐ number of basal doses (intermediate acting).
7.43. Analysis.
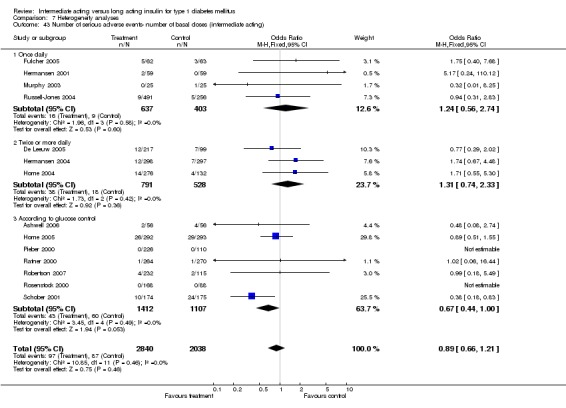
Comparison 7 Heterogeneity analyses, Outcome 43 Number of serious adverse events‐ number of basal doses (intermediate acting).
7.44. Analysis.
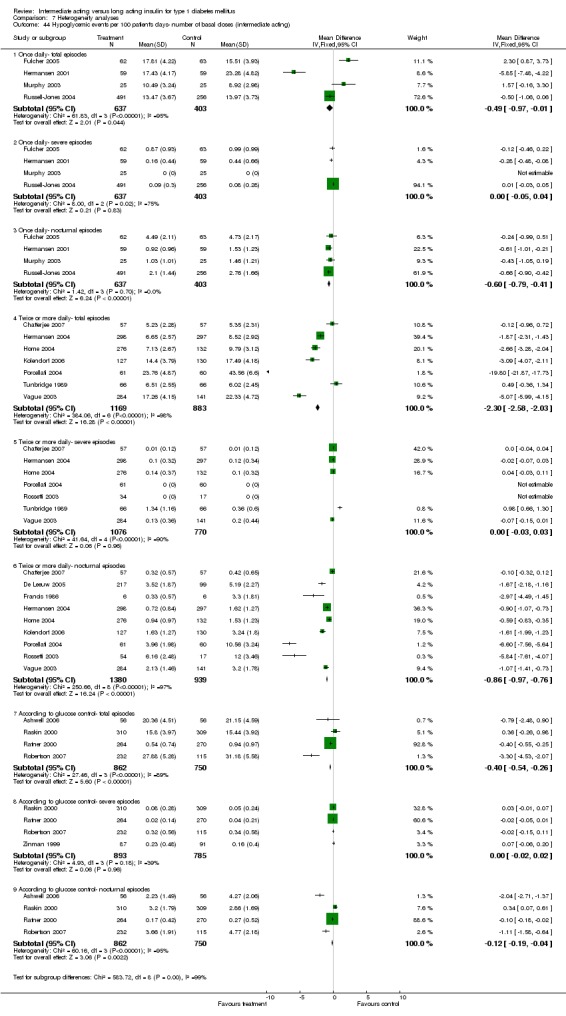
Comparison 7 Heterogeneity analyses, Outcome 44 Hypoglycemic events per 100 patient's days‐ number of basal doses (intermediate acting).
7.45. Analysis.
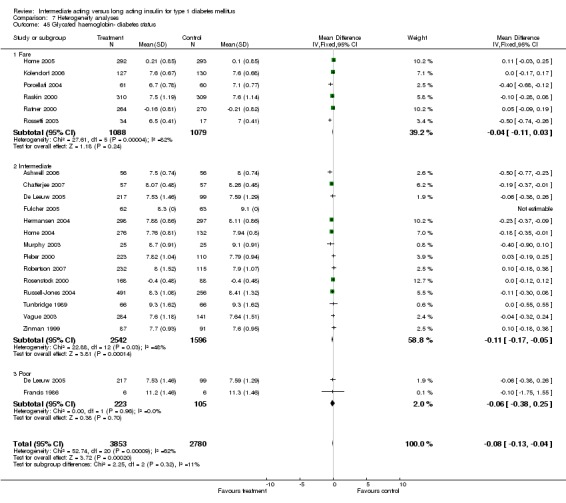
Comparison 7 Heterogeneity analyses, Outcome 45 Glycated haemoglobin‐ diabetes status.
7.46. Analysis.
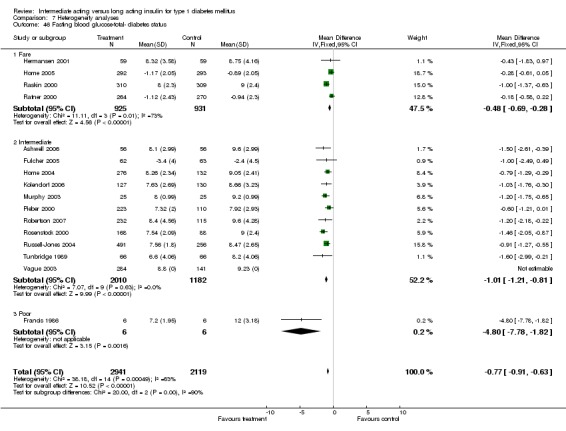
Comparison 7 Heterogeneity analyses, Outcome 46 Fasting blood glucose‐total‐ diabetes status.
7.47. Analysis.
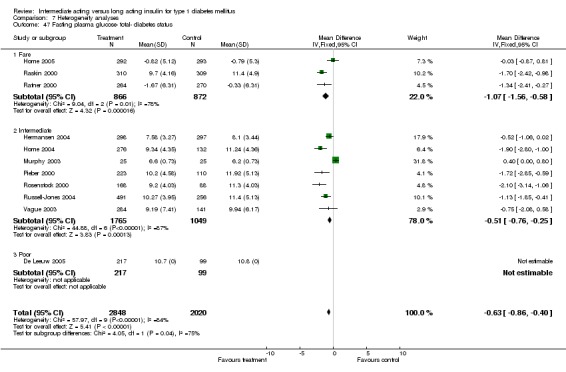
Comparison 7 Heterogeneity analyses, Outcome 47 Fasting plasma glucose‐ total‐ diabetes status.
7.48. Analysis.
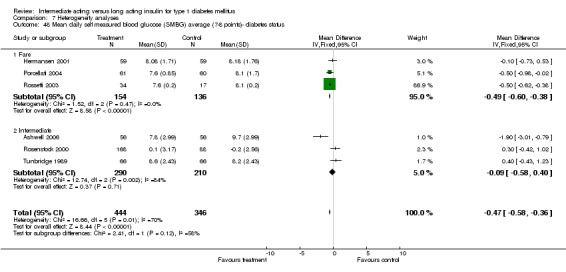
Comparison 7 Heterogeneity analyses, Outcome 48 Mean daily self measured blood glucose (SMBG) average (7‐8 points)‐ diabetes status.
7.49. Analysis.
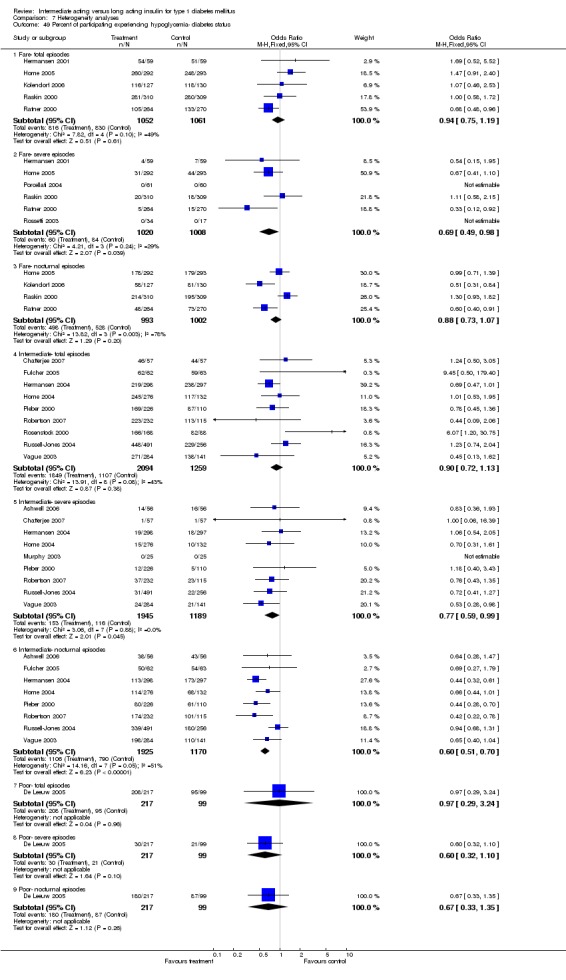
Comparison 7 Heterogeneity analyses, Outcome 49 Percent of participating experiencing hypoglycemia‐ diabetes status.
7.50. Analysis.
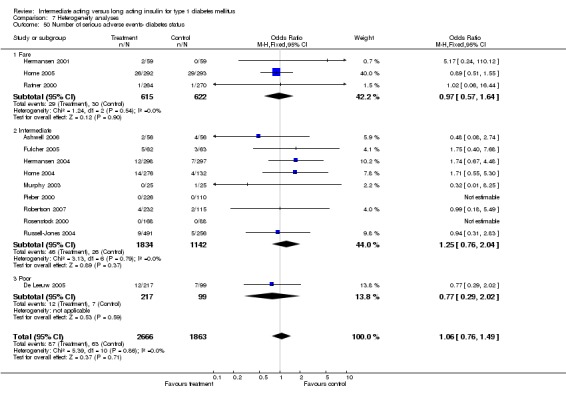
Comparison 7 Heterogeneity analyses, Outcome 50 Number of serious adverse events‐ diabetes status.
7.51. Analysis.
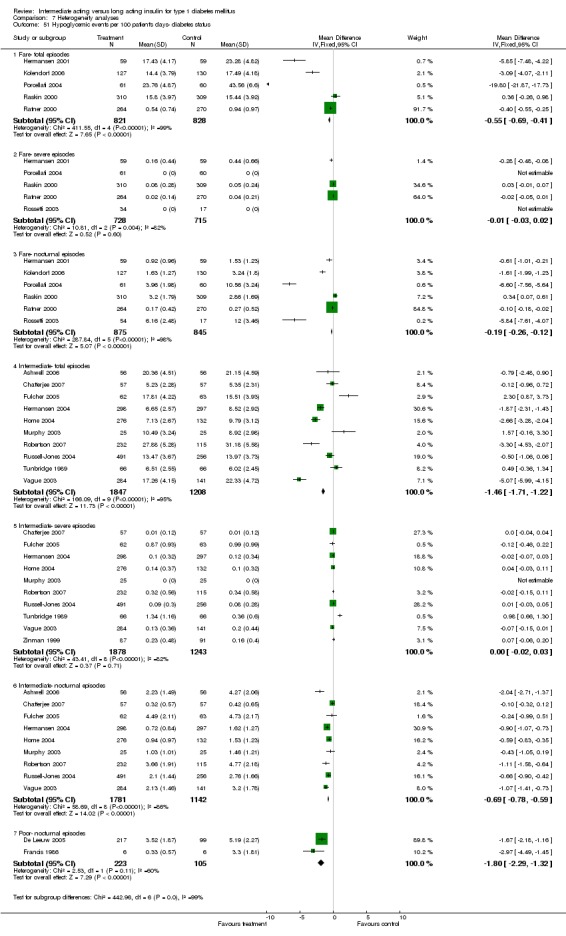
Comparison 7 Heterogeneity analyses, Outcome 51 Hypoglycemic events per 100 patient's days‐ diabetes status.
Comparison 8. Sensitivity analysis.
| Outcome or subgroup title | No. of studies | No. of participants | Statistical method | Effect size |
|---|---|---|---|---|
| 1 Glycated haemoglobin‐ large trials ommited | 20 | 5300 | Mean Difference (IV, Fixed, 95% CI) | ‐0.08 [‐0.12, ‐0.03] |
| 1.1 Short term | 3 | 640 | Mean Difference (IV, Fixed, 95% CI) | ‐0.08 [‐0.18, 0.02] |
| 1.2 Intermediate term | 9 | 2105 | Mean Difference (IV, Fixed, 95% CI) | ‐0.18 [‐0.25, ‐0.10] |
| 1.3 Long term | 8 | 2555 | Mean Difference (IV, Fixed, 95% CI) | 0.03 [‐0.05, 0.11] |
| 2 Glycated haemoglobin‐ low quality ommited | 16 | 6267 | Mean Difference (IV, Fixed, 95% CI) | ‐0.05 [‐0.10, ‐0.01] |
| 2.1 Short term | 2 | 875 | Mean Difference (IV, Fixed, 95% CI) | ‐0.04 [‐0.13, 0.06] |
| 2.2 Intermediate term | 8 | 2560 | Mean Difference (IV, Fixed, 95% CI) | ‐0.16 [‐0.23, ‐0.08] |
| 2.3 Long term | 7 | 2832 | Mean Difference (IV, Fixed, 95% CI) | 0.04 [‐0.03, 0.12] |
| 3 Fasting blood glucose‐total‐ low quality ommited | 13 | 4559 | Mean Difference (IV, Fixed, 95% CI) | ‐0.75 [‐0.91, ‐0.60] |
| 4 Fasting plasma glucose‐ total‐ low quality ommited | 9 | 4485 | Mean Difference (IV, Fixed, 95% CI) | ‐1.07 [‐1.36, ‐0.79] |
| 5 Mean daily self measured blood glucose (SMBG) average (7‐8 points)‐ low quality ommited | 3 | 500 | Mean Difference (IV, Fixed, 95% CI) | ‐0.09 [‐0.58, 0.40] |
| 5.1 Short term | 1 | 256 | Mean Difference (IV, Fixed, 95% CI) | 0.30 [‐0.42, 1.02] |
| 5.2 Intermediate term | 2 | 244 | Mean Difference (IV, Fixed, 95% CI) | ‐0.43 [‐1.09, 0.24] |
| 5.3 Long term | 0 | 0 | Mean Difference (IV, Fixed, 95% CI) | 0.0 [0.0, 0.0] |
| 6 Percent of participating experiencing hypoglycemia‐ low quality ommited | 13 | Odds Ratio (M‐H, Fixed, 95% CI) | Subtotals only | |
| 6.1 Total episodes | 12 | 5214 | Odds Ratio (M‐H, Fixed, 95% CI) | 0.92 [0.77, 1.09] |
| 6.2 Severe episodes | 10 | 4688 | Odds Ratio (M‐H, Fixed, 95% CI) | 0.71 [0.58, 0.88] |
| 6.3 Nocturnal episodes | 12 | 5070 | Odds Ratio (M‐H, Fixed, 95% CI) | 0.73 [0.64, 0.82] |
| 7 Hypoglycemic events per 100 patient's days‐ low quality ommited | 14 | Mean Difference (IV, Fixed, 95% CI) | Subtotals only | |
| 7.1 Total episodes | 11 | 4301 | Mean Difference (IV, Fixed, 95% CI) | ‐0.70 [‐0.82, ‐0.58] |
| 7.2 Severe episodes | 10 | 4110 | Mean Difference (IV, Fixed, 95% CI) | 0.00 [‐0.02, 0.02] |
| 7.3 Nocturnal episodes | 12 | 4497 | Mean Difference (IV, Fixed, 95% CI) | ‐0.38 [‐0.44, ‐0.32] |
| 8 Glycated haemoglobin‐ selection bias analysis | 10 | 4077 | Mean Difference (IV, Fixed, 95% CI) | ‐0.12 [‐0.18, ‐0.07] |
| 8.1 Short term | 1 | 619 | Mean Difference (IV, Fixed, 95% CI) | ‐0.10 [‐0.27, 0.07] |
| 8.2 Intermediate term | 7 | 2405 | Mean Difference (IV, Fixed, 95% CI) | ‐0.19 [‐0.27, ‐0.12] |
| 8.3 Long term | 3 | 1053 | Mean Difference (IV, Fixed, 95% CI) | 0.02 [‐0.09, 0.14] |
| 9 Fasting blood glucose‐total‐ selection bias analysis | 7 | 2628 | Mean Difference (IV, Fixed, 95% CI) | ‐0.72 [‐0.93, ‐0.51] |
| 10 Fasting plasma glucose‐ total‐ selection bias analysis | 5 | 2632 | Mean Difference (IV, Fixed, 95% CI) | ‐0.92 [‐1.26, ‐0.58] |
| 11 Mean daily self measured blood glucose (SMBG) average (7‐8 points)‐ selection bias analysis | 3 | 365 | Mean Difference (IV, Fixed, 95% CI) | ‐0.47 [‐0.86, ‐0.09] |
| 11.1 Intermediate term | 2 | 244 | Mean Difference (IV, Fixed, 95% CI) | ‐0.43 [‐1.09, 0.24] |
| 11.2 Long term | 1 | 121 | Mean Difference (IV, Fixed, 95% CI) | ‐0.5 [‐0.98, ‐0.02] |
| 12 Percent of participating experiencing hypoglycemia‐ selection bias analysis | 9 | Odds Ratio (M‐H, Fixed, 95% CI) | Subtotals only | |
| 12.1 Total episodes | 7 | 3093 | Odds Ratio (M‐H, Fixed, 95% CI) | 0.92 [0.73, 1.15] |
| 12.2 Severe episodes | 9 | 3326 | Odds Ratio (M‐H, Fixed, 95% CI) | 0.77 [0.61, 0.98] |
| 12.3 Nocturnal episodes | 7 | 3091 | Odds Ratio (M‐H, Fixed, 95% CI) | 0.74 [0.63, 0.86] |
| 13 Hypoglycemic events per 100 patient's days‐ selection bias analysis | 10 | Mean Difference (IV, Fixed, 95% CI) | Subtotals only | |
| 13.1 Total episodes | 9 | 2873 | Mean Difference (IV, Fixed, 95% CI) | ‐1.82 [‐2.07, ‐1.56] |
| 13.2 Severe episodes | 9 | 2811 | Mean Difference (IV, Fixed, 95% CI) | 0.01 [‐0.01, 0.03] |
| 13.3 Nocturnal episodes | 8 | 2741 | Mean Difference (IV, Fixed, 95% CI) | ‐0.64 [‐0.74, ‐0.54] |
| 14 Glycated haemoglobin‐ attrition bias analysis | 11 | 3919 | Mean Difference (IV, Fixed, 95% CI) | ‐0.10 [‐0.17, ‐0.04] |
| 14.1 Intermediate term | 5 | 1672 | Mean Difference (IV, Fixed, 95% CI) | ‐0.22 [‐0.31, ‐0.13] |
| 14.2 Long term | 6 | 2247 | Mean Difference (IV, Fixed, 95% CI) | 0.01 [‐0.08, 0.11] |
| 15 Fasting blood glucose‐total‐ attrition bias analysis | 8 | 2830 | Mean Difference (IV, Fixed, 95% CI) | ‐0.73 [‐0.94, ‐0.51] |
| 16 Fasting plasma glucose‐ total‐ attrition bias analysis | 6 | 3025 | Mean Difference (IV, Fixed, 95% CI) | ‐0.98 [‐1.34, ‐0.63] |
| 17 Mean daily self measured blood glucose (SMBG) average (7‐8 points)‐ attrition bias analysis | 2 | 244 | Mean Difference (IV, Fixed, 95% CI) | ‐0.43 [‐1.09, 0.24] |
| 17.1 Intermediate term | 2 | 244 | Mean Difference (IV, Fixed, 95% CI) | ‐0.43 [‐1.09, 0.24] |
| 18 Percent of participating experiencing hypoglycemia‐ attrition bias analysis | 9 | Odds Ratio (M‐H, Fixed, 95% CI) | Subtotals only | |
| 18.1 Total episodes | 8 | 3497 | Odds Ratio (M‐H, Fixed, 95% CI) | 0.79 [0.65, 0.97] |
| 18.2 Severe episodes | 8 | 3484 | Odds Ratio (M‐H, Fixed, 95% CI) | 0.68 [0.54, 0.87] |
| 18.3 Nocturnal episodes | 9 | 3609 | Odds Ratio (M‐H, Fixed, 95% CI) | 0.62 [0.53, 0.73] |
| 19 Hypoglycemic events per 100 patient's days‐ attrition bias analysis | 11 | Mean Difference (IV, Fixed, 95% CI) | Subtotals only | |
| 19.1 Total episodes | 9 | 3425 | Mean Difference (IV, Fixed, 95% CI) | ‐0.70 [‐0.83, ‐0.58] |
| 19.2 Severe episodes | 9 | 3491 | Mean Difference (IV, Fixed, 95% CI) | ‐0.01 [‐0.03, 0.01] |
| 19.3 Nocturnal episodes | 9 | 3609 | Mean Difference (IV, Fixed, 95% CI) | ‐0.38 [‐0.44, ‐0.32] |
8.1. Analysis.
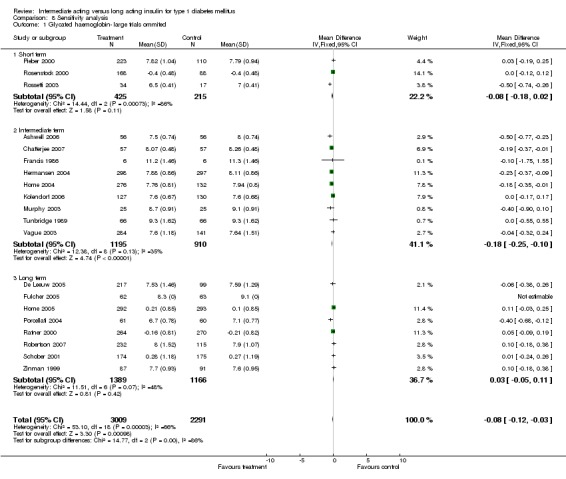
Comparison 8 Sensitivity analysis, Outcome 1 Glycated haemoglobin‐ large trials ommited.
8.2. Analysis.
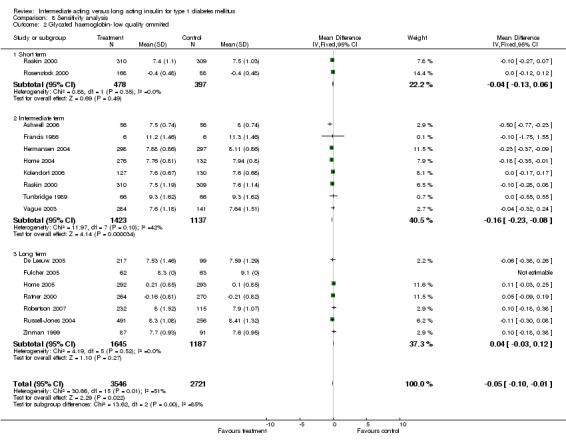
Comparison 8 Sensitivity analysis, Outcome 2 Glycated haemoglobin‐ low quality ommited.
8.3. Analysis.
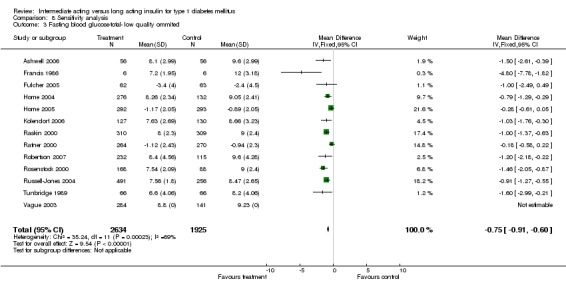
Comparison 8 Sensitivity analysis, Outcome 3 Fasting blood glucose‐total‐ low quality ommited.
8.4. Analysis.
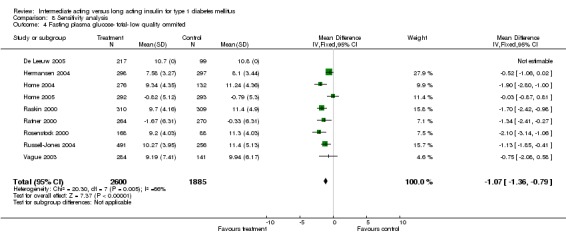
Comparison 8 Sensitivity analysis, Outcome 4 Fasting plasma glucose‐ total‐ low quality ommited.
8.5. Analysis.
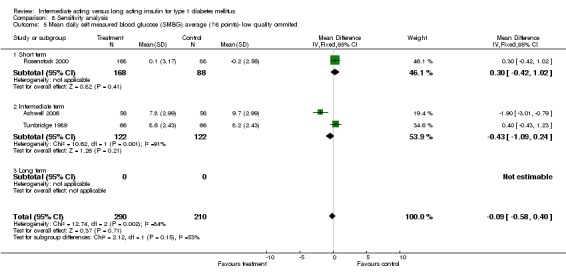
Comparison 8 Sensitivity analysis, Outcome 5 Mean daily self measured blood glucose (SMBG) average (7‐8 points)‐ low quality ommited.
8.6. Analysis.
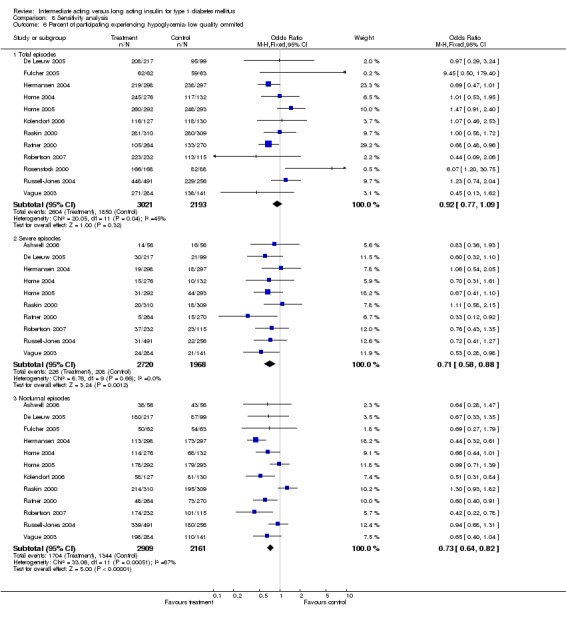
Comparison 8 Sensitivity analysis, Outcome 6 Percent of participating experiencing hypoglycemia‐ low quality ommited.
8.7. Analysis.
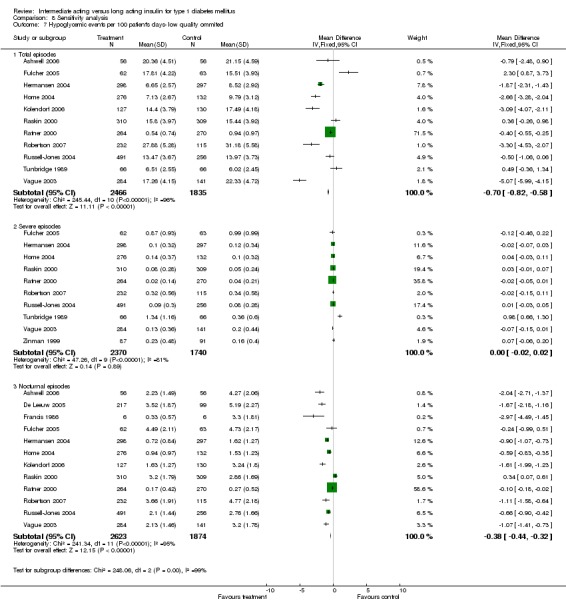
Comparison 8 Sensitivity analysis, Outcome 7 Hypoglycemic events per 100 patient's days‐ low quality ommited.
8.8. Analysis.
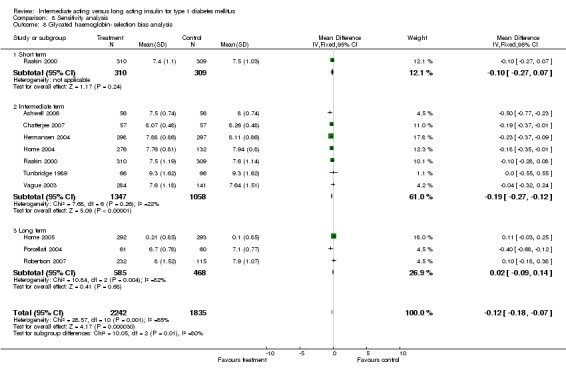
Comparison 8 Sensitivity analysis, Outcome 8 Glycated haemoglobin‐ selection bias analysis.
8.9. Analysis.
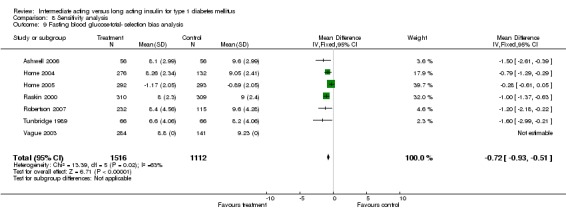
Comparison 8 Sensitivity analysis, Outcome 9 Fasting blood glucose‐total‐ selection bias analysis.
8.10. Analysis.
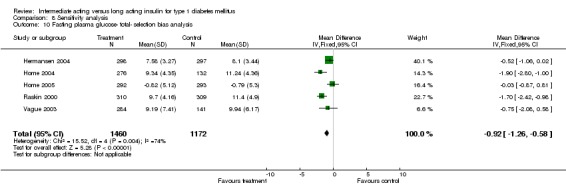
Comparison 8 Sensitivity analysis, Outcome 10 Fasting plasma glucose‐ total‐ selection bias analysis.
8.11. Analysis.
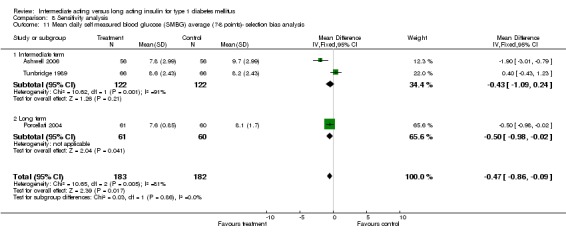
Comparison 8 Sensitivity analysis, Outcome 11 Mean daily self measured blood glucose (SMBG) average (7‐8 points)‐ selection bias analysis.
8.12. Analysis.
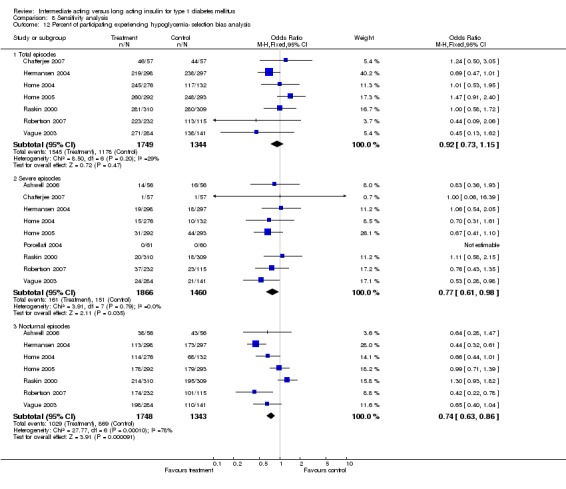
Comparison 8 Sensitivity analysis, Outcome 12 Percent of participating experiencing hypoglycemia‐ selection bias analysis.
8.13. Analysis.
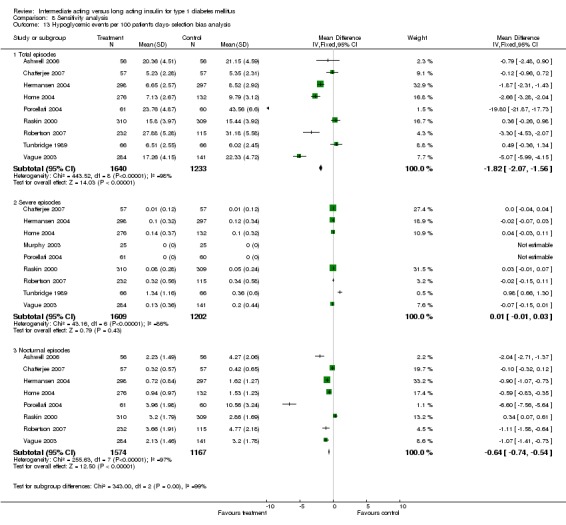
Comparison 8 Sensitivity analysis, Outcome 13 Hypoglycemic events per 100 patient's days‐ selection bias analysis.
8.14. Analysis.
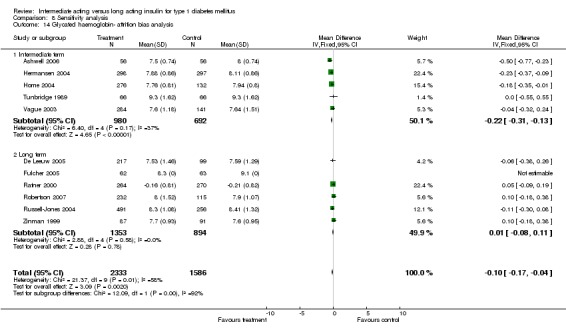
Comparison 8 Sensitivity analysis, Outcome 14 Glycated haemoglobin‐ attrition bias analysis.
8.15. Analysis.
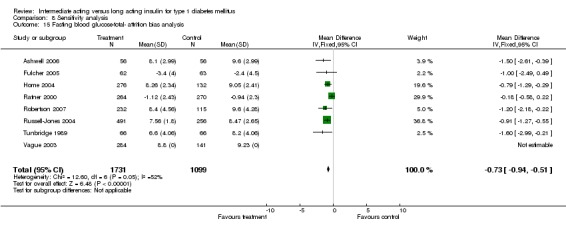
Comparison 8 Sensitivity analysis, Outcome 15 Fasting blood glucose‐total‐ attrition bias analysis.
8.16. Analysis.
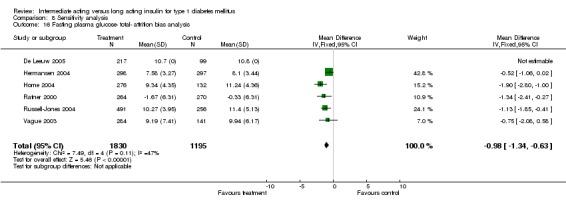
Comparison 8 Sensitivity analysis, Outcome 16 Fasting plasma glucose‐ total‐ attrition bias analysis.
8.17. Analysis.

Comparison 8 Sensitivity analysis, Outcome 17 Mean daily self measured blood glucose (SMBG) average (7‐8 points)‐ attrition bias analysis.
8.18. Analysis.
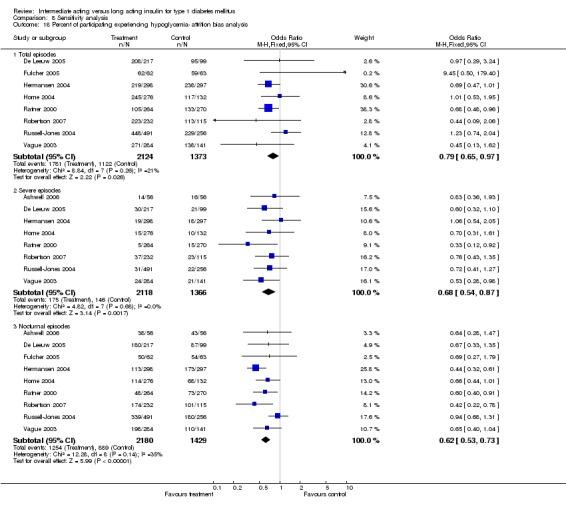
Comparison 8 Sensitivity analysis, Outcome 18 Percent of participating experiencing hypoglycemia‐ attrition bias analysis.
8.19. Analysis.
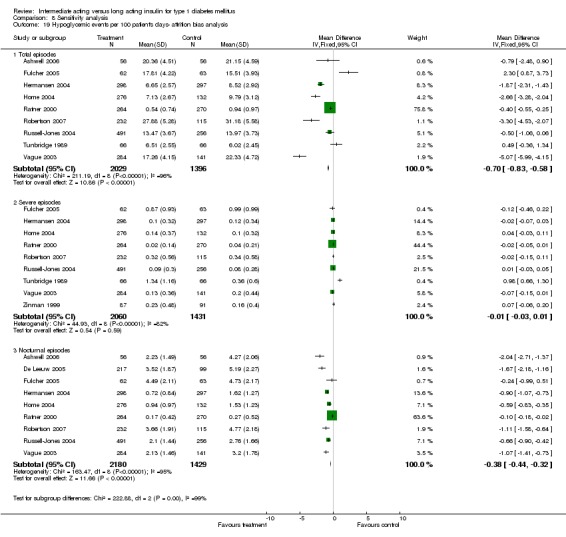
Comparison 8 Sensitivity analysis, Outcome 19 Hypoglycemic events per 100 patient's days‐ attrition bias analysis.
Characteristics of studies
Characteristics of included studies [ordered by study ID]
Ashwell 2006.
| Methods | DURATION OF INTERVENTION: 16 weeks. DURATION OF FOLLOW‐UP: N/A RUN‐IN PERIOD: 4 weeks. LANGUAGE OF PUBLICATION: English. | |
| Participants | WHO PARTCIPATED: Type 1 diabetic adult patients. INCLUSION CRITERIA: The people recruited were men and women aged 18‐65 years with Type 1 diabetes and no previous experience of insulin glargine, who had been using a multiple insulin injection regimen for at least 1 year and who had a random C‐peptide ? 0.10 nmol/L and HbA1c 7.0‐9.5%. Women of childbearing potential were required to be using adequate contraception. EXCLUSION CRITERIA: People with proliferative retinopathy, recurrent severe hypoglycaemia, impaired hepatic or renal function, or who worked night shifts were excluded from the trial DIAGNOSTIC CRITERIA: Not defined | |
| Interventions | NUMBER OF STUDY CENTRES: 5 SETTING: Out‐patient+inpatient INTERVENTION (ROUTE, TOTAL DOSE/DAY, FREQUENCY): Glargine (QD) + Lispro CONTROL (ROUTE, TOTAL DOSE/DAY, FREQUENCY): NPH (QD/BID)+HI TREATMENT BEFORE STUDY: ? TITRATION PERIOD: 4 weeks | |
| Outcomes | PRIMARY OUTCOME(S): Glycosylated haemoglobin SECONDARY OUTCOMES: insulin doses, pre‐breakfast SMBG concentration, 24‐h eightpoint SMBG levels, 24‐h inpatient plasma glucose levels, and monthly rate of hypoglycaemia | |
| Notes | STATED AIM OF STUDY: The aim of the present study was to compare blood glucose control in people with Type 1 diabetes managed with a multiple insulin injection regimen and strict glycaemic targets using insulin glargine plus insulin lispro in combination, and NPH insulin plus unmodified human insulin. | |
| Risk of bias | ||
| Bias | Authors' judgement | Support for judgement |
| Allocation concealment? | Low risk | A ‐ Adequate |
Chatterjee 2007.
| Methods | DURATION OF INTERVENTION: 36 weeks. DURATION OF FOLLOW‐UP: N/A RUN‐IN PERIOD: 4 weeks. LANGUAGE OF PUBLICATION: English. | |
| Participants | WHO PARTCIPATED: Type 1 diabetic adult patients. INCLUSION CRITERIA: Age between 18 and 75 years, type 1 diabetes on insulin for at least 6 months, body mass index less than 45, baseline HbA1c 6‐11%, and ability and willingness to perform self‐blood glucose monitoring. EXCLUSION CRITERIA: ? DIAGNOSTIC CRITERIA: Not defined | |
| Interventions | NUMBER OF STUDY CENTRES: 1 SETTING: Out‐patient. INTERVENTION (ROUTE, TOTAL DOSE/DAY, FREQUENCY): Determir (QD) + Aspart CONTROL (ROUTE, TOTAL DOSE/DAY, FREQUENCY): NPH (BID) + Aspart TREATMENT BEFORE STUDY: Twice‐daily or multiple dose insulin injections. TITRATION PERIOD: ? | |
| Outcomes | PRIMARY OUTCOME(S): Glycosylated haemoglobin SECONDARY OUTCOMES: Frequency of reported severe hypoglycaemic episodes and overall frequency of both severe and non‐severe hypoglycaemic events during the last 12 weeks of each treatment period. Other secondary endpoints were FPG, weight, fasting lipids and questionnaire‐based patient satisfaction. Safety endpoints were adverse event recording and vital signs namely pulse and blood pressure. | |
| Notes | STATED AIM OF STUDY: Combining insulin glargine and aspart in a basal bolus regimen | |
| Risk of bias | ||
| Bias | Authors' judgement | Support for judgement |
| Allocation concealment? | Unclear risk | B ‐ Unclear |
De Leeuw 2005.
| Methods | DURATION OF INTERVENTION: 12 months. DURATION OF FOLLOW‐UP: N/A RUN‐IN PERIOD: ? weeks. LANGUAGE OF PUBLICATION: English. | |
| Participants | WHO PARTCIPATED: Type 1 diabetic adult patients. INCLUSION CRITERIA: Patients initiated had a history of type 1 diabetes for over 1 year and had used basal‐bolus therapy for at least 2 months prior to enrolment. EXCLUSION CRITERIA: Proliferative retinopathy, impaired hepatic or renal function, severe cardiac problems, uncontrolled hypertension, recurrent major hypoglycaemia or allergy to insulin. Pregnant or breast‐feeding women were also excluded DIAGNOSTIC CRITERIA: Not defined | |
| Interventions | NUMBER OF STUDY CENTRES: 42 SETTING: Out‐patient. INTERVENTION (ROUTE, TOTAL DOSE/DAY, FREQUENCY): Detemir (BID) + Aspart CONTROL (ROUTE, TOTAL DOSE/DAY, FREQUENCY): NPH (BID) + Aspart TREATMENT BEFORE STUDY: ? TITRATION PERIOD: ? | |
| Outcomes | PRIMARY OUTCOME(S): ? SECONDARY OUTCOMES: Glycosylated haemoglobin, FPG and 9‐point BG profiles, weight gain, hypoglycaemia. | |
| Notes | STATED AIM OF STUDY: To assess the relative safety and efficacy over a 1‐year period of insulin detemir in comparison to NPH insulin, with IAsp as mealtime insulin. | |
| Risk of bias | ||
| Bias | Authors' judgement | Support for judgement |
| Allocation concealment? | Unclear risk | B ‐ Unclear |
Francis 1986.
| Methods | DURATION OF INTERVENTION: 4 months. DURATION OF FOLLOW‐UP: N/A RUN‐IN PERIOD: 3 months. LANGUAGE OF PUBLICATION: English. | |
| Participants | WHO PARTCIPATED: Type 1 diabetic adult patients. INCLUSION CRITERIA: Insulin dependent patients with persistent elevation of fasting blood glucose which could not be corrected. EXCLUSION CRITERIA: ? DIAGNOSTIC CRITERIA: Not defined | |
| Interventions | NUMBER OF STUDY CENTRES: 1 SETTING: Out‐patient+inpatient. INTERVENTION (ROUTE, TOTAL DOSE/DAY, FREQUENCY): Human ultralente (BID)+PI CONTROL (ROUTE, TOTAL DOSE/DAY, FREQUENCY): Porcine lente (BID) + PI TREATMENT BEFORE STUDY: Twice day mixture of short and intermediate acting insulins. TITRATION PERIOD: ? | |
| Outcomes | PRIMARY OUTCOME(S): ? SECONDARY OUTCOMES: Blood glucose, glycosylated haemoglobin, lactate, pyruvate, alanine, glycerol, NEFA, 3‐hydroxybutyrate, free insulin, GH, cortisol, adrenaline, noradrenaline, hypoglycaemia | |
| Notes | STATED AIM OF STUDY: Compare human ultralente and porcine lente. | |
| Risk of bias | ||
| Bias | Authors' judgement | Support for judgement |
| Allocation concealment? | Unclear risk | B ‐ Unclear |
Fulcher 2005.
| Methods | DURATION OF INTERVENTION: 30 weeks. DURATION OF FOLLOW‐UP: N/A RUN‐IN PERIOD: 2 weeks. LANGUAGE OF PUBLICATION: English. | |
| Participants | WHO PARTCIPATED: Type 1 diabetic adult patients. INCLUSION CRITERIA: Patients with type 1 diabetes, aged 18‐80 years, who were treated with insulin for at least 1 year and who had inadequate glycaemic control (HbA1c ?8%) EXCLUSION CRITERIA: Nightshift workers, patients with known sensitivity to the study drug or related drugs, and patients with impaired hepatic function or any other clinically relevant physiological or psychological medical conditions were excluded. DIAGNOSTIC CRITERIA: Not defined | |
| Interventions | NUMBER OF STUDY CENTRES: 9 SETTING: Out‐patient. INTERVENTION (ROUTE, TOTAL DOSE/DAY, FREQUENCY): Glargine (QD) + lispro. CONTROL (ROUTE, TOTAL DOSE/DAY, FREQUENCY): NPH (QD)+lispro TREATMENT BEFORE STUDY: ? TITRATION PERIOD: 6 weeks. | |
| Outcomes | PRIMARY OUTCOME(S): Glycosylated haemoglobin. SECONDARY OUTCOMES: Mean and variability of FBG, response rates for FBG and HbA1c, the incidence and rate of hypoglycaemia, weight change and lipid profiles. | |
| Notes | STATED AIM OF STUDY: To compare the effects of glargine and NPH, when administered once daily at bedtime in a 'treat‐to‐target', basal‐bolus regimen with lispro (administered three‐times daily before meals), on metabolic control in patients with suboptimally controlled type 1 diabetes (HbA1c ?8%). | |
| Risk of bias | ||
| Bias | Authors' judgement | Support for judgement |
| Allocation concealment? | Unclear risk | B ‐ Unclear |
Hermansen 2001.
| Methods | DURATION OF INTERVENTION: 6 weeks. DURATION OF FOLLOW‐UP: N/A RUN‐IN PERIOD: 2 weeks. LANGUAGE OF PUBLICATION: English. | |
| Participants | WHO PARTCIPATED: Type 1 diabetic adult patients. INCLUSION CRITERIA: Had received once‐daily (evening) NPH in combination with meal‐related human soluble insulin (HSI) for at least 6 months and had documented type 1 diabetes for > 2 years. EXCLUSION CRITERIA: Patients with proliferative retinopathy; impaired hepatic function (aspartate aminotransferase and/or alkaline phosphatase at least twice the upper normal level); impaired renal function (creatinine > 150 µmol/L); decompensated heart failure; unstable angina pectoris; myocardial infarction within the last year; hypertension (systolic and/or diastolic blood pressure > 180 and 100 mmHg, respectively); hypoglycemic unawareness; recurrent major hypoglycemia; or allergy to insulin or any compositional component, as well as those who abused alcohol or narcotics; used systemic corticosteroids, _‐blockers, or hormones within the past month; or were pregnant, breast‐feeding, or using inadequate contraceptive measures. Patients treated with other investigational products within the last 3 months or previously treated with insulin detemir were also excluded. DIAGNOSTIC CRITERIA: Not defined | |
| Interventions | NUMBER OF STUDY CENTRES: 7 SETTING: Out‐patient+inpatient. INTERVENTION (ROUTE, TOTAL DOSE/DAY, FREQUENCY): Detemir (QD)+ HI CONTROL (ROUTE, TOTAL DOSE/DAY, FREQUENCY): NPH (QD) + HI TREATMENT BEFORE STUDY: NPH + HI TITRATION PERIOD: ? | |
| Outcomes | PRIMARY OUTCOME(S): Area under the serum glucose curve in the time interval from 23:00 to 08:00. SECONDARY OUTCOMES: mean serum glucose profiles, eight‐point blood glucose profiles, mean levels of home‐monitored fasting blood glucose, mean fructosamine level, insulin doses, hypoglycaemic episodes. | |
| Notes | STATED AIM OF STUDY: Compare the blood glucose‐lowering effect of insulin detemir with that of NPH in terms of metabolic control, intrasubject variation in fasting blood glucose, dose requirement, and safety in type 1 diabetic patients treated with basal‐bolus therapy. | |
| Risk of bias | ||
| Bias | Authors' judgement | Support for judgement |
| Allocation concealment? | Unclear risk | B ‐ Unclear |
Hermansen 2004.
| Methods | DURATION OF INTERVENTION: 18 weeks. DURATION OF FOLLOW‐UP: N/A RUN‐IN PERIOD: ?. LANGUAGE OF PUBLICATION: English. | |
| Participants | WHO PARTCIPATED: Type 1 diabetic adult patients. INCLUSION CRITERIA: Age < 18 years, duration of diabetes > 12 months, BMI < 35 kg/m2, HbA1c < 12%, total daily insulin dose <1.4 U/kg, and current treatment with any basal‐bolus insulin regimen or biphasic insulin treatment for at least 6 months. EXCLUSION CRITERIA: Proliferative retinopathy requiring acute treatment, impaired renal or hepatic function, severe cardiac problems, uncontrolled hypertension, recurrent major hypoglycaemia, allergy to insulin, history of drug or alcohol dependence, pregnancy, and breast‐feeding. DIAGNOSTIC CRITERIA: Not defined | |
| Interventions | NUMBER OF STUDY CENTRES: 64. SETTING: Out‐patient. INTERVENTION (ROUTE, TOTAL DOSE/DAY, FREQUENCY): Detemir (BID) + aspart. CONTROL (ROUTE, TOTAL DOSE/DAY, FREQUENCY): NPH (BID) + HI TREATMENT BEFORE STUDY: ? TITRATION PERIOD: 6 weeks. | |
| Outcomes | PRIMARY OUTCOME(S): Glycosylated haemoglobin. SECONDARY OUTCOMES: Within‐person day‐today variation in plasma glucose, the 8‐point plasma glucose profiles, hypoglycaemia, body weight. | |
| Notes | STATED AIM OF STUDY: To bring together these respective components to compare a combination of the two analogues with conventional human insulin in basal‐bolus therapy for patients with Type 1 diabetes mellitus. | |
| Risk of bias | ||
| Bias | Authors' judgement | Support for judgement |
| Allocation concealment? | Unclear risk | B ‐ Unclear |
Home 2004.
| Methods | DURATION OF INTERVENTION: 16 weeks. DURATION OF FOLLOW‐UP: N/A RUN‐IN PERIOD: 2 weeks. LANGUAGE OF PUBLICATION: English. | |
| Participants | WHO PARTCIPATED: Type 1 diabetic adult patients. INCLUSION CRITERIA: Men and women > 18 years old with type 1 diabetes for > 1 year who were already using a mealtime basal regimen for > 2 months, with basal insulin dose < 100 units/day, HbA1c < 12.0%, and BMI < 35.5 kg/m2. EXCLUSION CRITERIA: Proliferative retinopathy, recurrent major hypoglycemia, impaired hepatic or renal function, or uncontrolled cardiovascular problems, use of medication known to interfere with glucose metabolism, pregnant or breast‐feeding women. DIAGNOSTIC CRITERIA: Not defined | |
| Interventions | NUMBER OF STUDY CENTRES: 52 SETTING: Out‐patient. INTERVENTION (ROUTE, TOTAL DOSE/DAY, FREQUENCY): Detemir (BID) + Aspart. CONTROL (ROUTE, TOTAL DOSE/DAY, FREQUENCY): NPH (BID) + Aspart. TREATMENT BEFORE STUDY: ? TITRATION PERIOD: ? | |
| Outcomes | PRIMARY OUTCOME(S): ? SECONDARY OUTCOMES: HbA1c, FPG, and prebreakfast self monitored plasma glucose, ten‐point self‐monitored plasma glucose profiles, total and nocturnal (2300 ‐0600) excursions in the CGMS profiles, hypoglycemia | |
| Notes | STATED AIM OF STUDY: Investigate whether insulin detemir provides improved glycemic control compared with NPH insulin, regardless of administration time, when used in a mealtime‐basal treatment regimen. | |
| Risk of bias | ||
| Bias | Authors' judgement | Support for judgement |
| Allocation concealment? | Unclear risk | B ‐ Unclear |
Home 2005.
| Methods | DURATION OF INTERVENTION: 28 weeks. DURATION OF FOLLOW‐UP: N/A RUN‐IN PERIOD: ? weeks. LANGUAGE OF PUBLICATION: English. | |
| Participants | WHO PARTCIPATED: Type 1 diabetic adult patients. INCLUSION CRITERIA: Type 1 diabetics with low post‐prandial C‐peptide levels. EXCLUSION CRITERIA: ? DIAGNOSTIC CRITERIA: Not defined | |
| Interventions | NUMBER OF STUDY CENTRES: 63. SETTING: Out‐patient. INTERVENTION (ROUTE, TOTAL DOSE/DAY, FREQUENCY): Glargine (QD) + HI CONTROL (ROUTE, TOTAL DOSE/DAY, FREQUENCY): NPH (QD/BID) + HI TREATMENT BEFORE STUDY: NPH, Ultralente TITRATION PERIOD: ? | |
| Outcomes | PRIMARY OUTCOME(S): Glycosylated haemoglobin. SECONDARY OUTCOMES: Fasting plasma glucose, fasting blood glucose, nocturnal bloog glucose, hypoglycaemia. | |
| Notes | STATED AIM OF THE HOME 2005 PUBLICATION: To compare the effect of insulin glargine and NPH on overall blood glucose control and safety. STATED AIM OF THE WITTHAUS 2001 PUBLICATION: To evaluate the impact of using insulin glargine on satisfaction with treatment and psychological well‐being. | |
| Risk of bias | ||
| Bias | Authors' judgement | Support for judgement |
| Allocation concealment? | Unclear risk | B ‐ Unclear |
Kolendorf 2006.
| Methods | DURATION OF INTERVENTION: 16 weeks. DURATION OF FOLLOW‐UP: N/A RUN‐IN PERIOD: 2 weeks. LANGUAGE OF PUBLICATION: English. | |
| Participants | WHO PARTCIPATED: Type 1 diabetic adult patients. INCLUSION CRITERIA: Age < 18 years with a history of Type 1 diabetes for at least 1 year, treated with a basal‐bolus insulin regimen for 4 months with basal insulin (once, twice or three times daily) in combination with mealtime IAsp or insulin lispro three to four times daily, able and willing to perform self‐measured plasma glucose (SMPG). Only C‐peptide‐negative persons with glycosylated haemoglobin < 9%, body mass index 35 kg/m2, total daily insulin dose 1.4 IU/kg per day and a basal insulin requirement 30% of the total daily insulin dose were included. EXCLUSION CRITERIA: Individuals with significant medical disorders were excluded, as were those with hypoglycaemic unawareness, recurrent major hypoglycaemia, allergy to insulin and pregnant or breast‐feeding women. DIAGNOSTIC CRITERIA: Not defined | |
| Interventions | NUMBER OF STUDY CENTRES: 11. SETTING: Out‐patient. INTERVENTION (ROUTE, TOTAL DOSE/DAY, FREQUENCY): Detemir (BID) + Aspart CONTROL (ROUTE, TOTAL DOSE/DAY, FREQUENCY): NPH (BID) + Aspart TREATMENT BEFORE STUDY: ? TITRATION PERIOD: | |
| Outcomes | PRIMARY OUTCOME(S): Incidence of total self‐recorded hypoglycaemic episodes with detemir relative to NPH during the last 10 weeks of each treatment period. SECONDARY OUTCOMES: Glycosylated haemoglobin, day‐to‐day within‐person variation in SMPG, weight. | |
| Notes | STATED AIM OF STUDY: To establish whether basal‐bolus treatment with detemir in combination with IAsp was associated with lower risks of hypoglycaemia compared with treatment with NPH plus IAsp in individuals with Type 1 diabetes | |
| Risk of bias | ||
| Bias | Authors' judgement | Support for judgement |
| Allocation concealment? | Unclear risk | B ‐ Unclear |
Murphy 2003.
| Methods | DURATION OF INTERVENTION: 16 weeks. DURATION OF FOLLOW‐UP: N/A RUN‐IN PERIOD: 4 weeks. LANGUAGE OF PUBLICATION: English. | |
| Participants | WHO PARTCIPATED: Type 1 diabetic children. INCLUSION CRITERIA: Age between 12 and 20 years, currently in puberty (Tanner stage B2/G2 or higher), duration of diabetes longer than 1 year or C‐peptide negative, and already using a basal‐bolus insulin regimen. EXCLUSION CRITERIA: Renal or hepatic impairment, evidence of diabetic complications, or unstable metabolic control (defined as HbA1c >12%). DIAGNOSTIC CRITERIA: Not defined | |
| Interventions | NUMBER OF STUDY CENTRES: 1 SETTING: Out‐patient + inpatient. INTERVENTION (ROUTE, TOTAL DOSE/DAY, FREQUENCY): Glargine (QD) + lispro. CONTROL (ROUTE, TOTAL DOSE/DAY, FREQUENCY): NPH (QD) + HI TREATMENT BEFORE STUDY: ? TITRATION PERIOD: 4 weeks. | |
| Outcomes | PRIMARY OUTCOME(S): Nocturnal hypoglycaemia. SECONDARY OUTCOMES: HbA1c and blood glucose, overnight profile | |
| Notes | STATED AIM OF STUDY: Comparing the combination of insulin analogs insulin glargine plus lispro with human NPH plus regular human insulin by home blood glucose monitoring and overnight metabolic pro‐files in adolescents with type 1 diabetes who were already on MIR. | |
| Risk of bias | ||
| Bias | Authors' judgement | Support for judgement |
| Allocation concealment? | Unclear risk | B ‐ Unclear |
Pieber 2000.
| Methods | DURATION OF INTERVENTION: 4 weeks. DURATION OF FOLLOW‐UP: N/A RUN‐IN PERIOD: N/A. LANGUAGE OF PUBLICATION: English. | |
| Participants | WHO PARTCIPATED: Type 1 diabetic adult patients. INCLUSION CRITERIA: Clinically diagnosed type 1 diabetes who had been receiving insulin therapy for 1 year with a basal‐bolus regimen of NPH insulin once daily at bedtime or twice daily in the morning and at bedtime plus regular human insulin before meals was used for at least 2 months. EXCLUSION CRITERIA: The presence of known proliferative diabetic retinopathy, impaired hepatic or renal function, and a history of hypoglycemia unawareness DIAGNOSTIC CRITERIA: Not defined | |
| Interventions | NUMBER OF STUDY CENTRES: 42 SETTING: Out‐patient. INTERVENTION (ROUTE, TOTAL DOSE/DAY, FREQUENCY): Glargine 30 or glargine 80 (QD) + HI. CONTROL (ROUTE, TOTAL DOSE/DAY, FREQUENCY): NPH (QD) + RI TREATMENT BEFORE STUDY: A basal‐bolus regimen of NPH insulin once daily at bedtime (n = 177) or twice daily in the morning and at bedtime (n = 156) plus regular human insulin before meals was used for at least 2 months. TITRATION PERIOD: 3 weeks. | |
| Outcomes | PRIMARY OUTCOME(S): ? SECONDARY OUTCOMES: Fasting plasma glucose, HbA1C , fructosamine, FBG, mean of a seven‐point blood glucose profile, and nocturnal blood glucose at 0300, hypoglycemia, antibodies to insulin. | |
| Notes | STATED AIM OF STUDY: To compare the 4‐week efficacy and safety of two formulations of HOE 901 with NPH insulin | |
| Risk of bias | ||
| Bias | Authors' judgement | Support for judgement |
| Allocation concealment? | Unclear risk | B ‐ Unclear |
Porcellati 2004.
| Methods | DURATION OF INTERVENTION: 1 year. DURATION OF FOLLOW‐UP: N/A RUN‐IN PERIOD: 1 month. LANGUAGE OF PUBLICATION: English. | |
| Participants | WHO PARTCIPATED: Type 1 diabetic adult patients. INCLUSION CRITERIA: T1 DM (Table 1) and fasting plasma C‐peptide 0.15 nmol/L, on intensified treatment with multiple daily combinations of lispro and NPH insulin at each meal, and NPH at bedtime for at least 2 years. EXCLUSION CRITERIA: Free of any detectable microangiopathic complication and were negative at the screening for autonomic neuropathy, as judged on the basis of standard battery of cardiovascular tests. DIAGNOSTIC CRITERIA: Not defined | |
| Interventions | NUMBER OF STUDY CENTRES: 1 SETTING: Out‐patient + inpatient. INTERVENTION (ROUTE, TOTAL DOSE/DAY, FREQUENCY): Glargine (QD) + lispro CONTROL (ROUTE, TOTAL DOSE/DAY, FREQUENCY): NPH (QID) + lispro TREATMENT BEFORE STUDY: NPH + lispro TITRATION PERIOD: ? | |
| Outcomes | PRIMARY OUTCOME(S): Glycosylated haemoglobin. SECONDARY OUTCOMES: Home blood glucose monitoring, percantage of at target blood glucose measurements, blood glucose variability, hypoglycaemia, weight | |
| Notes | STATED AIM OF STUDY: First, to compare the long‐term glycaemic control in T1 DM with two regimens of optimized replacement of basal insulin, i.e. NPH combined with lispro insulin at each meal (and a fourth NPH injection at bedtime), and insulin glargine once daily. Second, to test the hypothesis that the less frequent hypoglycaemia expected to occur with insulin glargine as compared with NPH, resulted in better responses of counter‐regulatory hormones, symptoms and onset of cognitive dysfunction to hypoglycaemia. | |
| Risk of bias | ||
| Bias | Authors' judgement | Support for judgement |
| Allocation concealment? | Low risk | A ‐ Adequate |
Raskin 2000.
| Methods | DURATION OF INTERVENTION: 16 weeks. DURATION OF FOLLOW‐UP: N/A RUN‐IN PERIOD: 1 to 4 weeks. LANGUAGE OF PUBLICATION: English. | |
| Participants | WHO PARTCIPATED: Type 1 diabetic adult patients. INCLUSION CRITERIA: Eligible patients had type 1 diabetes, were 18‐80 years of age, and had been receiving treatment with NPH insulin for at least 1 year and insulin lispro for at least 3 months. Patients had to have a serum C‐peptide level < 9 mg/dl (0.5 mmol/L) in the presence of a blood glucose level _99.0 mg/dl (5.5 mmol/L) and a GHb value < 12.0%. EXCLUSION CRITERIA: Patients with hepatic or renal impairment, those who were pregnant or breast feeding, and those who had received treatment with any glucose‐lowering drug other than insulin within 4 weeks of the study. DIAGNOSTIC CRITERIA: Not defined | |
| Interventions | NUMBER OF STUDY CENTRES: 60. SETTING: Out‐patient. INTERVENTION (ROUTE, TOTAL DOSE/DAY, FREQUENCY): Glargine (QD) + lispro CONTROL (ROUTE, TOTAL DOSE/DAY, FREQUENCY): NPH (QD/BID) + lispro TREATMENT BEFORE STUDY: NPH + lispro TITRATION PERIOD: | |
| Outcomes | PRIMARY OUTCOME(S): ? SECONDARY OUTCOMES: Glycosylated haemoglobin, FBG, FPG, hypoglycaemia. | |
| Notes | STATED AIM OF STUDY: We compared the effects of insulin glargine once a day at bedtime and NPH insulin once or twice a day as basal insulin treatment for 16 weeks in patients with type 1 diabetes who were currently receiving NPH insulin for basal treatment and preprandial insulin lispro for postprandial glycemic control. | |
| Risk of bias | ||
| Bias | Authors' judgement | Support for judgement |
| Allocation concealment? | Unclear risk | B ‐ Unclear |
Ratner 2000.
| Methods | DURATION OF INTERVENTION: 28 weeks. DURATION OF FOLLOW‐UP: N/A RUN‐IN PERIOD: 1 to 4 weeks. LANGUAGE OF PUBLICATION: English. | |
| Participants | WHO PARTCIPATED: Type 1 diabetic adult patients. INCLUSION CRITERIA: Men and women 18‐80 years of age with type 1 diabetes (postprandial C‐peptide levels of _0.5 nmol/L) for at least 1 year and GHb levels of <12.0% were eligible. EXCLUSION CRITERIA: Treatment with antidiabetic drugs other than insulin within 1 month of study entry, pregnancy, impaired hepatic function, and impaired renal function. Patients could not work a night shift. DIAGNOSTIC CRITERIA: Not defined | |
| Interventions | NUMBER OF STUDY CENTRES: 49. SETTING: Out‐patient. INTERVENTION (ROUTE, TOTAL DOSE/DAY, FREQUENCY): Glargine (QD) + RI CONTROL (ROUTE, TOTAL DOSE/DAY, FREQUENCY): NPH (QD/BID)+RI TREATMENT BEFORE STUDY: ? TITRATION PERIOD: ? | |
| Outcomes | PRIMARY OUTCOME(S): ? SECONDARY OUTCOMES: Mean changes from baseline of GHb and capillary FBG levels, median change from baseline of FPG levels, incidence of hypoglycemia, and incidence of hypoglycemia with a blood glucose level of < 2.0 mmol/L. | |
| Notes | STATED AIM OF STUDY: Safety and efficacy of once‐daily insulin glargine versus once‐ or twice‐daily NPH insulin as part of basal‐bolus insulin regimens for patients with type 1 diabetes. | |
| Risk of bias | ||
| Bias | Authors' judgement | Support for judgement |
| Allocation concealment? | Unclear risk | B ‐ Unclear |
Robertson 2007.
| Methods | DURATION OF INTERVENTION: 26 weeks. DURATION OF FOLLOW‐UP: N/A RUN‐IN PERIOD: ? weeks. LANGUAGE OF PUBLICATION: English. | |
| Participants | WHO PARTCIPATED: Type 1 diabetic children. INCLUSION CRITERIA: Children with Type 1 diabetes aged between 6 and 17 years, treated with insulin for at least 12 months (total daily dose 2.0 U/kg), and with HbA1c 12.0% EXCLUSION CRITERIA: ? DIAGNOSTIC CRITERIA: Not defined | |
| Interventions | NUMBER OF STUDY CENTRES: 44. SETTING: Out‐patient. INTERVENTION (ROUTE, TOTAL DOSE/DAY, FREQUENCY): Detemir (QD/BID) + aspart. CONTROL (ROUTE, TOTAL DOSE/DAY, FREQUENCY): NPH (QD/BID) + Aspart. TREATMENT BEFORE STUDY: ? TITRATION PERIOD: | |
| Outcomes | PRIMARY OUTCOME(S): Glycosylated haemoglobin. SECONDARY OUTCOMES: Eight‐point plasma glucose profiles, self‐measured FPG, hypoglycaemia. | |
| Notes | STATED AIM OF STUDY: To investigate the efficacy and safety of insulin detemir compared with NPH insulin in children with Type 1 diabetes | |
| Risk of bias | ||
| Bias | Authors' judgement | Support for judgement |
| Allocation concealment? | Unclear risk | B ‐ Unclear |
Rosenstock 2000.
| Methods | DURATION OF INTERVENTION: 4 weeks. DURATION OF FOLLOW‐UP: N/A RUN‐IN PERIOD: ? weeks. LANGUAGE OF PUBLICATION: English. | |
| Participants | WHO PARTCIPATED: Type 1 diabetic adult patients. INCLUSION CRITERIA: Age between 18 and 70 years, BMI of 18‐28 kg/m2, HbA1c of < 10%, and postprandial serum C‐peptide of <0.2 pmol/ml. All study patients had been on a basal‐bolus multiple daily insulin regimen for at least 2 months. EXCLUSION CRITERIA: ? DIAGNOSTIC CRITERIA: Not defined | |
| Interventions | NUMBER OF STUDY CENTRES: Multicenter. SETTING: Out‐patient + inpatient. INTERVENTION (ROUTE, TOTAL DOSE/DAY, FREQUENCY): Glargine 30 or glargine 80 (QD) + HI CONTROL (ROUTE, TOTAL DOSE/DAY, FREQUENCY): NPH (QD/BID) + HI TREATMENT BEFORE STUDY: ? TITRATION PERIOD: ? | |
| Outcomes | PRIMARY OUTCOME(S): Fasting plasma glucose. SECONDARY OUTCOMES: Serial overnight plasma glucose, mean FBG, blood glucose profile, nocturnal blood glucose, stability of fasting glucose, fasting serum insulin, HbA1c, hypoglycaemia. | |
| Notes | STATED AIM OF STUDY: The primary objective was to compare NPH insulin with the insulin glargine formulations with respect to fasting plasma glucose (FPG) in these patients. | |
| Risk of bias | ||
| Bias | Authors' judgement | Support for judgement |
| Allocation concealment? | Unclear risk | B ‐ Unclear |
Rossetti 2003.
| Methods | DURATION OF INTERVENTION: 3 months. DURATION OF FOLLOW‐UP: N/A RUN‐IN PERIOD: 2 weeks. LANGUAGE OF PUBLICATION: English. | |
| Participants | WHO PARTCIPATED: Type 1 diabetic adult patients. INCLUSION CRITERIA: Patients already in long‐term near‐normoglycemia (HbA1c 6.0‐7.5%) during intensive therapy were studied. Treated with intensive insulin therapy and attending the Diabetes Clinic at least quarterly every year. C‐peptide negative (plasma C‐peptide <0.10 nmol/L after 1 mg i.v. glucagon). EXCLUSION CRITERIA: Free of any detectable microangiopathic complication and negative at the screening for autonomic neuropathy, as judged on the basis of a standard battery of cardiovascular tests DIAGNOSTIC CRITERIA: Not defined | |
| Interventions | NUMBER OF STUDY CENTRES: 1. SETTING: Out‐patient + inpatient. INTERVENTION (ROUTE, TOTAL DOSE/DAY, FREQUENCY): Glargine dinner/et‐time (QD) + Lispro CONTROL (ROUTE, TOTAL DOSE/DAY, FREQUENCY): NPH (QID) + Lispro TREATMENT BEFORE STUDY: NPH QID basal therapy + Lispro TITRATION PERIOD: ?. | |
| Outcomes | PRIMARY OUTCOME(S): GLycated haemoglobin SECONDARY OUTCOMES: blood glucose profile from home monitoring, percentage of measurements at target, blood glucose variability, hypoglycaemia,plasma insulin and glucose profiles. | |
| Notes | STATED AIM OF STUDY: To establish glycaemic control between optimised NPH administration and glargine, and to compare dinnertime glargine with bedtime glargine. | |
| Risk of bias | ||
| Bias | Authors' judgement | Support for judgement |
| Allocation concealment? | Unclear risk | B ‐ Unclear |
Russell‐Jones 2004.
| Methods | DURATION OF INTERVENTION: 6 months. DURATION OF FOLLOW‐UP: N/A RUN‐IN PERIOD: 3 weeks. LANGUAGE OF PUBLICATION: English. | |
| Participants | WHO PARTCIPATED: Type 1 diabetic adult patients. INCLUSION CRITERIA: Men and women > 18 years with type 1 DM for > 1 year using basal or premixed insulin QD and HI before meals for > 2 months. EXCLUSION CRITERIA: Poorly controlled diabetes on QD regimen, pregnant or breastfeading, proliferative retinopathy, hepatic or renal impairment, reccurent major hypoglycaemia, or severe cardiac problems, or concomitent use of medication interfering with glucose metabolism. DIAGNOSTIC CRITERIA: Not defined | |
| Interventions | NUMBER OF STUDY CENTRES: 92. SETTING: Out‐patient + inpatient. INTERVENTION (ROUTE, TOTAL DOSE/DAY, FREQUENCY): Detemir (QD) + HI CONTROL (ROUTE, TOTAL DOSE/DAY, FREQUENCY): NPH (QD) + HI TREATMENT BEFORE STUDY: QD basal therapy + HI TITRATION PERIOD: 1 month. | |
| Outcomes | PRIMARY OUTCOME(S): ? SECONDARY OUTCOMES: Glycosylated haemoglobin, FPG, SMBG, 24 hours glucose profiles, hypoglycaemia, weight | |
| Notes | STATED AIM OF STUDY: To compare the effect of QD basal insulin replacement using insulin detemir versus NPH at bedtime in combination with HI in patients with type 1 DM. | |
| Risk of bias | ||
| Bias | Authors' judgement | Support for judgement |
| Allocation concealment? | Unclear risk | B ‐ Unclear |
Schober 2001.
| Methods | DURATION OF INTERVENTION: 6 months. DURATION OF FOLLOW‐UP: N/A RUN‐IN PERIOD: ? weeks. LANGUAGE OF PUBLICATION: English. | |
| Participants | WHO PARTCIPATED: Type 1 diabetic children. INCLUSION CRITERIA: Patients with type 1 diabetes, aged 5‐16 years, who were using at least three daily preprandial injections of normal insulin and who had an HbA1c value of <12%. EXCLUSION CRITERIA: ? DIAGNOSTIC CRITERIA: Not defined | |
| Interventions | NUMBER OF STUDY CENTRES: Multy‐center. SETTING: Out‐patient. INTERVENTION (ROUTE, TOTAL DOSE/DAY, FREQUENCY): Glargine (QD) + HI CONTROL (ROUTE, TOTAL DOSE/DAY, FREQUENCY): NPH (QD/BID) + HI. TREATMENT BEFORE STUDY: ? TITRATION PERIOD: | |
| Outcomes | PRIMARY OUTCOME(S): Mean change from baseline in GHb levels. SECONDARY OUTCOMES: Mean change in FBG levels from baseline and incidence of hypoglycemia. | |
| Notes | STATED AIM OF STUDY: To compare the metabolic effect and safety of insulin glargine with NPH insulin in children and adolescents with type 1 diabetes. | |
| Risk of bias | ||
| Bias | Authors' judgement | Support for judgement |
| Allocation concealment? | Unclear risk | B ‐ Unclear |
Tunbridge 1989.
| Methods | DURATION OF INTERVENTION: 3 months. DURATION OF FOLLOW‐UP: N/A RUN‐IN PERIOD: 1 year (in another study). LANGUAGE OF PUBLICATION: English. | |
| Participants | WHO PARTCIPATED: Type 1 diabetic adult patients. INCLUSION CRITERIA: Insulin dependent with C‐peptide < 0.18, age > 18. EXCLUSION CRITERIA: Proliferatice retinopathy, nephropathy, autonomic neuropathy, on medication likely to interfere with metabolic control, or pregnant. DIAGNOSTIC CRITERIA: Not defined | |
| Interventions | NUMBER OF STUDY CENTRES: 4. SETTING: Out‐patient. INTERVENTION (ROUTE, TOTAL DOSE/DAY, FREQUENCY): Ultralente (BID) + HI (premixed) CONTROL (ROUTE, TOTAL DOSE/DAY, FREQUENCY): Lente (BID) + HI (premixed). TREATMENT BEFORE STUDY: Lente and NPH TITRATION PERIOD: ? | |
| Outcomes | PRIMARY OUTCOME(S): ? SECONDARY OUTCOMES: Mean blood glucose, FBG, 0300 BG, HGA1C, fructosamine/albumin, triglycerides, weight, hypoglycaemia. | |
| Notes | STATED AIM OF STUDY: Assess the efficacy of human ultralente given twice daily, with special interest on hypoglycaemic rate | |
| Risk of bias | ||
| Bias | Authors' judgement | Support for judgement |
| Allocation concealment? | Unclear risk | B ‐ Unclear |
Vague 2003.
| Methods | DURATION OF INTERVENTION: 26 weeks. DURATION OF FOLLOW‐UP: N/A RUN‐IN PERIOD: 3 weeks. LANGUAGE OF PUBLICATION: English. | |
| Participants | WHO PARTCIPATED: Type 1 diabetic adult patients. INCLUSION CRITERIA: Patients with a history of type 1 diabetes for at least 1 year who had received basal (once or multiple times daily) bolus insulin treatment for at least 2 months were included in the trial. Only patients with an HbA1c level <=12%, a BMI <=35 kg/m2, and a total basal insulin dosage of <=100 IU/day were included. EXCLUSION CRITERIA: patients with proliferative retinopathy, impaired hepatic or renal function, severe cardiac problems, uncontrolled hypertension, recurrent major hypoglycemia, or allergy to insulin. Pregnant or breast‐feeding women were also excluded. DIAGNOSTIC CRITERIA: Not defined | |
| Interventions | NUMBER OF STUDY CENTRES: 46. SETTING: Out‐patient + inpatient. INTERVENTION (ROUTE, TOTAL DOSE/DAY, FREQUENCY): Detemir (BID) + Aspart. CONTROL (ROUTE, TOTAL DOSE/DAY, FREQUENCY): NPH (BID) + Aspart. TREATMENT BEFORE STUDY: ? TITRATION PERIOD: 1 month. | |
| Outcomes | PRIMARY OUTCOME(S): Glycosylated haemoglobin. SECONDARY OUTCOMES: Within subject SMBG flactuations, nightly glucose profile, weight, hypoglycaemia. | |
| Notes | STATED AIM OF STUDY: To evaluate the metabolic control, risk of hypoglycemia, and other potential effects of treatment with insulin detemir in patients with type 1 diabetes on such a basal‐bolus regimen. | |
| Risk of bias | ||
| Bias | Authors' judgement | Support for judgement |
| Allocation concealment? | Low risk | A ‐ Adequate |
Zinman 1999.
| Methods | DURATION OF INTERVENTION: 1 year. DURATION OF FOLLOW‐UP: N/A RUN‐IN PERIOD: 2 weeks. LANGUAGE OF PUBLICATION: English. | |
| Participants | WHO PARTCIPATED: Type 1 diabetic adult patients. INCLUSION CRITERIA: Patients with a clinical diagnosis of type 1 diabetes. EXCLUSION CRITERIA: Patients with severe retinopathy or neuropathy and patients who had experienced more than two severe hypoglycemic episodes in the past year DIAGNOSTIC CRITERIA: Not defined | |
| Interventions | NUMBER OF STUDY CENTRES: ? SETTING: Out‐patient + inpatient. INTERVENTION (ROUTE, TOTAL DOSE/DAY, FREQUENCY): Ultralente (QD) + lispro. CONTROL (ROUTE, TOTAL DOSE/DAY, FREQUENCY): NPH (QD) + lispro. TREATMENT BEFORE STUDY: ? TITRATION PERIOD: ? | |
| Outcomes | PRIMARY OUTCOME(S): ? SECONDARY OUTCOMES: Eight point blood glucose profile, glycosylated haemoglobin, hypoglycemia, weight, 24‐h free plasma insulin. | |
| Notes | STATED AIM OF STUDY: To compare human ultralente (UL) insulin with human NPH insulin as basal insulin replacement in patients who use insulin lispro before meals. | |
| Risk of bias | ||
| Bias | Authors' judgement | Support for judgement |
| Allocation concealment? | Unclear risk | B ‐ Unclear |
Characteristics of excluded studies [ordered by study ID]
| Study | Reason for exclusion |
|---|---|
| Albright 2004 | No RCT. |
| Alemzadeh 2003 | Flexible multiple daily insulin versus conventional treatment, no RCT. |
| Alemzadeh 2005 | Inetrvention, no RCT. |
| Heise 2003 | RCT. Pharmakodynamic and pharmakokinetic profiles. |
| Hershon 2004 | Subgroup analysis of Ratner et al. |
| Herwig 2007 | No RCT. Extensio of one arm from Schober 2001. |
| Kiess 2004 | Comment to Home et al. |
| Lepore 2000 | RCT. Pharmakodynamic and pharmakokinetic profiles. |
| Lepore 2003 | Most probably not an RCT with insulin pump as control. |
| Manini 2007 | No RCT. |
| Mimouni 1979 | No RCT. |
| Moretti 2005 | Not RCT |
| Palmer 2004 | Economic analysis based on meta‐analysis. |
| Ratner 2003 | Review. |
| Saisho 2005 | No RCT. |
| Urakami 2007 | Not RCT |
| Wutte 2007 | RCT, assessing dose response relationship of determir and NPH over 24 hours, without regarding efficacy or adverse outcomes. |
Characteristics of ongoing studies [ordered by study ID]
Alcolado 2001.
| Trial name or title | Efficacy and safety of basal insulin analogue detemir and NPH insulin in patients with Type 1 diabetes on basal‐bolus regimen |
| Methods | |
| Participants | Patients with type 1 diabetes attending diabetes ceter |
| Interventions | Detemir vs. NPH |
| Outcomes | ? |
| Starting date | 1.2.01 |
| Contact information | Dr. John Alcolado |
| Notes |
Page 2001.
| Trial name or title | 16 week multi‐center, open, randomised 3 group parallel study comparing insulin detemir with NPH |
| Methods | |
| Participants | Patients with type 1 diabetes |
| Interventions | Detemir vs. NPH |
| Outcomes | ? |
| Starting date | 1.2.01 |
| Contact information | Dr. M.D. Page |
| Notes |
Contributions of authors
MOSHE VARDI: Protocol writing, data search and extraction, quality assessment, data analysis and review production.
EYAL JACOBSON: Data search and extraction, quality assessment and review production.
ASAPH NINI Protocol writing.
HAIM BITTERMAN: Review assessment and professional advising.
Declarations of interest
None known.
New
References
References to studies included in this review
Ashwell 2006 {published data only}
- Ashwell SG, et al. Improved glycaemic control with insulin glargine plus insulin lispro: a multicentre, randomized, cross‐over trial in people with Type 1 diabetes. Diabetic Medicine 2006;23(3):285‐92. [DOI] [PubMed] [Google Scholar]
Chatterjee 2007 {published data only}
- Chatterjee S, Jarvis‐Kay J, Rengarajan T, Lawrence IG, McNally PG, Davies MJ. Glargine versus NPH insulin: Efficacy in comparison with insulin aspart in a basal bolus regimen in type 1 diabetes—The glargine and aspart study (GLASS). A randomised cross‐over study. Diabetes Research and Clinical Practice 2006;77:215‐22. [DOI] [PubMed] [Google Scholar]
De Leeuw 2005 {published data only}
- De Leeuw, et al. Insulin detemir used in basal‐bolus therapy in people with type 1 diabetes is associated with a lower risk of nocturnal hypoglycaemia and less weight gain over 12 months in comparison to NPH insulin. Diabetes, Obesity & Metabolism 2005;7(1):73‐82. [DOI] [PubMed] [Google Scholar]
Francis 1986 {published data only}
- Francis AJ, Hanning I, Alberti KGMM. Human ultralente insulin: A comparison with porcine lente insulin as a twice‐daily insulin in insulin‐dependent diabetic patients with fasting hyperglycaemia. Diabetes Research 1986;3(5):263‐8. [PubMed] [Google Scholar]
Fulcher 2005 {published data only}
- Fulcher GR, Gilbert RE, Yue DK. Glargine is superior to neutral protamine Hagedorn for improving glycated haemoglobin and fasting blood glucose levels during intensive insulin therapy. Internal Medicine Journal 2005;35(9):536‐42. [DOI] [PubMed] [Google Scholar]
Hermansen 2001 {published data only}
- Hermansen K, et al. Comparison of the soluble basal insulin analog insulin detemir with NPH insulin: a randomized open crossover trial in type 1 diabetic subjects on basal‐bolus therapy. Diabetes Care 24;2:296‐301. [DOI] [PubMed] [Google Scholar]
Hermansen 2004 {published data only}
- Hermansen K, et al. Insulin analogues (insulin detemir and insulin aspart) versus traditional human insulins (NPH insulin and regular human insulin) in basal‐bolus therapy for patients with type 1 diabetes. Diabetologia 2004;47(4):622‐9. [DOI] [PubMed] [Google Scholar]
Home 2004 {published data only}
- Home P, et al. Insulin detemir offers improved glycemic control compared with NPH insulin in people with type 1 diabetes: a randomized clinical trial. Diabetes Care 2004;27(5):1081‐7. [DOI] [PubMed] [Google Scholar]
Home 2005 {published data only}
- Home PD, et al. A randomized multicentre trial of insulin glargine compared with NPH insulin in people with type 1 diabetes. Diabetes/Metabolism Research Reviews 2005;21(6):545‐53. [DOI] [PubMed] [Google Scholar]
- Witthaus E, Stewart J, Bradley C. Treatment satisfaction and psychological well‐being with insulin glargine compared with NPH in patients with Type 1 diabetes. Diabetic Medicine 2001;18:619‐25. [DOI] [PubMed] [Google Scholar]
Kolendorf 2006 {published data only}
- Kolendorf K, et al. Insulin detemir lowers the risk of hypoglycaemia and provides more consistent plasma glucose levels compared with NPH insulin in Type 1 diabetes. Diabetic Medicine 2006;23(7):729‐35. [DOI] [PubMed] [Google Scholar]
Murphy 2003 {published data only}
- Murphy NP, et al. Randomized cross‐over trial of insulin glargine plus lispro or NPH insulin plus regular human insulin in adolescents with type 1 diabetes on intensive insulin regimens. Diabetes Care 2003;26(3):799‐804. [DOI] [PubMed] [Google Scholar]
Pieber 2000 {published data only}
- Pieber TR, Eugene‐Jolchine I, Derobert E. Efficacy and safety of HOE 901 versus NPH insulin in patients with type 1 diabetes. The European Study Group of HOE 901 in type 1 diabetes. Diabetes Care 2000;23(2):157‐62. [DOI] [PubMed] [Google Scholar]
Porcellati 2004 {published data only}
- Porcellati F, et al. Better long‐term glycaemic control with the basal insulin glargine as compared with NPH in patients with Type 1 diabetes mellitus given meal‐time lispro insulin. Diabetic Medicine 2004;21(11):1213‐20. [DOI] [PubMed] [Google Scholar]
Raskin 2000 {published data only}
- Raskin P, et al. A 16‐week comparison of the novel insulin analog insulin glargine (HOE 901) and NPH human insulin used with insulin lispro in patients with type 1 diabetes. Diabetes Care 2000;23(11):1666‐71. [DOI] [PubMed] [Google Scholar]
Ratner 2000 {published data only}
- Ratner RE, et al. Less hypoglycemia with insulin glargine in intensive insulin therapy for type 1 diabetes. U.S. Study Group of Insulin Glargine in Type 1 Diabetes. Diabetes Care 2000;23(5):639‐43. [DOI] [PubMed] [Google Scholar]
Robertson 2007 {published data only}
- Robertson KJ, Schoenle E, Gucev Z, Mordhorst L, Gall MA, Ludvigsson J. Insulin detemir compared with NPH insulin in children and adolescents with Type 1 diabetes. Diabetic medicine 2007;24:27‐34. [DOI] [PubMed] [Google Scholar]
Rosenstock 2000 {published data only}
- Rosenstock J, et al. Basal insulin glargine (HOE 901) versus NPH insulin in patients with type 1 diabetes on multiple daily insulin regimens. U.S. Insulin Glargine (HOE 901) Type 1 Diabetes Investigator Group. Diabetes Care 2000;23(8):1137‐42. [DOI] [PubMed] [Google Scholar]
Rossetti 2003 {published data only}
- Rossetti P, Pampanelli S, Fanelli C, Porcellati F, Costa E, Torlone E, et al. Intensive replacement of basal insulin in patients with type 1 diabetes given rapid‐acting insulin analog at mealtime: a 3‐month comparison between administration of NPH insulin four times daily and glargine insulin at dinner or bedtime. Diabetes Care 2003;26(5):1490‐6. [Intensive replacement of basal insulin in patients with type 1 diabetes given rapid‐acting insulin analog at mealtime: a 3‐month comparison between administration of NPH insulin four times daily and glargine insulin at dinner or bedtime. Diabetes Care. 2003 May;26(5):1490‐6. Rossetti P, Pampanelli S, Fanelli C, Porcellati F, Costa E, Torlone E, Scionti L, Bolli GB. Related Articles, Links Intensive replacement of basal insulin in patients with type 1 diabetes given rapid‐acting insulin analog at mealtime: a 3‐month comparison between administration of NPH insulin four times daily and glargine insulin at dinner or bedtime. Diabetes Care. 2003 May;26(5):1490‐6.] [DOI] [PubMed] [Google Scholar]
Russell‐Jones 2004 {published data only}
- Russell‐Jones D, et al. Effects of QD insulin detemir or neutral protamine Hagedorn on blood glucose control in patients with type I diabetes mellitus using a basal‐bolus regimen. Clinical Therapeutics 2004;26(5):724‐36. [DOI] [PubMed] [Google Scholar]
Schober 2001 {published data only}
- Schober E, et al. Comparative trial between insulin glargine and NPH insulin in children and adolescents with type 1 diabetes. Diabetes Care 2001;24(11):2005‐6. [DOI] [PubMed] [Google Scholar]
Tunbridge 1989 {published data only}
- Tunbridge FK, et al. A comparison of human ultralente‐ and lente‐based twice‐daily injection regimens. Diabetic Medicine 1989;6(6):496‐501. [DOI] [PubMed] [Google Scholar]
Vague 2003 {published data only}
- Vague P, Selam JL, Skeie S, Leeuw I, Elte JW, Haahr H, Kristensen A, Draeger E. Insulin detemir is associated with more predictable glycemic control and reduced risk of hypoglycemia than NPH insulin in patients with type 1 diabetes on a basal‐bolus regimen with premeal insulin aspart. Diabetes Care 2003;26(3):590‐6. [DOI] [PubMed] [Google Scholar]
Zinman 1999 {published data only}
- Zinman B, et al. Effectiveness of human ultralente versus NPH insulin in providing basal insulin replacement for an insulin lispro multiple daily injection regimen. A double‐blind randomized prospective trial. The Canadian Lispro Study Group. Diabetes Care 1999;22(4):603‐8. [DOI] [PubMed] [Google Scholar]
References to studies excluded from this review
Albright 2004 {published data only}
- Albright ES, Desmond R, Bell DS. Efficacy of conversion from bedtime NPH insulin injection to once‐ or twice‐daily injections of insulin glargine in type 1 diabetic patients using basal/bolus therapy. Diabetes Care 2004;27(2):632‐3. [DOI] [PubMed] [Google Scholar]
Alemzadeh 2003 {published data only}
- Alemzadeh R, et al. Beneficial effects of flexible insulin therapy in children and adolescents with type 1 diabetes mellitus. Acta Diabetologica 40;3:137‐42. [DOI] [PubMed] [Google Scholar]
Alemzadeh 2005 {published data only}
- Alemzadeh R, Berhe T, Wyatt DT. Flexible insulin therapy with glargine insulin improved glycemic control and reduced severe hypoglycemia among preschool‐aged children with type 1 diabetes mellitus. Pediatrics 2005;115(5):1320‐4. [DOI] [PubMed] [Google Scholar]
Heise 2003 {published data only}
- Heise T, et al. Lower Within‐Subject Variability of Insulin Detemir in Comparison to NPH Insulin and Insulin Glargine in People With Type 1 Diabetes. Diaetes 2003;53:1614‐20. [DOI] [PubMed] [Google Scholar]
Hershon 2004 {published data only}
- Hershon KS, et al. Once‐daily insulin glargine compared with twice‐daily NPH insulin in patients with type 1 diabetes. Endocrine Practice 2004;10(1):10‐7. [DOI] [PubMed] [Google Scholar]
Herwig 2007 {published data only}
- Herwig J, Scholl‐Schilling G, Bohles H. Glycaemic control and hypoglycaemia in children, adolescents and young adults with unstable type 1 diabetes mellitus treated with insulin glargine or intermediate‐acting insulin. Jounal of pediatric endocrinology and metabolism 2007;20(4):517‐25. [DOI] [PubMed] [Google Scholar]
Kiess 2004 {published data only}
- Kiess W, et al. Insulin detemir offers improved glycemic control compared with NPH insulin in people with type 1 diabetes. Diabetes Care 2004;27(10):2567‐8. [DOI] [PubMed] [Google Scholar]
Lepore 2000 {published data only}
- Lepore M, Pampanelli S, Fanelli C, Porcellati F, Bartocci L, Di VA, et al. Pharmacokinetics and pharmacodynamics of subcutaneous injection of long‐acting human insulin analog glargine, NPH insulin, and ultralente human insulin and continuous subcutaneous infusion of insulin lispro. Diabetes 2000;49(12):2142‐8. [DOI] [PubMed] [Google Scholar]
Lepore 2003 {published data only}
- Lepore G, et al. Both continuous subcutaneous insulin infusion and a multiple daily insulin injection regimen with glargine as basal insulin are equally better than traditional multiple daily insulin injection treatment. Diabetes Care 2003;26(4):1321‐2. [DOI] [PubMed] [Google Scholar]
Manini 2007 {published data only}
- Manini R, Forlani G, Moscatiello S, Zannoni C, Marzocchi R, Marchesini G. Insulin glargine improves glycemic control and health‐related quality of life in type 1 diabetes. Nutrition, Metabolism & Cardiovascular Diseases 2007;17:493‐8. [DOI] [PubMed] [Google Scholar]
Mimouni 1979 {published data only}
- Mimouni M, et al. Comparison of one daily injection of NPH and crystalline PZI insulins on urinary glucose in diabetic children. Acta Diabetologica Latina 1979;16(1):63‐6. [DOI] [PubMed] [Google Scholar]
Moretti 2005 {published data only}
- Moretti V, et al. Treatment with glargine in adolescents with type 1 diabetes mellitus: Clinical and metabolic control after 9 months. Rivista Italiana di Medicina Dell'Adolescenza 2005;3(1):36‐41. [Google Scholar]
Palmer 2004 {published data only}
- Palmer AJ, et al. Cost‐effectiveness of detemir‐based basal/bolus therapy versus NPH‐based basal/bolus therapy for type 1 diabetes in a UK setting: an economic analysis based on meta‐analysis results of four clinical trials. Current Medical Research & Opinion 2004;20(11):1729‐46. [DOI] [PubMed] [Google Scholar]
Ratner 2003 {published data only}
- Ratner R. Insulin glargine versus NPH insulin in patients with type 1 diabetes. Drugs of Today 2003;39(11):867‐76. [DOI] [PubMed] [Google Scholar]
Saisho 2005 {published data only}
- Saisho Y, et al. Effect of switching from NPH insulin to insulin glargine on glycemic control in Japanese type 1 diabetic patients. Journal of the Japan Diabetes Society 2005;48(9):685‐91. [Google Scholar]
Urakami 2007 {published data only}
- Urakami T, et al. Usefulness of long acting insulin analogue glargine in basal‐bolus therapy for Japanese children and adolscents with type 1 diabetes mellitus. Journal of Pediatric endocrinology and metabolism 2007;20:807‐15. [DOI] [PubMed] [Google Scholar]
Wutte 2007 {published data only}
- Wutte A, et al. Proportional dose‐response relationship and lower within‐patient variability of insulin detemir and NPH insulin in subjects with type 1 diabetes mellitus. Exp Clin Endocrinol Diabetes 2007;115(7):461‐7. [DOI] [PubMed] [Google Scholar]
References to ongoing studies
Alcolado 2001 {unpublished data only}
- Efficacy and safety of basal insulin analogue detemir and NPH insulin in patients with Type 1 diabetes on basal‐bolus regimen. Ongoing study 1.2.01.
Page 2001 {published data only}
- Page M. 16 week multi‐center, open, randomised 3 group parallel study comparing insuln determir with NPH. The National Research Register (NRR) Archive.
Additional references
ADA 1997
- American Diabetes Association. Report on the Expert Committee on the Diagnosis and Classification of Diabetes Mellitus. Diabetes Care 1997;20 Suppl 1:S5‐20. [DOI] [PubMed] [Google Scholar]
ADA 1999
- The Expert Committee on the Diagnosis and Classification of Diabetes Mellitus. Report of the Expert Committee on the diagnosis and classification of diabetes mellitus. Diabetes Care 1999;22 Suppl 1:S5‐19. [DOI] [PubMed] [Google Scholar]
Bolli 1999
- Bolli GB, Marchi RD, Park GD, Pramming S, Koivisto VA. Insulin analogues and their potential in the management of diabetes mellitus. Diabetologia 1999;42:1151‐67. [DOI] [PubMed] [Google Scholar]
Cohen 1960
- Cohen J. A coefficient of agreement for nominal scales. Educational and Psychological Measurement 1960;20:37‐46. [Google Scholar]
Havelund 2004
- Havelund S, Plum A, Ribel U, Jonassen I, Volund A, Markussen J, et al. The mechanism of protraction of insulin detemir, a long‐acting, acylated analog of human insulin. Pharmaceutical research 2004;21(8):1498‐504. [DOI] [PubMed] [Google Scholar]
Heinemann 2000
- Heinemann L, Linkeschova R, Rave K, Hompesch B, Sedlak M, Heise T. Time‐action profile of the long‐acting insulin analog insulin glargine (HOE901) in comparison with those of NPH insulin and placebo. Diabetes Care 2000;23(5):644‐9. [DOI] [PubMed] [Google Scholar]
Heise 2004
- Heise T, Nosek L, Ronn BB, Endahl L, Heinemann L, Kapitza C, et al. Lower within‐subject variability of insulin detemir in comparison to NPH insulin and insulin glargine in people with type 1 diabetes. Diabetes 2004;53(6):1614‐20. [DOI] [PubMed] [Google Scholar]
Higgins 2002
- Higgins JPT, Thompson SG. Quantifying heterogeneity in a meta‐analysis. Statistics in Medicine 2002;21:1539‐58. [DOI] [PubMed] [Google Scholar]
Higgins 2003
- Higgins JPT, Thompson SG, Deeks JJ, Altman DG. Measuring inconsistency in meta‐analyses. BMJ 2003;327:557‐60. [DOI] [PMC free article] [PubMed] [Google Scholar]
Higgins 2005
- Higgins JPT, Green S, editors. Cochrane Handbook for Systematic Reviews of Interventions 4.2.5 [updated May 2005]. In: The Cochrane Library, Issue 3, 2005. Chichester, UK: John Wiley & Sons, Ltd.
Hirsch 1998
- Hirsch IB. Intensive treatment of type 1 diabetes. The Medical clinics of North America 1998;82:689‐719. [DOI] [PubMed] [Google Scholar]
Horvath 2007
- Horvath K, Jeitler K, Berghold A, Ebrahim SH, Gratzer TW, Plank J, Kaiser T, Pieber TR, Siebenhofer A. Long‐acting insulin analogues versus NPH insulin (human isophane insulin) for type 2 diabetes mellitus. Cochrane Database of Systematic Reviews 2007, Issue 2. [DOI: 10.1002/14651858.CD005613.pub3] [DOI] [PubMed] [Google Scholar]
Jadad 1996
- Jadad AR, Moore RA, Carroll D, Jenkinson C, Reynolds DJ, Gavaghan DJ, et al. Assessing the quality of reports of randomized clinical trials: Is blinding necessary?. Controlled Clinical Trials 1996;17:1‐12. [DOI] [PubMed] [Google Scholar]
Kurtzhals 2000
- Kurtzhals P, Schaffer L, Sorensen A, Kristensen C, Jonassen I, Schmid C, et al. Correlations of receptor binding and metabolic and mitogenic potencies of insulin analogs designed for clinical use.. Diabetes 2000;49(6):999‐1005. [DOI] [PubMed] [Google Scholar]
Moher 1999
- Moher D, Cook DJ, Eastwood S, Olkin I, Rennie D, Stroup DF. Improving the quality of reports of meta‐analyses of randomised controlled trials: the QUOROM statement. Quality of Reporting of Meta‐analyses. Lancet 1999;354(9193):1896‐900. [DOI] [PubMed] [Google Scholar]
Rizza 1986
- Rizza R, O'Brien P, Service F. Use of beef ultralente for basal insulin delivery: plasma insulin concentrations after chronic ultralente administration in patients with IDDM. Diabetes Care 1986;9:120‐3. [DOI] [PubMed] [Google Scholar]
Rosenstock 2005
- Rosenstock J, Dailey G, Massi‐Benedetti M, Fritsche A, Lin Z, Salzman A. Reduced hypoglycemia risk with Insulin Glargine: A meta‐analysis comparing insulin glargine with human NPH insulin in type 2 diabetes. Diabetes Care 2005;28:950‐5. [DOI] [PubMed] [Google Scholar]
Rosskamp 1999
- Rosskamp R, Park G. Long acting insulin analogues. Diabetes Care 1999;22 (Suppl 2):B109‐13. [PubMed] [Google Scholar]
Schulz 1995
- Schulz KF, Chalmers I, Hayes RJ, Altman DG. Empirical evidence of bias: dimensions of methodological quality associated with estimates of treatment effects in controlled trials. JAMA 1995;237:408‐12. [DOI] [PubMed] [Google Scholar]
WHO 1980
- WHO Expert Committee on Diabetes Mellitus. Second report. Technical Report Series 646. Geneva. WHO, 1980. [PubMed]
WHO 1985
- WHO Expert Committee on Diabetes Mellitus. World Health Organization, 1985. Technical Report Series 727. [PubMed]
WHO 1998
- Alberti KM, Zimmet PZ. Definition, diagnosis and classification of diabetes mellitus and its compliactions. Part I: diagnosis and classification of diabetes mellitus. Provisional report of a WHO consultation. Diabetic Medicine 1998;15:539‐53. [DOI] [PubMed] [Google Scholar]
Witthaus 2001
- Witthaus E, Stewart J, Bradley C. Treatment satisfaction and psychological well‐being with insulin glargine compared with NPH in patients with Type 1 diabetes. Diabetic Medicine 2001;18:619‐25. [DOI] [PubMed] [Google Scholar]


