. 2019 Apr 8;8:e42930. doi: 10.7554/eLife.42930

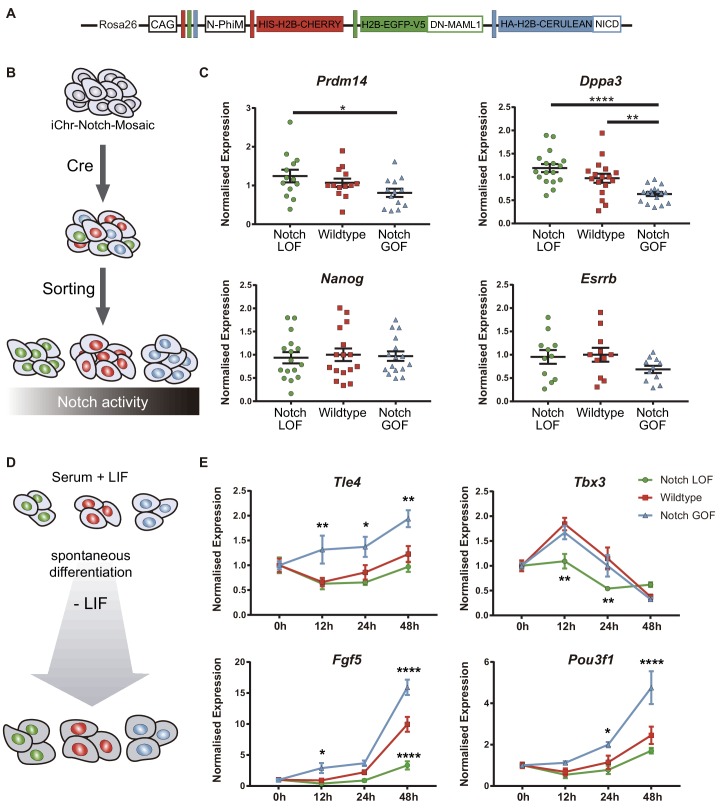
Figure 6. Notch promotes exit from naïve pluripotency and cell differentiation of ES cells.

(A) Construct showing the wildtype (red), Notch loss of function (green) and Notch gain of function (blue) cassettes from iChr-Notch-Mosaic ES cells. (B) Schematic diagram of experimental design, where iChr-Notch-Mosaic ES cells were recombined with Cre and sorted according to Notch activity. (C) Prdm14, Dppa3, Nanog and Esrrb normalised expression in iChr-Notch-Mosaic ESCs after sorting of Notch LOF, wildtype and Notch GOF populations (n = 13 for Prdm14, n = 17 for Dppa3, n = 16 for Nanog, n = 11 for Esrrb). (D) Schematic diagram of experimental design, where sorted recombined iChr-Notch-Mosaic ES cells were differentiated after LIF removal. (E) Tle4, Tbx3, Fgf5 and Pou3f1 normalised expression in Notch LOF, Wildtype and Notch GOF cells at 0 hr, 12 hr, 24 hr and 48 hr after LIF withdrawal (n = 6). Data are means ± s.e.m. *p<0.05, **p<0.01, ***p<0.001, ****p<0.0001 in relation to wildtype cells by ANOVA with Fisher post-test.

Figure 6.

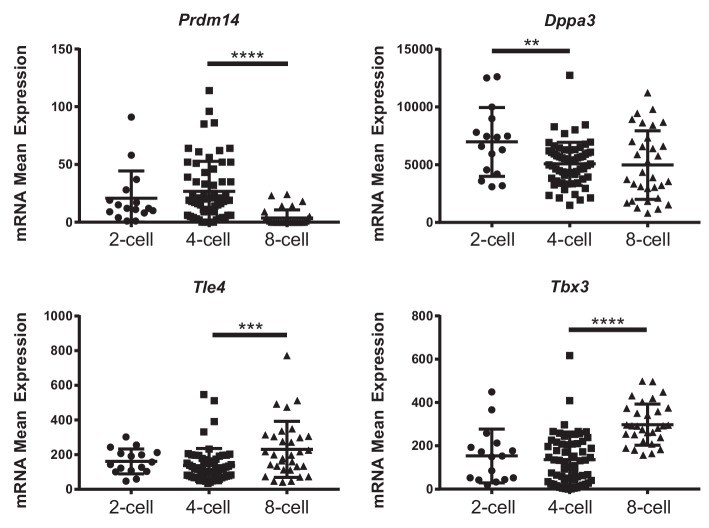
Figure 6—figure supplement 1. Expression of naïve pluripotency markers in the preimplantation embryo.

Figure 6—figure supplement 1.

Expression of Pdrm14, Dppa3, Tle4 and Tbx3 in 2-, 4- and 8-cell stage single-cell RNA-seq data from Goolam et al. (2016). Data are means ± s.d. **p<0.01, ***p<0.001, ****p<0.0001 by ANOVA with Fisher post-test.
Figure 6—figure supplement 2. Notch inhibition increases Prdm14 in the 4 cell embryo.
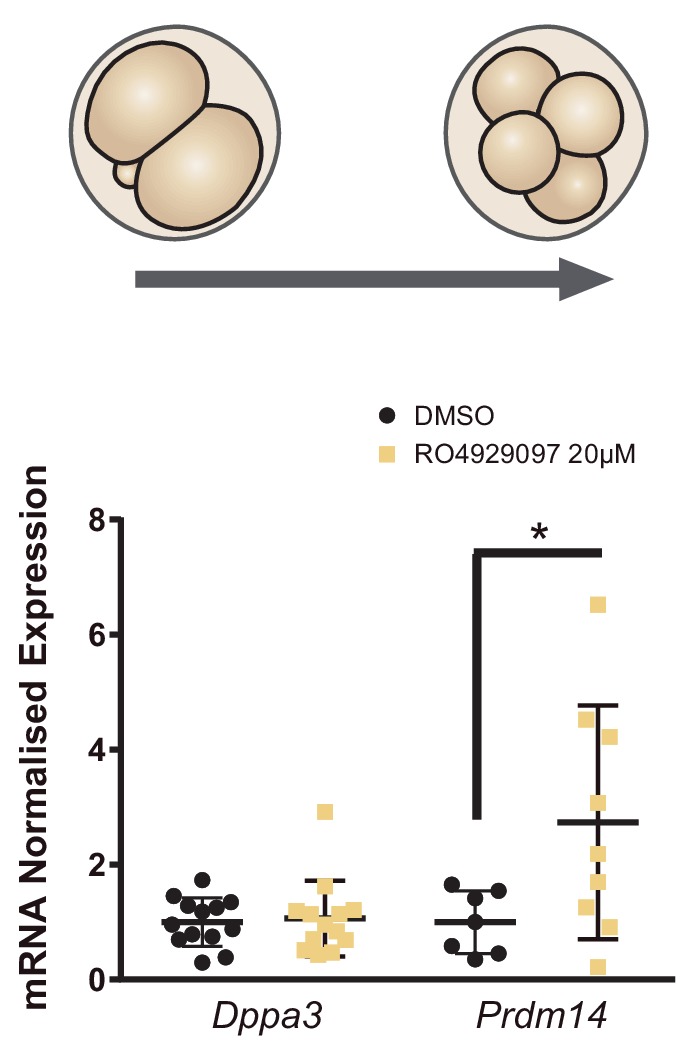
Figure 6—figure supplement 2.

Dppa3 and Prdm14 relative expression in pools of 30 embryos after treatment with RO4929097 to block Notch from 2- to 4-cell stage. Pools of embryos treated with DMSO were used as controls (n = 7–13) n represents number of unique pools of embryos. Data are means ± s.d. *p<0.05 by Student’s t-test.
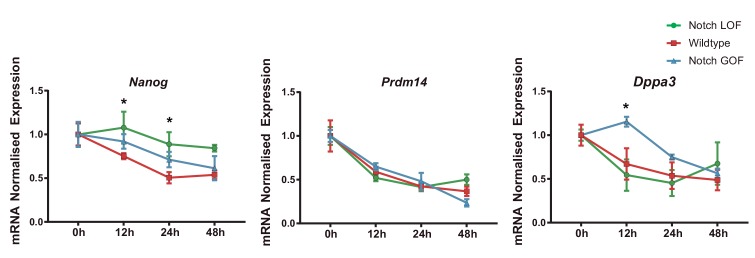
Figure 6—figure supplement 3. Expression of naïve pluripotency markers in differentiating ES cells.

Figure 6—figure supplement 3.

Nanog, Prdm14 and Dppa3 relative expression in Notch LOF, Wildtype and Notch GOF ES cells at 0 hr, 12 hr, 24 hr and 48 hr after LIF withdrawal to promote differentiation (n = 6). Data are means ± s.e.m. *p<0.05 by ANOVA with Fisher post-test.
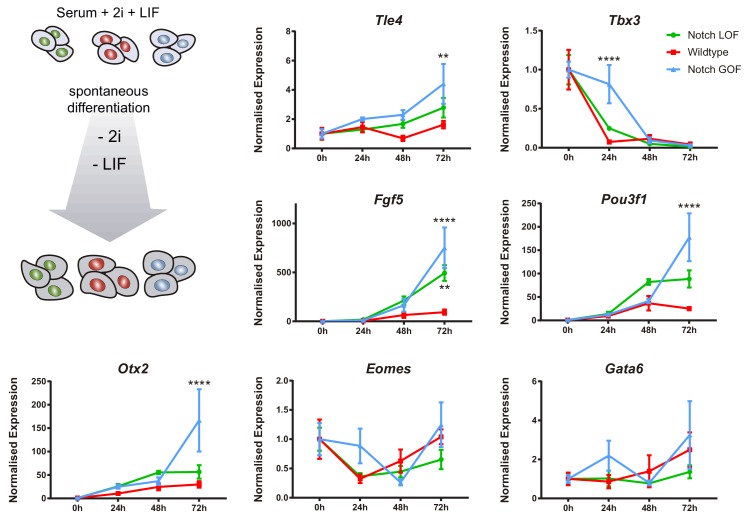
Figure 6—figure supplement 4. Notch promotes differentiation of naïve ES cells.

Figure 6—figure supplement 4.

Schematic diagram of experimental design, where naïve iChr-Notch-Mosaic ES cells cultured in 2i + LIF conditions were differentiated after removal of 2i + LIF (left). Tle4, Tbx3, Fgf5, Pou3f1, Otx2, Eomes and Gata6 normalised expression in Notch LOF, Wildtype and Notch GOF cells at 0 hr, 24 hr, 48 hr and 72 hr after 2i + LIF withdrawal (n = 3–4). Data are means ± s.e.m. *p<0.05, **p<0.01, ***p<0.001, ****p<0.0001 in relation to wildtype cells by ANOVA with Fisher post-test.