

Abstract
Although rapid progress has been made in computational approaches for prioritizing cancer driver genes, research is far from achieving the ultimate goal of discovering a complete catalog of genes truly associated with cancer. Driver gene lists predicted from these computational tools lack consistency and are prone to false positives. Here, we developed an approach (DriverML) integrating Rao’s score test and supervised machine learning to identify cancer driver genes. The weight parameters in the score statistics quantified the functional impacts of mutations on the protein. To obtain optimized weight parameters, the score statistics of prior driver genes were maximized on pan-cancer training data. We conducted rigorous and unbiased benchmark analysis and comparisons of DriverML with 20 other existing tools in 31 independent datasets from The Cancer Genome Atlas (TCGA). Our comprehensive evaluations demonstrated that DriverML was robust and powerful among various datasets and outperformed the other tools with a better balance of precision and sensitivity. In vitro cell-based assays further proved the validity of the DriverML prediction of novel driver genes. In summary, DriverML uses an innovative, machine learning-based approach to prioritize cancer driver genes and provides dramatic improvements over currently existing methods. Its source code is available at https://github.com/HelloYiHan/DriverML.
INTRODUCTION
Cancer is a genetic disease with somatically acquired genomic aberrations. Driver mutations are required for the cancer phenotype, whereas passenger mutations are irrelevant to tumor development and accumulate through DNA replication (1). Several major cancer sequencing projects, such as The Cancer Genome Atlas (TCGA), the International Cancer Genome Consortium (ICGC) and the Therapeutically Applicable Research to Generate Effective Treatments (TARGET), have created a comprehensive catalog of somatic mutations across all major cancer types (2,3). A major goal of these sequencing projects is to identify cancer genes with mutations that drive the cancer phenotype. Better identification of cancer driver genes would inform potential therapies targeted against the products of these aberrant genomic alterations in addition to fundamentally advancing the knowledge of tumor initiation, promotion and progression (4,5).
Many bioinformatics tools dedicated to driver gene identification with multi-dimensional genomic data have been developed. Most of these tools can be classified into three categories based on their basic principles (Figure 1A). The first category is frequency-based methods, which consist of identifying genes that are more frequently mutated than the background mutation rate (BMR) (6–13). MutSigCV is one such tool. It is widely used for TCGA projects (9). Its significant feature is the correction for patient-specific and gene-specific mutational heterogeneities by incorporating DNA replication timing and transcriptional activity. This can eliminate most of the apparent artifacts. The second category is sub-network methods, which attempt to identify groups of driver genes based on prior knowledge of pathways, proteins or genetic interactions (14–21). For instance, the DawnRank tool ranks candidate driver genes based on their impact on the expression of downstream genes in molecular interaction networks (20). One of the advantages of sub-network methods is their ability to identify driver genes with low recurrence (22). The third category is hotspot-based methods (23–26). The term hotspot refers to hotspot mutation regions, which are driven by positive selection and especially located in functional domains or important residues for three-dimensional protein structures (27,28). One of the representative hotspot-based methods is OncodriveCLUST, which detects driver genes with a significant bias toward mutations clustered within specific protein sequence regions (24). Hotspot methods are optimal for identifying gain-of-function mutations (i.e. oncogenes) in specific protein regions, whereas loss-of-function sites (i.e. tumor suppressors) resulting randomly from truncated mutations may be missed.
Figure 1.
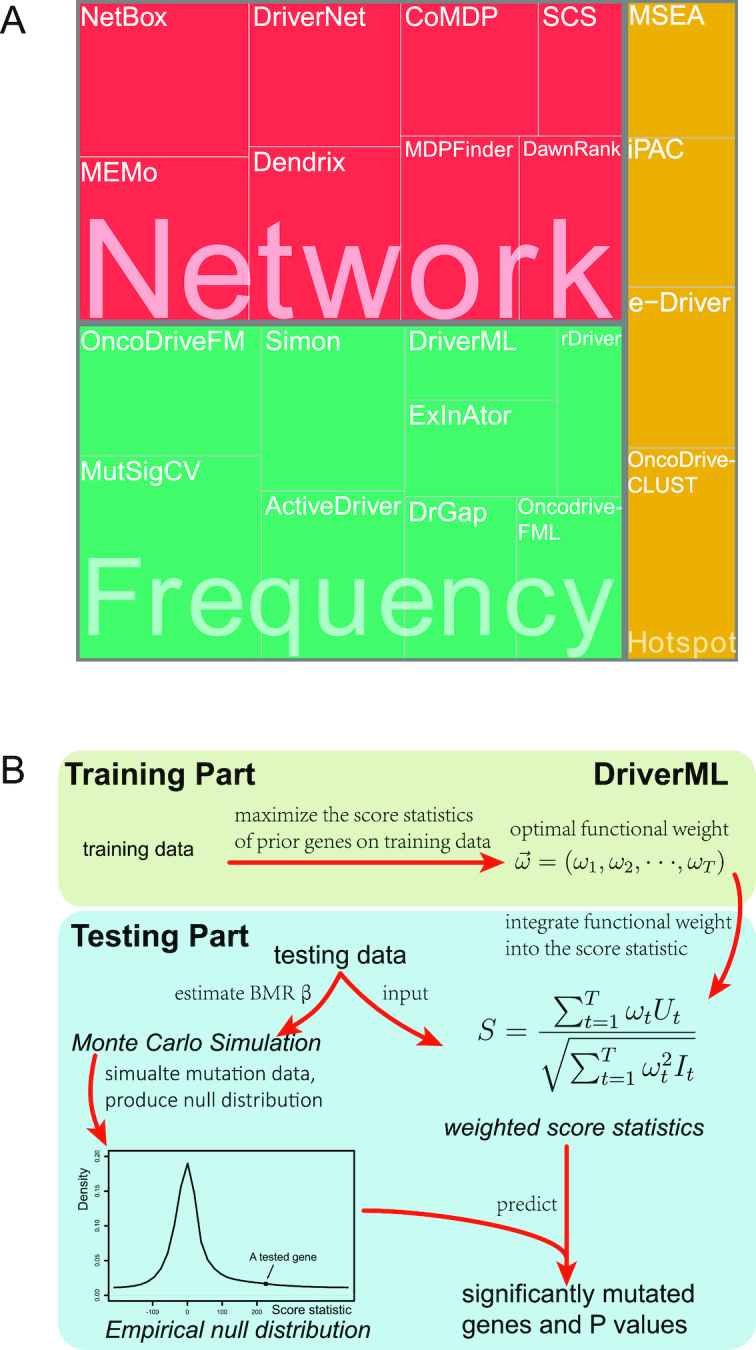
Computational tools for identifying cancer driver genes. (A) Classification of 21 driver gene prediction tools evaluated in this study. These widely used tools are classified as frequency-based, hotspot-based and network-based methods. The block size for each tool represents its citation times according to data obtained from the Web Of Science on 27 September 2018 (the larger block size, the more the citation times). MutSigCV is a widely used tool that is the most frequently cited in the literature. It has the largest block size. Two up-to-date tools, rDriver and SCS (published in 2018), along with DriverML, had no citation, and had the smallest block size. (B) Summary of the main workflow of DriverML. DriverML identifies cancer driver genes by combining a weighted score test and machine learning approach. The weights ( , T represents the total number of mutation types evaluated in this study) in the score statistics quantify the functional impacts of different mutation types on the protein. To assign optimal weights to different types of non-silent mutations, the score statistics of prior driver genes were maximized in pan-cancer training data based on the machine learning approach. The U and I represent the Rao score function and Fish information, respectively. To test cancer driver genes, the score value of each gene was computed with the weighted score statistic with the learned weight parameters. The empirical null distribution of score statistics, from which P-values of tested genes were calculated, was generated by Monte Carlo simulation.
Despite the rapid progress in computational approaches to prioritize cancer driver genes with the advent of next-generation sequencing technologies, the ultimate goal of discovering a complete catalog of genes truly associated with cancer is far from being achieved. Driver gene lists predicted from these tools lack consistency (22,27,29). On the one hand, the number of drivers predicted in some cancer types varies by more than 100-fold across these tools. On the other hand, driver genes predicted by different tools differ greatly. Only a few driver genes predicted by different tools overlap (29). Furthermore, many tools are not optimally balanced between precision and sensitivity (20). Some tools are over ambitious and yield too many false-positive calls, while others are overly conservative and risk missing many true drivers. Therefore, there is a pressing need to develop reliable and powerful tools to prioritize cancer driver genes and optimize the balance between precision and sensitivity.
Different types of mutations may have different functional impacts on protein function. We developed a supervised machine learning approach (DriverML) for scoring functional consequences of DNA sequence alterations to identify cancer driver genes (Figure 1B). The proposed score statistic integrated a set of parameters to weight the functional impacts of different types of mutations. To obtain optimized weight parameters, the score statistics of prior driver genes were maximized on pan-cancer training data based on the machine learning approach. We conducted rigorous and unbiased comparisons of DriverML with 20 other driver gene prediction methods on 31 independent datasets from TCGA (Supplementary Table S1). Our comprehensive evaluations demonstrated that DriverML was robust among various datasets and outperformed the other tools by better balancing precision and sensitivity.
METHODS AND MATERIALS
Overview of DriverML
DriverML identifies cancer driver genes by combining a weighted score test and machine learning approach (Figure 1B). It provides several prominent features that were either naïvely obtained or unattainable by previous tools. First, Rao’s score statistic is mathematically suitable to combine multiple components with a set of weight parameters to produce a weighted global statistic (30). For driver gene prediction, each type of mutation (e.g. missense, nonsense, splice site, frameshift insertion/deletion (indel) and in-frame indel) is regarded as one component. The weighted score statistic that combines all mutations can globally test each gene across the genome. Second, the weights in the score statistics quantify the functional impacts of different mutation types on the protein. To assign optimal weights to the different types of nonsilent mutations, the score statistics of prior driver genes were maximized on pan-cancer training data based on the machine learning approach. Third, in reality, the BMR of some tumors is too low to observe any occurrences of a certain type of mutation in samples. This may violate the central limit theorem under which the score statistic is derived. Thus, a Poisson process was used to model the random nature of somatic mutations (10); instead, a P-value of the score statistic was obtained by Monte Carlo simulations. Our driver gene prediction approach was implemented by a set of R and Perl scripts, which were integrated into the DriverML analysis pipeline (https://github.com/HelloYiHan/DriverML).
Rao’s score test
The test has five suppositions. First, the analyzed dataset consists of  patients (samples),
  genes and
  mutation types (Supplementary Figure S1). Second, the numbers of base pairs that can give rise to silent and nonsilent mutations of mutation type
  in gene
  are respectively denoted as
  and
and  Third, the numbers of actually observed silent and nonsilent mutations of mutation type
 in gene
  and patient
  are respectively denoted by
  and
and  . Fourth,
  denotes the BMR of mutation type
  of gene
  , in patient
  , and
, and  denotes the driver effect of mutation type
  in gene
  . Fifth, the number of silent and nonsilent mutations in mutation type
  , gene
  and patient
  follows a Poisson distribution with the parameters
  and
and  , respectively, where
  (10).
(10).
The Rao score statistic (31) is used to test the significance of a driver gene. The null hypothesis is  . It suggests that the tested gene
  does not have driver effects and is not a cancer driver. The alternative hypothesis is
  for some
  in
in . It suggests that at least one kind of mutation in the tested gene
  has driver effects and that the tested gene is likely a cancer driver. Observed silent and nonsilent mutation counts of type
  in gene
  from patient
  occur with the probability functions:
 |
(1) |
 |
(2) |
Equation (1) is used to compute the BMR. Details are subsequently provided in the ‘Background mutation model’ section. Equation (2) is used to derive the Rao score function as:
 |
(3) |
Its Fisher information is expressed as:
 |
(4) |
According to the central limit theorem, we can obtain the Rao score statistic and its asymptotic distribution under the null hypothesis:
 |
(5) |
The advantage of a score statistic is that it is mathematically suitable to integrate a set of weight as parameters (30). We can further deduce a weighted score statistic from equation (5) by integrating the functional impact of each mutation type, which can potentially improve the performance of our new algorithm. Specifically, the global weighted score statistic is obtained by summing the score function of all mutation types across all patient samples:
 |
(6) |
where the parameter  is the weight of the mutation type
  , which quantifies the functional impacts of mutations on the protein. Details are subsequently provided in the ‘Functional impact from machine learning’ section. Equation (6) is employed to test the significance of gene
  . The score statistic asymptotically follows the standard normal distribution under the null hypothesis, which requires large sample sizes. However, in reality, some tumors have too low mutation rate to observe any occurrences of a certain type of mutation in samples. Consequently, the distribution of the score statistic may not be a standard normal distribution under the null hypothesis. To remedy this problem, we proposed a simulation method to model the number of somatic mutations by the Poisson distribution. The simulated distribution serves well for this purpose. The simulation method is subsequently detailed in the ‘Monte Carlo simulation’ section. Detailed derivations of the above formulae are found in the Supplementary Methods.
Background mutation model
We previously computed BMR for each patient and mutation type using the empirical Bayesian method (10). Since the mutation rate varies across the genome and correlates with gene covariates (9), we improved the BMR estimation by accounting for gene-specific mutation heterogeneity. First, all genes in the mutation dataset are clustered according to their genomic contexts, including base composition, size of protein coding regions (CDS), replication time, expression level, local GC content and chromatin compartment (9). DriverML chooses as many clusters as possible based on the premise that the computed BMRs are all greater than zero, because the more clusters there are, the more accurate the computed BMR is. Interpolation is used to fill in missing values of gene characteristics. Second, the BMR of each cluster is computed with the empirical Bayes method as we previously described (10). The advantage of the use of the empirical Bayes method is its ability to borrow information from all the patient samples to estimate each BMR, which produces smoother estimates. Briefly, a prior beta distribution B(a,b) of  was used, which is more appropriate than the uniform distribution that was commonly used in previous studies. Since it is the conjugate prior of the binomial distribution, the posterior distribution is still a beta distribution. Thus, we can estimate
  .
.  and
and  as the moment estimations of the parameters
  and
and  , where
  is the sample mean and
  is the sample variance.
Functional impact from machine learning
The score statistic described above integrates a set of weight parameters  to quantify the functional impacts of different types of mutations on protein function. Five nonsilent somatic mutation types considered are missense, nonsense, splice site, frameshift indel and in-frame indel. Silent mutations are used to compute the BMR and do not need a parameter of functional impact. For each type of point nonsilent mutations, different base compositions are considered (Supplementary Figure S1). The functional impact of each mutation type is learned from the training data according to the principle of machine learning. Due to the driver effects, the weighted score statistic of a driver gene is expected to be larger than that of a passenger gene. Hence, for each prior driver gene in the training data, the weighted score statistic (equation 6) is maximized to obtain an optimal functional impact
  :
:  . For each mutation type, the estimated functional impact
  is then averaged over all prior genes in the training data and is used in the weighted score statistic (equation 6) to predict new cancer drivers in the testing data. To avoid the potential over-fitting problem, we used completely different datasets for training and testing. Non-TCGA datasets from ICGC and previous studies (32–34) were employed as training mutation data (Supplementary Table S2), whereas TCGA data as testing data (Supplementary Table S1). The prior gene lists were obtained from non-TCGA data in IntOGen (35) and DriverDBv2 databases (22,27). Since some cancer types are either not presented or have small sample sizes in non-TCGA datasets from ICGC and previous studies (32–34), we estimated general functional impact weights without regard to cancer types by using all of non-TCGA pan-cancer datasets.
Monte Carlo simulation
As described above in the ‘Rao’s score test’ section, the real distribution of the weighted score statistics (equation 6) is perhaps not asymptotically standard normal due to low BMR in tumor samples. Thus, the Monte Carlo procedure is used to generate a null distribution of score statistics from which empirical P-values could be computed for these statistics using real data. First, the random nature of somatic mutations is modeled by the Poisson distribution (10) under the null hypothesis:
 |
(7) |
where  denotes the number of simulated nonsilent mutations of mutation type
 in gene
  and patient
  .
. is the estimated BMR of mutation type
  in gene
  of patient
  . In each simulation, the
  dimension array of mutation data will be generated according to Poisson distribution, where P represents the total number of analyzed patients, G represents the total number of analyzed genes and T represents the total number of analyzed mutation types. Then, the weighted score statistic is computed for each gene from the simulated mutation data to form a null distribution. By default, simulations are repeated 10 000 times, which is sufficiently large to form an empirical distribution that satisfies the central limit theorem.
Calculation of empirical P-values
After the generation of simulated null distributions from the above Monte Carlo procedure, for each gene  , a score statistic is computed according to equation (6) using real data. Then, the P-value of that gene is estimated as
  , where n is the number of replicate samples that have been simulated and r is the number of these replicates that produce a score statistic greater than or equal to that calculated for the actual data. Finally, the Benjamini–Hochberg procedure (36) is applied to control the false discovery rate (FDR). Examples of generated null distribution versus observed statistics are provided in Supplementary Figure S2.
Implementation of DriverML
Three types of data—mutation data, training data and a mutation table—are input into DriverML. The mutation data in the Mutation Annotation Format (MAF) are input by a user, whereas the training data and mutation table are provided by the program and will be regularly updated upon the arrival of a newer version of gene annotation and more comprehensive prior information. The mutation table contains the number of base pairs in CDS of each gene that can give rise to different types of mutations. The output of DriverML is a summary of putative driver genes, including the numbers of each mutation type, value of the statistic, P-value and adjusted P-value. DriverML is implemented using a set of R, Perl and Shell scripts integrated into a user-friendly analysis pipeline. Source code and example data can be accessed at https://github.com/HelloYiHan/DriverML.
Data collection
Our comprehensive evaluations were based on DriverDBv2 database that was developed by our co-authors (22,27). The DriverDBv2 incorporated cancer driver genes was predicted by 15 commonly used tools from 31 TCGA datasets (Supplementary Table S1). The TCGA datasets covered all kinds of cancer mutation signatures and were large enough to evaluate these bioinformatics tools. MAF files of these TCGA datasets were preprocessed so that silent, missense, nonsense, splice site, frameshift insertion/deletion (indel) and in-frame indel mutation types were retained in subsequent analyses. Gene expression and copy number variation (CNV) data that are required for some methods were downloaded at GDC (https://portal.gdc.cancer.gov/). The gene list in Cancer Gene Census (CGC) was downloaded in April 2017 from the COSMIC website (https://cancer.sanger.ac.uk/cosmic). Mut-driver and HiConf driver gene lists were extracted from published studies (37,38) (Supplementary Table S3). In addition, the pan-cancer training data consisted of 145 788 somatic mutations encompassing 2263 tumor samples from 17 specific cancer types from non-TCGA samples in the ICGC datasets and previous studies (32–34) (Supplementary Table S2). These training samples did not overlap with any of the TCGA samples used for the evaluation and testing.
Other bioinformatics tools for cancer driver prediction
We comprehensively assessed DriverML by comparing it with 20 other commonly used tools for driver gene prediction in the 31 TCGA datasets. Predictions of driver genes in ActiveDriver, Dendrix, MDPFinder, Simon, NetBox, OncodriverFM, MutSigCV, MEMo, CoMDP, DawnRank, DriverNet, e-Driver, iPAC, MSEA and OncodriveCLUST were obtained from the DriverDBv2 database (27). In addition, five other top-of-the-line tools were also evaluated: DrGaP (10), OncodriveFML (12), rDriver (13), SCS (21) and ExInAtor (11). DriverML and the other five tools ran the same TCGA datasets as DriverDBv2, according to their manuals, with default parameters used. For those methods that can generate P-values, an adjusted P-value < 0.05 (i.e. FDR < 0.05) was used as the threshold to claim driver genes. For those methods that cannot produce P-values, the same criteria as DriverDB database were adopted instead (22,27) (Supplementary Table S4). In addition to mutation data, the SCS required tumor-normal paired expression and CNV data from the same patients. Only 19 TCGA datasets with available expression and CNV were computed with SCS. BiomaRt (39) was used to convert Ensembl id to gene symbol. Gene annotation file (release 19) for ExInAtor was downloaded from GENCODE (https://www.gencodegenes.org/).
In vitro cell-based assays
Cell culture
H520 and H1703 lung squamous cell carcinoma (LUSC) cell lines were obtained from American Type Culture Collection (Manassas, VA, USA). They were cultured under conditions specified by the manufacturer. All cells were grown at 37°C in an atmosphere of 95% air and 5% CO2.
Transient transfection with small interfering RNA (siRNA)
H520 and H1703 cells were transfected for 24 h with synthesized NPAT or negative control siRNA (GenePharma, Shanghai, China) using six-well plates with 50 nmol of siRNA and 4 μl of GenMute™ transfection reagent (SignaGen Laboratories, Rockville, MD, USA).
RNA isolation, real-time RT-PCR
TRIzol reagent (Invitrogen, Carlsbad, CA, USA) was used to extract RNA from cells. The primers for NPAT were 5′-CGCTGTGTTTGCTTTAACCTG-3′ and 5′-GAGATGACATTATTGCTGGGAC-3′. Quantitative RT-PCR was carried out using the ABI 7300 Real-Time PCR System (Invitrogen) in a 20-reaction volume containing 2 μl cDNA.
Cell proliferation assay
Cell proliferation was determined by incorporation of cell counting kit-8 (Dojindo Laboratories, Kumamoto, Japan). In brief, cells were transfected with siRNA using GeneMute™ reagent (SignaGen Laboratories). Twenty-four hours after transfection, ∼2000 cells were placed into each well of 96-well plates. CCK-8 solution was added at 0, 24, 48, 72 and 96 h after placing. After adding 10 μl CCK-8 solution, cells were incubated for 1.5 h at 37°C. The absorbance was measured at 450 nm.
Clone formation assay
Lung cancer cells were transfected with the siRNAs for 24 h. Cells (n = 1500) were then plated in wells of six-well culture plates and cultured in RPMI 1640 medium supplemented with 10% fetal bovine serum (FBS) for 1 week. These cells were fixed with methanol and stained with crystal violet solution.
Invasion assay
In vitro invasion assays were performed using Transwell chambers. H520 and 1703 cells were transfected with siRNA or negative siRNA for 24 h. The cells were cultured with serum-free RPMI 1640 for 24 h, detached and resuspended in serum-free RPMI 1640 medium. Cells (3 × 10⁴) suspended in 300 μl serum-free RPMI 1640 medium were added in the upper chambers of Transwell devices for the migration assay or the upper chambers coated with Matrigel for the invasion assay. For both assays, RPMI 1640 with 10% FBS was added to the bottom chamber. Migrating and invasive cells were stained with 0.1% crystal violet. Images were captured from either side of each membrane and the number of migrating cells was counted under a microscope.
Cell cycle assay
Cell cycle assay was used to detect whether NPAT regulated the cell cycle. Cells transfected with siRNA for 24 h were cultured with serum-free RIPM 1640 medium for 24 h. Next, cells were cultured with serum-containing medium for another 18 h. Cells were collected, fixed with ice-cold 70% ethanol for 20 min and stained with propidium iodide (PI; BD, San Diego, CA, USA). The cell cycle was determined by flow cytometry using a FACS Calibur apparatus (BD).
Western blotting
Cells were suspended in lysis buffer (50 mM Tris–HCl, pH 8.0, 1% sodium dodecyl sulfate (SDS), 1 mM ethylenediaminetetraacetic acid, 5 mM dithiothreitol, 10 mM phenylmethylsulfonyl fluoride, 1 mM NaF, 1 mM Na3VO4 and protease inhibitor cocktail) and denatured in boiling water for 10 min. The cell lysates were centrifuged at 13 000 rpm for 30 min. The protein concentration was determined using a BCA assay (Thermo Fisher Scientific, Waltham, MA, USA). Equal amounts of proteins (40 μg) were separated by 10% SDS-polyacrylamide gel electrophoresis (PAGE) and transferred to a polyvinylidene fluoride (PVDF) membrane. The membrane was blocked with 5% skim milk and immunoblotted with antibodies against Cyclin A2 (#BF683, Cell Signaling Technology, Beverly, MA, USA), Cyclin E2 (#4132, Cell Signaling Technology), p27 (#3680, Cell Signaling Technology) or glyceraldehyde-3-phosphate dehydrogenase (GAPDH, ab181602, Abcam, Cambridge, UK). Immunoreactive bands were developed by enhanced chemiluminescence reaction (Pierce, Rockford, IL, USA) following standard protocols.
RESULTS
Strategies for evaluating performance of various tools
Due to the lack of a generally accepted gold standard (i.e. bona fide cancer driver genes), it has been difficult to determine which software tools performed best and which, if any, of the software tools performed adequately in previous studies (18,20,29). However, two systematic benchmarking measures are useful indicators of the excellence of a method for driver gene prediction. One benchmark is the ability to recapitulate many of the well-studied cancer-associated genes. The CGC database manually curates a list of genes whose mutations have been causally implicated in cancer (40). It is widely acknowledged that a higher proportion of predictions in the CGC database indicates better performance (18,20,29). Besides this database, Vogelstein et al. reported a list of Mut-driver genes using their ‘20/20 rule’ (37). The Mut-driver genes were identified through their pattern of mutation rather than through their mutation frequency. In addition, a curated set of 99 high-confidence (HiConf) cancer genes was identified by Kumar et al. in a literature search (38). Overlap with the CGC, Mut-driver and HiConf gene lists is a benchmark for cancer driver genes, similar to the descriptions of Tokheim et al. (18,20,29).
The second benchmark is the ability to identify a core set of driver genes that are also predicted by several other methods. The likelihood that predicted driver genes are actually associated with cancer increases with the number of tools that identify them, because false positives of one tool are likely to be discarded by other tools (29,41).
In the above two benchmarks, the high proportion of unique predictions that do not overlap with the CGC, Mut-driver genes, HiConf genes or other methods are prone to false positives. On the contrary, too few predictions are prone to false negatives, without regard to the high fraction of drivers that overlap the CGC, Mut-driver genes, HiConf genes or other methods.
In the following sections, we benchmarked DriverML and 20 other computational tools according to the overlap of the predicted driver genes with those presented in the CGC, Mut-drivers and HiConf genes, and those identified by other methods in 31 cancer-specific mutation datasets from TCGA.
Driver gene lists predicted from different tools lack consistency
We performed a comprehensive evaluation of the novel DriverML and 20 other driver gene prediction tools in 31 independent datasets from TCGA using the above benchmarking measures. The number of drivers predicted in some cancer types varied by more than 100-fold among these tools (Supplementary Figure S3 and Supplementary Table S5). Overall, MEMo was over-conservative and predicted the smallest number of drivers per cancer type (median = 0), and no driver genes were identified in many cancer types (FDR < 0.05); whereas iPAC was too ambitious and identified the largest number of drivers per cancer type (median = 1740). DriverML identified a moderate number of drivers per cancer type (median = 11). In addition, the list of driver genes predicted by these 21 tools lacked consistency in the same TCGA datasets. For instance, NetBox predicted only two drivers, whereas iPAC predicted 4821 drivers in the same dataset of breast invasive carcinoma (BRCA). A total of 5741 drivers were identified by these 21 tools in BRCA. However, only eight genes were consistently detected by 10 or more of these tools. These results suggested that currently existing tools predicted a largely inconsistent list of cancer driver genes.
Ability to recapitulate genes casually implicated with cancer in the CGC database
There were 616 genes in the CGC database as of April 2017 (Supplementary Table S3). Figure 2 displays the proportion of predicted driver genes that were also presented in the CGC across the 31 TCGA datasets (Supplementary Table S6). Each panel represents one tool and is arranged in the order of its median fraction of predicted driver genes in the CGC. For a specific tool, the fraction of its predicted drivers in the CGC varied among different cancer types. The top five tools were DriverML, MutSigCV, rDriver, DawnRank and oncodriveFML. DriverML ranked first and 42.9% of its predicted driver genes were presented in the CGC. MutSigCV, DawnRank and rDriver tied for second place and 33.3% of their predicted driver genes overlapped with those of the CGC. The fraction of predicted drivers in the CGC was generally <10% using tools including MSEA, ExlnAtor, iPAC, CoMDP, MEMo and SCS.
Figure 2.
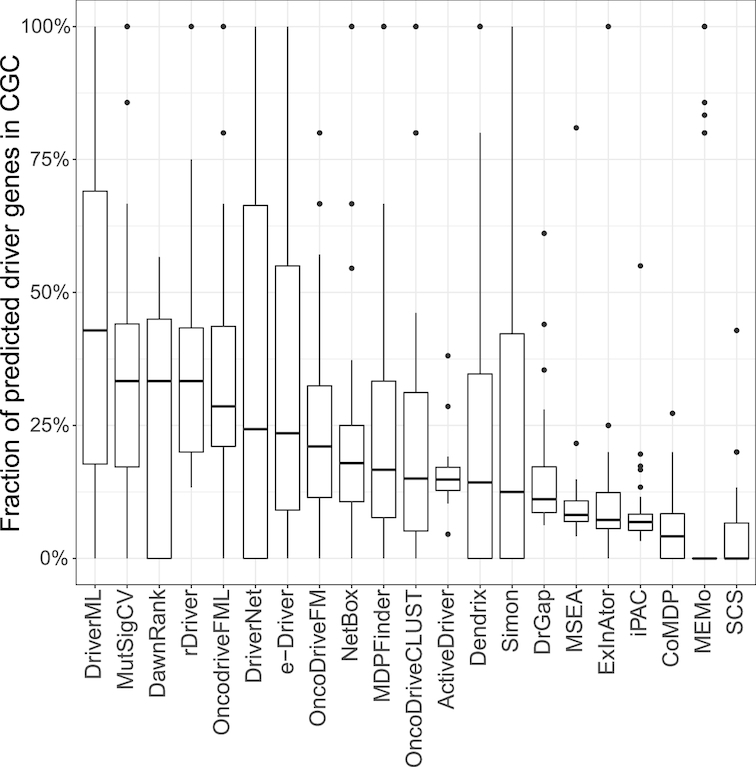
Fraction of predicted driver genes presented in CGC. The Cancer Gene Census (CGC) in COSMIC consists of 616 genes containing mutations that were associated with cancer. Overlap of the predicted driver genes with the CGC was evaluated. Tools were ordered by the median fraction of predicted drivers in the CGC. For each dataset, the fraction of tools predicting too few genes (<3) was set to zero in case of an abnormally high fraction of overlap. Thirty-one datasets as a whole, DriverML, MutSigCV, DawnRank and rDriver had the highest fractions (42.9%, 33.3%, 33.3% and 33.3%, respectively).
Ability to recapitulate genes in Mut-driver list according to mutation patterns
The list of Mut-driver genes included 125 genes from 3284 tumors defined by the 20/20 rule (37). According to this rule, to be classified as an oncogene, more than 20% of the mutations in the gene need to be missense mutations and located at recurrent positions. To be classified as a tumor suppressor gene, more than 20% of the mutations in the gene need to be inactivating (Supplementary Table S3). We also compared driver genes predicted by DriverML and 20 other tools with those found by the 20/20 rule (Figure 3 and Supplementary Table S6). Among these tools, DriverML, MutSigCV, rDriver, oncodriveFML and DawnRank again ranked in the top five according to the proportion of predicted drivers in the list of Mut-driver genes. DriverML performed best among the 21 tools and predicted 34.8% (median fraction) of cancer drivers in the list of Mut-driver genes. MutSigCV ranked second, with 30.6% of predicted drivers being in the list of Mut-driver genes. Over ten tools, which included SCS, MEMo, CoMDP, ExlnAtor and iPAC, predicted <10% of drivers in the list of Mut-driver genes.
Figure 3.
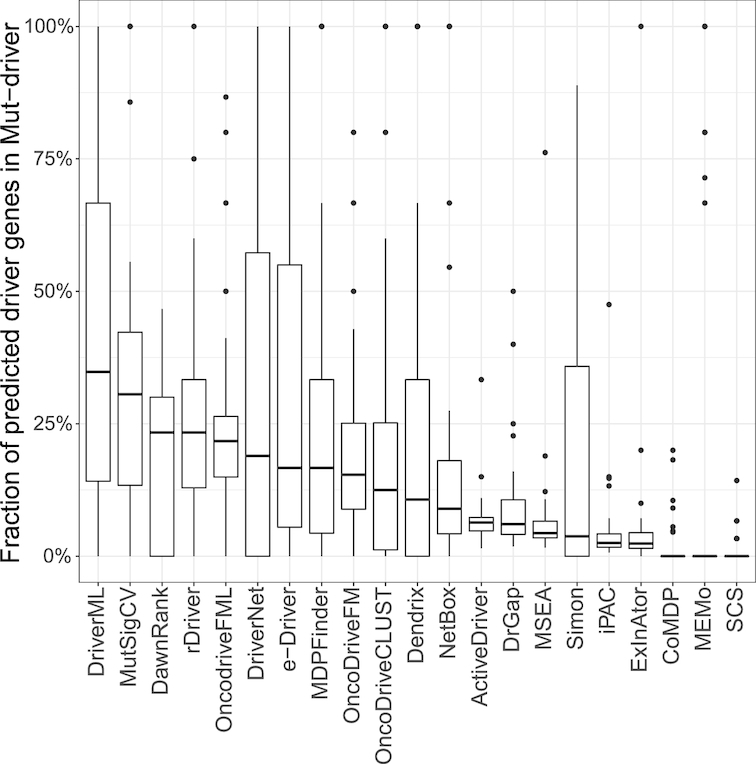
Fraction of predicted genes presented in the list of Mut-driver genes. The list of Mut-driver included 125 genes that were identified from 3284 tumors according to the mutation pattern of 20/20 rule (Vogelstein et al., 2013). DriverML, MutSigCV, DawnRank and rDriver had the highest fractions (34.8%, 30.6%, 23.3% and 23.3%, respectively).
Ability to recapitulate well-studied cancer genes in the HiConf list identified in a literature search
A set of 99 HiConf cancer genes was manually curated by Kumar et al. through a literature search on OMIM and PubMed (38). The CGC served as highly selected candidates for HiConf (Supplementary Table S3). Genes qualified for the HiConf panel if there were scientific publications that demonstrated a cancer-like phenotype when the genes were activated or inhibited or demonstrated genes as causative agents of a tumor syndrome. The overlap of predicted cancer driver genes with the HiConf panel was evaluated (Figure 4 and Supplementary Table S6). The top five tools for driver gene prediction were DriverML, MutSigCV, DawnRank, DriverNet and rDriver. Consistently, DriverML ranked first among 21 tools and predicted ∼30% of cancer drivers in the HiConf panel. Whereas, half of tools such as SCS, MEMo, CoMDP, ExlnAtor and iPAC predicted <10% of cancer drivers in the HiConf panel.
Figure 4.
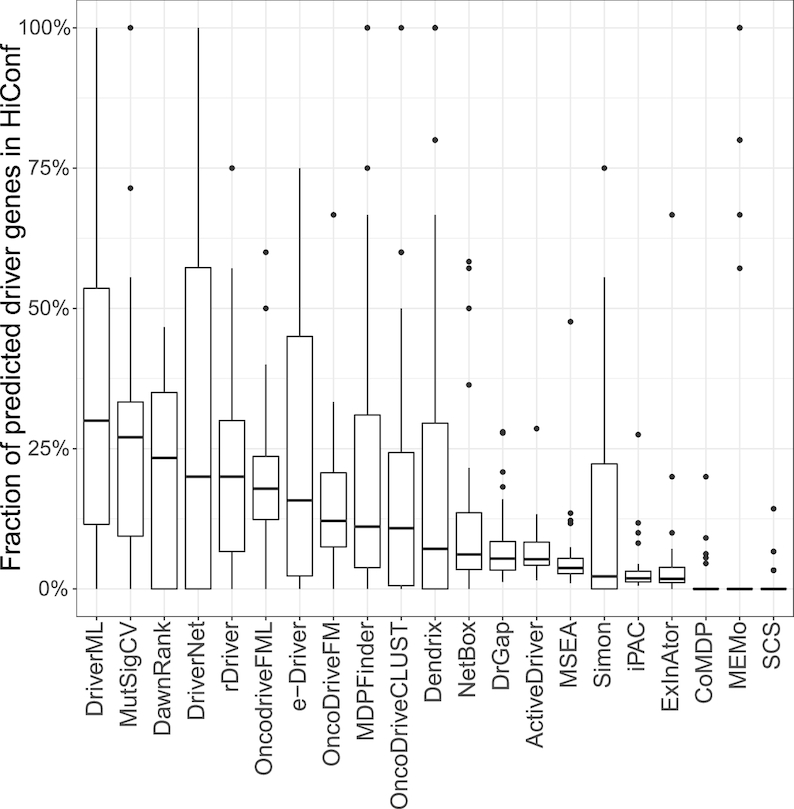
Fraction of predicted driver genes presented in the HiConf list. HiConf includes 99 cancer genes that were manually curated by Kumar et al. (2015) through a literature search on OMIM and PubMed (Kumar et al., 2015). DriverML, MutSigCV and DawnRank were the top three methods (overlap fractions of 30%, 27% and 23.3%, respectively).
Ability to identify core set of genes also predicted by other tools
Genes predicted by more than one tool may be more likely to be drivers (29,41). For each tool, we calculated the proportion of predicted drivers that were also predicted by other tools (Figure 5 and Supplementary Table S6). Overall, DriverML, MutSigCV, MDPFinder, OncodriveFML and DrGaP displayed the smallest fraction of uniquely predicted driver genes. Similar to the above three benchmarks, DriverML maintained outstanding and reliable performance when analyzing the predicted drivers that overlapped with other tools. DriverML predicted over 95% of driver genes that were also predicted by at least one other tool. In contrast, drivers predicted by iPAC, EnlnAtor, SCS, CoMDP and ActiveDriver were much less frequently predicted by the other tools. For instance, more than 60% of driver genes predicted by iPAC, SCS or CoMDP were unique and were not detected by any other method. Thus, they are prone to false positives.
Figure 5.
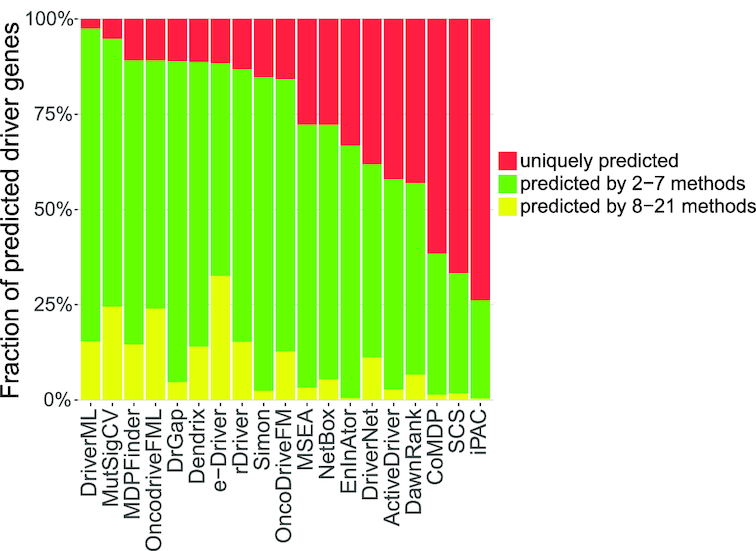
Fraction of predicted driver genes for each method by consensus among the methods. The average fraction of predicted driver genes for each method was determined by consensus among the other methods for the 31 datasets. Tools were sorted by the fraction of uniquely predicted drivers (indicated in red) from small to large. OncodriveCLUST was removed because it did not predicted any unique driver genes on 31 data sets. MEMo was also removed because it predicted too few genes. DriverML, MutSigCV and MDPFinder had the smallest fractions of uniquely predicted driver genes (2.5%, 5.2% and 10.8%, respectively). iPAC, SCS and CoMDP had the highest fractions (73.8%, 66.7% and 61.6%, respectively).
Novel cancer driver genes identified by DriverML
Besides the higher fraction of overlapping predictions with the above four benchmarks, DriverML identified a number of novel driver genes, which included histone deacetylase 5 (HDAC5, FDR = 0.008) and heat-shock protein 5 (HSPA5, FDR = 0.012) in BRCA, EPH receptor A2 (EPHA2, FDR = 0.001) in cholangiocarcinoma (CHOL) and DNA Methyltransferase 1 (DNMT1, FDR = 2.56e-6) in pancreatic adenocarcinoma (PAAD) (Supplementary Table S7). These novel drivers were not detected by the widely used tools, such as MutSigCV and OncodriveFML, and most of the other tools, and were not presented in the CGC. Many of them were strongly supported by convincing studies. For instance, HDAC5, which was identified in BRCA, is crucial in regulating lysine-specific demethylase 1 (LSD1) protein stability through post-translational modification and is important in promoting breast cancer progression (42). Deacetylation of HSPA5, another identified candidate BRCA driver gene, by HDAC6 reportedly leads to GP78-mediated HSPA5 ubiquitination at K447 and suppresses the metastatic property of breast cancer (43). Aberrant expression and activation of EPHA2, identified in CHOL, have been associated with more aggressive metastatic growth and poorer differentiation (44). Inhibitors of signal transducer and activator of transcription 3 (STAT3) or DNMT1, identified in PAAD, might be novel strategies for treating pancreatic cancer because activated interleukin-6 (IL-6) /STAT3 signaling can induce cytokine signaling 3 (SOCS3) methylation via DNMT1, which promotes growth and metastasis of pancreatic cancer (45).
We also performed in vitro cell-based assays for a novel driver gene NPAT in LUSC cells in further validation of DriverML. NPAT is a nuclear protein, coactivator of histone transcription and was uniquely identified by DriverML in lung cancer (FDR = 0.040). Seven missense, and one nonsense mutations, and one frameshift indel were observed in NPAT in LUSC from TCGA (Supplementary Figure S4A). The majority of somatic mutations in NPAT are missense in the COSMIC (Supplementary Figure S4B). NPAT was significantly upregulated in lung tumor tissues as compared with adjacent normal lung tissues (P = 0.004) (Supplementary Figure S4C). NPAT is essential for histone mRNA 3′ end processing and recruits CDK9 to replication-dependent histone genes (46). NPAT is the first (and so far only) gene implicated in nodular lymphocyte predominant Hodgkin lymphoma predisposition (47). To investigate the potential cancer-related roles of NPAT, loss-of-function assays were performed using two LUSC cell lines: H520 and H1703. NPAT expression was substantially reduced after transfection of cells with siRNA (Figure 6A). Knockdown of NPAT significantly suppressed both cell growth and clone formation in both H520 and H1703 cell lines (Figure 6B and C). Inhibition of NPAT also significantly reduced cell invasion in these LUSC cell lines (Figure 6D). Furthermore, depletion of NPAT dramatically suppressed the transition from the G1 phase to the S and G2 phases of the cell cycle (Figure 6E). This was confirmed by western blot analysis in which the protein expression levels of Cyclin A2, Cyclin E2 and p27 were significantly altered upon the knockdown of NPAT in the lung cancer cell lines. These collective preliminary results indicate that the newly identified gene, NPAT, is potentially involved in the development of lung cancer.
Figure 6.

In vitro assays of a novel driver gene NPAT predicted uniquely by DriverML. (A) The expression of NPAT in H520 and H1703 lung cancer cells transfected with siRNA by real-time PCR. (B) CCK-8 cell proliferation assay for lung cancer cells transfected with siRNA. (C) Invasion assay following knockdown of NPAT in lung cancer cells. (D) Colony formation assay in lung cancer cells transfected with NPAT siRNA or control siRNA. (E) Cell cycle profile of control and NPAT knockdown cells. (F) Western blot analysis of protein makers related to cell cycle in control and NPAT knockdown cells. Glyceraldehyde-3-phosphate dehydrogenase (GAPDH) protein is used as control. All cell assays were performed in triplicate. The error bars indicate SD of three independent experiments. **P < 0.01, ***P < 0.001 using the two-sided Student’s t test.
Learned weights improve performance of DriverML
Different types of mutations may have different impacts on protein function. Although the score test was asymptotically equivalent to the likelihood ratio test used in our previous tool, DrGaP (10), the advantage of the score test is that it is mathematically suitable to integrate a set of weights as parameters (30). The weight parameters in the score statistic measure the functional impact of mutations in cancer. The optimized weights could be obtained by maximizing the score statistic of prior driver genes on pan-cancer training data on the basis of machine learning. To evaluate their effects on performance, we set the weight parameters as 1 in the score statistic and compared it with DriverML using optimal weights. As shown in Supplementary Figure S5A, when the weight parameters were set as 1, the fraction of predicted driver genes in the CGC, Mut-driver and HiConf benchmarks were consistently lower than that in DriverML using optimal weights. Similarly, DrGaP showed substantially lower performance than DriverML among different benchmarks (Figures 2–5). These results suggest that the improved performance of DriverML is mainly attributable to its learned weights.
Additionally, the functional role of driver genes may be different among cancer types. However, some cancer types either are not presented or have small sample sizes in our training samples (Supplementary Table S2). Therefore, we estimated general functional weights without regard to cancer types using all the non-TCGA pan-cancer datasets from ICGC and previous studies (32–34). The results presented in the above comparisons were based on the general functional weights. To evaluate their potential influences on driver gene prediction, cancer-type-specific functional weights were individually estimated for several cancer types (e.g. HNSC, KIRC, BLCA LAML and LUSC) that have large training sample sizes (Supplementary Figure S5B). As expected, the cancer-type-specific functional weights increased the performance of predicting driver genes over the non-cancer-type-specific functional weights. Therefore, DriverML is capable of further improvement if cancer-type-specific functional weights are adopted when additional cancer-specific training datasets become available.
DriverML has relatively small system bias
It is important to check the systematic bias of these methods in predicting driver genes. To comprehensively check the systematic bias among the 31 datasets, we constructed box plots of the mean absolute log2 fold change (MLFC).  , where n is the number of tested genes,
  is the observed P-value of gene i and
  is the expected P-value from the uniform distribution of gene i. MLFC close to 0 indicates a small discrepancy between the distribution of observed P-values and uniform distribution (29). For each method, the significant predicted driver genes (FDR < 0.05) and genes in the CGC were removed from the MLFC calculation. We evaluated 13 of 21 methods that can generate P-values in the driver gene predictions. DriverML produced a relatively small MLFC, whereas iPAC yielded the largest MLFC among these methods across 31 cancer types (Supplementary Figure S6). The observations imply that iPAC can result in many false positives, which may explain why iPAC predicted the largest number of driver genes in almost all datasets.
DISCUSSION
A major challenge in cancer genome sequencing is to identify cancer-associated genes with mutations that drive the cancer phenotype (3,48). Computational tools that prioritize cancer driver genes are needed. Although many such tools have been actively developed during the past few years, few are robust and powerful in the presence of multiple-level mutational heterogeneity across genomes within a patient, across patients within a given cancer type and across various cancer types. As a result, there is little consensus in the prediction of driver genes among these tools. Therefore, there is a pressing need to develop a reliable and powerful tool for driver gene prediction that optimizes the balance between sensitivity and precision. In this study, we developed a supervised machine learning approach (DriverML) to score the functional consequences of DNA sequence alterations to identify cancer driver genes (Figure 1B). DriverML provides several advanced features compared with currently existing methods. These advanced features include the use of score statistics to integrate multiple mutation types with a set of weight parameters, the quantification of functional consequences of somatic mutations by the machine learning algorithm, and the estimation of sample distribution of the score statistics by simulating the Poisson process of somatic mutations.
We applied DriverML to the 31 cancer-specific mutation datasets from TCGA and benchmarked it with the 20 other commonly used tools. To our knowledge, the present study is the most thorough evaluation of computational tools for identifying cancer driver genes. Our study evaluated the largest number of methods (DriverML and the other 20 commonly used tools) for predicting driver genes using more than 10 000 tumor samples across 31 cancer types. DriverML was always among the best tools in prediction performance and had relatively small systematic bias among these tools. It achieved a good balance between precision and sensitivity by identifying a moderate number of drivers and a relatively high fraction of genes known to be associated with cancer. The median number of driver genes predicted by DriverML per tumor ranges from one to three among most cancer types (Supplementary Figure S7). On average, 87% of tumor samples carried somatic mutations in at least one driver gene (Supplementary Figure S8).
In addition to many known cancer-associated genes, DriverML identified several novel driver genes, including HDAC5, HSPA5, EPHA2 and DNMT1, which were strongly supported by prior studies. In vitro experiments further demonstrated that a novel driver gene, NPAT, confers a cell growth advantage and participates in the regulation of the cell cycle in lung cancer (Figure 6), proving the validity of the DriverML prediction. These novel driver genes have potentially immediate clinical relevance, because some are promising targets of cancer-related drug therapy. Further investigations are required to understand the molecular mechanisms of these novel driver genes in the development of cancer.
The availability and quality of biologically annotated data have substantially increased during the past decades (49). Many driver gene prediction approaches make use of prior biological knowledge from these well-annotated data using data-driven techniques and machine learning algorithms (29,50). For instance, sub-network methods often rely on prior knowledge from protein–protein interactions, molecular networks and signal transduction pathways (14–20). Hotspot-based methods often need prior knowledge from the protein domain and three-dimensional structure (23–26). DriverML employs a supervised machine learning algorithm to quantify the functional impacts of different types of nonsilent mutations on proteins. Integration of additional high-quality, well-annotated datasets like CGC in training samples will further enhance the performance of DriverML over currently existing methods. It is worth noting, however, that CGC and other well-annotated databases were used as benchmarks to evaluate the performance of DriverML and 20 other tools in the present study. For a fair comparison with other tools, these well-annotated datasets were not used as training samples in DriverML. On the other hand, the data indicate that there is still room for improvement in DriverML when integrating additional high-quality, well-annotated datasets (e.g. CGC) into training samples.
Driver genes predicted by multiple tools are more likely to be true cancer drivers, because false positives of one tool are likely to be discarded by others (29,41). The identification of an overlapping set of driver genes that are simultaneously predicted by several methods (Supplementary Figure S9A) is a sound strategy. Presently, although the fraction of these overlapped drivers in the CGC was increased (Supplementary Figure S9B), the number of the overlapped drivers was dramatically decreased. For instance, MuSigCV and OncodriveFML, which are two commonly used tools, ranked in the top five in our evaluations. The fraction of their overlapping driver genes in the CGC dataset increased to more than 75%. However, the median number of overlapping driver genes by the two methods was only five per cancer type. Too few predictions run the risk of false negatives. On the contrary, combining predictions from multiple tools will significantly increase the number of driver genes. Presently, however, the fraction of the combined set of drivers in the CGC was dramatically reduced (Supplementary Figure S9). Too many predictions run the risk of false positives. These proactive analyses suggest that either overlapped or combined sets of driver genes predicted by multiple methods are not the best solution to the discovery of cancer drivers; each has advantages and disadvantages. Therefore, it is urgently necessary to develop novel and powerful tools, such as DriverML, for driver gene prediction that optimizes the balance between sensitivity and precision.
In summary, DriverML uses an innovative, machine learning-based approach to prioritize cancer driver genes and provides dramatic improvements over other top-of-the-line tools in this field. DriverML will be immediately applicable to various cancer genome sequencing studies and is expected to identify a more complete array of driver genes and pathways in the cancer genome.
Supplementary Material
ACKNOWLEDGEMENTS
We thank the Bioinformatics Core Facility at Zhejiang University School of Medicine for providing computing capacity and anonymous reviewers for reading and commenting on the manuscript.
Author contributions: Y.L. and P.L. considered and designed the study. Y.H. developed the algorithm and performed the data analysis. J.Y. and X.Q. conducted in vitro cell assays. W.C. and S.L. collected datasets and performed partial data analysis. Y.H., P.L. and Y.L. wrote the manuscript. X.H., L.Z., Y.Y. and Q.W. discussed and commented the study.
SUPPLEMENTARY DATA
Supplementary Data are available at NAR Online.
FUNDING
National Key R&D program [2016YFC0902700, 2016YFA0501800]; National Natural Science Foundation of China [31401125, 81472420, 81572256, 81772766, 81871864]; Fundamental Research Funds for the Central Universities; 1000 talent Plan of China. Funding for open access charge:National Natural Science Foundation of China.
Conflict of interest statement. None declared.
REFERENCES
- 1. Greenman C., Stephens P., Smith R., Dalgliesh G.L., Hunter C., Bignell G., Davies H., Teague J., Butler A., Stevens C. et al.. Patterns of somatic mutation in human cancer genomes. Nature. 2007; 446:153–158. [DOI] [PMC free article] [PubMed] [Google Scholar]
- 2. Kumar R.D., Swamidass S.J., Bose R.. Unsupervised detection of cancer driver mutations with parsimony-guided learning. Nat. Genet. 2016; 48:1288–1294. [DOI] [PMC free article] [PubMed] [Google Scholar]
- 3. Korthauer K.D., Kendziorski C.. MADGiC: a model-based approach for identifying driver genes in cancer. Bioinformatics. 2015; 31:1526–1535. [DOI] [PMC free article] [PubMed] [Google Scholar]
- 4. Stratton M.R., Campbell P.J., Futreal P.A.. The cancer genome. Nature. 2009; 458:719–724. [DOI] [PMC free article] [PubMed] [Google Scholar]
- 5. Meyerson M., Gabriel S., Getz G.. Advances in understanding cancer genomes through second-generation sequencing. Nat. Rev. Genet. 2010; 11:685–696. [DOI] [PubMed] [Google Scholar]
- 6. Youn A., Simon R.. Identifying cancer driver genes in tumor genome sequencing studies. Bioinformatics. 2011; 27:175–181. [DOI] [PMC free article] [PubMed] [Google Scholar]
- 7. Gonzalez-Perez A., Lopez-Bigas N.. Functional impact bias reveals cancer drivers. Nucleic Acids Res. 2012; 40:e169. [DOI] [PMC free article] [PubMed] [Google Scholar]
- 8. Reimand J., Bader G.D.. Systematic analysis of somatic mutations in phosphorylation signaling predicts novel cancer drivers. Mol. Syst. Biol. 2013; 9:637. [DOI] [PMC free article] [PubMed] [Google Scholar]
- 9. Lawrence M.S., Stojanov P., Polak P., Kryukov G.V., Cibulskis K., Sivachenko A., Carter S.L., Stewart C., Mermel C.H., Roberts S.A. et al.. Mutational heterogeneity in cancer and the search for new cancer-associated genes. Nature. 2013; 499:214–218. [DOI] [PMC free article] [PubMed] [Google Scholar]
- 10. Hua X., Xu H., Yang Y., Zhu J., Liu P., Lu Y.. DrGaP: A powerful tool for identifying driver genes and pathways in cancer sequencing studies. Am. J. Human Genet. 2013; 93:439–451. [DOI] [PMC free article] [PubMed] [Google Scholar]
- 11. Lanzos A., Carlevaro-Fita J., Mularoni L., Reverter F., Palumbo E., Guigo R., Johnson R.. Discovery of Cancer Driver Long Noncoding RNAs across 1112 tumour Genomes: New candidates and distinguishing features. Sci. Rep. 2017; 7:41544. [DOI] [PMC free article] [PubMed] [Google Scholar]
- 12. Mularoni L., Sabarinathan R., Deu-Pons J., Gonzalez-Perez A., López-Bigas N.. OncodriveFML: a general framework to identify coding and non-coding regions with cancer driver mutations. Genome Biol. 2016; 17:128. [DOI] [PMC free article] [PubMed] [Google Scholar]
- 13. Wang Z., Ng K.S., Chen T., Kim T.B., Wang F., Shaw K., Scott K.L., Meric-Bernstam F., Mills G.B., Chen K.. Cancer driver mutation prediction through Bayesian integration of multi-omic data. PLoS one. 2018; 13:e0196939. [DOI] [PMC free article] [PubMed] [Google Scholar]
- 14. Cerami E., Demir E., Schultz N., Taylor B.S., Sander C.. Automated network analysis identifies core pathways in glioblastoma. PLoS one. 2010; 5:e8918. [DOI] [PMC free article] [PubMed] [Google Scholar]
- 15. Ciriello G., Cerami E., Sander C., Schultz N.. Mutual exclusivity analysis identifies oncogenic network modules. Genome Res. 2012; 22:398–406. [DOI] [PMC free article] [PubMed] [Google Scholar]
- 16. Vandin F., Upfal E., Raphael B.J.. De novo discovery of mutated driver pathways in cancer. Genome Res. 2012; 22:375–385. [DOI] [PMC free article] [PubMed] [Google Scholar]
- 17. Zhao J., Zhang S., Wu L.Y., Zhang X.S.. Efficient methods for identifying mutated driver pathways in cancer. Bioinformatics. 2012; 28:2940–2947. [DOI] [PubMed] [Google Scholar]
- 18. Bashashati A., Haffari G., Ding J., Ha G., Lui K., Rosner J., Huntsman D.G., Caldas C., Aparicio S.A., Shah S.P.. DriverNet: uncovering the impact of somatic driver mutations on transcriptional networks in cancer. Genome Biol. 2012; 13:R124. [DOI] [PMC free article] [PubMed] [Google Scholar]
- 19. Zhang J., Wu L.Y., Zhang X.S., Zhang S.. Discovery of co-occurring driver pathways in cancer. BMC Bioinform. 2014; 15:271. [DOI] [PMC free article] [PubMed] [Google Scholar]
- 20. Hou J.P., Ma J.. DawnRank: discovering personalized driver genes in cancer. Genome Med. 2014; 6:56. [DOI] [PMC free article] [PubMed] [Google Scholar]
- 21. Guo W.F., Zhang S.W., Liu L.L., Liu F., Shi Q.Q., Zhang L., Tang Y., Zeng T., Chen L.N.. Discovering personalized driver mutation profiles of single samples in cancer by network control strategy. Bioinformatics. 2018; 34:1893–1903. [DOI] [PubMed] [Google Scholar]
- 22. Cheng W.C., Chung I.F., Chen C.Y., Sun H.J., Fen J.J., Tang W.C., Chang T.Y., Wong T.T., Wang H.W.. DriverDB: an exome sequencing database for cancer driver gene identification. Nucleic Acids Res. 2014; 42:D1048–D1054. [DOI] [PMC free article] [PubMed] [Google Scholar]
- 23. Ryslik G.A., Cheng Y., Cheung K.H., Modis Y., Zhao H.. Utilizing protein structure to identify non-random somatic mutations. BMC Bioinformatics. 2013; 14:190. [DOI] [PMC free article] [PubMed] [Google Scholar]
- 24. Tamborero D., Gonzalez-Perez A., Lopez-Bigas N.. OncodriveCLUST: exploiting the positional clustering of somatic mutations to identify cancer genes. Bioinformatics. 2013; 29:2238–2244. [DOI] [PubMed] [Google Scholar]
- 25. Porta-Pardo E., Godzik A.. e-Driver: a novel method to identify protein regions driving cancer. Bioinformatics. 2014; 30:3109–3114. [DOI] [PMC free article] [PubMed] [Google Scholar]
- 26. Jia P., Wang Q., Chen Q., Hutchinson K.E., Pao W., Zhao Z.. MSEA: detection and quantification of mutation hotspots through mutation set enrichment analysis. Genome Biol. 2014; 15:489. [DOI] [PMC free article] [PubMed] [Google Scholar]
- 27. Chung I.-F., Chen C.-Y., Su S.-C., Li C.-Y., Wu K.-J., Wang H.-W., Cheng W.-C.. DriverDBv2: a database for human cancer driver gene research. Nucleic Acids Res. 2015; 44:D975–D979. [DOI] [PMC free article] [PubMed] [Google Scholar]
- 28. Watson I.R., Takahashi K., Futreal P.A., Chin L.. Emerging patterns of somatic mutations in cancer. Nat. Rev. Genet. 2013; 14:703–718. [DOI] [PMC free article] [PubMed] [Google Scholar]
- 29. Tokheim C.J., Papadopoulos N., Kinzler K.W., Vogelstein B., Karchin R.. Evaluating the evaluation of cancer driver genes. Proc. Natl. Acad. Sci. U.S.A. 2016; 113:14330–14335. [DOI] [PMC free article] [PubMed] [Google Scholar]
- 30. Wang T., Elston R.C.. Improved power by use of a weighted score test for linkage disequilibrium mapping. Am. J. Human Genet. 2007; 80:353–360. [DOI] [PMC free article] [PubMed] [Google Scholar]
- 31. Radhakrishna Rao C. Large sample tests of statistical hypotheses concerning several parameters with applications to problems of estimation. Math. Proc. Cambridge Philos.Soc. 1948; 44:50–57. [Google Scholar]
- 32. Lawrence M.S., Stojanov P., Mermel C.H., Robinson J.T., Garraway L.A., Golub T.R., Meyerson M., Gabriel S.B., Lander E.S., Getz G.. Discovery and saturation analysis of cancer genes across 21 tumour types. Nature. 2014; 505:495–501. [DOI] [PMC free article] [PubMed] [Google Scholar]
- 33. Davoli T., Xu A.W., Mengwasser K.E., Sack L.M., Yoon J.C., Park P.J., Elledge S.J.. Cumulative haploinsufficiency and triplosensitivity drive aneuploidy patterns and shape the cancer genome. Cell. 2013; 155:948–962. [DOI] [PMC free article] [PubMed] [Google Scholar]
- 34. Rizvi H., Sanchez-Vega F., La K., Chatila W., Jonsson P., Halpenny D., Plodkowski A., Long N., Sauter J.L., Rekhtman N. et al.. Molecular determinants of response to Anti-Programmed cell death (PD)-1 and Anti-Programmed Death-Ligand 1 (PD-L1) blockade in patients with Non-Small-Cell lung cancer profiled with targeted Next-Generation sequencing. J. Clin. Oncol. 2018; 36:633–641. [DOI] [PMC free article] [PubMed] [Google Scholar]
- 35. Gonzalez-Perez A., Perez-Llamas C., Deu-Pons J., Tamborero D., Schroeder M.P., Jene-Sanz A., Santos A., Lopez-Bigas N.. IntOGen-mutations identifies cancer drivers across tumor types. Nat. Methods. 2013; 10:1081–1082. [DOI] [PMC free article] [PubMed] [Google Scholar]
- 36. Benjamini Y., Hochberg Y.. Controlling the false discovery Rate - a practical and powerful approach to multiple testing. J. R. Stat. Soc. Series B-Meth. 1995; 57:289–300. [Google Scholar]
- 37. Vogelstein B., Papadopoulos N., Velculescu V.E., Zhou S., Diaz L.A., Kinzler K.W.. Cancer genome landscapes. Science. 2013; 339:1546–1558. [DOI] [PMC free article] [PubMed] [Google Scholar]
- 38. Kumar R.D., Searleman A.C., Swamidass S.J., Griffith O.L., Bose R.. Statistically identifying tumor suppressors and oncogenes from pan-cancer genome-sequencing data. Bioinformatics. 2015; 31:3561–3568. [DOI] [PMC free article] [PubMed] [Google Scholar]
- 39. Durinck S., Spellman P.T., Birney E., Huber W.. Mapping identifiers for the integration of genomic datasets with the R/Bioconductor package biomaRt. Nat. Protoc. 2009; 4:1184–1191. [DOI] [PMC free article] [PubMed] [Google Scholar]
- 40. Futreal P.A., Coin L., Marshall M., Down T., Hubbard T., Wooster R., Rahman N., Stratton M.R.. A census of human cancer genes. Nat. Rev. Cancer. 2004; 4:177–183. [DOI] [PMC free article] [PubMed] [Google Scholar]
- 41. Tamborero D., Gonzalez-Perez A., Perez-Llamas C., Deu-Pons J., Kandoth C., Reimand J., Lawrence M.S., Getz G., Bader G.D., Ding L. et al.. Comprehensive identification of mutational cancer driver genes across 12 tumor types. Sci. Rep. 2013; 3:2650. [DOI] [PMC free article] [PubMed] [Google Scholar]
- 42. Cao C., Vasilatos S.N., Bhargava R., Fine J.L., Oesterreich S., Davidson N.E., Huang Y.. Functional interaction of histone deacetylase 5 (HDAC5) and lysine-specific demethylase 1 (LSD1) promotes breast cancer progression. Oncogene. 2017; 36:133–145. [DOI] [PMC free article] [PubMed] [Google Scholar]
- 43. Chang Y.W., Tseng C.F., Wang M.Y., Chang W.C., Lee C.C., Chen L.T., Hung M.C., Su J.L.. Deacetylation of HSPA5 by HDAC6 leads to GP78-mediated HSPA5 ubiquitination at K447 and suppresses metastasis of breast cancer. Oncogene. 2016; 35:1517–1528. [DOI] [PubMed] [Google Scholar]
- 44. Cui X.D., Lee M.J., Kim J.H., Hao P.P., Liu L., Yu G.R., Kim D.G.. Activation of mammalian target of rapamycin complex 1 (mTORC1) and Raf/Pyk2 by growth factor-mediated Eph receptor 2 (EphA2) is required for cholangiocarcinoma growth and metastasis. Hepatology. 2013; 57:2248–2260. [DOI] [PubMed] [Google Scholar]
- 45. Huang L., Hu B., Ni J.B., Wu J.H., Jiang W.L., Chen C.Y., Yang L.J., Zeng Y., Wan R., Hu G.Y. et al.. Transcriptional repression of SOCS3 mediated by IL-6/STAT3 signaling via DNMT1 promotes pancreatic cancer growth and metastasis. J. Exp. Clin. Canc. Res. 2016; 35:27. [DOI] [PMC free article] [PubMed] [Google Scholar] [Retracted]
- 46. Pirngruber J., Johnsen S.A.. Induced G1 cell-cycle arrest controls replication-dependent histone mRNA 3′ end processing through p21, NPAT and CDK9. Oncogene. 2010; 29:2853–2863. [DOI] [PubMed] [Google Scholar]
- 47. Saarinen S., Aavikko M., Aittomaki K., Launonen V., Lehtonen R., Franssila K., Lehtonen H.J., Kaasinen E., Broderick P., Tarkkanen J. et al.. Exome sequencing reveals germline NPAT mutation as a candidate risk factor for Hodgkin lymphoma. Blood. 2011; 118:493–498. [DOI] [PubMed] [Google Scholar]
- 48. Fujimoto A., Okada Y., Boroevich K.A., Tsunoda T., Taniguchi H., Nakagawa H.. Systematic analysis of mutation distribution in three dimensional protein structures identifies cancer driver genes. Sci. Rep. 2016; 6:26483. [DOI] [PMC free article] [PubMed] [Google Scholar]
- 49. Figueroa R.L., Zeng-Treitler Q., Kandula S., Ngo L.H.. Predicting sample size required for classification performance. BMC Med. Inform. Decis. Mak. 2012; 12:8. [DOI] [PMC free article] [PubMed] [Google Scholar]
- 50. Carter H., Chen S., Isik L., Tyekucheva S., Velculescu V.E., Kinzler K.W., Vogelstein B., Karchin R.. Cancer-specific high-throughput annotation of somatic mutations: computational prediction of driver missense mutations. Cancer Res. 2009; 69:6660–6667. [DOI] [PMC free article] [PubMed] [Google Scholar]
Associated Data
This section collects any data citations, data availability statements, or supplementary materials included in this article.