

Summary
BAF complexes are composed of different subunits with varying functional and developmental roles, although many subunits have not been examined in depth. Here we show that the Baf45 subunit Dpf2 maintains pluripotency and ESC differentiation potential. Dpf2 co-occupies enhancers with Oct4, Sox2, p300, and the BAF subunit Brg1, and deleting Dpf2 perturbs ESC self-renewal, induces repression of Tbx3, and impairs mesendodermal differentiation without dramatically altering Brg1 localization. Mesendodermal differentiation can be rescued by restoring Tbx3 expression, whose distal enhancer is positively regulated by Dpf2-dependent H3K27ac maintenance and recruitment of pluripotency TFs and Brg1. In contrast, the PRC2 subunit Eed binds an intragenic Tbx3 enhancer to oppose Dpf2-dependent Tbx3 expression and mesendodermal differentiation. The PRC2 subunit Ezh2 likewise opposes Dpf2-dependent differentiation through a distinct mechanism involving Nanog repression. Together, these findings delineate distinct mechanistic roles for specific BAF and PRC2 subunits during ESC differentiation.
Keywords: pluripotency, self-renewal, cell fate decision, enhancers, differentiation, BAF complex, PRC2 complex, embryonic stem cells, histone modification
Graphical Abstract
Highlights
-
•
Dpf2 and Eed antagonistically regulate mesendodermal differentiation of ESCs via Tbx3
-
•
Dpf2 and Eed bind different Tbx3 enhancers to control its expression
-
•
Dpf2 controls H3K27ac and the access of pluripotency TFs at critical target sites
-
•
Ezh2 and Eed counteract Dpf2 function in differentiation through distinct mechanisms
Zhang et al. show that the BAF subunit Dpf2 and the PRC2 subunit Eed antagonistically regulate mesendodermal ESC differentiation by binding distinct Tbx3 enhancers. The PRC2 subunit Ezh2 also counteracts Dpf2 functions in differentiation but through a distinct mechanism involving Nanog repression, revealing that distinct BAF and PRC2 subunits control ESC differentiation.
Introduction
Embryonic stem cells (ESCs) are capable of self-renewal and differentiation into all cell types of the body, which is conferred by the coordination of key factors, including transcription factors (TFs), polycomb complexes, microRNAs, and histone modifiers (Tee and Reinberg, 2014, Li and Belmonte, 2017). Such factors also include ATP-dependent chromatin remodeling complexes that hydrolyze ATP to change the conformation of chromatin, thereby modulating the access of TFs to chromosomal DNA (Kadoch and Crabtree, 2015). The mammalian switch/sucrose nonfermentable (SWI-SNF) complex, also called the BAF (Brg or Brahma-associated factors) complex, represents one subfamily of the ATP-dependent chromatin remodeling superfamily and forms polymorphic assemblies of up to 15 subunits with different functional specificity based on subunit composition (Kadoch and Crabtree, 2015). BAF complexes have been shown to be essential for mammalian pre- to post-implantation development (Ho and Crabtree, 2010, Panamarova et al., 2016),and play important roles in controlling the self-renewal and pluripotency of ESCs (Ho and Crabtree, 2010). However, the function of only a small number of BAF complex subunits has been studied in ESCs and in the early embryo, and how BAF complexes mechanistically control cell fate decisions is not well understood.
The BAF45 subunit is encoded by a family of four genes (BAF45a, BAF45b, BAF45c, and BAF45d) that have different expression patterns (Kadoch and Crabtree, 2015). These proteins contain two plant homeodomain (PHD) fingers that may target the BAF complex to genomic loci bearing specific histone marks (Kadoch and Crabtree, 2015). In the mouse, BAF45a is essential for the maintenance of hematopoietic stem cells (Krasteva et al., 2017) and for the self-renewal of neural progenitors and is replaced by BAF45b/c as neural progenitors differentiate (Kadoch and Crabtree, 2015), whereas BAF45c is critical for heart and muscle development (Lange et al., 2008). BAF45d, also called Dpf2, is the only ubiquitously expressed BAF45 subunit (Mertsalov et al., 2000) and, so far, has been implicated in the programmed cell death response after deprivation of interleukin-3 from myeloid cells (Gabig et al., 1994). However, the biochemical interaction of DPF2 with pluripotency TFs in ESCs (Pardo et al., 2010, van den Berg et al., 2010) suggests a function of this BAF subunit in pluripotent cells, which has not been examined to date.
Our study shows that deletion of Dpf2 in mouse ESCs decreased their self-renewal ability and dramatically impaired their differentiation into mesoderm and endoderm while promoting neural ectoderm differentiation. The differentiation defect to meso-endoderm could be rescued by restoring Tbx3 levels in Dpf2−/− ESCs. We also found that the PRC2 complex subunit Eed oppositely regulates meso-endoderm differentiation compared with Dpf2, also by regulating Tbx3 expression. Mechanistically, Dpf2 and Eed act on two different Tbx3-controlling enhancers. We further demonstrate that Ezh2, another PRC2 subunit, also regulates meso-endoderm differentiation as opposed to Dpf2 but through a distinct mechanism that involves Nanog suppression. Thus, our work uncovers complex mechanisms by which PRC2 subunits and the BAF subunit Dpf2 control differentiation of ESCs.
Results
Dpf2 Loss Affects ESC Self-Renewal and Leads to Increased Apoptosis and Cell-Cycle Defects
Given the previously described biochemical interaction of DPF2 with OCT4 in mouse ESCs (Pardo et al., 2010, van den Berg et al., 2010) and the prominent role of OCT4 as a member of the core pluripotency network (Li and Belmonte, 2017), we set out to study the role of Dpf2 in ESCs. Specifically, we generated a conditional of Dpf2 allele in ESCs by adding LoxP sites around exon 4 (Figure S1A). 4-Hydroxytamoxifen (4-OHT) treatment of Dpf2 fl/fl ESCs resulted in an out-of-frame mutation yielding a complete Dpf2 knockout (KO) at the protein level (Figure S1B).
We first tested the role of Dpf2 in ESC self-renewal. Absence of Dpf2 expression led to a decrease in colony formation (Figure 1A), suggesting an impairment of self-renewal ability. The lower colony number arising from Dpf2−/− cells coincided with a small increase in apoptosis under feeder-free conditions in Lif and serum-containing medium because Dpf2 fl/fl cells were more prone to apoptosis (∼27% cell death) than wild-type (WT) ESCs (∼14%) when treated with 4-OHT for 96 hr (Figure 1B). More significant cell death was also observed for Dpf2−/− ESCs cultured in N2B27 medium with BMP4 and leukemia inhibitory factor (Lif) (Figure S1C). Additionally, Dpf2 deletion resulted in an ∼10% increase in cells in the G2-M cell cycle phases, whereas ∼17% fewer cells were present in S phase (Figure S1D). In addition to the decreased ability to form colonies, alkaline phosphatase (AP) staining revealed a decrease in homogeneously stained, undifferentiated colonies in Dpf2−/− ESCs (Figure 1C). We conclude that increased apoptosis, changes in the cell cycle, and an impaired ability to form colonies are consequences of Dpf2 deletion in ESCs.
Figure 1.

Loss of Dpf2 Affects ESC Self-Renewal and Leads to Increased Apoptosis and Cell-Cycle Defects
(A) Quantification of a colony-formation assay for WT, Dpf2fl/fl, and Dpf2−/− mouse ESCs. Given is the mean of three replicates and the SD. ∗∗∗p < 0.001.
(B) Representative fluorescence-activated cell sorting (FACS) plots of Annexin V and 7-aminoactinomycin D (7-AAD) levels in Dpf2fl/fl and WT control ESCs. Percentages of cells with different apoptosis marker levels are indicated in brackets.
(C) Alkaline phosphatase (AP) staining assay for Dpf2fl/fl and Dpf2−/− ESCs. Colonies were scored as undifferentiated (undiff), mixed, and differentiated (diff). The mean and SD of three replicates is displayed. ∗p < 0.05, ∗∗p < 0.01.
(D) Transcript levels of pluripotency-associated genes in Dpf2fl/fl and Dpf2−/− ESCs based on qPCR.
(E) Western blot for OCT4, SOX2, NANOG, and TBX3 protein levels in Dpf2fl/fl and Dpf2−/− ESCs; α-TUBB served as a loading control.
(F) Schematic of the affinity purification of FLAG-tagged DPF2 in ESCs and the MS procedure.
(G) DPF2-interacting proteins annotated in the STRING (Search Tool for the Retrieval of Interacting Genes/Proteins) database. Subunits of the BAF (blue), NuRD (tan), MCM (green), and MSH complexes (yellow) are highlighted.
(H) GO term and KEGG (Kyoto Encyclopedia of Genes and Genomes) pathway enrichment of DPF2-interacting proteins. Selected terms are shown. FDR, false discovery rate.
Dpf2 deletion had no effect on core pluripotency regulators such as Oct4 and Sox2 both at the transcript and protein levels (Figures 1D and 1E), indicating that the self-renewal defects observed in Dpf2−/− ESCs were not associated with precocious differentiation. However, Nanog expression decreased slightly at both the transcript and protein levels, and the expression of other pluripotency regulators, including Tbx3, Klf4, and Klf5, was significantly decreased (Figures 1D and 1E). Previous reports have demonstrated the importance of Tbx3 for the maintenance of ESC self-renewal (Ivanova et al., 2006) and the ability of Klfs to support ESC self-renewal (Hall et al., 2009), suggesting that the action of DPF2 on these genes could be critical for ESC self-renewal.
To explore the molecular mechanisms of Dpf2 in ESCs, we fused an affinity purification (FTAP) tag (Bode et al., 2016) to the C terminus of one endogenous Dpf2 allele in ESCs (Figures S1E and S1F) and, after cross-linking of cells with formaldehyde to stabilize transient interactions, performed affinity purification of DPF2-containing protein complexes, followed by mass spectrometry (Figure 1F), and confirmed the results with immunoprecipitation followed by western blotting. We identified 80 high-confidence DPF2 interaction partners (Table S1; Figure 1G), including several components of the BAF complex (BRG1 [SMARCA4], ARID1A, BAF155 [SMARCC1], BAF57 [SMARCE1], and BAF170 [SMARCC2]) (Figure S1G), corroborating that DPF2 is a subunit of the BAF complex in ESCs. Gene ontology (GO) analysis of the DPF2 interactome revealed a significant association with proteins that exhibit chromatin-regulatory functions, including the nucleosome remodeling deacetylase (NuRD) complex (Figure 1H). In agreement with the cell cycle defect in Dpf2−/− ESCs, DPF2 associated with proteins implicated in regulation of the cell cycle and DNA replication initiation (Figures 1G and 1H), including most subunits of the mini chromosome maintenance (MCM) complex, which controls DNA replication (Forsburg, 2004), suggesting that Dpf2 (and the BAF complex) may affect the ESC cell cycle by regulating the interaction of the MCM complex with DNA replication origins.
Dpf2 Deletion Alters ESC Differentiation
Because KO of Dpf2 altered the expression of some pluripotency regulators, we examined the global gene expression changes upon Dpf2 deletion in ESCs by RNA sequencing (RNA-seq). We identified 383 significantly down- and 753 upregulated genes when comparing Dpf2fl/fl and Dpf2−/− ESCs (Figure S2A; Table S2). Dpf2 loss led to the downregulation of genes associated with stem cell maintenance, blastocyst formation, and signaling pathways that control pluripotency and, in agreement with an increase in apoptosis, induced the upregulation of genes associated with cell death and negative regulation of proliferation (Figure 2A). Interestingly, we identified a number of differentiation-associated GO terms for both down- and upregulated genes in Dpf2 KO ESCs (Figure 2A), suggesting a role of Dpf2 in controlling differentiation pathways.
Figure 2.

Dpf2 Deletion Impairs ESC Differentiation
(A) GO analysis for biological processes associated with genes differentially expressed upon Dpf2 deletion in ESCs.
(B) qPCR analysis for transcript levels of the indicated lineage-specific genes on days 4 and 7 of EB differentiation of Dpf2fl/fl and Dpf2−/− cells.
(C) Global gene expression profiles of Dpf2fl/fl and Dpf2−/− EBs. Neuro, neural ectoderm markers; Meso, mesoderm markers; Endo, endoderm markers; Pluri, pluripotency-associated genes.
(D) Images of H&E-stained teratomas from Dpf2fl/fl ESCs. Magnification, 630×.
(E) As in (D), except for Dpf2−/− ESCs. Magnification, 200×.
(F) qPCR analysis for transcript levels of the indicated lineage-specific genes in day 6 EBs from Dpf2fl/fl, Dpf2−/−, and Dpf2−/− with ectopically (exo) expressed Tbx3.
To examine the differentiation potential of Dpf2−/− ESCs, we performed embryoid body (EB) differentiation assays and assessed the expression level of well-established lineage markers. The transcript levels of the endoderm markers Gata4, Gata6, and Sox17 and the mesoderm marker Brachury (T) were significantly lower in Dpf2−/− EBs cultured for 4 or 7 days compared with their respective controls (Figure 2B), suggesting that deletion of Dpf2 leads to impaired endoderm and mesoderm differentiation. The expression of the ectoderm marker Fgf5 was lower in Dpf2−/− EBs on day 4 but similar in WT and Dpf2−/− EBs cultured for 7 days (Figure 2B). Conversely, the expression of the neural ectoderm marker Pax6 was upregulated throughout EB differentiation, indicating that Dpf2 loss promoted neural ectoderm differentiation (Figure 2B). We also induced ESC differentiation with retinoic acid (RA), which promotes differentiation into primitive endoderm (Cho et al., 2012). Immunostaining against SOX17, GATA6, and GATA4 in Dpf2−/− RA-differentiated cells revealed the reduction of these markers compared with WT cells, indicating that differentiation to primitive endoderm is significantly impaired without Dpf2 (Figure S2B).
To gain more insights into the differentiation bias of Dpf2−/− ESCs, we examined the global gene expression profile of Dpf2−/− EBs and corresponding WT controls. On day 4, a few marker genes for endoderm and mesoderm showed decreased expression and some neural-related genes showed increased expression in mutant EBs compared with controls (Figure 2C, left; Table S3). These differences were even more pronounced in EBs on day 7, when endoderm and mesoderm-related genes showed significantly decreased and neuron-related genes increased expression in Dpf2−/− EBs (Figure 2C, right; Table S3).
To investigate the effects of Dpf2 deletion on differentiation in vivo, we assayed Dpf2−/− and Dpf2fl/fl ESCs for their ability to form teratomas. Dpf2fl/fl ESCs formed well-differentiated teratomas containing cells of all three germ layers (Figure 2D). Conversely, Dpf2−/− ESCs formed mostly immature teratomas containing mostly immature neural ectoderm tissue (with prominent neuroepithelial rosettes) and trophoblast giant cells with minimal endoderm- and mesoderm-related tissues (Figures 2E and S2C). Thus, deletion of Dpf2 alters the differentiation propensity of ESCs in vitro and in vivo, away from meso-endoderm toward immature neural ectoderm.
To validate that the impaired differentiation phenotype was caused by deletion of the Dpf2 gene, we asked whether overexpression of FLAG-tagged Dpf2 rescued the defects (Figure S2D). Dpf2 overexpression in Dpf2fl/fl ESCs before disruption of the endogenous Dpf2 alleles did not affect self-renewal or differentiation (Figures S2E and S2F). However, when endogenous Dpf2 was deleted in Dpf2 fl/fl ESCs by 4-OHT, Dpf2 overexpression rescued the differentiation defects of all three lineages, restoring the levels of lineage-specific markers to WT levels (Figure S2G).
Specificity of Dpf2 Function in ESC Differentiation
In addition to Dpf2 (BAF45d), BAF45a is expressed in mouse ESCs, whereas BAF45b and BAF45c are lowly expressed (Kadoch and Crabtree, 2015). To examine whether the differentiation defect observed upon the Dpf2 deletion is specific for Dpf2, we generated Dpf2fl/fl ESC lines overexpressing BAF45a and BAF45c (Figure S2H). Overexpression of either subunit prior to the deletion of Dpf2 did not alter the expression of pluripotency and differentiation marker genes (Figures S2I–S2L). BAF45a or BAF45c overexpression did not rescue the differentiation defects toward endoderm, mesoderm, and neural ectoderm of cells lacking endogenous Dpf2 (Figure S2M). These results indicate that the BAF45 subunits are not functionally redundant and highlight a specific role of Dpf2 in lineage specification from ESCs.
Tbx3 Rescues the Meso-endoderm Differentiation Defects of Dpf2−/− ESCs
Tbx3 was one of the pluripotency genes most affected by deletion of Dpf2 in undifferentiated ESCs (Figure 1E). Considering the requirement of Tbx3 for meso-endoderm differentiation (Weidgang et al., 2013, Waghray et al., 2015), we hypothesized that Dpf2 may control the differentiation potential of ESCs via regulation of Tbx3 expression. To test this idea, we stably transfected FLAG-tagged Tbx3 into Dpf2fl/fl cells and subsequently deleted Dpf2. The data show that the endoderm marker genes Gata4, Gata6, Sox17, and Pdgfra reached nearly WT levels in Dpf2−/− 4-day and 6-day EBs ectopically expressing Tbx3 (Figures 2F and S2N). Similarly, ectopic Tbx3 expression restored the expression levels of the mesoderm marker genes T, Bmp4, Gata2, and Hand1 in Dpf2−/− 6-day EBs (Figures 2F and S2N). Conversely, the increase in neural ectoderm markers (Pax6, Nes, and Tubb3) observed in Dpf2−/− EBs was not reduced by Tbx3 overexpression (Figures 2F and S2N). We conclude that overexpression of Tbx3 rescued the endoderm and mesoderm differentiation defects induced by loss of Dpf2 and that the enhancement of neural-ectoderm differentiation in Dpf2−/− EBs did not occur through regulation of Tbx3.
Because Tbx3 overexpression itself promotes endodermal and mesodermal genes in differentiating ESCs (Weidgang et al., 2013), it remained possible that Tbx3 expression may upregulate endo- and mesodermal genes in cells that have differentiated toward neuroectoderm upon Dpf2 deletion. To exclude this possibility, we performed immunofluorescence staining of GATA4 in combination with NESTIN and TUBB3 in differentiating Dpf2−/− cells expressing Tbx3 exogenously and found that cells expressed GATA4 in the absence of the neuroectoderm markers (Figures S2O and S2P). Thus, in the absence of Dpf2, Tbx3 overexpression induces faithful differentiation toward endodermal and mesodermal lineages.
DPF2 Co-occupies Active Enhancers with OCT4, SOX2, and BRG1 in ESCs
To understand how Dpf2 regulates Tbx3, we profiled the genome-wide binding sites of DPF2 in ESCs using chromatin immunoprecipitation followed by high-throughput sequencing (ChIP-seq) (Table S4). We found that the majority of DPF2 binding events occurred at genomic locations distal to transcriptional start sites (TSSs), including both intergenic regions and gene bodies (Figure 3A). By intersecting DPF2-bound genomic locations with previously annotated ESC chromatin states (Chronis et al., 2017), we found that DPF2 predominantly binds enhancers, particularly those with high levels of the histone marks H3K27ac, H3K4me2, and H3K4me1, characteristic of the most active enhancers (Figure 3B, states 3 and 4). GO analysis indicated that DPF2-occupied sites are located close to genes associated with functions in stem cell maintenance, morphogenesis, gastrulation, and development (Figure 3C).
Figure 3.

DPF2 Associates with Active Enhancers and the Oct4, Sox2, and Brg1 Network in ESCs
(A) Distribution of DPF2 target sites determined by ChIP-seq in ESCs in relation to their distance to TSSs.
(B) Chromatin state enrichment of DPF2 target sites in ESCs. ESC chromatin states were defined in Chronis et al. (2017) using ChromHMM. Rows represent chromatin states and their mnemonics. Columns give the frequency of the indicated histone marks and H3.3 for each chromatin state (ChromHMM emission probabilities), color-coded from blue (highest) to white (lowest). Enrichment of DPF2 in each chromatin state is shown in the last column.
(C) Significant GO terms for genes with DPF2 target sites within 10 kb of their TSS.
(D) Motifs identified at DPF2-bound sites by de novo search and the best matching TFs.
(E) Hierarchical clustering of pairwise enrichments of DPF2, BRG1, OCT4, SOX2, NANOG, ESRRB, KLF4, EED, and EZH2 binding sites in ESCs. BRG1 and EED binding sites were identified from Dpf2fl/fl and Dpf2−/− ESC lines, and all other binding events were obtained from WT ESCs. The black box indicates highest correlation enrichment for pairwise binding.
(F) Heatmaps of normalized ChIP-seq signal for Dpf2, Brg1, Oct4, Sox2, Nanog, and p300 at all sites bound by DPF2 in ESCs.
(G) Genome browser view of DPF2, BRG1, OCT4, SOX2, NANOG, and P300 binding at the Nanog locus in ESCs.
(H) Heatmaps of normalized ChIP-seq signal for Dpf2 and Brg1 at BRG1 occupied sites in Dpf2fl/fl or Dpf2−/− ESC lines.
To gain insights into the determinants of DPF2 binding, we searched for sequence elements enriched within DPF2 target sites. We found motifs for the Klf and Tead family members Esrrb, Nanog, and Sox2 as well as the Oct-Sox composite site to be most enriched (Figure 3D), suggesting that DPF2 is bound at sites engaged by the core pluripotency TFs. This result was corroborated by comparing the binding profile of DPF2 with those of Oct4, Sox2, Nanog, Klf4, and Esrrb genome-wide (Figures 3E and 3F) and at the Nanog locus as an example (Figure 3G). Among these pluripotency TFs, DPF2 binding sites overlapped more often with those of Oct4 and Sox2 than with those of Nanog, Esrrb, and Klf4 (Figure 3E). In agreement with previous data showing that DPF2 is a component of the OCT4 protein network (van den Berg et al., 2010, Pardo et al., 2010), we confirmed the interaction of the two proteins by co-immunoprecipitation (Figure S3A) and found that 48.5% of all OCT4 binding events were co-occupied by DPF2.
Additionally, we performed ChIP-seq for BRG1, the ATPase subunit of the BAF complex, and found a high overlap of DPF2 and BRG1 genome occupancy, consistent with mass spectrometry (MS) (Figure 1G) and immunoprecipitation data for DPF2 (Figure S3B) and the notion that DPF2 mainly acts as a subunit of the BAF complex in ESCs (Figures 3E-H). As expected from the localization of DPF2 to active enhancers (Figure 3B), we also detected an extensive co-localization of DPF2 with the transcriptional co-activator P300 (Figures 3E-3G). The significant co-binding between DPF2 and P300 was further supported by the physical interaction observed between DPF2 and P300 in co-immunoprecipitation experiments (Figure S3C). DPF2 binding did not extensively overlap with that of EED and EZH2, subunits of the repressive polycomb complex PRC2 (Figures 3E, S3D, and S3E). Together, these findings reveal collaboration with pluripotency TFs at enhancers and suggest that Dpf2 plays a role in the selection and activation of enhancers in ESCs.
Dpf2 Loss Does Not Globally Affect the Binding of BRG1 and PRC2
To determine whether Dpf2 deletion globally affects the binding of BRG1, we performed ChIP-seq for BRG1 in ESCs after Dpf2 deletion. Dpf2 loss did not prevent binding of BRG1, which maintained a similar genome-wide binding profile as in WT Dpf2fl/fl ESCs (Figures 3E, 3H, and S3D). This result suggests that the BAF complex assembly remains unperturbed at the vast majority of its physiological targets in the absence of Dpf2. Similarly, Dpf2 loss did not affect the binding profile of the PRC2 subunit EED at the genome-wide level (Figure S3E), consistent with their largely non-overlapping binding sites (Figure 3E).
Dpf2 Depletion Modulates H3K27ac Levels and Binding of OCT4 and BRG1
Given the gene expression changes observed by the absence of Dpf2, we investigated whether DPF2 engages genes that become deregulated in KO ESCs. We found that ∼63% of the differentially expressed genes in Dpf2−/− ESCs associated with a DPF2 binding event within 20 kb around their TSSs (Figure 4A; 719 of 1,136 genes, p < 0.0001, chi-square test), including both up- and downregulated genes, suggesting that Dpf2 can activate and repress gene expression. Pluripotency genes downregulated in the absence of Dpf2, including Klf4, Klf5, and Tbx3, were direct binding targets of DPF2 (Figure 4A).
Figure 4.

Dpf2 Depletion Modulates Levels of H3K27ac and OCT4
(A) Heatmap of expression levels (log2RPKM+1) in Dpf2fl/fl and Dpf2−/− ESCs for differentially expressed genes between Dpf2fl/fl and Dpf2−/− ESCs and their DPF2 binding based on a DPF2 peak within 10 kb of the TSS (red, bound; black, unbound genes).
(B) Number of genomic sites with a significant change in H3K27ac (>2-fold difference) between Dpf2fl/fl and Dpf2−/− ESCs, divided into those with a reduction (top) and increase (bottom) in Dpf2−/− ESCs, and their association with DPF2 in WT ESCs.
(C) Heatmap of normalized tag density profiles of H3K27ac experiments in Dpf2fl/fland Dpf2−/− cells at sites with significant H3K27ac changes from (B).
(D) Metaplots of average signal intensities for H4tetrac, H3K9ac, H3K4me1, H3K27me3, OCT4, SOX2, and P300 at DPF2-bound sites in ESCs with reduced (top) or increased (bottom) H3K27ac, as defined in (B), for Dpf2fl/fl (blue) and Dpf2−/− ESCs (red).
(E) As in (B), but for sites with significant differences in OCT4 instead of H3K27ac.
(F) Metaplots of average signal intensities for OCT4 in Dpf2fl/fl and Dpf2−/− ESCs at sites with significant OCT4 changes that are also occupied by DPF as defined in (E).
(G) Heatmap of normalized tag density profiles of H3K27ac e in Dpf2fl/fl and Dpf2−/− ESCs at sites with significant OCT4 binding changes and occupied by DPF2 (E) and corresponding metaplots of signal intensities.
(H) Genome browser view of ChIP-seq tracks of DPF2, BRG1, EED, and OCT4 binding as well as H3K27ac and H3K27me3 for the Bmp4 locus. DPF2 data are from WT ESCs and the others from Dpf2fl/fl and Dpf2−/− ESCs, indicated as fl/fl and −/−. Regions highlighted in blue signify ESC enhancer regions as defined by ChromHMM in Chronis et al. (2017). The values on the y axis represent fold enrichment over control.
(I) Heatmap of normalized tag density profiles of DPF2, EED, H3K27ac, and P300, at sites exhibiting a reduction in BRG1 in Dpf2−/− ESCs compared with Dpf2fl/fl ESCs. DPF2 data are from WT ESCs and all others from Dpf2fl/fl and Dpf2−/− ESCs, indicated as fl/fl and −/−.
(J) Metaplots of average signal intensities for DPF2 and BRG1, H3K27ac, p300 and Oct4 at sites defined in (I).
We next asked how Dpf2 affects the histone modification landscape. Hence, we generated maps for five histone modifications from Dpf2fl/fl or Dpf2−/− ESC lines, including H3K27ac, H3K4me1, H4-tetraAC and H3K9ac, which are associated with promoters and enhancers, and the repressive histone mark H3K27me3 (Ernst et al., 2011). We did not observe significant differences in the average H3K27ac signal between Dpf2fl/fl and Dpf2−/− cells when all DPF2 binding sites were considered (Figure S4A). However, we identified 4,581 sites with significant reduction (≥2-fold) of H3K27ac in Dpf2−/− compared with Dpf2fl/fl ESCs (Figures 4B and 4C). We also observed 2,513 sites that gained H3K27ac signal by 2-fold or more upon Dpf2 deletion (Figures 4B and 4C). 21% of sites with decreased H3K27ac levels and 46% of sites with an increase in H3K27ac were bound by DPF2 in WT ESCs (Figure 4B) and located predominantly in enhancers (Figure S4B), indicating that Dpf2 contributes to the regulation of H3K27ac at active enhancers in ESCs.
H3K4me1, H4-tetraAC, H3K9ac, and binding by Oct4 and Sox2 followed similar trends to H3K27ac at DPF2-occupied sites, and the repressive mark H3K27me3 exhibited an antithetical pattern (Figure 4D). P300 presence was dramatically affected at DPF2-bound sites with diminished H3K27ac levels in Dpf2−/− ESCs but displayed very little change DPF2 sites with a gain of H3K27ac (Figure 4D). Thus, DPF2 controls the chromatin state and pluripotency TF binding at a subset of its target sites.
Given the extensive co-localization of DPF2 with OCT4 and the interaction between these two proteins, we investigated the effect of Dpf2 loss on OCT4 binding in ESCs further. On average, OCT4 binding was not different between Dpf2fl/fl and Dpf2−/− cells at sites normally bound by DPF2 (Figure S4C). However, a more detailed analysis identified a significant decrease of OCT4 binding at 6,082 genomic locations in cells lacking Dpf2 expression, with 27% of those exhibiting DPF2 binding in ESCs (Figures 4E and 4F) and an accompanying reduction in H3K27ac levels in Dpf2−/− ESCs (Figure 4G). A much smaller number of sites displayed an increase in OCT4 binding in Dpf2−/− ESCs (737), accompanied by an increase in H3K27ac, with many bound by DPF2 in ESCs (Figures 4E–4G). As seen in our H3K27ac analysis, DPF2-bound sites with changes in Oct4 levels were more enriched in enhancers than promoters (Figure S4B). Interestingly, DPF2 binding sites exhibiting loss of H3K27ac and OCT4 binding, respectively, were strongly enriched close to downregulated genes (Figure S4D). Conversely, DPF2-bound locations at genes with elevated expression upon Dpf2 loss were enriched for changes in H3K27ac and OCT4 binding, but less strongly (Figure S4D). These results suggest that Dpf2 can act as both a suppressor and activator of gene expression through the regulation of H3K27ac, P300, and OCT4 levels and that enhancers are key sites of its action.
The destabilization of OCT4 binding and reduction of H3K27ac upon loss of Dpf2 is exemplified at enhancers within the Bmp4 (Figure 4H), Tbx3 (Figure 6A), Gjb3, Lama1,and Nkx6-3 loci (Figures S4E–S4G). ChIP-qPCR confirmed this result for OCT4 binding at these genes and extended the findings to P300 (Figures S4H and S4I). Although the binding of SOX2 and NANOG at these loci also decreased (Figures S4J and S4K), we did not detect any interaction of the DPF2 protein with either SOX2 or NANOG in co-immunoprecipitation experiments (Figure S4L), suggesting that the loss of these TFs is due to OCT4 loss.
Figure 6.

Dpf2 and Eed Regulate Tbx3 Expression by Controlling Histone Modifications and Accessibility of Pluripotency TFs at Different Enhancers
(A) Genome browser view of ChIP-seq tracks for DPF2 and P300 in WT ESCs and BRG1, OCT4, SOX2, EED, H3K27ac, and H3K27me3 in Dpf2fl/fl and Dpf2−/− ESCs (indicated as fl/fl and −/−) at the Tbx3 locus. The distal enhancer (DE) and intronic enhancer (IE) enhancers are highlighted. The values on the y axis represent fold enrichment over control.
(B) Circular chromatin conformation capture (4C-seq) analysis of the Tbx3 promoter. The arcs represent significant interactions from the Tbx3 promoter viewpoint in Dpf2fl/fl and Dpf2−/− ESCs. The DE and IE are indicated.
(C) Transcript levels of Tbx3 in two DE KO ESC clones and control ESCs based on qPCR.
(D) As in (C), except for the indicated lineage markers in day 6 EBs from WT and the two DE KO ESCs.
(E) H3K27ac levels at Tbx3 enhancers in Dpf2fl/fl, Eed−/−, and Eed/Dpf2 double KO ESCs, determined by ChIP-qPCR.
(F) As in (E), except for relative levels of EED, EZH2, and SUZ12 at the IE of the Tbx3 gene in Dpf2fl/fl and Dpf2−/− ESCs.
(G) As in (E), except for relative levels of OCT4 and SOX2 at the IE of the Tbx3 gene in WT and Eed−/− ESCs.
Even though overall BAF complex binding remained largely unaffected by the loss of Dpf2 (Figure 3), 8% of the BRG1 sites exhibited a reduction in BRG1 occupancy and a concurrent reduction of H3K27ac, P300, and OCT4 (Figures 4I and 4J) and were located in enhancers enriched close to genes downregulated upon Dpf2 loss (Figures S4B and S4D). Thus, at least for a number of sites, DPF2 loss associates with the de-stabilization of the entire BAF complex in addition to the reduction of OCT4 and P300. These sites include the examples described above (Figures 4H, S4E-S4G, and 6A). The targeting of new sites by BRG1 was negligible in Dpf2−/− ESCs. The impaired binding of BRG1 at only a subset of sites may be explained by the existence of multiple BAF complexes in ESCs that consist of different core components. These results confirm a role of Dpf2 in the recruitment of OCT4 and BRG1 at a subset of sites within ESC enhancers.
DPF2 Occupancy Changes with Differentiation
To gain mechanistic insights into the actions performed by DPF2 during differentiation, we performed ChIP-seq for DPF2 in EBs cultured for 2 or 4 days (Table S4). DPF2 bound a large number of new genomic locations as early as 2 days post-differentiation (clusters II, III, and V) (Figure 5A). Two-thirds of ESC binding events were lost upon differentiation (clusters I and IV) and one-third was maintained (clusters VI and VII) upon differentiation (Figure 5A). ESC-specific DPF2 binding sites were located in the vicinity of genes associated with blastocyst formation and trophectoderm differentiation (cluster I; Figure 5B), whereas newly bound sites in EB-neighbored genes associated with neuronal development (clusters III and V; Figure 5B), supporting a direct role of DPF2 in the regulation of neural ectoderm differentiation. Constitutively bound DPF2 sites were associated with endodermal and mesodermal as well as notochord development (cluster VII; Figure 5B) and contained binding events in the vicinity of the endodermal and mesodermal marker genes Gata4, Gata6, Sox17, and T (Figure S5A). Consistent with the maintenance of Dpf2 binding, we did not observe a change in H3K27ac levels at these sites (Figure S5A). These data suggest that the gene expression changes in endo-mesodermal genes observed upon Dpf2 deletion do not occur through a direct function of DPF2. Consistent with this idea, overexpression of Dpf2 in ESCs did not lead to the upregulation of endo- and mesodermal markers (Figure S2F).
Figure 5.

Regulation of Meso-endoderm Differentiation by Dpf2 and Eed via Tbx3
(A) Clustering of Dpf2 binding events in ESCs and day 2 and 4 EBs. The genome was divided into 500-bp bins and a bin called bound (blue) or unbound (white) based on the presence of a DPF2 peak.
(B) GO analysis for enriched biological process for genes associated with DPF2 peaks from different clusters defined in (A), within ± 20 kb of the TSS.
(C) Transcript levels of the indicated endoderm markers in day 4 EBs from Dpf2fl/fl, Eed−/−, and Eed/Dpf2 double KO determined by qPCR.
(D) As in (C), except for pluripotency-associated genes in Dpf2fl/fl, Dpf2−/−, Eed−/−, and Dpf2 and Eed double KO ESCs.
(E) As in (C), except for Tbx3 in day 4 EBs from Dpf2fl/fl, Eed−/−, and Eed/Dpf2 double KO ESCs.
(F) As in (C), except for various endoderm markers in 4-day EBs induced from Eed−/− and Eed−/−/Tbx3 kd ESCs.
(G) As in (C), except for various mesoderm markers and Tbx3 in day 7 EBs from Dpf2fl/fl, Eed−/−, and Eed/Dpf2 double KO ESCs.
(H) As in (C), except for various neuroectoderm markers in day 6 EBs from Dpf2fl/fl, Dpf2−/−, and Eed/Dpf2 double KO ESCs.
Dpf2 and Eed Control Meso-endoderm Differentiation by Opposingly Regulating Tbx3
Previous studies showed that the deletion of Eed increases the expression of endoderm and mesoderm markers (Boyer et al., 2006, Chamberlain et al., 2008, Leeb et al., 2010). Because we observed the downregulation of endo- and mesodermal genes in differentiating Dpf2−/− ESCs (Figure 2), we hypothesized that endo- and mesoderm differentiation may be oppositely regulated by Eed and Dpf2. To test this idea, we deleted the Eed gene in Dpf2fl/fl cells by targeting its second exon with an out-of-frame mutation leading to loss of the EED protein (Figures S5B–S5D). Immunostaining verified the loss of H3K27me3 in Eed−/− ESCs (Boyer et al., 2006; Figure S5E). Subsequently, we induced differentiation of Dpf2fl/fl, Eed−/−, and Eed/Dpf2 double KO ESCs by EB formation.
As expected, KO of Eed led to increased expression of the endodermal genes Gata4, Gata6, Sox7, and Sox17 (Figures 5C and S5F) (Boyer et al., 2006). The expression of these genes was restored close to WT levels in Dpf2 and Eed double KO EBs (Figures 5C and S5F), demonstrating that Eed and Dpf2 regulate endoderm differentiation in an opposing manner.
Next we studied how Eed and Dpf2 mechanistically regulate endoderm differentiation. Deletion of Eed did not dramatically affect the expression of Oct4, Sox2, and Nanog in ESCs but significantly increased Tbx3 expression, contrary to the downregulation of Tbx3 in Dpf2−/− ESCs (Figure 5D). When we induced the deletion of Dpf2 in Eed−/− cells, Tbx3 expression decreased toward WT levels (Figure 5D). We conclude that Eed and Dpf2 oppositely regulate Tbx3 expression in ESCs and during the onset of differentiation.
We further investigated whether the increase in Tbx3 expression in the absence of Eed was responsible for the increase in endodermal gene expression. We found that Tbx3 transcript levels correlated with the expression of Gata4, Gata6, Sox7, and Sox17 during differentiation of Dpf2fl/fl, Eed−/−, and Eed/Dpf2 double KO cells (Figures 5C, 5E, S5F, and S5G). Therefore, we induced EB formation from Eed−/−/Tbx3 knockdown (kd) ESCs in which Tbx3 transcripts were depleted by RNAi-mediated knockdown (Figure S5H). Expression of Gata4, Gata6, and Sox7 decreased when Tbx3 was depleted compared with Eed−/− cells (Figure 5F), indicating that Eed controls endoderm differentiation, at least partially, via regulating Tbx3 expression, and that the balance of Dpf2 and Eed is critical for the regulation of Tbx3.
These conclusions extend to the regulation of mesoderm differentiation. Contrary to the downregulation of the mesoderm genes T, Bmp4, Hand1, and Gata2 in differentiating Dpf2−/− ESCs (Figure 2), the expression of these genes significantly increased in Eed−/− EBs and was largely restored in Dpf2 and Eed double KO EBs (Figure 5G). Similarly, the induced expression of the neural ectoderm markers Nes, Pax6, Ncam1, and Pcdh17 observed in Dpf2−/− EBs was restored to physiological levels in Dpf2 and Eed double KO EBs (Figures 5H and S5I). Thus, in addition to endoderm differentiation, Eed and Dpf2 oppositely regulate mesoderm and neural ectoderm differentiation.
Dpf2 and Ezh2 Regulate Endo- and Mesoderm Differentiation by Regulating Nanog
Given that Eed, Ezh2, and Suz12, the core subunits of PRC2, have different effects on ESC differentiation (Boyer et al., 2006, Chamberlain et al., 2008, Leeb et al., 2010), we wanted to find out what the effects of Ezh2 were in our system. We deleted the fifth exon of the Ezh2 gene homozygously in Dpf2 fl/fl cells, which resulted in loss of EZH2 at the protein level (Figure S6A), and induced EB formation of Dpf2fl/fl, Ezh2−/−, and Ezh2 and Dpf2 double KO ESCs. In contrast to the upregulation of endoderm markers in the absence of Eed (Figures 5C and S5F), KO of Ezh2 led to repression of Gata4, Gata6, Sox7, and Sox17 (Figures S6B and S6C). The expression of these genes was restored close to WT levels in Dpf2 and Ezh2 double KO EBs (Figures S6B and S6C), indicating that Ezh2 and Dpf2 regulate endoderm differentiation in an opposing manner but differently compared with Eed. Ezh2 and Dpf2 also opposingly regulated mesoderm differentiation (Figure S6D). The decreased expression of meso-endoderm genes in Ezh2−/− EBs (Figures S6B–S6D) occurred despite an increase in Tbx3 expression upon deletion of Ezh2 (Figure S6E). Thus, Eed and Ezh2 both repress Tbx3 in ESCs but have rather distinct effects on meso-endoderm differentiation.
Consistent with previous reports (Shen et al., 2008, Villasante et al., 2011), Nanog was upregulated in Ezh2−/− ESCs (Figure S6E). Because Nanog overexpression in ESCs is reported to repress endoderm and mesoderm lineages (Chambers and Smith, 2004), we postulated that the regulation of Nanog could explain the observed impairment of differentiation toward these lineages in Ezh2−/− ESCs (Figures S6B and S6D). Indeed, the expression of endo- and mesodermal genes in Ezh2−/− EBs increased when Nanog was knocked down by short hairpin RNA (shRNA) (Figures S6F and S6G). Nanog was downregulated when Dpf2 was deleted in Ezh2−/− ESCs (Figure S6E), which may restore the differentiation of Ezh2 and Dpf2 double KO ESCs to mesoderm and endoderm. Furthermore, we found that neural ectoderm genes were repressed in Ezh2−/− EBs, which could be restored close to WT levels upon deletion of Dpf2 (Figures S6H and S6I), demonstrating the opposing regulation of neural ectoderm differentiation by Dpf2 and Ezh2.
Taken together, Eed and Ezh2 hinder and promote meso-endoderm differentiation of ESCs, respectively. The PRC2 subunits achieve these opposing effects by acting through different downstream TFs (Tbx3 versus Nanog). In contrast, during neural-ectoderm differentiation, both PRC2 subunits repress the program, suggesting that they may have the same downstream targets in this process.
Dpf2 and Eed Regulate Tbx3 through Different Enhancers
Because DPF2 predominantly binds active enhancers in ESCs, we speculated that Dpf2 regulates Tbx3 expression by regulating H3K27ac levels at its enhancers. Indeed, we found that Dpf2 deletion in ESCs decreased H3K27ac of the previously described intronic enhancer (IE) (Buecker et al., 2014) and a distal enhancer (DE) located about 87 kb upstream of the TSS (Figure 6A). Interestingly, Dpf2 deletion decreased OCT4 and SOX2 binding, but only at the DE and not at the IE (Figure 6A), suggesting that the DE may be critical for the regulation of Tbx3 by Dpf2 in ESCs. In agreement with this, with the circular chromosome conformation capture assay (4C) using the Tbx3 promoter as a viewpoint, the Tbx3 promoter was found in spatial proximity to the DE in Dpf2fl/fl ESCs but to the IE in Dpf2−/− ESCs (Figure 6B). Moreover, deletion of the DE (Figure S7A) significantly decreased Tbx3 transcript levels (Figure 6C) and impaired meso-endoderm differentiation (Figure 6D). These data indicated that Dpf2 regulates Tbx3 expression mainly via the modulation of H3K27ac on the DE, which changes the access of OCT4 and other TFs or vice versa.
Considering how EED regulates Tbx3, we found that deletion of Eed did not affect the level of H3K27ac on either the IE or DE (Figure 6E). However, we identified a strong enrichment of H3K27me3 and EED at the IE and across the Tbx3 gene in ESCs but not at the DE (Figure 6A). As expected, KO of Eed led to the loss of H3K27me3 at the IE (Figure S7B). Moreover, the deletion of Dpf2 induced an increase of EED and H3K27me3 as well as the other two PRC2 subunits, EZH2 and SUZ12, at the IE and across the Tbx3 gene body (Figures 6A and 6F) without a change in OCT4 and SOX2 binding at the IE (Figure 6A). Thus, Dpf2 deletion in ESCs did not alter the accessibility of key pluripotency transcription factors but increased the access of PRC2 to the IE and across the Tbx3 gene body. Deletion of Dpf2 also led to decreased binding of the BRG1 on the DE region, which was not the case at the IE region because BRG1 binding was largely unaffected (Figure 6A). We also found that deletion of the IE in ESCs did not strongly affect the expression of Tbx3 in ESCs (Figure S7C), suggesting that the IE does not contribute to the downregulation of Tbx3 in Dpf2−/− ESCs. However, OCT4 and SOX2 binding increased at the IE in Eed−/− ESCs (Figure 6G), which may provide the mechanism for how the loss of Eed results in upregulation of Tbx3. Taken together, our data indicate that Dpf2 regulates Tbx3 by modulating H3K27ac and binding of pluripotency TFs at the DE, whereas Eed controls Tbx3 through the regulation of H3K27me3 across the gene body and pluripotency factor access at the IE, which results in opposite outcomes regarding Tbx3 expression.
Dpf2 and Eed Regulate Gene Expression Oppositely via Modulating Histone Modifications and Binding of Pluripotency TFs
Finally, we compared the transcription profiles of Dpf2−/− and Eed−/− ESCs to determine whether there are additional transcripts with similar trends as observed for Tbx3. We found 328 deregulated genes in both Dpf2−/− and Eed−/− ESCs (p < 0.05) (Figure S7D) and 2,482 shared target genes with both DPF2 and EED sites in their vicinity (Figure S7E). Intersecting the two sets of genes, we identified 144 genes directly regulated by Dpf2 and Eed (Figure S7F). Among those, 34 genes were downregulated in Dpf2−/− ESCs and upregulated in Eed−/− ESCs, similar to the opposing regulation of Tbx3 by Dpf2 and Eed (Figure S7G). These genes included Bmp4, Sox21, and Lama1 (Figures S7G and S7I) and were associated with embryonic development based on GO analysis (Figure S7H). Similar to Tbx3, the respective regulation of H3K27ac and H3K27me3 by Dpf2 and Eed was observed for Bmp4, Sox21, and Lama1 (Figures S7J and S7K). Moreover, the binding of OCT4 and SOX2 at these genes decreased in Dpf2−/− ESCs (Figures S7L and S7M) but increased in Eed−/− ESCs (Figures S7N and S7O). Thus, our study uncovered that Dpf2 and Eed oppositely regulate a set of genes important for embryonic development by modulating the deposition of H3K27ac and H3K27me3 and altering the access of pluripotency TFs.
Discussion
In this study, we revealed that the BAF subunit DPF2 is critical for ESC differentiation into mesoderm, endoderm, and neural ectoderm. Moreover, we show that meso-endoderm differentiation defects because of Dpf2 deletion can be rescued by restoring the expression of Tbx3 to normal levels. The differentiation defects of Dpf2 KO ESCs are different from those described for other BAF components (Ho and Crabtree, 2010), in agreement with the notion that different subunits confer different functionalities. Importantly, this study defines a functional downstream target of the BAF complex in ESCs, for which maintenance of expression is important for ESC fate decisions.
Our study further revealed an opposing regulation of endoderm and mesoderm differentiation by Dpf2 and Eed. This relationship was supported by the restored expression of endoderm and mesoderm marker genes in Eed/Dpf2 double KO EBs. We postulate that Dpf2 and Eed oppositely regulate endo- and mesoderm differentiation of ESCs via differential control of Tbx3 expression.
An antagonistic role of polycomb and BAF complexes has been reported previously through competitive binding of these complexes at the same locus (Wilson et al., 2010, Ho et al., 2011, Kadoch et al., 2017). In contrast, our work shows that Eed and Dpf2 function in meso-endoderm differentiation via their respective interaction at different enhancers, the IE and DE, respectively, at the Tbx3 locus, as summarized in Figure 7. Specifically, the loss of Eed diminished the enrichment of H3K27me3 over the Tbx3 gene, including its IE, which increased the access of OCT4 and SOX2 to the IE, which likely leads to upregulation of Tbx3. The loss of Dpf2 led to an increase of H3K27me3 deposition at the IE of Tbx3 by increasing the access of PRC2, consistent with competitive binding between PRC2 and BAF complexes at the IE. Conversely, the loss of Dpf2 significantly decreased the H3K27ac level and the access of OCT4 and SOX2 at the DE. The decrease in OCT4 binding could precede the drop of H3K27ac because the impaired physical interaction of DPF2 and OCT4 upon loss of Dpf2 may destabilize OCT4 binding. Conversely, because P300 is known to acetylate histone H3K27 (Tee and Reinberg, 2014), another possible scenario for the decrease in H3K27ac is that loss of the direct interaction between DPF2 and P300 leads to the decrease in H3K27ac in Dpf2−/− ESCs, which, in turn, may affect OCT4 binding. Regardless, the interaction between DPF2, P300, and OCT4 indicates a collaborative regulation of Tbx3 via a chromatin remodeler, chromatin modifications, and critical TFs.
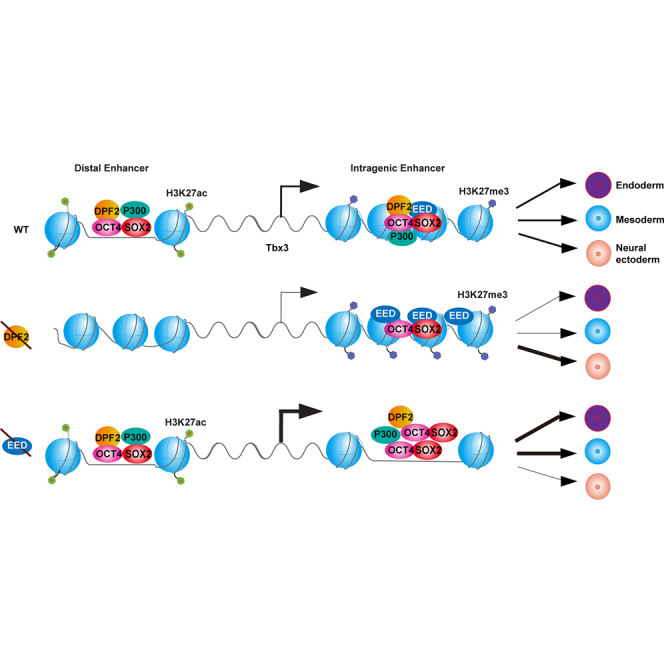
Figure 7.

Model for the Regulation of ESC Differentiation by Dpf2 and Eed via the Control of Tbx3 Expression
Dpf2 and Eed regulate Tbx3 expression via modulation of the H3K27ac level at the DE and the H3K27me3 level at the IE. Loss of Dpf2 induces downregulation of Tbx3 via a decrease of both H3K27ac and pluripotency TF binding on the DE, leading to impaired differentiation into meso-endoderm. In Eed−/− ESCs, H3K27me3 levels decrease at the IE, whereas the binding of pluripotency TFs increases, resulting in Tbx3 upregulation and enhanced differentiation to meso- and endoderm. In Dpf2−/−/Eed−/− ESCs, Tbx3 expression is restored to physiological ESC levels, as is the potential for differentiation into endo- and mesoderm.
Our study also demonstrates that the opposing regulation of targets by Dpf2 and Eed in ESCs is not limited to Eed but extends to the PRC2 subunit Ezh2. However, meso-endoderm markers were repressed in the absence of Ezh2, in contrast to their increase upon Eed deletion. We show that these differences in the differentiation defect are achieved through distinct downstream transcription factors because the opposing effect of Dpf2 and Ezh2 ensued mainly via differential regulation of Nanog.
Brg1 is a core unit of BAF complex and is required for the self-renewal and pluripotency of ESCs (Ho and Crabtree, 2010). We confirmed the interaction of DPF2 and BRG1 by immunoprecipitation and showed that these proteins extensively co-localize in the genome. Although both Brg1 and Dpf2 positively regulate Tbx3 expression in ESCs (Ho et al., 2011), Dpf2 did not affect the expression of Oct4, which is upregulated upon acute deletion of Brg1 (Bultman et al., 2000), indicating that Dpf2 mediates specific functions of the BAF complex during embryonic development. As a core factor of the BAF complex, Brg1 likely affects embryonic development by participating in various BAF complexes with different components (Ho and Crabtree, 2010, Panamarova et al., 2016). Consistent with this conclusion, loss of Dpf2 does not dramatically alter the genome-wide binding of BRG1.
In summary, PRC2 and BAF complexes are important for the ESC differentiation and embryonic development (Ho and Crabtree, 2010). Our study uncovered unique mechanisms by which a specific BAF subunit and PRC2 subunits regulate genes important for the ESC differentiation.
STAR★Methods
Key Resources Table
| REAGENT or RESOURCE | SOURCE | IDENTIFIER |
|---|---|---|
| Antibodies | ||
| Mouse monoclonal GAPDH | Abcam | ab9484 |
| Rabbit polyclonal Requiem | Sigma | SAB4502621 |
| Mouse monoclonal FLAG | Sigma | F1804 |
| Rabbit polyclonal TBX3 | Invitrogen | 42-4800 |
| Goat polyclonal OCT4 | R&D systems | AF1759 |
| Goat polyclonal SOX2 | R&D systems | AF2018 |
| Mouse monoclonal NESTIN | BD PharMingen | 556309 |
| Mouse monoclonal TUBB3 | Promega | G712A |
| Rabbit polyclonal NANOG | Abcam | Ab80892 |
| Mouse monoclonal P300 | Active motif | 61401 |
| Mouse monoclonal STAT3 | Cell Signaling Technology | 9139 |
| Rabbit monoclonal H3K27ac | Abcam | ab177178 |
| Rabbit polyclonal H3K27me3 | Millipore | 07449 |
| Rabbit polyclonal H3K4me3 | Abcam | ab8580 |
| Rabbit polyclonal H3K9ac | Abcam | ab4441 |
| Mouse monoclonal H4-tetraAC | Active motif | 39967 |
| Polyclonal goat SOX17 | R&D systems | AF1924 |
| Rabbit polyclonal GATA4 | Santa Cruz | sc-9053 |
| Goat polyclonal GATA6 | R&D systems | AF1700 |
| Rabbit polyclonal SUZ12 | Abcam | ab12073 |
| Mouse monoclonal EZH2 | BD PharMingen | 612667 |
| Rabbit polyclonal EED | Millipore | 17-10034 |
| Rabbit monoclonal BRG1 | Abcam | ab110641 |
| Mouse IgG | ThermoFisher | A-11032 |
| Alex488-conjugated donkey anti-goat IgG | ThermoFisher | A-11055 |
| Alex594-conjugated donkey anti-rat IgG | ThermoFisher | A-21209 |
| Alex488-conjugated donkey anti-mouse IgG | ThermoFisher | A-21202 |
| Alex594-conjugated donkey anti-rabbit IgG | ThermoFisher | A-21207 |
| DAPI | ThermoFisher | D1306 |
| Bacterial and Virus Strains | ||
| DH5a Competent Cells | NEB | C-29871 |
| One Shot TOP10 Chemically Competent E. coli | ThermoFisher | C404010 |
| Chemicals, Peptides, and Recombinant Proteins | ||
| LIF | Millipore | ESG1107 |
| BMP4 | R&D System | 5020-BP-010 |
| Zeocin | ThermoFisher | R25001 |
| G418 | ThermoFisher | 11811031 |
| Puromycin | ThermoFisher | A1113802 |
| Protease inhibitors | Roche | 4693159001 |
| Benzonase | Sigma | E8263-5KU |
| 2x Laemmli Sample Buffer | Bio-Rad | #1610737 |
| 3X FLAG peptide | Sigma | F4799-4MG |
| Trypsin-EDTA (0.25%), phenol red | ThermoFisher | 25200056 |
| Paraformaldehyde | Sigma | P6148-500G |
| Disuccinimidyl glutarate | ThermiFisher | 20593 |
| Triton X-100 | Sigma | T8787-50ML |
| 4-Hydroxytamoxifen | TOCRIS | 3412 |
| Tamoxifen | Sigma | T5648 |
| Annexin-APC | BD PharMingen | 550475 |
| 7-AAD | BD PharMingen | 559925 |
| SYBR Green PCR Master Mix | ThermoFisher | 4309155 |
| ABsolute QPCR Mix, ROX | ThermoFisher | AB1139A |
| SequalPrep Long PCR Kit with dNTPs | ThermoFisher | A10498 |
| Expand Long Template PCR System | Roche | 03321053103 |
| Disuccinimidyl glutarate | ThermoFisher | 20593 |
| Proteinase K | ThermoFisher | 25530049 |
| T4 DNA ligase | NEB | M0202S |
| Csp6I | Thermo Fisher | FD0214 |
| MboI | Thermo | FD0814 |
| Vivaspin500 PES centrifugal filters | Vivascience | VS0102 |
| KAPA HTP Library Preparation kit | Roche | 07961901001 |
| Critical Commercial Assays | ||
| AP staining kit | Sigma | SCR004 |
| SequalPrep Long PCR kit | Invitrogen | A10498 |
| BCA Protein Assya Kit | Pierce | 23227 |
| ECL Plus | Amersham | RPN2133 |
| RNeasy mini kit | QIAGEN | 74104 |
| TotalPrep RNA Amplification Kit | Ambion | AMIL1791 |
| NucleoSpin gDNA Clean-Up kit | Macherey-Nagel | 740230.10 |
| SuperscriptIII reverse transcriptase | Invitrogen | 18080093 |
| Click-iT EdU Pacific Blue flow cytometry Assay Kit | Invitrogen | C10636 |
| Pierce BCA Protein Assay Kit | Invitrogen | 23225 |
| Deposited Data | ||
| ChIP-seq | This study | E-MTAB-6165 |
| RNA-seq | This study | E-MTAB-6166 |
| 4C | This study | E-MTAB-6167 |
| Experimental Models: Cell Lines | ||
| E14 ESCs | This study | N/A |
| R26::CreERT2 - E14 ESCs | This study | N/A |
| R26::CreERT2 Dpf2 fl/fl E14 ESCs | This study | N/A |
| Eed −/− R26::CreERT2 Dpf2 fl/fl E14 ESCs | This study | N/A |
| Ezh2 −/− R26::CreERT2 Dpf2 fl/fl E14 ESCs | This study | N/A |
| Tbx3 DE KO ESCs | This study | N/A |
| Tbx3 IE KO ESCs | This study | N/A |
| Experimental Models: Organisms/Strains | ||
| SCID mice | Hans Scholer’s Group | N/A |
| Deposited Data | ||
| ChIP-seq data | This study | E-MTAB-6165 (ArrayExpress) |
| RNA-seq data | This study | E-MTAB-6166 (ArrayExpress) |
| 4C data | This study | E-MTAB-6167 (ArrayExpress) |
| Proteomics data | This study | PXD011806 (ProteomeXchange) |
| Oligonucleotides | ||
| Oct4 | TaqMan | Mm00658129_gH |
| Klf4 | TaqMan | Mm00516104_m1 |
| Nanog | TaqMan | Mm02384862_g1 |
| Rex1 | TaqMan | Mm03053975_g1 |
| Nr0b1 | TaqMan | Mm00431729_m1 |
| Klf2 | TaqMan | Mm01244979_g1 |
| Klf5 | TaqMan | Mm00456521_m1 |
| Gapdh | TaqMan | 4352339E |
| Tbx3 | TaqMan | Mm01195726_m1 |
| GATA6 | TaqMan | Mm00802636_m1 |
| GATA4 | TaqMan | Mm00484689_m1 |
| Sox17 | TaqMan | Mm00488363_m1 |
| FGF5 | TaqMan | Mm00438918_m1 |
| Sox1 | TaqMan | Mm00486299_s1 |
| Pax6 | TaqMan | Mm00443072_m1 |
| Brachyury | TaqMan | Mm01318252_m1 |
| Tubb3 | TaqMan | Mm00727586_s1 |
| Dpf2 | TaqMan | Mm00599980_m1 |
| Nestin | TaqMan | Mm00450205_m1 |
| Pdgfra | TaqMan | Mm00440701_m1 |
| GATA2 | TaqMan | Mm00492301_m1 |
| Bmp4 | TaqMan | Mm00432087_m1 |
| Hand1 | TaqMan | Mm00433931_m1 |
| Sox21 | TaqMan | Mm00844350_s1 |
| Gjb3 | TaqMan | Mm00433647_m1 |
| Lama1 | TaqMan | Mm01226102_m1 |
| Ncam1 | TaqMan | Mm01149710_m1 |
| Pcdh17 | TaqMan | Mm00977568_m1 |
| See Table S5 for qPCR and gRNA sequences | This Study | N/A |
| Recombinant DNA | ||
| Dpf2 targeting vector | EUCOMM resource | N/A |
| C-FTAP-tag Dpf2 knockin vector | This study | N/A |
| pPyCAG-Dpf2-IZ | Hitoshi Niwa | N/A |
| pPyCAG-Tbx3-IN | Hitoshi Niwa | N/A |
| pCAGGs-FlpE | This study | N/A |
| Nanog shRNA | Wu Qiang | N/A |
| Tbx3 shRNA | April Kartikasari | N/A |
| Reagent or Resource | ||
| GMEM | Sigma-Aldrich | G2549 |
| FCS | GIBCO | 10439024 |
| Non-essential amino acid | GIBCO | 11140050 |
| Sodium pyruvate | GIBCO | 11360070 |
| 2-mercaptoethanol | GIBCO | 21985023 |
| L-glutamine | GIBCO | 25030081 |
| TCEP | Sigma | 75259 |
| Iodoacetamide | Sigma | I6125 |
| colloidal Coomassie | Sigma | B2025 |
| AggreWell 400 plates | STEMCELL Technoligies | 34421 |
| Dynabeads Protein G | Invitrogen | 10003D |
| 4-12% Bis-Tris Novex gel | Invitrogen | NP0321BOX |
| PVDF membranes | Biorad | 1620177 |
| Software and Algorithms | ||
| ChromHMM v1.1.0 | Chronis et al., 2017 | N/A |
| Bowtie2 v2.2.1 | Langmead et al., 2009 | N/A |
| Cufflinks v2.2.1 | Trapnell et al., 2010 | N/A |
| MACS2 v20140616 | Zhang et al., 2008 | N/A |
| BedTools v2.27 | Quinlan and Hall, 2010 | N/A |
| HOMER v4.9.0 | Heinz et al., 2010 | N/A |
| Metascape | http://metascape.org | N/A |
| Proteome Discover 1.4 | Thermofisher | N/A |
| Tophat version 2.0.13 | Trapnell et al., 2009 | N/A |
| Mascot 2.5 | Matrix Science | N/A |
Contact for Reagent And Resource Sharing
Further information and requests for reagents may be directed to and will be fulfilled by the Lead Contact, Wensheng Zhang (zhangwensheng@suda.edu.cn).
Experimental Model and Subject Details
Cell culture
E14 ESCs were cultured in GMEM (Sigma) supplemented with 10% FCS, 1 × NEAA, 1 mM sodium pyruvate, 0.1 mM 2-mercaptoethanol, 2 mM L-glutamine, and LIF (Millipore) on gelatin coated plates, or cultured in N2B27 medium with BMP4 (10ng/ml) and LIF.
Method Details
Colony formation assay
For colony formation assays, dissociated cells with trypsin were plated at about 1,000 cells per 10cm plate. ESCs were cultured for 7 days and stained for alkaline phosphatase using the AP staining kit (Sigma). We scored colonies with ∼90% AP-positive cells as un-differentiated, colonies with ∼5% AP-positive staining cells as differentiated, and colonies of intermediate AP-positive cell number as partially differentiated.
Teratoma formation assay
5 × 10⁶ cells were injected subcutaneously into the flank of SCID mice. After 4-5 weeks, teratomas were isolated, transferred into Bouin’s fixative overnight and subjected to histological examination with H&E staining based on standard protocols. All tissues were examined by a board-certified anatomic pathologist (M.P.), blinded to the genotype of the ESCs.
Generation of a conditional knockout of Dpf2 in ESCs
The Dpf2 targeting vector was linearized and electroporated into R26::CreERT2 E14 cells to generate heterozygous ESC lines after G418 selection. Heterozygous ESC clones were transiently transfected with a FLP recombinase encoding plasmid (pCAGGs-FlpE), converting the initial knockout allele (Dpf2+/−, lacZ positive, G418 resistant) into a “wild-type” (WT) allele with two loxP sites flanking exon 4 (floxed allele) (Dpf2fl/+, reverted WT (rWT), lacZ negative, G418 sensitive). Multiple independent rWT ESC clones were then electroporated with the original Dpf2 knockout vector and again selected with G418. Targeting of the second WT allele was confirmed by the presence of both the rWT allele and the second knockout allele through long-range PCR reactions (SequalPrep Long PCR kit, Invitrogen). Selected heterozygous ESC lines were converted to the conditional Dpf2fl/fl state by transiently transfecting FlpE.
Generation of Eed and Ezh2 knockout ESC clones
2ug of gRNA and 2ug of Cas9 plasmids were electroporated to ESCs. After 7 days’ selection with 175ug/ml of G418, colonies were picked up for genotyping and confirmed by Sanger sequencing.
Co-Immunoprecipitation (Co-IP) and Western Blotting
Cells were lysed in lysis buffer (1% NP40; 50mM Tris-HCl, pH7.4; 150mM NaCl; 1mM EDTA with protease inhibitors (Roche)). Protein concentrations were determined using the BCA Protein Assay Kit (Pierce). For immunoprecipitation, cell lysates were incubated with the indicated antibodies for 1 hour. Protein G-associated Dynabeads® (Thermo Fisher) were added at 4°C overnight. After washing three times with lysis buffer, 1X protein SDS loading buffer (Bio-Rad) was added and boiled for 5 minutes. The supernatant was cooled on ice for 5 minutes before loading on the gel for immunoblotting. Proteins were fractionated on a 4%–12% Bis-Tris Novex gel (Invitrogen), electroblotted onto PVDF membranes, and membranes probed sequentially with respective antibodies. Blots were incubated with secondary antibodies and developed with ECL Plus (Amersham).
Affinity purification of the DPF2 complex
Formaldehyde-crosslinked ESCs expressing DPF2-FTAP were used for affinity purification of DPF2, and an ESC line expressing a beta-gal-FTAP fusion protein (Bode et al., 2016) was used as a control. Whole cell extracts were prepared using a high salt lysis buffer (450 mM NaCl, 0.2% Nonidet P-40) as previously described (Pardo et al., 2010), with several modifications. Briefly, cells were crosslinked with 1% formaldehyde for 10 minutes at room temperature; after a 10 min incubation of cells in lysis buffer on ice, 1 ul/mL of benzonase (99% purity, Sigma) was added and the cell suspension was incubated at 37°C for 15 min. The lysate was then cleared by centrifugation at 16,100 rcf. for 15 min at 4°C. FLAG affinity purification was essentially performed as previously described. Anti-FLAG Dynal beads were prepared by crosslinking M2 FLAG antibody (Sigma) to Protein G-Dynal beads (Invitrogen) in accordance with the manufacturer’s instructions. Whole-cell extracts were incubated with anti-FLAG M2 Dynal beads in buffer containing 150 mM NaCl and 0.1% NP-40 for 90 min at 4°C. Beads were washed three times with RIPA buffer, then 3 times with RIPA buffer containing 450 mM NaCl, and once with elution buffer (10 mM Tris-HCl pH 8, 150 mM NaCl, 0.02% Nonidet P-40). Proteins were eluted in elution buffer containing 200 μg/mL 3X FLAG peptide (Sigma). Eluates were concentrated in Vivaspin500 PES centrifugal filters (10 kDa cut-off, Vivascience), reduced with 5 mM TCEP (Sigma), and alkylated with 10 mM iodoacetamide (Sigma). Samples were fractionated by polyacrylamide gel electrophoresis using Novex NuPAGE Bis-Tris 4%–12% gels (Invitrogen) and stained with colloidal Coomassie (Sigma) as previously described (Pardo et al., 2010). Full gel lanes were sliced in 7-24 bands, gel pieces were de-stained completely and digested with trypsin (sequencing grade, Roche). Peptides were extracted using 0.5% formic acid-50% acetonitrile and dried in a Speed Vac (Thermo Fisher Scientific).
Mass spectrometry
Peptides were re-dissolved in 0.5% formic acid and analyzed on an Ultimate 3000 RSLCnano System (Dionex) coupled to an LTQ FT Ultra (Thermo Fisher Scientific) hybrid or Orbitrap Velos mass spectrometer equipped with a nanospray source. The peptides were first loaded and desalted on a PepMap C18 trap column (0.1 mm id x 20 mm, 5μm), then separated on a PepMap 75 μm id x 25 cm column (5μm) over a 60 min linear gradient of 4 – 42% B / 90 min cycle time when coupled with FT Ultra, or 15 cm column over a 30 min linear gradient of 4 – 40% B / 60 min cycle time when coupled with Orbitrap Velos, where B is 80% CH3CN/0.1% Formic Acid. The LTQ FT Ultra was operated in the “top 5” data-dependent acquisition mode with the preview mode of FT master scan enabled. The FT full scan was set at m/z 380 – 1800 with the resolution at 100,000 at m/z 400 and AGC at 1x10⁶ with a maximum injection time at 500 msec. The five most abundant multiply-charged precursor ions, with a minimal signal above 1000 counts, were dynamically selected for CID fragmentation (MS/MS) in the LTQ ion trap, with the AGC set at 1x10⁴ with the maximum injection time at 200 msec. The dynamic exclusion was set at ± 20 ppm for 45 s. For analysis on the LTQ Orbitrap Velos, the mass spectrometer was operated in the “top 10” data-dependent acquisition mode with preview mode of FT master scan enabled. The Orbitrap full scan was set at m/z 380 – 1500 with the resolution at 100,000 at m/z 400 and AGC at 1x10⁶ with a maximum injection time at 200 msec. The 10 most abundant multiply-charged precursor ions, with a minimal signal above 2000 counts, were dynamically selected for CID fragmentation (MS/MS) in the LTQ ion trap, with the AGC set at 5000 with the maximum injection time at 100 msec. The dynamic exclusion was set at ± 10 ppm for 60 s.
Immunofluorescence staining
Cells were fixed in 4% paraformaldehyde for 10 minutes at room temperature, blocked, and permeabilized with 3% serum in PBS with 0.3% Triton X-100 and then incubated with the indicated antibodies at 4°C overnight. After washing, cells were incubated with Alex594-conjugated goat anti-mouse IgG (ThermoFisher, A-11032), Alex488-conjugated donkey anti-goat IgG (ThermoFisher, A-11055) or Alex594-conjugated donkey anti-rat IgG (ThermoFisher, A-21209) and counter-stained with DAPI to detect nuclei.
Quantitative RT-PCR
Total RNA was isolated with RNeasy mini kit (QIAGEN). cDNA was synthesized with Superscript III reverse transcriptase (Invitrogen). Real-time PCR was performed with TaqMan Gene Expression Assay (Applied Biosystems). Gene expression was determined relative to Gapdh transcript levels. Standard deviation was calculated from PCR triplicates. Error bars give the SD of three technical qPCR replicates from a representative experiment.
Apoptosis Assays
Dpf2fl/fl and WT ESCs were treated with ethanol or 0.65 μM of 4-Hydroxytamoxifen (4-OHT) for 96 hours, subsequently, cells were harvested with trypsin and washed with PBS. ESCs were then stained with Annexin-APC (BD Biosciences) and 7-AAD (BD Biosciences) according to the manufacturer’s instructions (BD Biosciences) and analyzed by flow cytometry. Cells were gated and analyzed for annexin V and 7-AAD. High level of annexin V and low levels of 7-aminoactinomycin D (7-AAD) show early apoptosis in cells, whereas high levels of both annexin V and 7-AAD indicate a late stage of apoptosis. Cells were considered healthy if the levels of both annexin V and 7-ADD were low.
Cell Cycle assay
Dpf2fl/fl and WT E14 cells were cultured in the presence or absence of 4-OHT condition for five days before the cell cycle assay was performed. ESCs were trypsinized, re-plated and cultured in standard lif/serum ESC medium with 10uM of EdU. After incubation for 1 to 3 hours, cells were harvested for the cell cycle assay using the Click-iT@ EdU Pacific Blue flow cytometry Assay Kit (Invitrogen).
Chromatin Immunoprecipitation (ChIP) coupled with Quantitative Real-Time PCR (ChIP-qPCR)
ChIP-qPCR was performed as previously described (Chen et al., 2013). Briefly, ChIP experiment were performed as described below in the ChIP-seq section. After purification of the immunoprecipitated DNA, 1 μL was used per qPCR reaction. Bound regions were detected by using paired primers given in Table S5. Real -time PCR was run using SYBR Green Mix (2x) from Applied Biosystems. Each reaction contained 10 μL 2x SYBR Green Mix, 1 μL 10 μM Primer mix, 8 μL H2O and 1 μL immunoprecipitated DNA. The program was used as follows: 98°C 5 minutes, (98°C 20 s, 60°C 30 s, 72°C 20 s) X 40. Quantitative PCR was performed at least in duplicate, from at least two independent experiments, and data were normalized to input values and calculated as percent input recovery using the ΔΔCt method.
ChIP-seq
ChIP was typically performed in Dpf2fl/fl and Dpf2−/− ESC lines, except for DPF2, which were done in C-FTAP tag Dpf2 knockin ESCs and and EBs formed for 2 and 4 days respectively. Transcription factor and epigenetic regulator occupancy data generated in this study were acquired using ChIP after crosslinking cells. Briefly, cells were grown to a final concentration of 5x10⁷ cells for each ChIP-seq experiment. To stabilize DPF2, BRG1, P300, EED, Oct4 and Sox2 on chromatin, cells were treated with 2 mM disuccinimidyl glutarate (DSG) for 10 minutes prior to formaldehyde crosslinking. For all other targets (H3K4me3, H3K4me1, H3K27ac, H3K9ac, H4tetra-ac, H3K27me3), cells were cross-linked at room temperature by the addition of formaldehyde to 1% final concentration for 10 minutes and quenched with 0.125 M final concentration of glycine. Cross-linked cells were re-suspended in sonication buffer (50mM HEPES-KOH pH 7.5, 140mM NaCl, 1mM EDTA, 1% Triton X-100, 0.1% Na-deoxycholate, 0.1% SDS) and sonicated using a Diagenode Bioruptor for three 10-minute rounds using pulsing settings (30 s ON; 1 min OFF). 10 μg of sonicated chromatin was then incubated overnight at 4°C with 5 μg of Flag antibody conjugated to magnetic beads. Following the IP, beads were washed twice with RIPA buffer (50mM Tris-HCl pH8, 150 mM NaCl, 2mM EDTA, 1% NP-40, 0.1% Na-deocycholate, 0.1% SDS), low salt buffer (20mM Tris pH 8.1, 150mM NaCl, 2mM EDTA, 1% Triton X-100, 0.1% SDS), high salt buffer (20mM Tris pH 8.1, 500mM NaCl, 2mM EDTA, 1% Triton X-100, 0.1% SDS), LiCl buffer (10mM Tris pH 8.1, 250mM LiCl, 1mM EDTA, 1% Na-deoxycholate, 1% NP-40), and 1X TE. Finally, DNA was extracted by reverse crosslinking at 60°C overnight with proteinase K (20ug/μL) and 1% SDS followed by phenol:chloroform:isoamyl alcohol purification and ethanol precipitation. All protocols for Illumina/Solexa sequencing library preparation, sequencing, and quality control were performed as recommended by Illumina, with the minor modification of limiting the PCR amplification step to 10 cycles and sequenced using single-end 50 bp reactions on a HiSeq4000.
RNA-seq
Total RNA was purified by RNeasy Minikit (QIAGEN) according to the manufacturer’s manual. RNA concentration was determined using Nanodrop, and 500 ng of total RNA was used for library construction using the KAPA Stranded mRNA-seq Kit. Sequencing was performed on Illumina HiSeq 2500 machines with 125 bp pair-end mode.
Microarray analysis
Dpf2fl/fl ESCs were treated with ethanol or 4-OHT for 48 hours before the induction of EBs formation. cRNA samples for global gene expression analyses were prepared with the linear TotalPrep RNA Amplification Kit (Ambion). Hybridizations on mouse-8 V2 chips (Illumina) were carried out as recommended by the manufacturer.
Circularized Chromosome Conformation Capture (4C-seq)
4C experiments were performed on Dpf2fl/fl and Dpf2−/− ESCs using two 4-cutter DNA restriction enzymes. The experiments were carried out in two technical replicates, where around 10 million cells per biological sample were used. Cells were cross-linked with 1% formaldehyde for 10 minutes followed by cell lysis and nuclei isolation. The resulting nuclei were enzymatically digested with 1 μL/μg of fast digest MboI (Thermo Fisher Scientific) for 4.5 hours at 37°C. Subsequently, the material was ligated with 12 Weiss units of T4 DNA ligase (New England Biolabs) for 4.5 hours at 16°C. The ligation products were then purified using phenol-chloroform-isoamyl alcohol followed by precipitation with ethanol. Subsequently the purified DNA was subjected to secondary digestion with 1 μL/μg of Csp6I (Thermo Fisher Scientific) for 2 hours at 37°C. The digested DNA was then ligated with 12 Weiss units of T4 DNA ligase (New England Biolabs) for 4.5 hours at 16°C to generate circularized chimeric DNA, which was ethanol precipitated and cleaned using NucleoSpin gDNA Clean-Up (Macherey-Nagel) silica-membrane columns. The reading primer was designed for a 229bp region downstream of the TSS of Tbx3 gene and the amplification was carried out using Expand Long Template PCR System (Roche). The sequence of the reading primer was 5′-TTGCACCCGTCTTCTTGATC-3′. The amplification reactions consisted of 100ng of DNA primed with 35 picomoles of each, forward and reverse primers, and 200 μM dNTPs. 1.75 U of a Taq and Tgo polymerase blend catalyzed the reaction. Thermal cycling was performed in GeneAmp PCR System 9700 (Applied Biosystems) following the protocol of initial denaturation at 94°C for 2 min, 29 cycles of 94°C for 10 s, 55°C for 1 min, 68°C for 3 min, and ended by the final elongation at 68°C for 5 min. Amplification products were directly used for DNA libraries preparation for Illumina single index, paired end sequencing using NextSeq 500 system (Illumina Inc.). The DNA libraries were prepared using KAPA HTP Library Preparation kit for Illumina Platforms following manufacturer’s instructions entailing the end-repair of the amplified fragments, as well as A-tailing and TruSeq LT (Illumina Inc.) adaptor ligation. Prepared DNA libraries were purified and subjected for sequencing. 4C-seq was done in replicates.
Quantification and Statistical Analysis
Statistics
RNA-seq and ChIP-seq raw data are discrete count-based data, which follow negative binomial or Poisson distribution (Marioni et al., 2008, Love et al., 2014), and no additional methods were used to determine whether the data met assumptions of the statistical approach. The experiments in Figures 2C and 2D and S1A were performed once with two independent Dpf2 mutant ESC clones; all other experiments were performed three times or more. In all Figures, n = number of biological replicates or number of clones. All q-PCR data represent the mean of three technical replicates. All error bars represent standard deviation (SD). The Student’s t test (unpaired, two-sided) was used to determine the significance of changes in the qPCR using Microsoft Excel. ∗ indicates p < 0.05, ∗∗ p < 0.01, ∗∗∗ < 0.001. For all other statistics tests, they were specified and performed using indicated bioinformatics software described below in this section.
Mass spectrometry analysis
Raw files were processed with the Proteome Discover 1.4 pipeline (Thermo Fisher Scientific). Database searches were performed with Mascot 2.5 (Matrix Science) against the mouse SwissProt database (v. January 2015). The search parameters were: trypsin/P with a maximum of 2 missed cleavages, 10 ppm mass tolerance for MS, 0.5 Da tolerance for MS/MS, with variable modifications of carbamidomethyl (C), N-acetylation (protein N-term), deamidation (NQ), formyl (N-term), oxidation (M), and Gln- > pyro-Glu (N-term Q). Database search results were refined through processing with Mascot Percolator. Protein identification required at least one high-confidence peptide (FDR < 1%). External contaminants (keratins, albumin, casein, immunoglobulins and TEV protease) were removed before further analysis. Protein lists from DPF2-FTAP experiments were compared to beta-gal-FTAP controls. High confidence DPF2 interactors were identified as those solely in DPF2-FTAP experiments, or with at least 3 times more sequences in DPF2-FTAP than in control experiments. We report these high confidence interactors identified by more than one peptide in at least one replicate in Table S1.
Data analysis
For ChIP-seq data, reads were mapped to the mouse mm9 reference genome using bowtie version 1.1.1 (Langmead et al., 2009) with -m 1 flag, which only allows uniquely mapped reads to be considered in the downstream analysis. Peaks were called using Macs2 (version 2.1.0.20151222)_(Zhang et al., 2008) with–nomodel–extsize 200 -q 0.01 flags. Two biological replicates were performed per experiment, and only peaks that were present in both replicates were considered. De novo Motif discovery was done using findMotifsGenome.pl from the HOMER suite (Heinz et al., 2010) (version 4.8) on the narrowPeak files returned from Macs2. For the analysis of peak overlap between different factors, intersectBed from the bedtools suite (Quinlan and Hall, 2010) was used, and overlapping peaks were defined as two peaks with at least 1 bp overlap. For differential levels of H3K27ac and differential binding by OCT4 or BRG1 in Dpf2fl/fl and Dpf2−/− ESCs, a union peak set was created first between wild-type and knockout ChIP-seq samples using mergeBed from the bedtools suite. Briefly, the narrowPeak files from wild-type and knockout ESCs were merged if they had at least 1 bp overlap. The number of mapped reads from each condition was counted on each of the union peaks using coverageBed from the bedtools suite. The number of reads of each union peak was normalized by the sequencing depth of different samples. For each union peak of OCT4, BRG1 and H3K27ac, we assigned differentially bound genomic locations if at least 2-fold difference between the wild-type and knockout samples was observed.
For RNA-seq data analysis, reads were mapped to the mouse mm9 reference genome with Tophat (Trapnell et al., 2009) version 2.0.13 and supplied with gene annotation from RefSeq. Gene expression was quantified by cuffquant, and differential gene expression test was performed using cuffdiff. Both cuffquant and cuffdiff were from the cufflinks package (Trapnell et al., 2010) (version 2.2.1).
Microarray data analysis was done in BeadStudio and MS Excel.
GO analysis
GO analysis for enriched biological processes was performed using Metascape (http://metascape.org) to find significantly enriched terms (P value ≤ 0.01).
ChromHMM ESC states, TF enrichments and data visualization
Chromatin state segmentations for the ESCs were obtained from (Chronis et al., 2017). To calculate the enrichment of binding events in distinct chromatin states, we utilized the ChromHMM OverlapEnrichment function as previously described (Chronis et al., 2017). The enrichment score was calculated as the ratio between observed and expected overlap between the binding event of interest and chromatin state after accounting their relative size and the size of the mouse genome.
To produce the heatmaps in Figures 3F/H, 4C/G/I and S3D/E we aligned the given feature (such as peaks of DPF2, BRG1 or EED) at their summit and tiled the flanking up- and downstream regions within ± 2kb in 100bp bins. For each location, we calculated RPKM values over all 100bp bins by using the number of sequencing reads that overlapped with each bin after extension by 50bp in the direction of the alignment. To normalize to the input control, we computed at each corresponding bin a log2 input-normalized RPKM value as log2(RPKMFOREGROUND) - log2(RPKMInput). For visualization in figures, each 100 bp bin was displayed with JavaTreeview. All metaplots were produced by computing the average input-normalized RPKM value for each 100bp bin across all locations in the given set. In Figure S4D, the fold-enrichment of Dpf2 in the vicinity (+/− 20Kb of the TSS) of up- and downregulated genes at sites exhibiting H3K27ac, Oct4 or Brg1 binding gain or reduction was calculated with the following formulas:(% Upregulated Dpf2 bound genes within region of interest) / (%All Dpf2 bound genes within regions of interest) and (% Downregulated Dpf2 bound genes within region of interest)/ (%All Dpf2 bound genes within regions of interest).
TF clustering and pairwise comparisons with optimal leaf ordering
K-means clustering was employed to identify constitutive and stage specific binding of DPF2 in ESCs and EBs in Figures 5A. To define these TF clusters, the genome was tiled into 500bp windows and the presence of TF peaks in each bin was determined. This procedure resulted in a vector of binary data for each TF reflecting its absence or presence within 500bp windows across the genome. The windows represented by these vectors were then clustered using R’s k-means function applying the Hartigan-Wong method to obtain groups of windows exhibiting common combinatorial binding patterns across the genome.
In Figure 3E we applied complete linkage hierarchical clustering with optimal leaf ordering to cluster the enrichments of all pairs of TFs (Bar-Joseph et al., 2001). The pairwise enrichments at base-pair resolution were calculated as the observed overlap divided by the expected overlap based on the binomial background model that treats both transcription factors as independent:
- where the numerator is the size of the overlap between peaks of TFA and TFB and the denominator is the product between the total number of bp occupied by peaks of TFA and TFB divided by the size of the genome (G). The maximum enrichment was set to 500. TF datasets for TFs not generated at this study were obtained from Chronis et al., GEO: GSE90895.
Circularized Chromosome Conformation Capture (4C) analysis
Resulting data were mapped with Bowtie 2 after trimming primer sequences. Duplicates and low quality reads were discarded. Counts for restriction enzyme fragments were generated using Bioconductor package FourCSeq (Klein et al., 2015). Only the interactions that were supported by at least 16 read pairs (corresponding to FDR = 0.1) in both replicates were taken forward.
Data and Software Availability
The accession numbers for ChIP-seq, RNA-seq and 4C data are E-MTAB-6165, E-MTAB-6166 and E-MTAB-6167, respectively on ArrayExpress. The proteomics data are available via ProteomeXchange with identifier PXD011806.
Acknowledgments
We thank A. Kartikasari for sharing the Tbx3 shRNA plasmid, Q. Wu for the Nanog shRNA plasmid, and H. Niwa for the pCAG-Tbx3-IN plasmid. We thank B.L. Ng for support with FACS; A. Kleger for valuable discussions; and W. Skarnes, A. Bradley, S. Teichmann, A. Bassett, and P. Tate for generous support of the work. This work was supported by grants from the National Natural Science Foundation of China (31471389) and the Wellcome Trust. K.P. was supported by the Eli and Edythe Broad Center of Regenerative Medicine and Stem Cell Research, the David Geffen School of Medicine, the Jonsson Comprehensive Cancer Center at UCLA, NIH P01 GM099134, and a faculty scholar grant from the Howard Hughes Medical Institute.
Author Contributions
W.Z., C.C., and K.P. conceived the study. W.Z., C.C., X.C., H.Z., R.S., L.C., G.W., Y.Y., M.P., and B.G. performed the experiments; W.Z., C.C., and X.C. performed ChIP-Seq. R.S. performed 4C-seq. M.P., L.Y., and J.C. performed the proteomics analysis. G.W. performed the teratoma assay. B.G. performed expression microarrays. M.M.P. analyzed the teratoma data. W.Z., C.C., X.C., M.M.P., P.S., and K.P. interpreted the data. C.C., X.C., and P.S. performed the bioinformatics analysis. Z.Z. helped with figure preparation. W.Z., C.C., J.N., P.S., and K.P. wrote the paper with the assistance of all other authors.
Declaration of Interests
The authors declare no competing interests.
Published: January 3, 2019
Footnotes
Supplemental Information includes seven figures and five tables and can be found with this article online at https://doi.org/10.1016/j.stem.2018.12.001.
Supplemental Information
# Peptides indicates number of unique peptide sequences matched; # PSM indicates number of peptide spectrum matches.
References
- Bar-Joseph Z., Gifford D.K., Jaakkola T.S. Fast optimal leaf ordering for hierarchical clustering. Bioinformatics. 2001;17(Suppl 1):S22–S29. doi: 10.1093/bioinformatics/17.suppl_1.s22. [DOI] [PubMed] [Google Scholar]
- Bode D., Yu L., Tate P., Pardo M., Choudhary J. Characterization of Two Distinct Nucleosome Remodeling and Deacetylase (NuRD) Complex Assemblies in Embryonic Stem Cells. Mol. Cell. Proteomics. 2016;15:878–891. doi: 10.1074/mcp.M115.053207. [DOI] [PMC free article] [PubMed] [Google Scholar]
- Boyer L.A., Plath K., Zeitlinger J., Brambrink T., Medeiros L.A., Lee T.I., Levine S.S., Wernig M., Tajonar A., Ray M.K. Polycomb complexes repress developmental regulators in murine embryonic stem cells. Nature. 2006;441:349–353. doi: 10.1038/nature04733. [DOI] [PubMed] [Google Scholar]
- Buecker C., Srinivasan R., Wu Z., Calo E., Acampora D., Faial T., Simeone A., Tan M., Swigut T., Wysocka J. Reorganization of enhancer patterns in transition from naive to primed pluripotency. Cell Stem Cell. 2014;14:838–853. doi: 10.1016/j.stem.2014.04.003. [DOI] [PMC free article] [PubMed] [Google Scholar]
- Bultman S., Gebuhr T., Yee D., La Mantia C., Nicholson J., Gilliam A., Randazzo F., Metzger D., Chambon P., Crabtree G., Magnuson T. A Brg1 null mutation in the mouse reveals functional differences among mammalian SWI/SNF complexes. Mol. Cell. 2000;6:1287–1295. doi: 10.1016/s1097-2765(00)00127-1. [DOI] [PubMed] [Google Scholar]
- Chamberlain S.J., Yee D., Magnuson T. Polycomb repressive complex 2 is dispensable for maintenance of embryonic stem cell pluripotency. Stem Cells. 2008;26:1496–1505. doi: 10.1634/stemcells.2008-0102. [DOI] [PMC free article] [PubMed] [Google Scholar]
- Chambers I., Smith A. Self-renewal of teratocarcinoma and embryonic stem cells. Oncogene. 2004;23:7150–7160. doi: 10.1038/sj.onc.1207930. [DOI] [PubMed] [Google Scholar]
- Chen X., Müller G.A., Quaas M., Fischer M., Han N., Stutchbury B., Sharrocks A.D., Engeland K. The forkhead transcription factor FOXM1 controls cell cycle-dependent gene expression through an atypical chromatin binding mechanism. Mol. Cell. Biol. 2013;33:227–236. doi: 10.1128/MCB.00881-12. [DOI] [PMC free article] [PubMed] [Google Scholar]
- Cho L.T., Wamaitha S.E., Tsai I.J., Artus J., Sherwood R.I., Pedersen R.A., Hadjantonakis A.K., Niakan K.K. Conversion from mouse embryonic to extra-embryonic endoderm stem cells reveals distinct differentiation capacities of pluripotent stem cell states. Development. 2012;139:2866–2877. doi: 10.1242/dev.078519. [DOI] [PMC free article] [PubMed] [Google Scholar]
- Chronis C., Fiziev P., Papp B., Butz S., Bonora G., Sabri S., Ernst J., Plath K. Cooperative Binding of Transcription Factors Orchestrates Reprogramming. Cell. 2017;168:442–459.e20. doi: 10.1016/j.cell.2016.12.016. [DOI] [PMC free article] [PubMed] [Google Scholar]
- Ernst J., Kheradpour P., Mikkelsen T.S., Shoresh N., Ward L.D., Epstein C.B., Zhang X., Wang L., Issner R., Coyne M. Mapping and analysis of chromatin state dynamics in nine human cell types. Nature. 2011;473:43–49. doi: 10.1038/nature09906. [DOI] [PMC free article] [PubMed] [Google Scholar]
- Forsburg S.L. Eukaryotic MCM proteins: beyond replication initiation. Microbiol. Mol. Biol. Rev. 2004;68:109–131. doi: 10.1128/MMBR.68.1.109-131.2004. [DOI] [PMC free article] [PubMed] [Google Scholar]
- Gabig T.G., Mantel P.L., Rosli R., Crean C.D. Requiem: a novel zinc finger gene essential for apoptosis in myeloid cells. J. Biol. Chem. 1994;269:29515–29519. [PubMed] [Google Scholar]
- Hall J., Guo G., Wray J., Eyres I., Nichols J., Grotewold L., Morfopoulou S., Humphreys P., Mansfield W., Walker R. Oct4 and LIF/Stat3 additively induce Krüppel factors to sustain embryonic stem cell self-renewal. Cell Stem Cell. 2009;5:597–609. doi: 10.1016/j.stem.2009.11.003. [DOI] [PubMed] [Google Scholar]
- Heinz S., Benner C., Spann N., Bertolino E., Lin Y.C., Laslo P., Cheng J.X., Murre C., Singh H., Glass C.K. Simple combinations of lineage-determining transcription factors prime cis-regulatory elements required for macrophage and B cell identities. Mol. Cell. 2010;38:576–589. doi: 10.1016/j.molcel.2010.05.004. [DOI] [PMC free article] [PubMed] [Google Scholar]
- Ho L., Crabtree G.R. Chromatin remodelling during development. Nature. 2010;463:474–484. doi: 10.1038/nature08911. [DOI] [PMC free article] [PubMed] [Google Scholar]
- Ho L., Miller E.L., Ronan J.L., Ho W.Q., Jothi R., Crabtree G.R. esBAF facilitates pluripotency by conditioning the genome for LIF/STAT3 signalling and by regulating polycomb function. Nat. Cell Biol. 2011;13:903–913. doi: 10.1038/ncb2285. [DOI] [PMC free article] [PubMed] [Google Scholar]
- Ivanova N., Dobrin R., Lu R., Kotenko I., Levorse J., DeCoste C., Schafer X., Lun Y., Lemischka I.R. Dissecting self-renewal in stem cells with RNA interference. Nature. 2006;442:533–538. doi: 10.1038/nature04915. [DOI] [PubMed] [Google Scholar]
- Kadoch C., Crabtree G.R. Mammalian SWI/SNF chromatin remodeling complexes and cancer: Mechanistic insights gained from human genomics. Sci. Adv. 2015;1:e1500447. doi: 10.1126/sciadv.1500447. [DOI] [PMC free article] [PubMed] [Google Scholar]
- Kadoch C., Williams R.T., Calarco J.P., Miller E.L., Weber C.M., Braun S.M., Pulice J.L., Chory E.J., Crabtree G.R. Dynamics of BAF-Polycomb complex opposition on heterochromatin in normal and oncogenic states. Nat. Genet. 2017;49:213–222. doi: 10.1038/ng.3734. [DOI] [PMC free article] [PubMed] [Google Scholar]
- Klein F.A., Pakozdi T., Anders S., Ghavi-Helm Y., Furlong E.E., Huber W. FourCSeq: analysis of 4C sequencing data. Bioinformatics. 2015;31:3085–3091. doi: 10.1093/bioinformatics/btv335. [DOI] [PMC free article] [PubMed] [Google Scholar]
- Krasteva V., Crabtree G.R., Lessard J.A. The BAF45a/PHF10 subunit of SWI/SNF-like chromatin remodeling complexes is essential for hematopoietic stem cell maintenance. Exp. Hematol. 2017;48:58–71.e15. doi: 10.1016/j.exphem.2016.11.008. [DOI] [PMC free article] [PubMed] [Google Scholar]
- Lange M., Kaynak B., Forster U.B., Tönjes M., Fischer J.J., Grimm C., Schlesinger J., Just S., Dunkel I., Krueger T. Regulation of muscle development by DPF3, a novel histone acetylation and methylation reader of the BAF chromatin remodeling complex. Genes Dev. 2008;22:2370–2384. doi: 10.1101/gad.471408. [DOI] [PMC free article] [PubMed] [Google Scholar]
- Langmead B., Trapnell C., Pop M., Salzberg S.L. Ultrafast and memory-efficient alignment of short DNA sequences to the human genome. Genome Biol. 2009;10:R25. doi: 10.1186/gb-2009-10-3-r25. [DOI] [PMC free article] [PubMed] [Google Scholar]
- Leeb M., Pasini D., Novatchkova M., Jaritz M., Helin K., Wutz A. Polycomb complexes act redundantly to repress genomic repeats and genes. Genes Dev. 2010;24:265–276. doi: 10.1101/gad.544410. [DOI] [PMC free article] [PubMed] [Google Scholar]
- Li M., Belmonte J.C. Ground rules of the pluripotency gene regulatory network. Nat. Rev. Genet. 2017;18:180–191. doi: 10.1038/nrg.2016.156. [DOI] [PubMed] [Google Scholar]
- Love M.I., Huber W., Anders S. Moderated estimation of fold change and dispersion for RNA-seq data with DESeq2. Genome Biol. 2014;15:550. doi: 10.1186/s13059-014-0550-8. [DOI] [PMC free article] [PubMed] [Google Scholar]
- Marioni J.C., Mason C.E., Mane S.M., Stephens M., Gilad Y. RNA-seq: an assessment of technical reproducibility and comparison with gene expression arrays. Genome Res. 2008;18:1509–1517. doi: 10.1101/gr.079558.108. [DOI] [PMC free article] [PubMed] [Google Scholar]
- Mertsalov I.B., Kulikova D.A., Alimova-Kost M.V., Ninkina N.N., Korochkin L.I., Buchman V.L. Structure and expression of two members of the d4 gene family in mouse. Mamm. Genome. 2000;11:72–74. doi: 10.1007/s003350010014. [DOI] [PubMed] [Google Scholar]
- Panamarova M., Cox A., Wicher K.B., Butler R., Bulgakova N., Jeon S., Rosen B., Seong R.H., Skarnes W., Crabtree G., Zernicka-Goetz M. The BAF chromatin remodelling complex is an epigenetic regulator of lineage specification in the early mouse embryo. Development. 2016;143:1271–1283. doi: 10.1242/dev.131961. [DOI] [PMC free article] [PubMed] [Google Scholar]
- Pardo M., Lang B., Yu L., Prosser H., Bradley A., Babu M.M., Choudhary J. An expanded Oct4 interaction network: implications for stem cell biology, development, and disease. Cell Stem Cell. 2010;6:382–395. doi: 10.1016/j.stem.2010.03.004. [DOI] [PMC free article] [PubMed] [Google Scholar]
- Quinlan A.R., Hall I.M. BEDTools: a flexible suite of utilities for comparing genomic features. Bioinformatics. 2010;26:841–842. doi: 10.1093/bioinformatics/btq033. [DOI] [PMC free article] [PubMed] [Google Scholar]
- Shen X., Liu Y., Hsu Y.J., Fujiwara Y., Kim J., Mao X., Yuan G.C., Orkin S.H. EZH1 mediates methylation on histone H3 lysine 27 and complements EZH2 in maintaining stem cell identity and executing pluripotency. Mol. Cell. 2008;32:491–502. doi: 10.1016/j.molcel.2008.10.016. [DOI] [PMC free article] [PubMed] [Google Scholar]
- Tee W.W., Reinberg D. Chromatin features and the epigenetic regulation of pluripotency states in ESCs. Development. 2014;141:2376–2390. doi: 10.1242/dev.096982. [DOI] [PMC free article] [PubMed] [Google Scholar]
- Trapnell C., Pachter L., Salzberg S.L. TopHat: discovering splice junctions with RNA-Seq. Bioinformatics. 2009;25:1105–1111. doi: 10.1093/bioinformatics/btp120. [DOI] [PMC free article] [PubMed] [Google Scholar]
- Trapnell C., Williams B.A., Pertea G., Mortazavi A., Kwan G., van Baren M.J., Salzberg S.L., Wold B.J., Pachter L. Transcript assembly and quantification by RNA-Seq reveals unannotated transcripts and isoform switching during cell differentiation. Nat. Biotechnol. 2010;28:511–515. doi: 10.1038/nbt.1621. [DOI] [PMC free article] [PubMed] [Google Scholar]
- van den Berg D.L., Snoek T., Mullin N.P., Yates A., Bezstarosti K., Demmers J., Chambers I., Poot R.A. An Oct4-centered protein interaction network in embryonic stem cells. Cell Stem Cell. 2010;6:369–381. doi: 10.1016/j.stem.2010.02.014. [DOI] [PMC free article] [PubMed] [Google Scholar]
- Villasante A., Piazzolla D., Li H., Gomez-Lopez G., Djabali M., Serrano M. Epigenetic regulation of Nanog expression by Ezh2 in pluripotent stem cells. Cell Cycle. 2011;10:1488–1498. doi: 10.4161/cc.10.9.15658. [DOI] [PMC free article] [PubMed] [Google Scholar]
- Waghray A., Saiz N., Jayaprakash A.D., Freire A.G., Papatsenko D., Pereira C.F., Lee D.F., Brosh R., Chang B., Darr H. Tbx3 Controls Dppa3 Levels and Exit from Pluripotency toward Mesoderm. Stem Cell Reports. 2015;5:97–110. doi: 10.1016/j.stemcr.2015.05.009. [DOI] [PMC free article] [PubMed] [Google Scholar]
- Weidgang C.E., Russell R., Tata P.R., Kühl S.J., Illing A., Müller M., Lin Q., Brunner C., Boeckers T.M., Bauer K. TBX3 Directs Cell-Fate Decision toward Mesendoderm. Stem Cell Reports. 2013;1:248–265. doi: 10.1016/j.stemcr.2013.08.002. [DOI] [PMC free article] [PubMed] [Google Scholar]
- Wilson B.G., Wang X., Shen X., McKenna E.S., Lemieux M.E., Cho Y.J., Koellhoffer E.C., Pomeroy S.L., Orkin S.H., Roberts C.W.M. Epigenetic antagonism between polycomb and SWI/SNF complexes during oncogenic transformation. Cancer Cell. 2010;18:316–328. doi: 10.1016/j.ccr.2010.09.006. [DOI] [PMC free article] [PubMed] [Google Scholar]
- Zhang Y., Liu T., Meyer C.A., Eeckhoute J., Johnson D.S., Bernstein B.E., Nusbaum C., Myers R.M., Brown M., Li W., Liu X.S. Model-based analysis of ChIP-Seq (MACS) Genome Biol. 2008;9:R137. doi: 10.1186/gb-2008-9-9-r137. [DOI] [PMC free article] [PubMed] [Google Scholar]
Associated Data
This section collects any data citations, data availability statements, or supplementary materials included in this article.
Supplementary Materials
# Peptides indicates number of unique peptide sequences matched; # PSM indicates number of peptide spectrum matches.
Data Availability Statement
The accession numbers for ChIP-seq, RNA-seq and 4C data are E-MTAB-6165, E-MTAB-6166 and E-MTAB-6167, respectively on ArrayExpress. The proteomics data are available via ProteomeXchange with identifier PXD011806.