Abstract
Studying a common architecture reflecting both brain’s structural and functional organizations across individuals and populations in a hierarchical way has been of significant interest in the brain mapping field. Recently, deep learning models exhibited ability in extracting meaningful hierarchical structures from brain imaging data, e.g., fMRI and DTI. However, deep learning models have been rarely used to explore the relation between brain structure and function yet. In this paper, we proposed a novel multimodal deep believe network (DBN) model to discover and quantitatively represent the hierarchical organizations of common and consistent brain networks from both fMRI and DTI data. A prominent characteristic of DBN is that it is capable of extracting meaningful features from complex neuroimaging data with a hierarchical manner. With our proposed DBN model, three hierarchical layers with hundreds of common and consistent brain networks across individual brains are successfully constructed through learning a large dimension of representative features from fMRI/DTI data.
Keywords: Common brain networks, DBN, DTI, fMRI, Hierarchical structure
Graphical Abstract
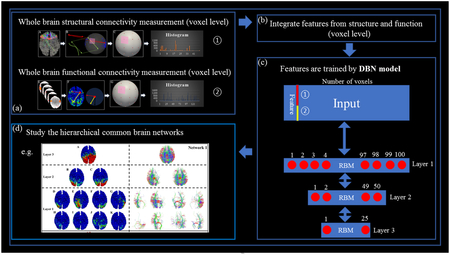
The proposed computational framework. (a) Steps to obtain the structural connectivity trace-map and functional connectivity trace-map for each vertex. (b) Feature integration. (c) The 3-layer DBN model using the functional and structural profiles acquired from (a) as the inputs to derive the hierarchical representation across the subjects. (d) Explore and study the hierarchical common brain networks and their characteristics.
1. INTRODUCTION
Inspired by the relation of brain structure and function (e.g. Passingham et al., 2002 and Von 1994), constructing a common architecture reflecting both brain’s structural and functional organizations across individuals and populations has been of significant interest in the brain mapping field. With the help of advanced multimodal neuroimaging techniques, we are now able to quantitatively represent whole-brain structural (e.g., mapping fiber connections using diffusion tensor imaging (DTI) (Le Bihan D and Breton E, 1985; Hagmann P et al., 2003; Schmahmann et al., 2007; Hagmann et al., 2008; Zhu et al., 2012; Zhu et al., 2014a; Jiang et al., 2015; Zhang T et al., 2016)) and functional profiles (e.g., mapping functional localizations using functional MRI (fMRI) (Ogawa et al., 1992; Belliveau et al., 1991; Calhoun et al., 2001; Beckmann et al., 2005; Calhoun et al., 2009; Lv et al., 2015; Zhao et al., 2015; Zhang S et al., 2016; Zhao et al., 2016; Zhang W et al., 2017; Zhang W et al., 2018)) of the brain. For instance, from a structural perspective, our previous studies have identified hundreds of cortical landmarks across different populations, each of which possesses consistent DTI-derived fiber connectivity patterns (Zhu et al., 2012). Meanwhile, functional connectome-scale brain networks were also effectively and robustly reconstructed by using sparse learning method applied to fMRI data (Lv et al., 2015).
Afterwards, multimodal fusion becomes more and more popular to study the brain’s functional and structural organizations simultaneously. Given the complementary information embedded in structural and functional connectomics data, it is natural and well-justified to combine multimodal information together to investigate brain connectivities and their relationships simultaneously (Chen et al., 2013; Zhu et al., 2014a). For instance, Zhang S et al. 2017a and Zhang S et al. 2017b proposed novel multimodal fusion models to identify common and consistent cortical landmarks by jointly representing connectome-scale functional and structural profiles from the brain; Zhang S et al. 2018a proposed a novel multimodal fusion framework to explore the relationship among cortical folding, structural connectivity and functional networks, and they observed that structural connectivity based brain parcellations and sparse dictionary learning derived functional networks exhibited deeply rooted regularity across individuals, although cortical folding patterns are substantially more variable. Zhang S et al. 2018b also proposed a novel framework to explore fiber skeletons via joint representation of functional networks and structural connectivity. This joint representation guided the identification of main skeletons of whole-brain fiber connections, which contributes to a better understanding of brain architecture, e.g., structural connectome and its local pathways.
So far, from the existing multimodal fusion studies (e.g. Zhu et al., 2014b; Zhang S et al. 2017a; Zhang S et al. 2017b; Zhang S et al. 2018a; Sui et al., 2012; Rykhlevskaia et al., 2008), we strongly believe that multimodal brain connectomics research will revolutionize our fundamental understanding of the structure and function of the brain and their relationships, and eventually shed novel insights into how to treat and prevent many devastating brain disorders. However, multimodal integration of brain connectomics is also widely considered a challenge, due to the intrinsic nature of multiscale properties of connectivity and its significant spatial and temporal variability across individuals and populations (He et al., 2013).
Inspired by recent great success of deep learning methods (e.g. Bengio et al., 2012; Goodfellow et al., 2014; Graves et al., 2013; Greff et al., 2016; He et al., 2016; He et al., 2017; Hinton 2002; Hinton et al., 2006a; Hinton et al., 2006b), recently, our group has developed several deep learning models, such as 1D CNN model for fMRI time series (Huang et al., 2017, Zhang et al., 2018c), RBM and DBN models for fMRI time series data (Hu et al., 2018; Li et al., 2018), and 3D CNN models for spatial brain networks (Zhao et al., 2017a, Zhao et al., 2017b, Zhao et al., 2018). These previous studies have shown that deep learning models exhibited strong abilityin extracting meaningful hierarchical structures from fMRI data, for instance, Huang et al., 2017 proved that their Deep Convolutional Auto-Encoder (DCAE) model is superior in representing fMRI signals, and as the model goes deeper, a better abstraction of data can be achieved. Li et al., 2018 proposed a blind source separation (BSS) model based on DBN with two hidden layers of RBM, and their experimental results showed that the proposed two layers’ DBN model is capable of identifying not only latent components related to distinct brain systems, but also the ones related to functional interactions across brain systems. In parallel, from a structural perspective, Chen et al., 2015 applied hierarchical structures in the 3-D reference atlas of Allen Mouse Brain Atlas to study brain fiber pathways across the individuals. Among the three different scales examined, on the finest scale, 300 regions were selected to parcellate the whole mouse brain, after which these regions were then combined to obtain 96 regions and 69 regions parcellations. The corresponding fiber pathways at different scales have shown that structural brain networks also exhibit hierarchical organization patterns (Chen et al., 2015).
However, our previous deep learning models have not explored the relation between brain structure and function yet, thought it has been postulated that structural and functional brain networks are closely related. It is also interesting to explore if/how such multimodal brain networks exhibit hierarchical organization patterns. To investigate the above-mentioned questions, here we propose a novel computational framework to explore both functional and structural connectivity on different scales and thus learn hierarchical latent features and associated representations via Deep Belief Network (DBN). Three major advantages of our proposed framework are as follows. First, DBN is known to possess for the capability of learning hierarchical latent features and associated representations (Li et al., 2018; Brosch et al., 2014; Lee et al., 2009; Palm et al., 2012). In this paper, the shallow RBM model is extended as building blocks into a DBN with multi-layer structure to better model the intrinsic hierarchical features of the brain architecture. Second, deep learning algorithms exhibit strong learning power, e.g., extracting meaningful patterns from big data (Chen et al., 2014; LeCun et al., 2015). Our proposed voxel level analysis will thus take the advantage of large-scale training samples. For example, around 100K vertices from one cortical surface, as well as their common features (functional and structural trace-map values) (Zhu et al., 2012 and Chen et al., 2013), are collected from each subject in the Human Connectome Project (HCP) dataset as the training samples. Third, we proposed a novel multimodal fusion model to combine DTI and fMRI data and then explore common cortical architecture of human brain considering both functional and structural aspects. In the joint model, for each modality, an efficient feature descriptor is developed to describe the corresponding connectivity for each vertex, and representative features for both brain’s functional and structural information will be generated using the proposed feature descriptors at the voxel level.
In this work, 100, 50 and 25 common brain networks are obtained from 3-layer DBN model, respectively. The number of the layer is suggested from existing studies such as Erhan et al., 2009 and Salakhutdinov et al., 2010. The number of the networks for each layer is decided by using the low-rank decomposition algorithms (Wen et al., 2012). The obtained common brain networks are shown to be functionally and structurally consistent across different subjects. Interestingly, the obvious hierarchical relationships are observed from layer 1 to layer 3. Moreover, reproducibility studies indicate that our proposed framework works well when using different datasets and those common brain networks are quite reproducible. The comparisons between the hierarchical brain networks derived by DBN models and the Holistic Atlases of Functional Networks and Interactions (HAFNI) (Lv et al., 2015) derived by sparse coding provide a better way to understand how the hierarchical network architecture is organized in the brain. Finally, comparison experiments using meta-analysis are designed and adopted to examine and interpret the obtained common brain networks on both functional and anatomical domains. All of the above analyses suggest that our proposed DBN model can reasonably identify the hierarchical architecture of human brains by representing the common brain networks in each hierarchical layer.
2. METHODS AND MATERIALS
2.1. Overview
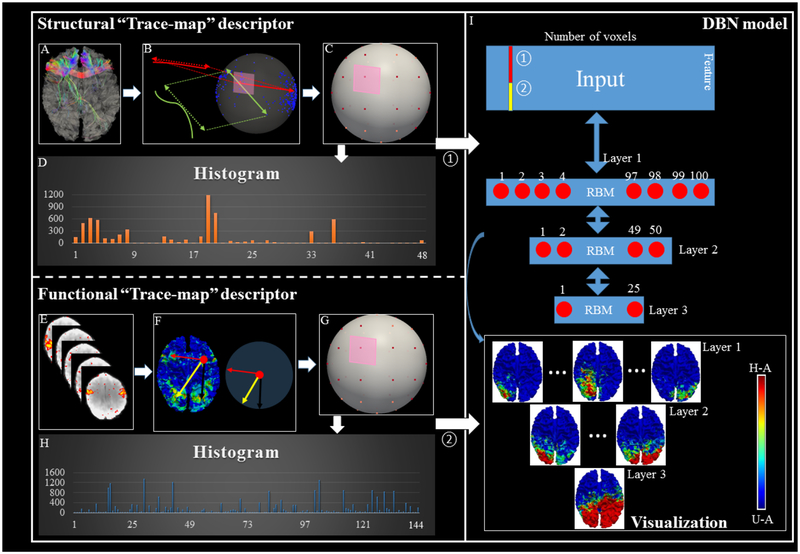
In this section, we briefly introduce the framework of our proposed methods. The flowchart is shown in Fig. 1, and details are further shown in each subsection. As shown in Fig. 1, to explore the hierarchical and common brain networks across populations through multi-modalities, our method contains three major steps. The first two steps compute the structural and functional connectivity pattern at voxel level. The third step is to combine those structural and functional connectivity profiles together and feed them into a carefully designed DBN model to discover the hierarchical organization of the brain networks.
Fig. 1.
The flowchart of proposed method. (A-D) Steps to obtain the structural trace-map for each vertex. (E-H) Steps to derive the functional trace-map for each vertex. (I) The 3-layer DBN model using the functional and structural profiles acquired from steps A-H as the inputs to derive the hierarchical representation across the subjects. Step A: extracting fiber bundles passing through the seed vertex. Step B: projecting each fiber’s direction to a unit sphere surface. Step C: dividing the surface of sphere into 48 equal areas. Step D: computing the histogram of structure trace-map within each area and generating a feature vector for each seed vertex (Chen et al., 2013). Step E: identifying individual functional brain networks via HAFNI (Lv et al., 2015). Step F: generating functional connectivity map for each vertex and then projecting each connection to the uniform spherical surface. Step G: dividing the surface of sphere into 144 equal areas. Step H: computing the histogram of functional trace-map within each area and generating a feature vector for each seed vertex. For the color bar, U-A means unactivated state and H-A means highly activate. For the H-A, we set z-score as 2 empirically according to Lv et al., 2015. The color bar is same for the following figures.
2.2. Data Description and Preprocessing
The dataset used in this study was obtained from the Human Connectome Project (HCP) (Barch et al., 2013 and Van Essen et al., 2013). The acquisition parameters of task fMRI (tfMRI) data are as follows: 90×104 matrix, 220mm FOV, 72 slices, TR=0.72s, TE=33.1ms, flip angle = 52°, BW=2290 Hz/Px, in-plane FOV = 208×180 mm, 2.0 mm isotropic voxels. For tfMRI images, the preprocessing pipelines included skull removal, motion correction, slice time correction, spatial smoothing, and global drift removal. All of these steps are implemented by FMRIB Software Library (FSL) FEAT (Woolrich et al., 2009). HCP tfMRI dataset includes 7 different task designs, they are language, motor, gambling, emotion, social, relational and working memory. For DWI data, the parameters are as follows: Spin-echo EPI, TR 5520 ms, TE 89.5 ms, flip angle 78 deg, refocusing flip angle 160 deg, FOV 210×180 (RO × PE); matrix 168×144 (RO × PE), slice thickness 1.25 mm, 111 slices, 1.25 mm isotropic voxels, Multiband factor 3, and Echo spacing 0.78 ms. Age information: for the HCP dataset, Mean=29.31, Median=29.00, Std. Devia/on=3.667. Age range: 22–25: 20.48%; 26–30: 43.70%; 31–35: 34.66%; >35:1.16%. Gender information: Female: 54.48%; Male: 45.52%. Education level: Didn’t complete high school: 3.74%; High school graduate: 14.64%; Completed some college: 25.71%; College graduate: 40.77%; Graduate student: 15.14%. Handness: Left dominance: 9.37%; Neutral Dominance: 0.33%; Right dominance: 90.30%. Please refer to Barch et al., 2013 and Uğurbil et al., 2013 for more details.
2.3. Structural Connectivity Descriptor “structure trace-map”
The motivation of designing a structural trace-map descriptor is to measure the similarity of different fiber bundles. The fiber bundles are within 3D space and it is very difficult to compare them directly. In this study, we aim to construct the similarities between the ‘trace-maps’ of DTI-derived fiber bundles for those initialized landmarks, with a similar way as proposed in Zhu et al., 2012 and Chen et al., 2013. The effectiveness and efficiency of ‘trace-map’ method has been addressed in Zhu et al., 2012 and Chen et al., 2013. To be self-contained, we describe the ‘trace-map’ representation and comparison of the DTI-derived structural fiber connection pattern in the following paragraphs.
The “trace-map” method is shown in Fig. 1A–D, it mainly has two steps to measure the similarity of different 3-dimensional fiber bundles via 1-dimensional vectors. The first step is projecting the beginning and ending points of each fiber (principal orientation of each fiber) from fiber bundles (Fig. 1B) onto a uniform spherical surface. As shown in the Fig. 1B, the sample fiber bundle is mainly connected left frontal area to right frontal area, which means the major direction is horizontal, thus, on the uniform spherical surface, dozens of dots are projected onto the left and right side of the sphere, so the major pattern of this fiber bundle is shown on the sphere. In the second step, we divide the uniform spherical surface into 48 equal areas (Fig. 1C) and construct a histogram for each area (Fig. 1D), which are then represented as the feature vectors. This step helps to simplify the information from 3D sphere to 1D vectors but containing necessary spatial information. A histogram algorithm is used to calculate how many projecting dots are located on each area, and we name the value of histogram as density and big density value means more fibers are projecting onto this area, and vice versa. A 48-dimensional histogram vector tr = [d1,d2 …d48], containing 48 density values, namely ‘trace-map’ (Zhu et al., 2012), is finally obtained as the structural profile of the landmark under consideration. By constructing trace-map, the fibers penetrating to the landmark can thus be represented as vectors with dimension of 48, instead of 3D shapes, in other words, every fiber bundle will have its own trace-map representation using a 1D vector.
The rationale for comparing fiber bundles via trace-maps is that similar fiber bundles will have similar trace-map patterns. Thus, after representing the fiber bundle by the trace-map model, fiber bundles can be compared through calculating the distances between their corresponding trace-maps (Zhu et al., 2012). Through this way, we are able to quantitatively measure structural connectivity patterns and similarities between landmarks.
2.4. Functional Connectivity Descriptor “function trace-map”
In our previous HAFNI work (Lv et al., 2015), we have successfully identified hundreds of latent brain networks and their spatial overlaps and temporal interactions. Though these HAFNI derived networks are reasonable to be treated as individual functional profiles, they are difficult to be compared across subjects. Inspired by the “structural trace-map” mentioned above, here, we designed a new functional descriptor, “functional trace-map”, based on HAFNI networks to measure the functional connectivity between seed vertex and all the other vertices in the brain. Moreover, “functional trace-map” can dramatically reduce the dimension of 3D functional maps into 1D feature vectors. At the same time, we can preserve the necessary spatial information for quantitatively measuring the functional connectivity. In the HAFNI project (Lv et al., 2015), we demonstrated that in a specific functional network (e.g., task fMRI derived network), vertices in the activation regions are considered to have similar functional meaning and have stronger functional connection among each other. Thus, given 7 functional tasks (for each task, HAFNI project will obtain 400 functional networks (Lv et al., 2015), thus there are 400*7=2,800 functional networks in total for each subject and those networks are illustrated in supplemental material Part A). We can project them onto a uniform spherical surface for each subject to define a potential functional connectivity map for each vertex on the cortical surface.
Learned from structure trace-map, here is the procedure of how to generate a functional connectivity map. Each vertex is linked with certain number of counters that store how many networks are involved and are initialized as 0 at the beginning, and the number of counters is the same as the number of whole brain vertices and they are corresponding with each other. For each vertex vi on the cortical surface, it is treated as a seed voxel. We examine all the 2,800 networks and select those networks in which the seed vertex vi is activated. For each selected network, we record all the activated vertices vactive (excluding vi) and update the counters of all those vactive by adding 1. Thus, we are able to construct a map for the seed vertex vi that contains the counters of all vactive. We named this map as a functional connectivity map fi of the seed vertex vi (as visually shown in the Fig. 1F). More details about generating the functional connectivity map are provided in supplemental material Part B. Then, based on this functional connectivity map fi, we make the seed vertex vi as the center of a unit sphere. We connect vi and all the vertices in vactive(fi) and project each direction (one direction is a line connecting from seed vertex vi to another vertex vj (vj is from vactive(fi)) to the uniform spherical surface as a unit vector. This direction will be projected n times as the corresponding counter of vj is n (Fig. 1F). After we go through the whole brain vertices for seed vertex vi, the uniform spherical surface with hundreds of dots are obtained. At last, we divide the dots-projected uniform spherical surface into 144 equal areas and construct histogram of dots for each area in sequence, which are then represented as functional feature vectors, this step is very similar to the final step in structure trace-map algorithm. As a result, a 144-dimensional histogram vector tr = [d1,d2 …d144], containing 144 density values, namely “function trace-map”, is finally obtained as the function connectivity of the seed vertex.
By constructing the function trace-map vectors, the seed vertex’s functional connectivity map can be represented by 144 feature vectors instead of using around 100K dimension vectors. More importantly, our functional trace-map can efficiently preserve major spatial information of the seed vertex, more details and evaluations of the functional trace-map descriptor are provided in supplemental material Part C.
2.5. DBN Model of Joint Representation of Structural and Functional Profiles
DBN is built up with a stack of probabilistic model called RBM (Smolensky et al., 1986) as shown in the Fig. 1I. In general, RBM is an energy-based model with the joint probability distribution that can learn probability distribution from input data. A typical RBM consists of two layers, that is, the visible layer v and the hidden layer h. The visible layer is directly connected to the input data, and each of visible nodes accepts one dimension of the input. The number of hidden layer nodes is denoted by k, each of which represents a latent variable. The space of latent variables is spanned by the hidden nodes. The connection between these two layers is represented by the weight W, the size of which is n × k. RBM defines the probability by the energy of the system, E(v,h), such that:
| (1) |
where Z = ∑v,h exp−E(v,h), is the partition function (Smolensky et al., 1986). To estimate normally distributed real data, E(v,h) is defined in Gaussian- Bernoulli RBM (GB-RBM) as:
| (2) |
where wij is the weight between the visible variable vi and the hidden variable hj, ai and bj are the bias of visible and hidden variables. σi is the standard deviation of a quadratic function for each vi. centered on its bias ai.
RBMs are trained using the contrastive divergence (CD) learning procedure (Carreira-Perpinan MA and Hinton GE, 2005). Each RBM layer is trained by using the previous layer’s hidden units (h) as input/visible units (v). Inputs are modeled by RBMs via latent factors expressed through the interaction between hidden and visible variables. Thus, DBNs can be trained greedily, one layer at a time, that lead to hierarchical representation (Hu et al., 2018; Li et al., 2018). In more details, the learning gradient is computed from the feature of a single vertex, while the algorithm will go through the complete dataset with number of epochs (all subjects together). For each data point presentation, each visible variable is assigned with the value of the corresponding vertex. Then, a truncated, iterative version of Gibbs sampling called contrastive divergence (CD) is applied to the complete set of variables. This is done in an alternating sequence of hidden and visible variables, using the current values of the weights to calculate sampling probabilities of each layer. The difference between the values of the hidden and visible variables at the beginning and the end of the Gibbs chain is used to compute the learning gradients, which are then used to update the values of the weights before the next fMRI data point is presented. In addition, other penalty functions, such as L1 penalty on the weights or sparsity of simultaneously active hidden units can also be considered.
In this work, for training dataset, the vertices coming from 10 HCP subjects are collected and treated as a standard training dataset. For each vertex, 192 feature vectors (48 from structure and 144 from function) are obtained from both functional trace-map and structural trace-map. In total, around 1 million vertices from 10 subjects are used as the input. The inputs can be represented as below:
| (3) |
where ni is the total number of vertices of i-th subject. Each element in the Eq. (3) represents a column vector with dimension of 192. Our DBN model in this work has three hidden layers that have 100, 50 and 25 hidden nodes, respectively. The number of the nodes is mainly decided by using the low-rank decomposition algorithms (Wen et al., 2012), and the rank of the input is around 50. Therefore, we gave this low rank more redundancy by multiplying the rank by 2, so the nodes for the first layer is set to 100. Similar scheme is used to derive the number of nodes for the second and third layers. The main parameter settings are shown as below: base epsilon: 0.0001, initial momentum: 0.5, final_momentum: 0.9, momentum_change_steps: 3000, l1_decay: 0.1, activation: TANH, gibbs_steps: 1, training steps: 50000. Notably, the weight decay L1 plays an important role in our experiments, in that it controls the sparsity of the functional network. By applying the weight decaying rate in each iteration, the less vital connections are forced to be small and only the most important ones are preserved, thus yielding the weights, i.e., functional networks, to be sparse.
2.6. Common Network Analysis
As mentioned, the outputs from our DBN model are the weights of each hidden layer. Here we use layer 1 as an example: the dimension of the inputs is (n1 + n2 +⋯+n10) * 192, where ni is the total number of vertices of ith subject. Because the number of nodes in layer 1 is 100, the dimension of the weights we obtained will be (n1 + n2 +⋯+n10) * 100. In this way, we can extract the weights w for each subject by simply dividing the weights matrix into 10 parts, and w consists of [w1,w2,w3…w10]′ and the dimension of wi is ni*100. In other words, wi contains 100 brain networks for subject i, and each brain network can be easily visualized by simply assigning the values in wi to the corresponding vertices. It is worth noting that w is confirmed to be stable for each round of training, and details are mentioned in the section 2.9. At last, 100 common brain networks can be achieved for each subject. Similar to the output of layer 2 and layer 3, 50 and 25 brain networks can be obtained for each subject as well.
After the brain networks have been observed and identified, we need to quantitatively measure their functional and structural consistency. Here, two methods are adopted to evaluate the structural consistency. First, the shapes of fiber bundles that passing through those activation areas are compared by calculating the Pearson correlation between structural trace-map features. Second, regarding the functional consistency, as the identified brain networks are in individual spaces, an image registration is needed to be performed first. We register those brain networks from individual space into the MNI standard space using FLIRT (Jenkinson et al., 2001). Then, we are able to compare those activation vertices by calculating the ratio of overlap.
2.7. Model Evaluation
In our proposed DBN model, there are three key steps that affect the model. First, we applied the trace-map algorithm to better represent the functional connectivity and structural connectivity. Second, for the function aspect, instead of using GLM-derived activation maps, we adopted the HAFNI project to obtain 400 functional networks from each task. Third, we utilized the multimodality concept to combine the structural and functional information together and then they are learned by the DBN model. In this section, we designed 3 experiments to evaluate whether each key step in our proposed model is effective. The first experiment is to test whether the trace-map algorithm has advantages. So, we designed a baseline to compare. In the baseline, for each task, we will use a functional map (e.g. GLM-derived activation map) to represent the major brain network pattern for the current task. In this way, we will have 7 functional maps in total for each subject, and each voxel will have a 7-dimensional vector. Then the inputs can be grouped and directly fed into the unimodal DBN to obtain networks (without adopting trace-map). For comparison, the same inputs will be firstly optimized by trace-map algorithm and then fed into the unimodal DBN to obtain networks. The second experiment is to test whether using HAFNI project with 2800 networks (400 networks per task) can provide richer information when studying the whole brain functional connectivity. The baseline using 7 functional maps is already designed in first experiment. For comparison, 2800 functional networks will be used for each subject instead. The third experiment is to compare the proposed multimodal analysis with the networks extracted from a unimodal DBN (either functional DBN or structural DBN). This experiment would evaluate how much we gain from the multimodal DBN model.
2.8. Hierarchical Model of Common Brain Networks
DBN is a hierarchical neural network that can learn probabilistic structure from the inputs. That is, different layers can represent information with different generalization levels. In our proposed framework, DBN has 3 layers in this paper, as suggested from existing studies such as Erhan et al., 2009 and Salakhutdinov et al., 2010, in which it was stated that three hidden layers are usually the basic model of the DBN. And then, the obtained brain networks from these 3 layers should follow a hierarchical structure. We measured the relationships between brain networks derived from different layers by directly computing their overlaps. The networks in the higher-level should be more abstract and might have global activation area which tends to contain some specific networks from the lower-level. We defined the ratio of overlaps between lower-level brain networks and those from higher-level as L-overlap rate:
| (4) |
Here, network A represents the lower level networks and B stands for the higher-level networks. Through this way, for each higher-level brain network, most related lower-level brain networks can be identified. We hypothesize that the hierarchical brain networks should possess both functional and structural hierarchical characteristics simultaneously.
2.9. Validation of the DBN Model
In this paper, three validation experiments are adopted to validate the robustness and the reproducibility of the proposed method. The first experiment is that we validate the consistency of our model by using the same inputs and run for three times. The second experiment is that we applied the proposed DBN model on other 5 groups of 10 subjects and did the statistical analysis based on the 6 groups together (including the original group). The third experiment is that we use a group of 20 subjects as the inputs to learn the common networks. In each group, we will keep one used subject data as the reference. The reason to keep one used subject is that it will be convenient to do the comparison from two inputs at later steps. In general, we need to examine whether the same common brain networks can be achieved from different inputs. Next, commonly used Jaccard overlap (Lv et al., 2015 and Zhao et al., 2016) is adopted to discover the correspondent networks from different inputs based on the similarity of the brain networks. The frequency of the common brain networks obtained from different inputs can be used to estimate the reproducibility of our proposed model.
2.10. Relationship between Common Brain Networks and HAFNI Maps
The hierarchical architecture can be observed and identified by the methods in section 2.7. However, one important issue is how to understand and interpret those hierarchical architectures. For example, what is the neuroscience meaning behind each layer and what is the relationship between different layers. In this work, we perform a comparison between hierarchical networks and HAFNI components identified in our previous studies to illustrate the modular organization of our brain works. In the HAFNI work, the individual HAFNI components include concurrent functional networks of both task-evoked and resting state related functional maps, which can be reproduced across individuals (Lv et al., 2015). In addition, group-wise HAFNI components are also available and contain more global information. Thus, they can be treated as functional templates that we could use to evaluate the similarity with the hierarchical brain networks.
Specifically, we compared the common brain networks from 3 layers with individual HAFNI components and groupwise HAFNI components by computing the overlap of the activation areas on the cortical surface. Thus, for each HAFNI component (from both individual and group-wise ones), we can identify most correlated common brain networks in each of 3 hierarchical layers. Lastly, we outline the relationship between hierarchical model and HAFNI components, and further illustrate the architecture of the modular brain organization.
2.11. Explore the Functional Meaning of Common Brain Networks through Meta-analysis
We applied several algorithms to examine the functional and structural consistency of those common brain networks we obtained across different subjects. To further explore the functional meaning of those networks, we adopted “meta-analysis” to analyze the functional roles of those obtained networks. “Sleuth” is a widely used toolbox from the BrainMap (Fox et al., 2002; Fox et al., 2005 and Laird et al., 2005) that can search related publications/reports and screen their corresponding meta-data to plot their results as coordinates within the standard Talairach space (which can also be converted to the MNI space). By searching from thousands of related function brain imaging studies, meta-analysis can perform the statistics of the reported functional meaning (behaviors) of ROIs we selected. In this work, we selected the areas with the highest intensity in the common brain networks as the ROIs to perform the meta-analysis and integrate the corresponding roles of those functional networks. After we obtained the functional meaning of those networks, we can do the comparison across the subjects to examine whether they have consistent functional roles and/or whether they have consistent anatomical locations. This is another validation approach to reveal the consistency of the networks we obtained from the DBN model. The details about how to use the Sleuth software to search for papers of interest could be found on the website: http://www.brainmap.org/sleuth/.
3. RESULTS
In this paper, our model is developed upon the deepnet package to train the DBN model. One GPU (NVIDIA Corporation GP102 GeForce GTX 1080 Ti) was used to training the dataset. As mentioned in the method section, a 3-layer DBN model was constructed and the number of nodes from layer 1 to layer 3 are 100, 50, 25, respectively. The training process took for around 5 hours for each run of the inputs. The core codes are uploaded onto GitHub: https://github.com/jimzhang1989/DBN-deep-learning-.git.
3.1. Common Brain Networks
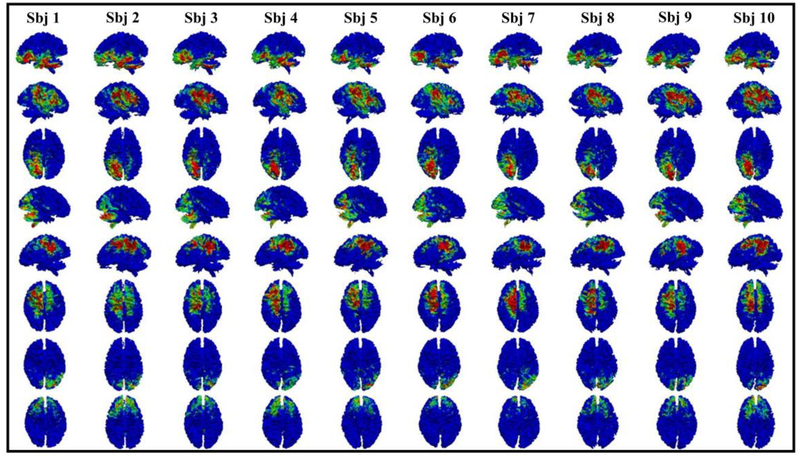
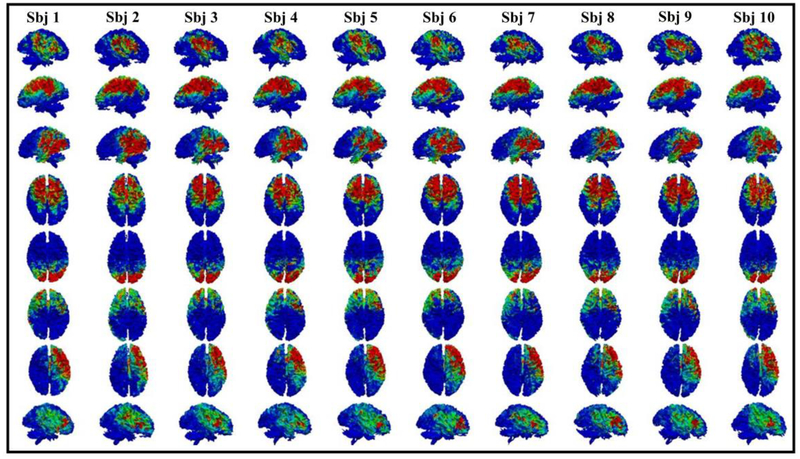
As mentioned in the method section 2.6, the number of the hidden nodes controls the number of the obtained brain networks for each subject. It turns out that the identified networks from the same node display great consistency across different subjects (Fig. 2–Fig. 4). In total, we obtained 100 networks from layer 1, 50 networks from layer 2 and 25 networks from layer 3 for each subject. Note that the correspondence of networks is automatically obtained from the DBN model and we visualized all the networks based on the nodes in each layer and showed them on our website:
Fig. 2.
Eight examples of common brain networks obtained from DBN model layer 1. Each row represents a corresponding network from 10 subjects. The average functional consistency for all the common networks in layer 1 is 0.61.
Fig. 4.
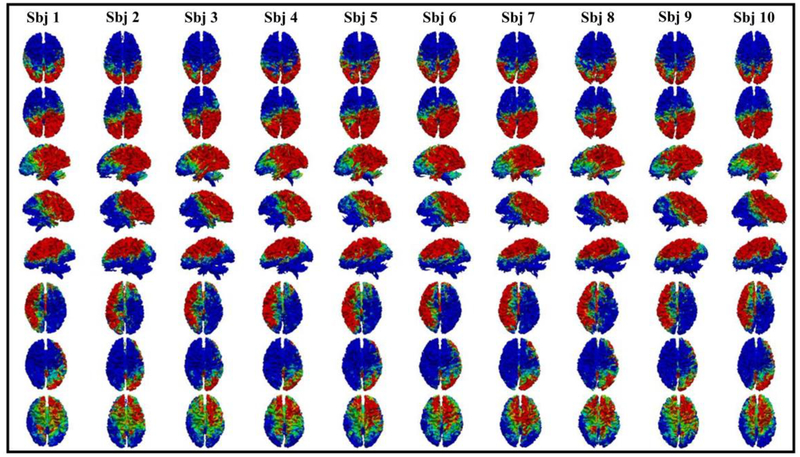
Eight examples of common brain networks obtained from DBN model layer 3. The average functional consistency for all the common networks in layer 3 is 0.88.
Homepage: http://hafni.cs.uga.edu/multimodality_DBN/DBN.html.
Layer1: http://hafni.cs.uga.edu/multimodality_DBN/layer1.html
Layer2: http://hafni.cs.uga.edu/multimodality_DBN/layer2.html
Layer3: http://hafni.cs.uga.edu/multimodality_DBN/layer3.html
Here we showed eight randomly selected brain networks of ten subjects from layer 1 to layer 3. The color bar in each figure is set from 0.1 to 0.6 (blue to red). It can be seen that for each common brain network, it shows reasonably good consistency across different subjects, as we expected. Note that our experiment was designed and processed within the individual space, which means no registration is needed. Functional consistency has been evaluated for all identified common brain networks from three layers (method part 2.6). Quantitatively, the average functional consistency from layer 1 to layer 3 is 0.61, 0.68 and 0.88, respectively, which are quite high given the variability of brain functions.
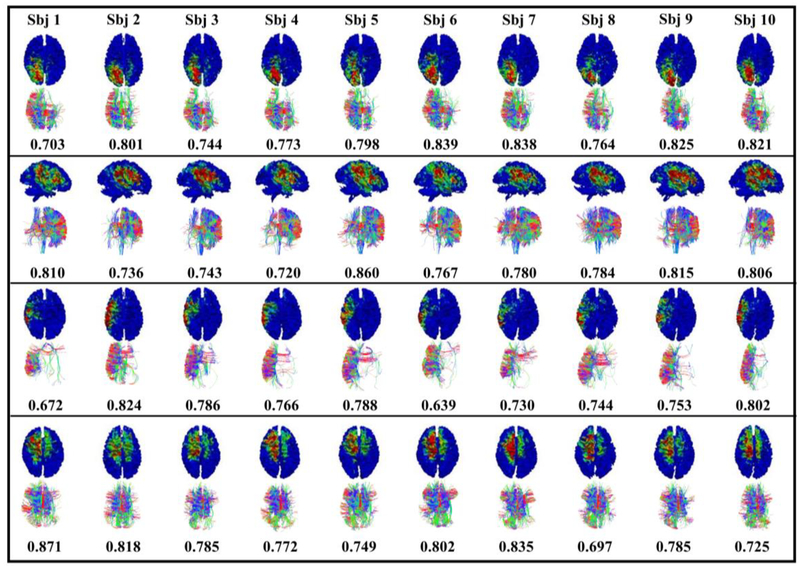
As suggested by numerous previous studies (e.g. Honey et al., 2009 and Koch et al., 2010), there is close relationship between brain function and structure. For example, Park et al., 2013 mentioned that network analyses suggest that hierarchical modular brain networks are particularly suited to facilitate local (segregated) neuronal operations and the global integration of segregated functions, and functional connectivity is highly constrained by structural connectivity. Similarly, our work had similar findings and proved that functional networks have close relationship with the structural connections. From the Fig. 5, we can see that the shape of the fiber bundles is quite consistent. To quantitatively evaluate their similarity, we used structure trace-map method, mentioned in the method part 2.3, and the average similarity among 4 networks is 0.45, 0.54, 0.42 and 0.57, respectively. The functional consistency is also listed in the Fig. 5, for example, 0.703 for the subject 1 in the first network represents the average consistency when comparing the subject 1 with the other 9 subjects. To our best judgement, those networks have great functional and structural consistency at the same time across different subjects. This is one of the major neuroscientific contributions of this work.
Fig. 5.
Examples of presenting functional and structural consistency for common brain networks. Shape of the fiber bundles is used to present the structural consistency and network overlap rates are used to present the functional consistency.
3.2. Model Evaluation Results
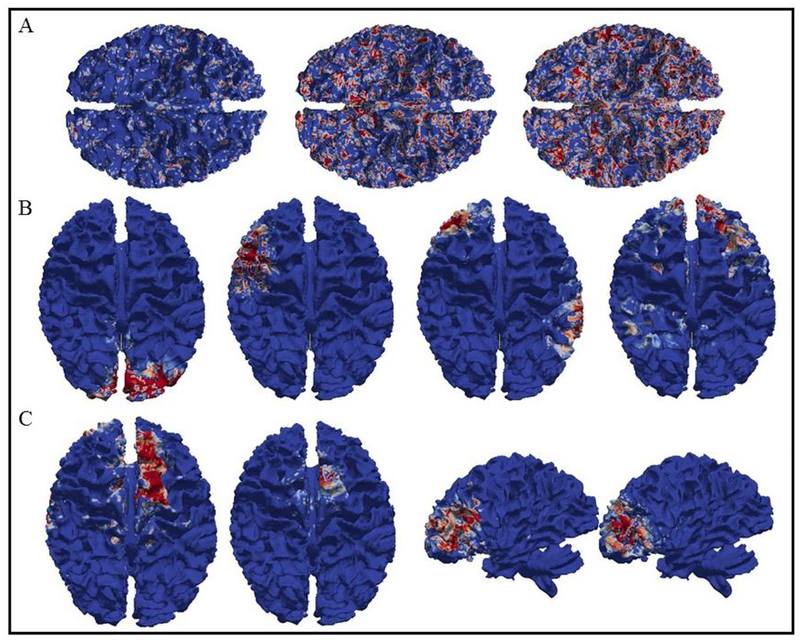
Following the first experiment in Section 2.7, we checked the networks obtained from the baseline, and we found that some meaningful patterns are not shown. Most networks are randomly distributed and hard to explain. Examples are shown in the Fig 6A. However, after we adopted trace-map into the inputs of first experiment, DBN can learn the new inputs well, and examples are shown in the Fig 6B. Those networks are typical known patterns and they are also shown in our proposed DBN model. Thus, we know that trace-map has the effectiveness in our model. For the second experiment in Section 2.7, we did the comparison between using 2800 functional networks for each subject to describe the functional connectivity (the proposed method) and 7 functional networks (baseline). We did both runs and the conclusion is that networks from the proposed method include all the typical patterns obtained from baseline. In details, when focusing on the common networks obtained from the proposed method and baseline, many networks from the proposed method have larger activation area with richer information on the whole cortical surface, like the pairs from Fig. 6C on the left; for other common networks, networks from the proposed method may have quite similar patterns with baseline, like the pairs from Fig. 6C on the right. Thus, using 2800 functional networks will provide richer information. For the third experiment in Section 2.7, we compared the networks obtained from structural DBN, functional DBN and the proposed multimodal DBN. We found that there are 23 common networks between functional DBN and multimodal DBN, there are 16 common networks between structure DBN and multimodal DBN, and 11 common networks between functional and structural DBN models. However, from the multimodal DBN model itself, the common networks obtained are around 44. That is, by adopting our proposed multimodal DBN, we could achieve about 20–30 more common networks. Thus, we can infer that, our proposed DBN model can effectively integrate structural and functional information together and provide more common networks. In general, we used these three experiments to demonstrate that our model is reasonably designed, and each key step is effective.
Fig. 6.
Illustration of examples of evaluation results. A. The brain networks obtained from DBN model by using 7 functional networks without using trace-map algorithm. B. The brain networks obtained from DBN model by using 7 functional networks including the trace-map algorithm. C. Examples of the networks obtained from DBN model by using 2800 functional networks and 7 functional networks, respectively. In each pair, brain networks from the model of using 2800 functional networks are on the left, brain networks from the model of using 7 functional networks are on the right.
3.3. Hierarchical Brain Networks
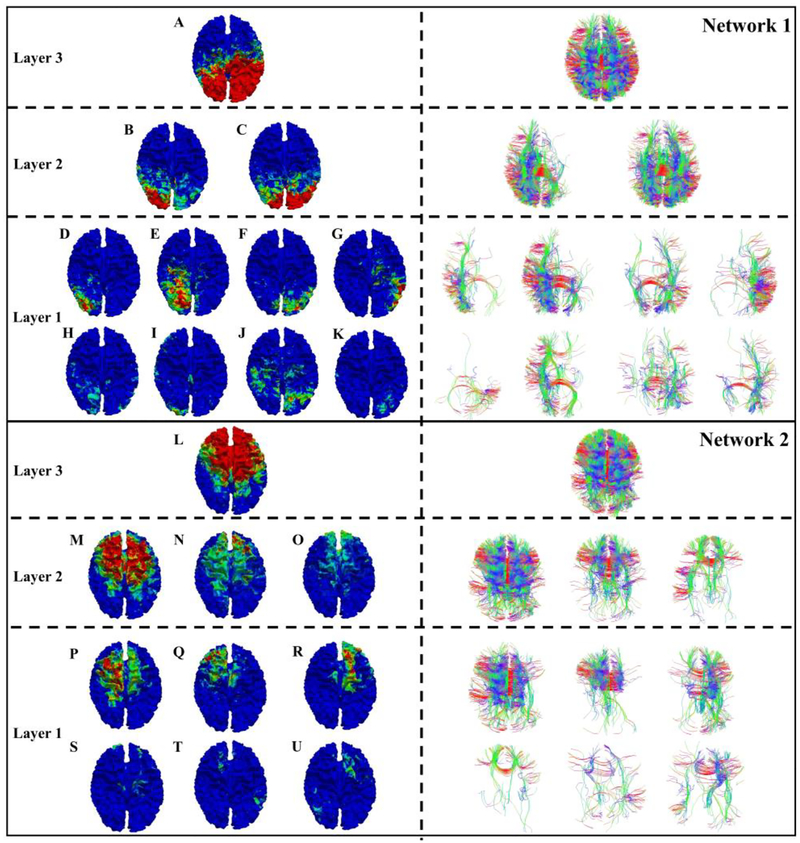
Interestingly, hierarchical representations are observed from the common brain networks in both structural and functional perspectives. By studying those hierarchical representations, we confirmed that the consistency from 3 layers keeps increasing from the lower layer to the higher layer. In addition, in the hierarchical model, the higher layer represents more global information and this global information will have more consistency across the subjects. As we can see from Fig. 7, DBN has three layers and corresponding common brain networks are obtained from each layer. In more details, following the steps in the method part 2.8, for the common brain networks from layer 3, a set of related brain networks from layer 2 are picked up. Furthermore, some related networks from layer 1 are also identified. Then those networks are represented in a tree model as shown in Fig. 7. In the meantime, fiber connections of those functional patterns are also provided. In order to evaluate the performance of how the higher DBN-layer networks could represent the lower DBN-layer networks, L-ratio from Eq. (4) is used here. For example, in the network 1 of Fig. 7, the network A covers 70% of the network B and 100% of the network C, and the network B covers 65% of D. In the network 2, L covers 80% of M, 80% of N and 100% of O. M covers 72% of Q. In general, all the hierarchical networks we obtained from 3-layer DBN model have a relatively high L-rate which reaches to 65% as a lower band. Thus, the networks from 3 DBN layers can successfully represent the hierarchical characteristics. An important conclusion is that the higher-layer can represent more global information and this global information will have more consistency across the subjects. On the contrary, lower layers will represent more local information and have less consistency across the subjects. This result is another major contribution of this work. All the hierarchical representation results are shown on our website:
Fig. 7.
Two examples of hierarchical representation for specific common brain networks in the top layer (layer 3). Functional and structural profiles are corresponding from the left to the right. A-U are networks from the corresponding layers.
Hierarchical representation between layer 1 and layer 2: http://hafni.cs.uga.edu/multimodality_DBN/hierarchical.html
Hierarchical representation between layer 2 and layer 3: http://hafni.cs.uga.edu/multimodality_DBN/hierarchical2.html
For the above-mentioned website, first two columns are the networks from higher layer. The rest columns are the networks from the lower layer.
3.4. Validation Experiments
One important question is if the consistent networks obtained using one dataset can be reproduced on another. To address this question, we conducted three validation experiments in this section as we stated in Section 2.9.
For the first validation experiment, we aim to validate the consistency of the proposed DBN model by using the same inputs and run for multiple times. Matrix “w” is confirmed the same from three runs and it further means all the common networks obtained from w will be the same from 3 runs. Thus, we can make the conclusion that when the model is completely trained, the obtained common networks are stable.
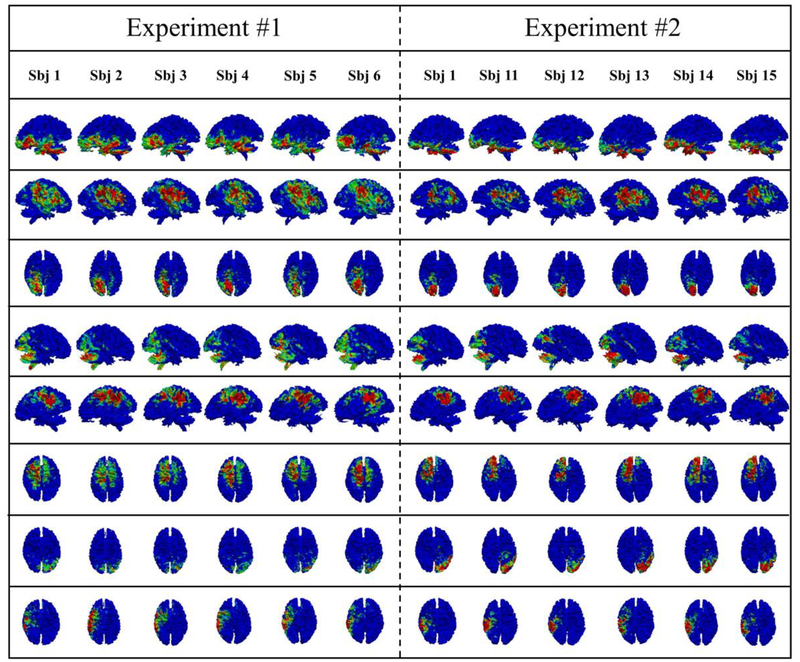
For the second validation experiment, we applied the proposed DBN model on other 5 groups of 10 subjects and did the statistical analysis based on the 6 groups together (including the original group). In this experiment, we firstly adopted a new group of 10 subjects to be the test-bed and show their performance. In details, Parameters are exactly the same as the previous experiments, e.g., 3 layers are also employed, and the number of nodes from layer 1 to layer 3 are still 100, 50, 25. After we employed the proposed method on the new data, common networks are successfully obtained for each layer. The same statistical analysis is done to examine the functional and structural consistency. Similar results are obtained, and their correspondence of networks is automatically constructed from the DBN model. In details, in the layer 1, 48 out of 100 networks are consistent across the experiments and they have 0.25–0.5 Jaccard overlap rate. In the layer 2, 37 out of 50 networks have about 0.25–0.66 Jaccard overlap rate; in the layer 3, 25 out of 25 networks have about 0.25–0.81 Jaccard overlap rate. Thus, we confirmed that those consistent common networks can be well reproduced from the reproducibility experiment. It is worth noting that in order to measure the correspondence among different experiments, one subject will be used as the bridge, so this subject was retained in the validation dataset. In this way, common networks from different experiments can be compared directly on this common subject (sbj1 in this work). To best keep the differences between two groups, only one common subject is accepted. For visualization, 8 example common networks are provided in the Fig. 8. In Fig. 8, original experiment results and the validation experiment results are presented from the left to the right.
Fig. 8.
Validation of the proposed algorithm by comparing the corresponding common brain networks obtained in layer 1 from two experiments. The Jaccard overlap rates of those 8 networks are 0.57, 0.53, 0.50, 0.49, 0.45, 0.41, 0.37 and 0.36, respectively.
Then we did similar experiment for another 4 groups of 10 subjects. Now, we have 6 sets of common networks. We tested whether common networks obtained from the original groups still exist in the 5 validation groups, and the results are summarized into Table 1.
Table 1.
Common networks and their level of consistency.
| Level of Consistency | Number of networks |
| 0 | 37 |
| 0.2 | 10 |
| 0.4 | 9 |
| 0.6 | 13 |
| 0.8 | 13 |
| 1 | 18 |
In this table, the level of consistency is used to represent whether the networks from the original group still exist and are consistent in the testing groups. If it exists in one test group (we defined “exist” as one similar network can be identified from testing group with a minimum Jaccard overlap rate “0.2”), the level of consistency will be added for 0.2. Thus, if the level of consistency is “1”, it means this network is consistent across all the testing groups. About 44 common networks have the value equal or larger than 0.6. In addition, we showed the mean and standard deviation of the Jaccard overlap rate for each common network across the different testing groups. The results are shown in the supplemental material Part D.
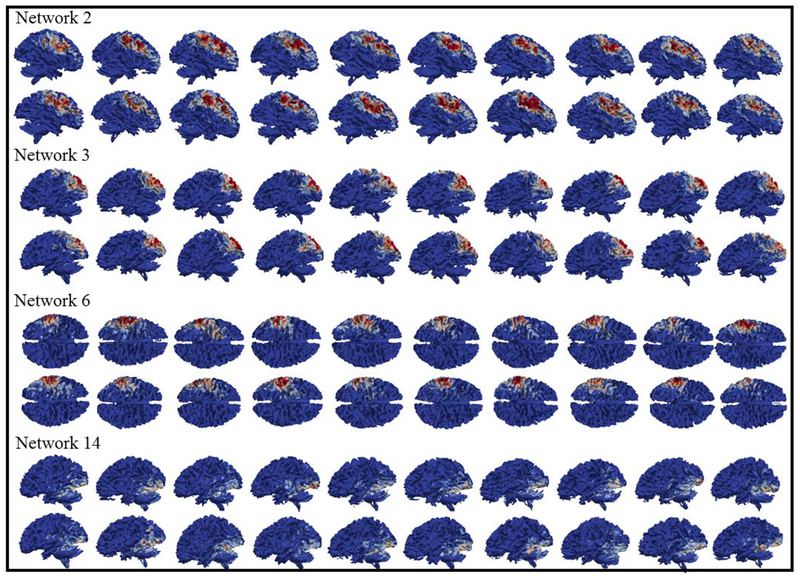
For the third validation experiment, we use a group of 20 subjects as the inputs to learn the common networks. We compared the network we learned from 20 subjects and 10 subjects (original group), we found that 38 common networks from 20 subjects are consistent with the common networks from 10 subjects. Examples of common networks obtained from the group of 20 subjects are shown in Fig. 9.
Fig. 9.
Examples of common networks learned from 20 subjects.
3.5. Explore the Hierarchical Model via HAFNI Maps
HAFNI maps include a large number of reproducible and robust functional networks, and they are simultaneously distributed in distant neuroanatomic areas while substantially spatially overlapping with each other, thus forming an initial collection of holistic atlases of functional networks and interactions. It is interesting that common networks obtained from our proposed algorithms are also reproducible and robust across the subjects. The difference is that HAFNI maps are obtained from fMRI data only, however, common networks obtained from this work are correlated with both function and structure. Thus, we are interested in exploring the relationship between HAFNI and the DBN-derived common networks to guide us better understand the hierarchical model obtained from the proposed DBN model.
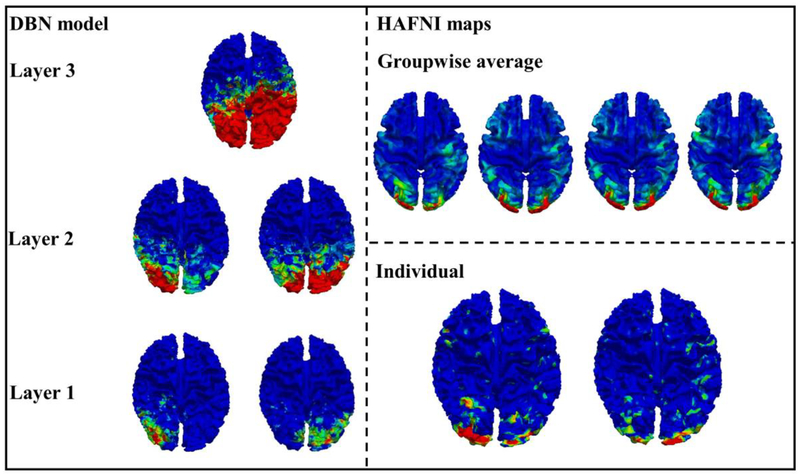
As mentioned in the method part 2.10, common networks from 3 layers are compared with the individual HAFNI components and group-wise HAFNI components by comparing the overlap of the activation area on the cortical surface. By checking the relationship between each layer from the DBN model and HAFNI components, we have the conclusion that in the DBN model, networks from layer 1 are more correlated with the HAFNI individual components, and networks from layer 2 are more correlated with the HAFNI group-wise components. One example is shown in the Fig. 10. In more details, DBN-derived networks from layer 1 are still quite localized and related to specific cortical regions. When the layer comes to the second, the activation area is enlarged by presenting more abstract information from the first layer’s DBN maps, and then those second layer DBN maps are much like the HAFNI group-wise average maps, which are the higher-level representations based on HAFNI individual maps. Therefore, the concept that higher layer brings more global information is also suitable for the modular brain organization. Similar to the third DBN layer for the visual function in Fig. 10, much more abstract representation is observed based on the second level, which almost cover the occipital lobe and parts of the parietal lobe.
Fig. 10.
Comparison of DBN maps and HAFNI maps in visual areas.
3.6. Explore the Function Meaning of Common Brain Networks via Meta-analysis
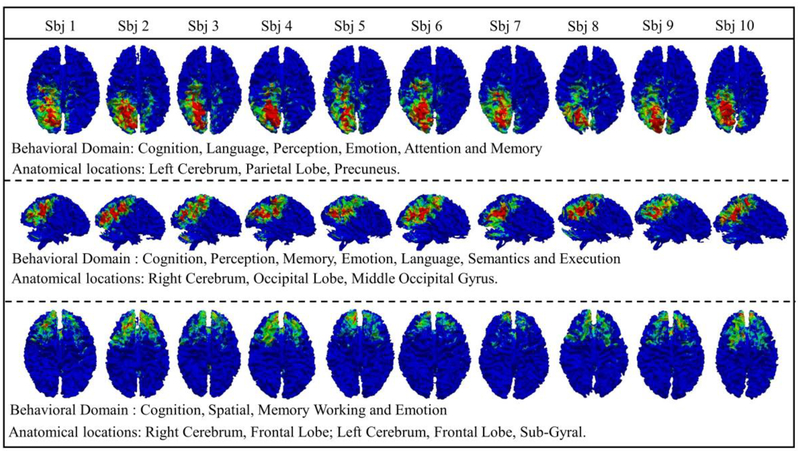
To further explore the functional roles of the identified common brain networks, we performed meta-analysis that is widely adopted in the brain mapping field. In this work, corresponding common brain networks are examined via meta-analysis, and three examples with their functional behaviors and anatomical locations are reported in Fig. 11. Using the first network in Fig. 11 as an example, it is located on the parietal lobe and precuneus and the related functional roles are: cognition, language, perception and emotion. In addition, these functional roles are very consistent across the subjects. Results for other common networks are also obtained and they have consistent functional roles. This is one important evidence that the common brain networks obtained from DBN model not only possess functional and structural consistency but also have consistent neuroscience meanings.
Fig. 11.
Meta-analysis results of three typical functional networks.
4. DISCUSSION AND CONCLUSIONS
In this paper, we proposed a novel DBN model by combining structural and functional connectivity profiles together to jointly represent the hierarchical common brain networks across different individuals. Three hierarchical layers are designed and represented across the 10 subjects with 100, 50 and 25 networks, respectively. Those common brain networks are further confirmed through our analysis including DBN analysis, hierarchical analysis and validation experiments. Then, by comparing the results between HAFNI components and DBN results, we found a potential interpretation of the identified hierarchical organization. That is, lower level networks are more related to individual functional characteristics and higher-level networks tend to reflect global functional organization at population level. To better understand the functional meaning and anatomical information of those networks, we performed the meta-analysis using Sleuth software based on BrainMap to explore the functional and anatomical explanations of all common brain networks we derived. The results suggest that corresponding common networks across different subjects tend to have consistent functional meanings and similar anatomical locations.
In summary, the major contributions and advantages of our proposed methods are two-fold. First, our DBN model can effectively and successfully identify the hierarchical brain networks. Second, our proposed method considered both functional and structural profiles to build a fusion model for single vertex on the cortex. For the hierarchical representation, there are already numerous evidences that brain networks have a hierarchical organization. However, there is a lack of effective methods and computational models to discover this at the voxel level. In this work, we showed that DBN model is a powerful method for discovering hierarchical organization of brain architecture. For the fusion model, multimodal information has been shown to be complementary to each other, thus, features we generated will have both functional and structural characteristics. Then the networks we obtained are shown to possess both functional and structural consistency.
Despite its advantages in latent feature learning, our framework can still be improved in the future. First, currently, the proposed DBN model is still simple and straightforward. For the architecture, we fixed the number of the layers to 3 based on the prior knowledge. And we set the hidden nodes by consulting from the low-rank of the inputs data. In the future, optimization approaches will be used to decide the best parameters in the DBN model. Second, in this work, the connectivity features for each vertex is fused by both functional and structural connectivity and then we use them to train DBN model. Notably, another possibility is that we can train functional and structural connectivity separately using DBN model, and then at a later stage, we can combine those features together and connect them with another DBN model to train the joint representation profiles. This could be another possible improvement for the DBN model in the future. The third is about the size of learning samples. Due to the limitation of GPU memory, we cannot study too many subjects in one run. To overcome this drawback, we have two possible solutions. The first one is to split large dataset into many small ones, and we have demonstrated that two individual studies can obtain consistent common networks. Thus, separating the big dataset into different small groups and running the model separately is acceptable. Another way is that we can do the down-sampling for the inputs of each subject. Our prior studies have demonstrated that down-sampling may not affect the key information much, and this concept is also working on the brain fMRI signals (Ge et al., 2016).
Supplementary Material
Fig. 3.
Eight examples of common brain networks obtained from DBN model layer 2. The average functional consistency for all the common networks in layer 2 is 0.68.
Highlights.
Explore the relationship between brain structure and function via deep believe network (DBN).
Efficient connectivity descriptors are adopted to describe connectivity at voxel level.
Multimodal DBN (fMRI/DTI) is used to represent hierarchical brain networks.
Promising results are obtained to represent common brain networks.
Acknowledgements:
T Liu was partially supported by National Institutes of Health (DA033393, AG042599) and National Science Foundation (IIS-1149260, CBET-1302089, BCS-1439051 and DBI-1564736). We thank the HCP projects for sharing their valuable fMRI datasets and thank deepnet package for providing a tool to build and train DBN models.
Footnotes
Publisher's Disclaimer: This is a PDF file of an unedited manuscript that has been accepted for publication. As a service to our customers we are providing this early version of the manuscript. The manuscript will undergo copyediting, typesetting, and review of the resulting proof before it is published in its final citable form. Please note that during the production process errors may be discovered which could affect the content, and all legal disclaimers that apply to the journal pertain.
5. REFERENCES
- Barch DM, Burgess GC, Harms MP, Petersen SE, Schlaggar BL, Corbetta M, Glasser MF, Curtiss S, Dixit S, Feldt C, Nolan D. Function in the human connectome: task-fMRI and individual differences in behavior. Neuroimage. 2013. October 15; 80:169–89. [DOI] [PMC free article] [PubMed] [Google Scholar]
- Beckmann CF, DeLuca M, Devlin JT, Smith SM. Investigations into resting-state connectivity using independent component analysis. Philosophical Transactions of the Royal Society B: Biological Sciences. 2005. May 29;360(1457):1001–13. [DOI] [PMC free article] [PubMed] [Google Scholar]
- Belliveau JW, Kennedy DN, McKinstry RC, Buchbinder BR, Weisskoff R, Cohen MS, Vevea JM, Brady TJ, Rosen BR. Functional mapping of the human visual cortex by magnetic resonance imaging. Science. 1991. November 1;254(5032):716–9. [DOI] [PubMed] [Google Scholar]
- Bengio Y, Courville AC, Vincent P Unsupervised feature learning and deep learning: A review and new perspectives. CoRR, abs/1206.5538, 2012. [Google Scholar]
- Brosch T, Yoo Y, Li DK, Traboulsee A, Tam R. Modeling the variability in brain morphology and lesion distribution in multiple sclerosis by deep learning InInternational Conference on Medical Image Computing and Computer-Assisted Intervention, 2014, September 14 (pp. 462–469). Springer, Cham. [DOI] [PubMed] [Google Scholar]
- Carreira-Perpinan MA, Hinton GE. On contrastive divergence learning. In Aistats, 2005, January 6 (Vol. 10, pp. 33–40). [Google Scholar]
- Calhoun VD, Adali T, Pearlson GD, Pekar JJ. A method for making group inferences from functional MRI data using independent component analysis. Human brain mapping. 2001. November 1;14(3):140–51. [DOI] [PMC free article] [PubMed] [Google Scholar]
- Calhoun VD, Liu J, Adali T. A review of group ICA for fMRI data and ICA for joint inference of imaging, genetic, and ERP data. Neuroimage. 2009. March 1;45(1):S163–72. [DOI] [PMC free article] [PubMed] [Google Scholar]
- Chen H, Li K, Zhu D, Jiang X, Yuan Y, Lv P, … & Liu, T. Inferring group-wise consistent multimodal brain networks via multi-view spectral clustering. IEEE Transactions on Medical Imaging, 2013, 32(9), 1576–1586. [DOI] [PMC free article] [PubMed] [Google Scholar]
- Chen H, Liu T, Zhao Y, Zhang T, Li Y, Li M, Zhang H, Kuang H, Guo L, Tsien JZ, Liu T. Optimization of large-scale mouse brain connectome via joint evaluation of DTI and neuron tracing data. Neuroimage. 2015. July 15; 115:202–13. [DOI] [PMC free article] [PubMed] [Google Scholar]
- Chen XW, Lin X. Big data deep learning: challenges and perspectives. IEEE access, 2014, 2: 514–525. [Google Scholar]
- Erhan D, Bengio Y, Courville A, et al. Visualizing higher-layer features of a deep network. University of Montreal, 2009, 1341(3): 1. [Google Scholar]
- Fox PT, Lancaster JL. Mapping context and content: the BrainMap model. Nature Reviews Neuroscience, 2002, 3(4): 319–321. [DOI] [PubMed] [Google Scholar]
- Fox PT, Laird AR, Fox SP, et al. BrainMap taxonomy of experimental design: description and evaluation. Human brain mapping, 2005, 25(1): 185–198. [DOI] [PMC free article] [PubMed] [Google Scholar]
- Ge B, Makkie M, Wang J, et al. Signal sampling for efficient sparse representation of resting state FMRI data. Brain imaging and behavior, 2016, 10(4): 1206–1222. [DOI] [PMC free article] [PubMed] [Google Scholar]
- Goodfellow IJ, Pougetabadie J, Mirza M, Xu B, Warde-Farley D, Ozair S, Bengio Y Generative adversarial nets. In Advances in neural information processing systems, 2014, 3:2672–2680. [Google Scholar]
- Graves A, Mohamed A, Hinton G Speech recognition with deep recurrent neural networks. In IEEE international conference on Acoustics, speech and signal processing, 2013. p. 6645–6649. [Google Scholar]
- Greff K, Srivastava RK, Schmidhuber J Highway and residual networks learn unrolled iterative estimation, 2016, arXiv preprint arXiv:1612.07771. [Google Scholar]
- Hagmann P, Thiran JP, Jonasson L, Vandergheynst P, Clarke S, Maeder P, Meuli R. DTI mapping of human brain connectivity: statistical fibre tracking and virtual dissection. Neuroimage. 2003. July 1;19(3):545–54. [DOI] [PubMed] [Google Scholar]
- Hagmann P, Cammoun L, Gigandet X, Meuli R, Honey CJ, Wedeen VJ, Sporns O. Mapping the structural core of human cerebral cortex. PLoS biology. 2008. July 1;6(7):e159. [DOI] [PMC free article] [PubMed] [Google Scholar]
- He B, Coleman T, Genin GM, Glover G, Hu X, Johnson N, … & Ye K. Grand challenges in mapping the human brain: NSF workshop report. IEEE Transactions on Biomedical Engineering, 2013, 60(11), 2983–2992. [DOI] [PubMed] [Google Scholar]
- He K, Zhang X, Ren S, Sun J Deep residual learning for image recognition. In IEEE conference on computer vision and pattern recognition, 2016, p. 770–778. [Google Scholar]
- He K, Gkioxari G, Dollár P, Girshick R Mask r-cnn. 2017, arXiv preprint arXiv:1703.06870. [DOI] [PubMed] [Google Scholar]
- Hinton GE Training products of experts by minimizing contrastive divergence. Neural computation, 2002, 14:1771–1800. [DOI] [PubMed] [Google Scholar]
- Hinton GE, Osindero S, Teh Y-W A fast learning algorithm for deep belief nets. Neural computation, 2006. 18:1527–1554. [DOI] [PubMed] [Google Scholar]
- Hinton GE, Salakhutdinov RR Reducing the dimensionality of data with neural networks. Science, 2006, 313:504–507. [DOI] [PubMed] [Google Scholar]
- Honey CJ, Sporns O, Cammoun L, Gigandet X, Thiran JP, Meuli R, & Hagmann P Predicting human resting-state functional connectivity from structural connectivity. PNAS, 2009, 106(6), 2035–2040. [DOI] [PMC free article] [PubMed] [Google Scholar]
- Huang H, Hu X, Zhao Y, Makkie M, Dong Q, Zhao S, Guo L, Liu T. Modeling Task fMRI Data via Deep Convolutional Autoencoder. IEEE transactions on medical imaging. 2017. June 15. [DOI] [PubMed] [Google Scholar]
- Hu X, Huang H, Peng B, et al. Latent source mining in FMRI via restricted Boltzmann machine. Human brain mapping, 2018. [DOI] [PMC free article] [PubMed] [Google Scholar]
- Jiang X, Zhang T, Zhu D, et al. Anatomy-Guided Dense Individualized and Common Connectivity-Based Cortical Landmarks (A-DICCCOL). Biomedical Engineering, IEEE Transactions on, 2015, 62(4): 1108–1119. [DOI] [PMC free article] [PubMed] [Google Scholar]
- Jenkinson M, Smith S. A global optimization method for robust affine registration of brain images. Medical image analysis. 2001. June 1;5(2):143–56. [DOI] [PubMed] [Google Scholar]
- Koch K, et al. , Structure-function relationships in the context of reinforcement-related learning: a combined diffusion tensor imaging–functional magnetic resonance imaging study. Neuroscience, 2010, 168(1), 190–199. [DOI] [PubMed] [Google Scholar]
- Laird AR, Lancaster JJ, Fox PT. Brainmap. Neuroinformatics, 2005, 3(1): 65–77. [DOI] [PubMed] [Google Scholar]
- Le Bihan D, Breton E. Imagerie de diffusion in-vivo par résonance magnétique nucléaire. Comptes-Rendus de l’Académie des Sciences. 1985. December;93(5):27–34. [Google Scholar]
- LeCun Y, Bengio Y, Hinton G. Deep learning. Nature, 2015, 521(7553): 436–444. [DOI] [PubMed] [Google Scholar]
- Lee H, Grosse R, Ranganath R, Ng AY. Convolutional deep belief networks for scalable unsupervised learning of hierarchical representations In Proceedings of the 26th annual international conference on machine learning 2009. June 14 (pp. 609–616). ACM. [Google Scholar]
- Li L, Hu X, Huang H, et al. , Latent Source Mining of fMRI Data via Deep Belief Network, ISBI 2018. [Google Scholar]
- Lv J, Jiang X, Li X, et al. Holistic atlases of functional networks and interactions reveal reciprocal organizational architecture of cortical function. IEEE Transactions on Biomedical Engineering, 2015, 62(4): 1120–1131. [DOI] [PubMed] [Google Scholar]
- Ogawa S, Tank DW, Menon R, Ellermann JM, Kim SG, Merkle H, Ugurbil K. Intrinsic signal changes accompanying sensory stimulation: functional brain mapping with magnetic resonance imaging. PNAS. 1992. July 1;89(13):5951–5. [DOI] [PMC free article] [PubMed] [Google Scholar]
- Passingham RE, Stephan KE, Kötter R. The anatomical basis of functional localization in the cortex. Nature Reviews Neuroscience. 2002. August;3(8):606. [DOI] [PubMed] [Google Scholar]
- Palm RB. Prediction as a candidate for learning deep hierarchical models of data. Technical University of Denmark. 2012;5. [Google Scholar]
- Park HJ, Friston K. Structural and functional brain networks: from connections to cognition. Science. 2013, November 1;342(6158):1238411. [DOI] [PubMed] [Google Scholar]
- Rykhlevskaia E, Gratton G, Fabiani M. Combining structural and functional neuroimaging data for studying brain connectivity: a review. Psychophysiology. 2008. March 1;45(2):173–87. [DOI] [PubMed] [Google Scholar]
- Salakhutdinov R, Larochelle H. Efficient learning of deep Boltzmann machines. Proceedings of the Thirteenth International Conference on Artificial Intelligence and Statistics. 2010: 693–700. [Google Scholar]
- Schmahmann JD, et al. , Association fibre pathways of the brain: parallel observations from diffusion spectrum imaging and autoradiography. Brain. 2007. February 9;130(3):630–53. [DOI] [PubMed] [Google Scholar]
- Sui J, Adali T, Yu Q, et al. A review of multivariate methods for multimodal fusion of brain imaging data. Journal of neuroscience methods, 2012, 204(1): 68–81. [DOI] [PMC free article] [PubMed] [Google Scholar]
- Smolensky P Information processing in dynamical systems: Foundations of harmony theory. COLORADO UNIV AT BOULDER DEPT OF COMPUTER SCIENCE, 1986. [Google Scholar]
- Uğurbil K, Xu J, Auerbach EJ, Moeller S, Vu AT, Duarte-Carvajalino JM, Lenglet C, Wu X, Schmitter S, Van de Moortele PF, Strupp J. Pushing spatial and temporal resolution for functional and diffusion MRI in the Human Connectome Project. Neuroimage. 2013. October 15; 80:80–104. [DOI] [PMC free article] [PubMed] [Google Scholar]
- Van Essen DC, Smith SM, Barch DM, Behrens TE, Yacoub E, Ugurbil K, Wu-Minn HCP Consortium. The WU-Minn human connectome project: an overview. Neuroimage. 2013. October 15; 80:62–79. [DOI] [PMC free article] [PubMed] [Google Scholar]
- Von Der Malsburg C The correlation theory of brain function In Models of neural networks. Springer, New York, 1994. (pp. 95–119). [Google Scholar]
- Wen Z, Yin W, Zhang Y. Solving a low-rank factorization model for matrix completion by a nonlinear successive over-relaxation algorithm. Mathematical Programming Computation, 2012: 1–29. [Google Scholar]
- Woolrich MW, Jbabdi S, Patenaude B, Chappell M, Makni S, Behrens T, Beckmann C, Jenkinson M, Smith SM. Bayesian analysis of neuroimaging data in FSL. Neuroimage. 2009. March 1; 45(1):S173–86. [DOI] [PubMed] [Google Scholar]
- Zhang T, Zhu D, Jiang X, et al. Group-wise consistent cortical parcellation based on connectional profiles. Medical image analysis, 2016, 32: 32–45. [DOI] [PMC free article] [PubMed] [Google Scholar]
- Zhao S, Han J, Lv J, et al. Supervised dictionary learning for inferring concurrent brain networks. IEEE transactions on medical imaging, 2015, 34(10): 2036–2045. [DOI] [PubMed] [Google Scholar]
- Zhang S, Li X, Lv J, et al. Characterizing and differentiating task-based and resting state fMRI signals via two-stage sparse representations. Brain imaging and behavior, 2016, 10(1): 21–32. [DOI] [PMC free article] [PubMed] [Google Scholar]
- Zhao Y, Chen H, Li Y, et al. Connectome-scale group-wise consistent resting-state network analysis in autism spectrum disorder. NeuroImage: Clinical, 2016, 12: 23–33. [DOI] [PMC free article] [PubMed] [Google Scholar]
- Zhang S, Jiang X, Liu T. Joint Representation of Connectome-Scale Structural and Functional Profiles for Identification of Consistent Cortical Landmarks in Human Brains, International Conference on Medical Image Computing and Computer-Assisted Intervention. Springer, Cham, 2017a: 398–406. [Google Scholar]
- Zhang S, Zhao Y, Jiang X, et al. Joint representation of consistent structural and functional profiles for identification of common cortical landmarks. Brain Imaging and Behavior, 2017b: 1–15. [DOI] [PMC free article] [PubMed] [Google Scholar]
- Zhang S, Zhang T, Li X, Guo L, Liu T, Joint Representation of Cortical Folding, Structural Connectivity and Functional Networks, ISBI, 2018a. [Google Scholar]
- Zhang S, Liu T, Zhu D, Exploring Fiber Skeletons via Joint Representation of Functional Networks and Structural Connectivity, MICCAI, 2018b. [Google Scholar]
- Zhang S, Liu H, Huang H, Zhao Y, Jiang X, Bowers B, Guo L, Hu X, Sanchez M, Liu T. Deep Learning Models Unveiled Functional Difference between Cortical Gyri and Sulci. IEEE Transactions on Biomedical Engineering. September 28, 2018c. [DOI] [PMC free article] [PubMed] [Google Scholar]
- Zhang W, Jiang X, Zhang S, Howell BR, Zhao Y, Zhang T, Guo L, Sanchez MM, Hu X, Liu T. Connectome-scale functional intrinsic connectivity networks in macaques. Neuroscience. 2017. November 19;364:1–4. [DOI] [PMC free article] [PubMed] [Google Scholar]
- Zhang W, Lv J, Li X, et al. Experimental Comparisons of Sparse Dictionary Learning and Independent Component Analysis for Brain Network Inference from fMRI Data. IEEE Transactions on Biomedical Engineering, 2018. [DOI] [PubMed] [Google Scholar]
- Zhao Y, Dong Q, Chen H, Iraji A, Li Y, Makkie M, Kou Z, Liu T. Constructing fine-granularity functional brain network atlases via deep convolutional autoencoder. Medical image analysis. 2017a. December 1; 42:200–11. [DOI] [PMC free article] [PubMed] [Google Scholar]
- Zhao Y, Dong Q, et al. , Automatic Recognition of fMRI-derived Functional Networks using 3D Convolutional Neural Networks. IEEE Transactions on Biomedical Engineering. 2017b. June 15. [DOI] [PMC free article] [PubMed] [Google Scholar]
- Zhao Y, Ge F, Liu T, Automatic Recognition of Holistic Functional Brain Networks Using Iteratively Optimized Convolutional Neural Networks (IO-CNN) with Weak Label Initialization, in press, Medical Image Analysis, 2018. [DOI] [PMC free article] [PubMed] [Google Scholar]
- Zhu D, Li K, Guo L, et al. DICCCOL: dense individualized and common connectivity-based cortical landmarks. Cerebral cortex, 2012, 23(4): 786–800. [DOI] [PMC free article] [PubMed] [Google Scholar]
- Zhu D, Li K, Terry DP, et al. Connectome-scale assessments of structural and functional connectivity in MCI. Human brain mapping, 2014a, 35(7): 2911–2923. [DOI] [PMC free article] [PubMed] [Google Scholar]
- Zhu D, Zhang T, Jiang X, et al. Fusing DTI and fMRI data: a survey of methods and applications. NeuroImage, 2014b, 102: 184–191. [DOI] [PMC free article] [PubMed] [Google Scholar]
Associated Data
This section collects any data citations, data availability statements, or supplementary materials included in this article.


