

Abstract
Objective:
To assess the dynamics of serum levels of soluble isoform of suppression of tumorigenicity 2 (sST2) and N-terminal pro-brain natriuretic peptide (NT-proBNP) and their correlations with the development of adverse left ventricular remodeling (LVR) through 6 months in patients with primary myocardial infarction with ST-segment elevation (STEMI).
Methods:
Subjects were 31 patients with STEMI (median age: 58 years), who underwent percutaneous coronary intervention (PCI) during the first 24 hours of the onset of myocardial infarction (MI). Blood samples and parameters of echocardiography were assessed at days 1, 3, 7, and 14 and 6 months after STEMI.
Results:
Serum levels of sST2 and NT-proBNP decreased during the 6-month period. Levels of sST2 decreased by 48% from admission to day 7, and levels of NT-proBNP decreased by 40% from day 7 to 6 months after STEMI. Serum levels of sST2 at day 1 (r = 0.5, P < .05) and day 3 (r = 0.4, P < .05) were associated with adverse LVR by 6 months after STEMI. Logistic regression analysis showed that a high concentration of sST2 at day 7 increased the risk of adverse LVR (95% confidence interval [CI], 0.5-0.9; areas under curve [AUC] = 0.8; P = .002), with 92% sensitivity and 70% specificity. A multivariate analysis model revealed that adverse LVR was associated with the level of sST2 (P = .003) and with complete revascularization (P = .01) at the admission.
Conclusions:
The dynamics of serum levels of sST2 and NT-proBNP were different. The level of sST2 normalized by the 7th day; NT-proBNP decreased only by the end of the 6-month period after MI. Increased serum levels of sST2 by the 7th day of MI were associated with the development of adverse LVR by the end of the 6-month period.
Keywords: serum soluble ST2, acute myocardial infarction, adverse left ventricular remodeling, NT-proBNP
Introduction
The development of adverse left ventricular remodeling (LVR) after myocardial infarction (MI) remains a significant problem despite current achievements in invasive and pharmacological treatment.1,2 Adverse LVR is developed in 30% of patients after MI, and it is a morphological substrate of the progression of heart failure (HF).2 The change in cardiovascular homeostasis in patients with acute MI reflects an inflammatory reaction that occurs under conditions of hemodynamic stress; this is a basis of early and long-term postinfarction LVR.3,4 There have been many attempts to determine the leading mechanism of LVR progression and its significant biochemical marker.5–8 In current cardiology practice, only 2 markers reflecting the process of inflammation and hemodynamic stress are available for routine use to evaluate the prognosis of patients with acute MI. The first is high-sensitivity C-reactive protein (hCRP) and the second is N-terminal pro-brain natriuretic peptide (NT-proBNP). However, they have different dynamics, and the activities of these markers are connected with different periods of MI.9,10 The search for a universal marker of the early period of MI with better analytical characteristics elucidating the mechanisms of postinfarction LVR remains necessary. The study of a marker of hemodynamic stress with inflammatory nature, such as the soluble isoform of suppression of tumorigenicity 2 (sST2), seems promising compared with other markers showing associations with LVR development.8,11–13 A member of the interleukin (IL)-1 receptor family, ST2, is expressed in cardiomyocytes, endotheliocytes, and fibroblasts.9,14 Secretion of its soluble form (sST2) increases in response to the myocardial damage during the first weeks after MI onset, and it is associated with an increase in the degree of myocardial fibrosis, development of adverse LVR, and unfavorable cardiovascular outcomes.8,9,11 ST2 regulates the expression of pro-inflammatory cytokines from macrophages and prevents uncontrolled inflammatory reactions in the area of MI. The level of sST2 could be responsible for myocardial fibrosis and LVR, which could affect the prognosis after MI.8,11 Many studies have revealed the predictive value of sST2 level in the early period of MI, but not all previous data are in agreement and the results are not always reproducible across different research groups.6,8 The accurate terms of the assessment of sST2 level were not established, and previously identified associations were predominantly with mortality.15–18 However, the role of sST2 in the development of adverse LVR is not clear. The other marker of hemodynamic stress is the NT-proBNP, which is produced in the myocytes of the ventricles where myocardial stretch is present.9,12 This indicator of cardiomyocyte stretching is already used in patients with HF. However, parameters such as sex, age, and body mass index, as well as some diseases such as infections and kidney disease, could also influence the level of NT-proBNP.9 Some studies have investigated the combined role of sST2 and NT-proBNP in the development of adverse outcomes after MI.6,9 However, serial study of the early and late changes in sST2 levels, their association with echocardiography parameters, and comparing them with the level of NT-proBNP and with inflammatory markers bring us closer to more accurate evaluation of the risk of developing adverse LVR during the long-term period after MI.16
The aim of this study was to assess the early and late dynamics of serum levels of sST2 and NT-proBNP and their correlations with the development of adverse LVR through 6 months in patients with primary MI with ST-segment elevation (STEMI).
Methods
Study subjects
The study comprised 31 patients with primary anterior STEMI admitted to the Cardiac Emergency Department within 24 hours of onset of the disease. Percutaneous coronary intervention (PCI) was performed during the first 24 hours. The study was registered in the clinical research database ClinicalTrials.gov under the identification number NCT02562651. Exclusion criteria were included the following: more than 75 years of age, severe comorbidities, acute HF with Killip class IV (cardiogenic shock), non-Q-wave MI, heart rate <40 beats per minute, permanent form of atrial fibrillation, decompensated HF (New York Heart Association [NYHA] class III-IV), severe valvular pathology, or poor quality of imaging data. Instrumental studies, laboratory tests, and treatment were performed according to European guidelines for patients with STEMI.19 The diagnostic criteria for STEMI were the presence of chest pain typically longer than 20 minutes, ST-segment elevation of 0.1 mV in 2 or more contiguous leads or the appearance of a complete left bundle branch block on an electrocardiography (ECG), and laboratory findings of elevated creatine phosphokinase (CPK), CPK cardiac specific isoenzyme (MB), and troponin T levels >the 99th percentile upper reference limit. The protocol of the study was approved by a local ethics committee, and it was developed in compliance with the World Medical Association (WMA) Declaration of Helsinki “Ethical principles for medical research involving human subjects” (updated in 2000) and “Rules for clinical practice in the Russian Federation” approved by the Ministry of Healthcare of the Russian Federation on June 19, 2003. All patients signed informed consent forms prior to participation in the study.
Echocardiographic study
Standard transthoracic echocardiography was performed at days 3 (T2), 7 (T3), and 14 (T4) and 6 months (T5) after STEMI onset (Vivid E9; GE Healthcare).20,21 Serum was sampled at the same times and also at day 1 (T1) after STEMI onset. A scientific collaborator from the Department of Laboratory Diagnostics determined serum levels of sST2, NT-proBNP, and hCRP by an immunoenzymatic assay method. Data were compared with the results acquired from healthy volunteers.
Echocardiography data were obtained from parasternal and apical views using an ECG-synchronized 1.7-4.6 MHz sector matrix probe. All echocardiography images were analyzed offline by a single independent ultrasound diagnostic specialist, who was without any information about patient history.20–22 All data were obtained on an ultrasound machine Vivid E9 (GE Healthcare) and saved on CD-ROM drives. Then, these images were transferred and analyzed with the software GE EchoPac. Left ventricular end diastolic volume (EDV), end systolic volume (ESV), and ejection fraction (EF) were determined by a refined Simpson method in a biplane regime.23 Adverse LVR was detected when LV EDV (ΔEDV) and/or ESV (ΔESV) increased by more than 20% over 6 months after onset compared with baseline data.24
Assays
Blood serum was sampled on days 1 (T1), 3 (T2), 7 (T3), and 14 (T4) and 6 months (T5) after STEMI onset. Samples were centrifuged for 15 minutes. Then, plasma was frozen at −40°C. The serum level of sST2 was determined with the Presage ST2 Assay kits (Critical Diagnostics, San Diego, CA, USA). The level of NT-proBNP was assessed with the Biomedica kit (Bratislava, Slovakia). The level of hCRP was determined with Biomerica hCRP kits (Irvine, CA, USA). Troponin T level was measured with Immunoassay Systems Access (Beckman Coulter, Brea, CA, USA).
Data analysis and statistics
All statistical data were processed using STATISTICA 10 software. Results are presented as mean ± standard deviation (M ± SD) in the case of normal distribution and as median (Me) and the Me 25% and 75% quartiles (Q1; Q3) in the case of non-normal distribution. Value of P < .05 from 2-sided tests was considered significant. A student t-test was used when variables were normally distributed. The Friedman test was used for non-normal distribution, and the Mann-Whitney U test was used for quantitative comparisons of 2 independent groups. Spearman rank correlation coefficient indicated the presence of associations between 2 variables. A value of r (rank correlation coefficient) from 0.4 to 0.7 showed moderate correlation. Step-wise logistic regression analysis with 95% confidence intervals (CIs) determined the prognostic values of sST2 and NT-proBNP for early and long-term adverse LVR. Univariate and multivariate analyses were used to identify candidate variables for entry to a multivariable logistic regression model to select the variables most predictive of development of adverse LVR. We included the following variables in multivariable logistic regression model: EF LV, reperfusion time, sST2 and NT-proBNP levels at the admission, and complete revascularization.25
Results
Baseline characteristics
The study included 31 patients with STEMI admitted to the Cardiac Emergency Department from March 1, 2014 to March 1, 2015. Their clinical and medical history is presented in Tables 1 and 2.
Table 1.
Baseline characteristics and characteristics at discharge of patients with acute STEMI (n = 31).
| Parameters | |
|---|---|
| At the admission | |
| Age (years) | 58.3 ± 9.8 |
| Male (n (%)) | 21 (67) |
| Smoking history (n (%)) | 15 (58) |
| BMI (kg/m2) | 28 ± 5.1 |
| Hypertension history (n (%)) | 21 (67) |
| Diabetes mellitus (n (%)) | 8 (25) |
| Killip class (n (%)) | at the admission |
| 1 | 28 (91) |
| 2 | 1 (3) |
| 3 | 2 (6) |
| At the discharge | |
| Combined end point (death, recurrent MI, angina pectoris FC ⩾ III, HF NYHA class > I) | 7 (22) |
| Recurrent MI | 1 (3) |
| HF NYHA class > I | 5 (16) |
| Angina pectoris FC ⩾ III | 1 (3) |
Abbreviations: BMI, body mass index; FC, functional class; HF, heart failure; MI, myocardial infarction; NYHA, New York Heart Association; STEMI, myocardial infarction with ST-segment elevation.
Table 2.
Primary PCI results and transthoracic echocardiographic data of patients with acute STEMI (n = 31).
| Parameter | |
|---|---|
| Extent of CAD, n (%) | |
| 1-vessel | 22 (71) |
| 2-vessel | 7 (23) |
| 3-vessel | 2 (6) |
| Reperfusion time (hours) | 4.8 ± 3.3 |
| First 3 hours, n (%) | 9 (29) |
| Time from pain onset-PCI center | 3.8 ± 3 hours |
| Thrombolysis + PCI, n (%) | 17 (54) |
| Primary PCI, n (%) | 14 (45) |
| Delayed PCI, n (%) | 14 (45) |
| Complete reperfusion, n (%) | 20 (64) |
| LV EDV (day 3), mL | 107 ± 21.9 |
| ΔLV EDV (day 3, 6 months, %) | 13.0 ± 20.0 |
| LV ESV (day 3), mL | 49 ± 15.1 |
| ΔLV ESV (day 3, 6 months, %) | 19.6 ± 40 |
| LV EF (day 3), % | 54.2 ± 9.2 |
| ΔLV EF (day 3, 6 months; %) | 2.9 ± 7.6 |
Abbreviations: CAD, coronary artery disease; PCI, percutaneous coronary intervention; EDV, end diastolic volume; ESV, end systolic volume; EF, ejection fraction; LV, left ventricular.
Heart rhythm disorders were the most frequent complications of MI at admission (29%); however, acute HF with Killip class ⩾II occurred only in 9% of patients. There were no deaths during the 6-month period after MI. Only 3% of patients had a recurrent MI; 3% of patients had angina pectoris FC ⩾III; 31% of patients had HF NYHA class >I, and 45% patients had adverse LVR to 6-month period. Associations with angina pectoris and HF NYHA class >I were shown only for NT-proBNP at time points T3 and T5 (r = 0.6 for each of them; P = .04 and .042, respectively). The trends in echocardiographic parameters are shown in Figure 1.
Figure 1.
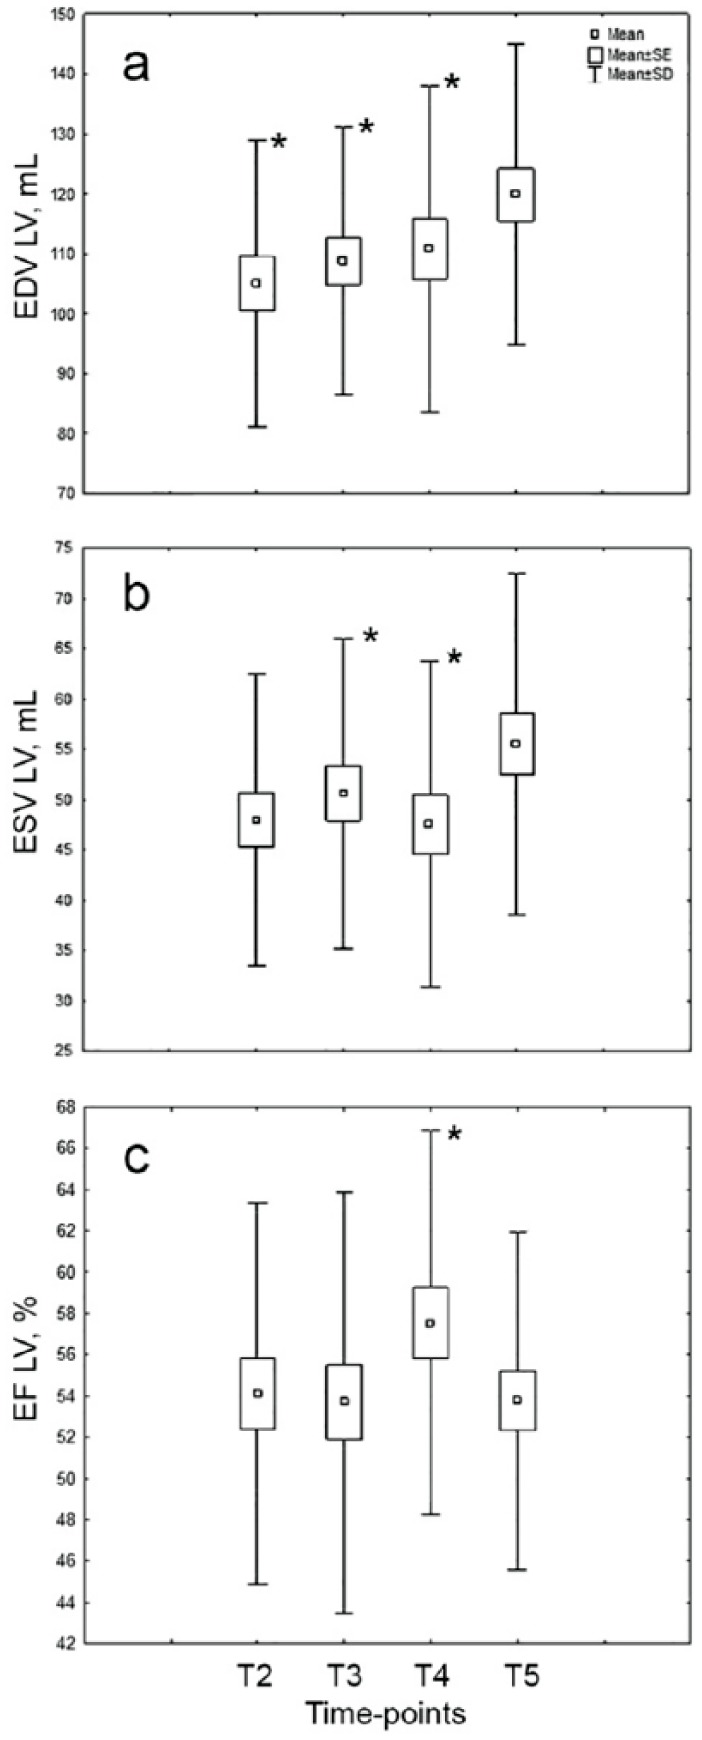
Changes in baseline echocardiographic parameters (EF LV, EDV LV, ESV LV) in the 6-month period in patients with STEMI. (n = 31; CP < .05: significant difference between time-point T5 and others.) EDV indicates end diastolic volume; EF, ejection fraction; ESV, end systolic volume; LV, left ventricular; MI, myocardial infarction; STEMI, myocardial infarction with ST-segment elevation; T2, 3rd day; T3, 7th day; T4: 14th day; T5: 6 months after MI.
Dynamics of sST2, NT-proBNP, and hCRP
The level of sST2 decreased from time-point T1 to time-point T5 (Figure 2). More marked changes were observed during the first 7 days after STEMI, and subsequently a gradual reduction from time-point T1 to time-point T2 (P = .046), and then from time-point T2 to time-point T3 (P = .037).
Figure 2.
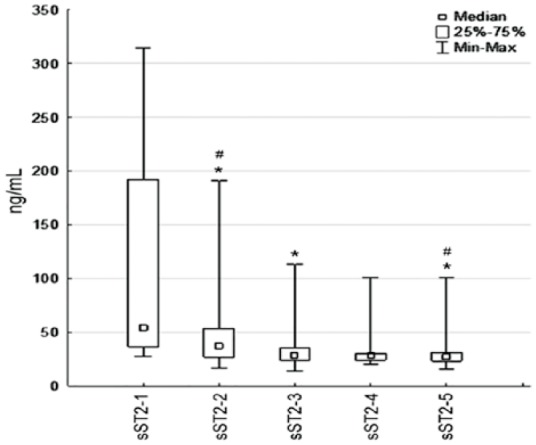
Changes in the serum levels of sST2 in the 6-month period in patients with STEMI. (n = 31; *P < .05: significant difference between time-point T1 and others, #P < .05: significant difference between time-point T3 and others.) MI indicates myocardial infarction; STEMI, myocardial infarction with ST-segment elevation; sST2, soluble isoform of suppression of tumorigenicity 2; 1, 1st day (Т1); 2, 3rd day (Т2); 3, 7th day (Т3); 4, 14th day (Т4); 5, 6 months after MI (Т5).
The levels of sST2 decreased by 48% from the baseline to time-point T3 (53[28; 279] ng/mL vs 286[14; 113] ng/mL, P = .001). However, sST2 decreased by only 2% from time-point T3 to time-point T5 (28[14; 113] ng/mL vs 27[16; 54] ng/mL, P = .85). At the time of admission, 68% of the patients had elevated sST2 (>35 ng/mL). This proportion decreased to 25% at time-point T3 and to 12% at time-point T5. The other marker of hemodynamic stress, NT-proBNP, showed different dynamics (Figure 3).
Figure 3.
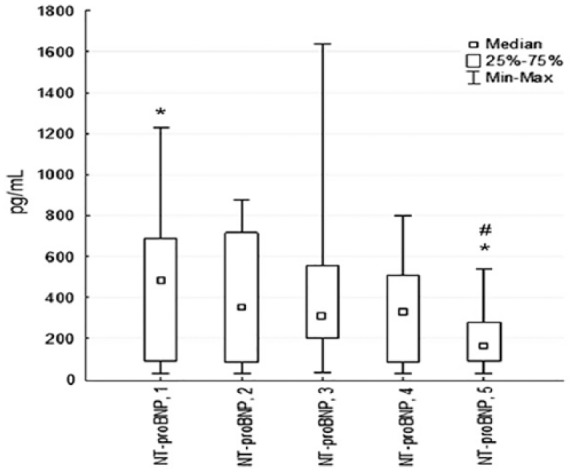
Changes in serum levels of NT-proBNP at 6 months in patients with STEMI. (n = 31; *P < .05: significant difference between time-point T3 and others; #P < .05: significant difference between time-point T4 and others.) NT-proBNP indicates N-terminal pro-brain natriuretic peptide; STEMI, myocardial infarction with ST-segment elevation; 1; 1st day (Т1); 2, 3rd day (Т2); 3, 7th day (Т3); 4, 14th day (Т4); 5, 6 months after MI (Т5).
Its levels decreased by 2% from the baseline to time-point T3 (454[27; 1227] pg/mL vs 316[34; 1640] pg/mL, P = .33), but it decreased to 40% from time-point T3 to time-point T5 (309[34; 1640] pg/mL vs 203[27; 536] pg/mL, P = .001). At the time of admission, 64% of the patients had elevated NT-proBNP (>125 pg/mL), and it was 76% at time-point T3 and 65% at time-point T5.
These markers decreased from the first day after MI until the end of the 6-month period: For sST2, this was from 53 (28; 279) to 27 (16; 54) ng/mL (P = .001); for NT-proBNP, it was from 454 (27; 1227) to 203 (27; 536) pg/mL (P = .015).
The level of hCRP decreased from time-point T2 to time-point T5 (10.2 [3.2; 11.6] mg/L vs 2.6 [0.1; 7.7] mg/L, P = .003). However, significant changes in hCRP level during the hospital stay were observed only from time-point T3 to time-point T4 (7.6 [1.1; 11.5] mg/L vs 3.1[1; 8] mg/L, P = .0010 (Figure 4).
Figure 4.
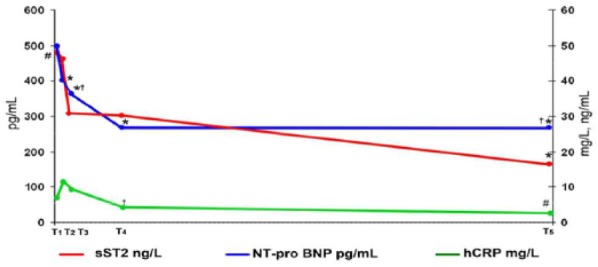
Dynamics of serum levels of NT-proBNP, hCRP, and sST2 over 6 months in patients with STEMI. (n = 31; *P < .05: significant difference between time-point T1 and other time-points; #P < .05: significant difference between time-point T2 and other time-points; †P < .05: significant difference between time-point T3 and other time-points.) hCRP indicates high-sensitivity C-reactive protein; NT-proBNP, N-terminal pro-brain natriuretic peptide; sST2, soluble isoform of suppression of tumorigenicity 2; STEMI, myocardial infarction with ST-segment elevation; T1, 1st day; T2, 3rd day; T3, 7th day; T4, 14th day; T5, through 6 months after MI.
Among the clinical parameters, we found a direct association between the level of sST2 and diabetes mellitus (r = 0.39; P = .046), and a correlation was found between the level of NT-proBNP and physical inactivity (r = 0.44, P = .034).
Then, we analyzed the correlations between levels of sST2 and NT-proBNP and standard markers of necrosis, such as troponin T and CPK MB during the whole period of the observation. We found an association between the level of sST2 and troponin T (r = 0.46; P = .034) at admission. In addition, the serum levels of sST2 and hCRP correlated at time-point T3 (r = 0.5; P = .034).
The results of the correlation analyses did not show associations between the level of NT-proBNP and the development of adverse LVR by 6 months after STEMI. However, serum levels of sST2 at time-points T1 (r = 0.5, P < .05) and T2 (r = 0.4, P < .05) were associated with adverse LVR by 6 months after STEMI.
sST2 and NT-proBNP in development of LVR
The next stage of our study was a comparative analysis of these markers in the groups with (14 patients) or without (17 patients) adverse LVR at 6 months after MI (Table 3). These groups did not differ in clinical and medical history.
Table 3.
Comparison differences between the serum levels of NT-proBNP and sST2 and their dynamics in patients with/without adverse LVR (n = 31).
| Parameter | LVR+ (n = 14) | LVR− (n = 17) | P | LVR+ (n = 14) | LVR− (n = 17) |
|---|---|---|---|---|---|
| NT-proBNP (pg/mL) | |||||
| T1 | 218 (27–577) | 502 (27–1227) | >.05 | ||
| T2 | 412 (232–802) | 410 (232–802) | >.05 | ||
| T3 | 280 (34–645) | 343 (73–1640) | >.05 | † | |
| T4 | 302 (27–376) | 463 (60–801) | >.05 | ||
| T5 | 127 (27–123) | 191 (32–536) | >.05 | †† | |
| sST2 (ng/mL) | |||||
| T1 | 162 (36–279) | 42 (28–262) | .015 | ||
| T2 | 81 (29–191) | 33 (17–61) | .021 | †† | †† |
| T3 | 39 (24–113) | 25 (14–44) | >.05 | †† | ††, ††† |
| T4 | 30 (26–40) | 27 (20–51) | >.05 | †† | †† |
| T5 | 27 (16–36) | 27 (20–54) | >.05 | †† | †† |
Abbreviations: LVR, left ventricular remodeling; LVR+, with adverse LVR to 6-month period; LVR−, without adverse LVR to 6-month period; NT-proBNP, N-terminal prohormone of brain natriuretic peptide; sST2, soluble ST2; T1, 1st day; T2, 3rd day; T3, 7th day; T4, 14th day; T5, at 6 months after MI.
Values are presented as median (25%-75% quartile).
P < .05: significant difference between time-point T5 and other time-points.
P < .05: significant difference between time-point T1 and other time-points.
P < .05: significant difference between time-point T2 and other time-points.
We analyzed the sensitivity and specificity of the assessment of serum levels of NT-proBNP and sST2 in time-points T1-T4 and revealed that the highest meanings of sensitivity and specificity were in time-point T3. Logistic regression analysis showed that a high level of NT-proBNP at time-point T3 was accompanied by adverse LVR in the 6-month period (95% CI, 0.5-0.9; AUC = 0.8; P = .1), with 80% diagnostic sensitivity and 78% specificity. Also, logistic regression analysis showed that a high concentration of sST2 at time-point T3 increased the risk of adverse LVR (95% CI, 0.5-0.9; areas under curve [AUC] = 0.8; P = .002), with 92% sensitivity and 70% specificity. However, the predicted probability from the binary logistic model including sST2 and NT-proBNP together yielded an AUC of 0.8 (95% CI, 0.5-0.9, P = .2), which did not have any advantages compared with the assessment of sST2 or NT-pro-BNP alone (Figure 5).
Figure 5.
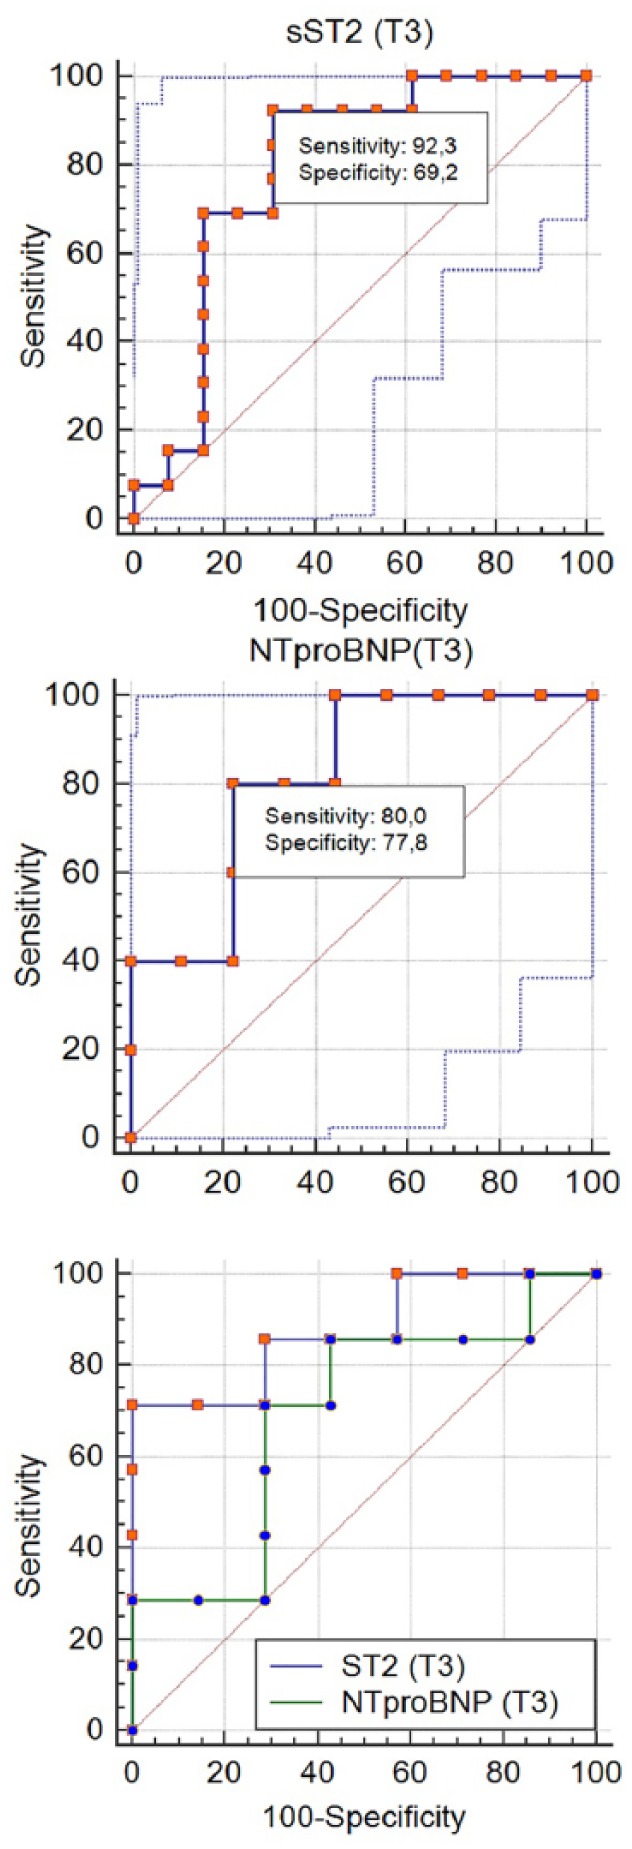
ROC curve analysis on predictive values of serum levels of NT-proBNP and sST2 for adverse LVR (n = 31). LVR indicates left ventricular remodeling; NT-proBNP, N-terminal prohormone of brain natriuretic peptide; ROC, receiver operating characteristic curve; sST2, soluble ST2; T3, 7th day.
The following predictors of developing adverse LVR were included in the multivariate analysis model after using linear regression: reperfusion time, complete revascularization, value of EF LV, and prospective markers of adverse LVR such as sST2 and NT-proBNP. Adverse LVR was associated with the level of sST2 (P = .003) and with complete revascularization (P = .01) at time-point T1 (Table 4).
Table 4.
Summary of multiple linear regression of EF LV, sST2, NT-proBNP, reperfusion time, complete revascularization, and diagnosis on adverse LVR.
| Variable (T1) | β (standard deviation) | T | P value |
|---|---|---|---|
| EF LV | 0.18 | 1.0 | .3 |
| sST2 | −0.3 | 2.3 | .003 |
| NT-proBNP | 0.005 | 0.03 | .97 |
| Reperfusion time | −0.04 | 0.2 | .8 |
| Complete revascularization | 0.4 | 2.8 | .01 |
Abbreviations: EF LV, ejection fraction of left ventricular; LVR, left ventricular remodeling; NT-proBNP, N-terminal prohormone of brain natriuretic peptide; sST2, soluble ST2; T1, 1st day after myocardial infarction.
Multiple regression (n = 31). Correlation between adverse LVR and its expected predictors.
Discussion
The processes of structural and functional deformation of the myocardium after MI are multifaceted. Markers of hemodynamic stress, markers of degradation of the intercellular matrix, and markers of inflammation show the intensive processes that alter the myocardium.6,10 Numerous data indicate the presence of associations between these biomarkers and adverse cardiovascular events, such as increased risk of mortality, and nonfatal adverse cardiac events, such as worsening HF, recurrent MI, stroke, and development of adverse LVR.6,8,9 However, these findings are conflicting and contradictory; furthermore, accurate times and reference values of these markers for patients with STEMI do not exist. We assessed a group of patients in working age with the primary MI, and timely revascularization, and modern therapy of MI. However, remodeling of the myocardium is a process that inevitably occurs after MI and the percentage of these patients in our group was more than in world practice—45% of patients.2 Serial analysis of sST2 dynamics, their connection with clinical and anamnestic data and parameters of echocardiography and comparison with NT-proBNP allow us to get closer to determining the role of sST2 in the development of adverse LVR and to evaluate its possible advantages. Currently, only instrumental markers, such as the parameters of echocardiography, are used to indicate the development of adverse LVR.2,24 The search for a convenient and reliable biomarker of adverse LVR, which allows us to predict this condition in the early stages based on an accurate date of assessment, seems promising.26 Among the markers of hemodynamic stress, NT-proBNP is used in clinical practice as a marker of unfavorable prognosis in HF, whereas sST2 is recommended for additional risk stratification according to a 2013 recommendation from the American College of Cardiology Foundation and the American Heart Association.12 However, it also has an inflammatory nature. Furthermore, sST2 has been proposed as a prognostic marker of mortality in patients with acute coronary syndrome (ACS) and HF.8,9,11–13 The levels of these markers increase in response to high wall tension of the heart ventricles, which accompanies the development of MI.26 We confirmed the results of other investigators that showed that the levels of sST2 and NT-proBNP were increased on the first day after MI.6,27 In addition, all of these markers decreased during the 6-month period following MI. However, the dynamics of their declines were different. The level of sST2 decreased more intensively during the first 7 days, but the level of NT-proBNP decreased effectively after the 7th day. These dynamics of sST2 can be explained by its inflammatory nature, such as the dynamics of hCRP, whose levels increased acutely during acute MI.26 We suggest that the level of sST2 reflects the amount of injured tissue and that it is associated with necrosis and inflammatory events, whereas NT-proBNP is associated with cardiac mechanical stress.12,28,29 We also found the connection between the level of sST2 and troponin T, and although these data are contradictory,6 it may confirm that sST2 plays a role in inflammation.
The associations of high levels of sST2 in the earlier period of MI and adverse outcomes were found in early research, but it was previously associated with mortality.15,16,17,29 We revealed the same association of sST2 at days 1 and 3, but it was with adverse LVR after the 6-month period, such changes in sST2 could be the result of damage to endothelial cells during the acute period of MI, because this type of cell is the primary producer of sST2.9,14 Increased serum levels of sST2 during the first 7 days after STEMI reflect early stage of MI, when clinical signs and symptoms of left ventricle dysfunction have not yet appeared, but the assessment of sST2 could predict the development of the progression of LVR. This is supported by multivariate analysis in our study. However, there was no data to support the associations between the level of NT-proBNP and adverse LVR. Receiver operating characteristic curve (ROC) analysis also showed that the assessment of the level of sST2 at the seventh day has the best sensitivity and specificity. A high level of sST2 at admission showed a significant decrease at day 7, and the absence of it was associated with adverse LVR. Some studies have compared the role of sST2 and NT-proBNP; however, they did not use serial measurements of these markers and they assessed early prognosis after MI.6 Other investigators assessed sST2 at admission and on the second or third day and its predictive value for cardiovascular death or congestive heart failure (CHF) during a year following PCI. They found that combined high sST2 and NT-proBNP were associated with the worst prognosis, but we found it useful to determine sST2 level in the early post MI period. Serial analysis of sST2 dynamics at the early and late period of MI led us to determine more useful terms of assessment for sST2. Also, it helps us to understand that future investigation of the role of sST2 in the development of LVR and HF could allow us to improve the quality of personal medicine for patients with a high risk of developing these conditions after MI.
Limitations
This study was conducted as a single-center trial. A small sample was studied due to limited time and strict inclusion criteria. For these reasons, further studies are required.
Conclusions
The dynamics of serum levels of soluble isoform of suppression of tumorigenicity 2 and NT-proBNP were different. The level of soluble isoform of suppression of tumorigenicity 2 was normalized by the 7th day, and NT-proBNP decreased only by the end of the 6-month period after MI. Increased serum levels of soluble isoform of suppression of tumorigenicity by the 7th day of MI were associated with the development of adverse left ventricular remodeling by the end of the 6-month period.
Footnotes
Funding:The author(s) received no financial support for the research, authorship, and/or publication of this article.
Declaration of conflicting interests:The author(s) declared no potential conflicts of interest with respect to the research, authorship, and/or publication of this article.
Author Contributions: All clinical, anamnestic, laboratory, instrumental data presented in the thesis, processed, analyzed and described by the author. The author conducted post-processing work of ultrasound of the heart, as well as statistical processing and analysis of the data.
ORCID iD: Maria Kercheva  https://orcid.org/0000-0003-1444-1037
References
- 1. Savoye C, Equine O, Tricot O, et al. Left ventricular remodeling after anterior wall acute myocardial infarction in modern clinical practice (from the REmodelage VEntriculaire [REVE] study group). Am J Cardiol. 2006;98:1144–1149. [DOI] [PubMed] [Google Scholar]
- 2. Galli A, Lombardi F. Postinfarct left ventricular remodelling: a prevailing cause of heart failure. Cardiol Res Pract. 2016;18:2579832. [DOI] [PMC free article] [PubMed] [Google Scholar]
- 3. Kelly D, Cockerill G, Ng LL, et al. Plasma matrix metalloproteinase-9 and left ventricular remodeling after acute myocardial infarction in man: a prospective cohort study. Eur Heart J. 2007;28:711–718. [DOI] [PMC free article] [PubMed] [Google Scholar]
- 4. Wang J, Tan GJ, Han LN, Bai YY, He M, Liu HB. Novel biomarkers for cardiovascular risk prediction. J Geriatr Cardiol. 2017;14:135–150. [DOI] [PMC free article] [PubMed] [Google Scholar]
- 5. Nishiguchi T, Tanaka A, Taruya A, et al. Local matrix metalloproteinase 9 level determines early clinical presentation of ST-segment-elevation myocardial infarction. Arterioscler Thromb Vasc Biol. 2016;36:2460–2467. [DOI] [PubMed] [Google Scholar]
- 6. Barbarash O, Gruzdeva O, Uchasova E, et al. Prognostic value of soluble ST2 during hospitalization for ST-segment elevation myocardial infarction. Ann Lab Med. 2016;36:313–319. [DOI] [PMC free article] [PubMed] [Google Scholar]
- 7. Morishita T, Uzui H, Mitsuke Y, et al. Association between matrix metalloproteinase-9 and worsening heart failure events in patients with chronic heart failure. ESC Heart Fail. 2017;4:321–330. [DOI] [PMC free article] [PubMed] [Google Scholar]
- 8. Marino R, Magrini L, Orsini F, et al. Comparison between soluble ST2 and high-sensitivity troponin I in predicting short-term mortality for patients presenting to the emergency department with chest pain. Ann Lab Med. 2017;37:137–146. [DOI] [PMC free article] [PubMed] [Google Scholar]
- 9. Sabatine MS, Morrow DA, Higgins LJ, et al. Complementary roles for biomarkers of biomechanical strain ST2 and N-terminal prohormone B-type natriuretic peptide in patients with ST-elevation myocardial infarction. Circulation. 2008;117:1936–1944. [DOI] [PMC free article] [PubMed] [Google Scholar]
- 10. Kachkovsky MA, Ragozinа EY. Assessment of systemic inflammatory reaction in acute myocardial infarction: status update on the problem. Rational Pharmaco Cardiol. 2013;6:691–697. [Google Scholar]
- 11. Bayes-Genis A, de Antonio M, Galan A, et al. Combined use of high-sensitivity ST2 and NTproBNP to improve the prediction of death in heart failure. Eur J Heart Fail. 2012;14:32–38. [DOI] [PubMed] [Google Scholar]
- 12. Yancy CW, Jessup M, Bozkurt B, et al. 2013 ACCF/AHA guideline for the management of heart failure: executive summary: a report of the American College of Cardiology Foundation/American Heart Association Task Force on practice guidelines. Circulation. 2013;128:1810–1852. [DOI] [PubMed] [Google Scholar]
- 13. van der Velde AR, Lexis CP, Meijers WC, et al. Galectin-3 and sST2 in prediction of left ventricular ejection fraction after myocardial infarction. Clin Chim Acta. 2016;452:50–57. [DOI] [PubMed] [Google Scholar]
- 14. Demyanets S, Kaun C, Pentz R, et al. Components of the interleukin-33/ST2 system are differentially expressed and regulated in human cardiac cells and in cells of the cardiac vasculature. J Mol Cell Cardiol. 2013;60:16–26. [DOI] [PMC free article] [PubMed] [Google Scholar]
- 15. Shimpo M, Morrow DA, Weinberg EO, et al. Serum levels of the interleukin-1 receptor family member ST2 predict mortality and clinical outcome in acute myocardial infarction. Circulation. 2004;109:2186–2190. [DOI] [PubMed] [Google Scholar]
- 16. Hartopo AB, Sukmasari I, Puspitawati I. The Utility of Point of Care Test for Soluble ST2 in Predicting Adverse Cardiac Events during Acute Care of ST-Segment Elevation Myocardial Infarction. Cardiol Res Pract. 2018;2018:3048941. [DOI] [PMC free article] [PubMed] [Google Scholar]
- 17. Jha D, Goenka L, Ramamoorthy T, Sharma M, Dhandapani VE, George M. Prognostic role of soluble ST2 in acute coronary syndrome with diabetes. Eur J Clin Invest. 2018;48:e12994. [DOI] [PubMed] [Google Scholar]
- 18. Kokkoz Ç, Bilge A, Irik M, et al. Prognostic value of plasma ST2 in patients with non-ST segment elevation acute coronary syndrome. Turk J Emerg Med. 2018;18:62–66. [DOI] [PMC free article] [PubMed] [Google Scholar]
- 19. Thygesen K, Alpert JS, Jeffe AS, et al. Third universal definition of myocardial infarction. J Am Coll Cardiol. 2012;60:1581–1598. [DOI] [PubMed] [Google Scholar]
- 20. Kercheva M, Ryabova T, Ryabov V, Karpov R. Intraobserver reproducibility of parameters of standard and 2D speckle tracking echocardiography, dynamics of global longitudinal strain I in patients with acute primary anterior STEMI. AIP Conf Proc. 2015;1688:030017. [Google Scholar]
- 21. Kercheva M, Ryabov V, Ryabova T, Karpov R. Dynamics in parameters of standard and 2D speckle tracking echocardiography in patients with acute primary anterior STEMI. Siberian Med J. 2016;29:43–48. [Google Scholar]
- 22. Voigt JU, Pedrizzetti G, Lysyansky P, et al. Definitions for a common standard for 2D speckle tracking echocardiography: consensus document of the EACVI/ASE/industry task force to standardize deformation imaging. J Am Soc Echocardiogr. 2015;28:183–193. [DOI] [PubMed] [Google Scholar]
- 23. Lang RM, Badano LP, Mor-Avi V, et al. Recommendations for cardiac chamber quantification by echocardiography in adults: an update from the American Society of Echocardiography and the European Association of Cardiovascular Imaging. J Am Soc Echocardiogr. 2015;28:1–39. [DOI] [PubMed] [Google Scholar]
- 24. Markov VA, Ryabov VV, Vyshlov EV, et al. Postinfarction Heart Remodeling After Acute Myocardial Infarction and Pharmakoinvasive Reperfusion and Enhanced External Counterpulsation. Tomsk: STT; 2014:244. [Google Scholar]
- 25. Glanz S. Primer of Biostatistics. 5th ed. London, England: McGraw-Hill Education; 2001:496. [Google Scholar]
- 26. Ciccone MM, Cortese F, Gesualdo M, et al. A novel cardiac bio-marker: ST2: a review. Molecules. 2013:15314–15328. [DOI] [PMC free article] [PubMed] [Google Scholar]
- 27. Gruzdeva O, Uchasova E, Belik E, Dyleva Y, Shurygina E, Barbarash O. Lipid, adipokine and ghrelin levels in myocardial infarction patients with insulin resistance. BMC Cardiovasc Disord. 2014;14:7. [DOI] [PMC free article] [PubMed] [Google Scholar]
- 28. White HD. Pathobiology of troponin elevations: do elevations occur with myocardial ischemia as well as necrosis. J Am Coll Cardiol. 2011;57:2406–2408. [DOI] [PubMed] [Google Scholar]
- 29. Yu J, Oh PC, Kim M, et al. Improved early risk stratification of patients with ST-segment elevation myocardial infarction undergoing primary percutaneous coronary intervention using a combination of serum soluble ST2 and NT-proBNP. PLoS ONE. 2017;12:e0182829. [DOI] [PMC free article] [PubMed] [Google Scholar]