

Summary
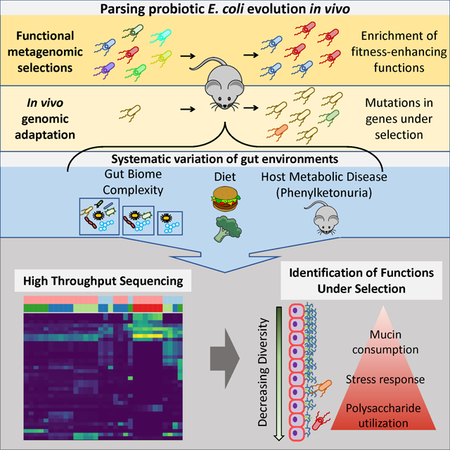
Probiotics are living microorganisms that are increasingly used as gastrointestinal therapeutics by virtue of their innate or engineered genetic function. Unlike abiotic therapeutics, probiotics can replicate in their intended site, subjecting their genomes and therapeutic properties to natural selection. We exposed the candidate probiotic E. coli Nissle (EcN) to the mouse gastrointestinal tract over several weeks, systematically altering diet and background microbiota complexity. Intransit EcN accumulates genetic mutations that modulate carbohydrate utilization, stress response, and adhesion to gain competitive fitness, while previous exposure to antibiotics reveals an acquisition of resistance. We then leveraged these insights to generate an EcN strain that shows therapeutic efficacy in a mouse model of phenylketonuria and found that it was genetically stable over one week, thereby validating EcN’s utility as a chassis for engineering. Collectively, we demonstrate a generalizable pipeline which can be applied to other probiotics to better understand their safety and engineering potential.
Graphical abstract
eTOC Blurb
E. coli Nissle is a probiotic and chassis for engineered biotherapies, but its adaptive behavior in the gut is unclear. Crook et al. report host-mediated selective pressures modulating carbohydrate utilization and metabolism of E. coli Nissle. This in-host evolution also promotes probiotic survival by enabling effective stress responses during colonization.
Introduction
Probiotics are live microorganisms that provide health benefits when consumed, including enhancement of gut epithelial barrier function, blocking of pathogen binding, and vitamin synthesis (Hill et al., 2014). There has been increasing success in expanding the therapeutic scope and efficacy of probiotics through genetic engineering, with prior work demonstrating preclinical efficacy against infectious and metabolic diseases (Durrer et al., 2017; Hwang et al., 2017; Isabella et al., 2018; Palmer et al., 2018). Engineered probiotics are exciting platforms for in situ drug synthesis and delivery, provided they maintain appropriate abundance and activity at their target site. Unlike conventional (abiotic) therapeutics, wild type or engineered probiotics replicate in the gut and are therefore subject to natural selection, potentially to the detriment of their intended therapeutic effect and safety profile. Indeed, both commensal and pathogenic microbes adapt in a host-specific manner during gut passage (Lieberman et al., 2014; Zhao et al., 2018). In addition, probiotic efficacy and colonization of the gut is highly variable between subjects, and some of this variability can be attributed to person-specific gut microbiome features prior to treatment such as alpha diversity and diet (Rothschild et al., 2018; Suez et al., 2018; Zmora et al., 2018) . Clinical use of probiotics, especially genetically engineered probiotics, therefore will benefit from a thorough understanding of their in vivo evolutionary trajectories under diverse schemes of microbiome complexity and host diet. In this study, we use mouse models to determine the selective forces acting on probiotics in vivo.
We focus on the probiotic Escherichia coli Nissle 1917 (EcN), an E. coli clade B2 commensal [Figure S1]. EcN has a long history of use in humans (Westendorf et al., 2005), has demonstrated efficacy against inflammatory bowel disease (Scaldaferri et al., 2016), and has been gaining increased attention as a chassis for engineered function (Hwang et al., 2017; Isabella et al., 2018; Kurtz et al., 2019; Palmer et al., 2018). We expected several factors to drive adaptation of EcN in the mouse gut. First, EcN cannot natively degrade many of the complex polysaccharides present in the intestine (Fabich et al., 2008; Hoskins et al., 1985) and is dependent on other species for production of metabolizable sugars (Conway and Cohen, 2015), which may lead to adaptations in carbohydrate utilization, especially in low-diversity microbiomes. Second, the high prevalence of antagonistic interspecies interactions in the gut (Wexler et al., 2016) may drive adaptation in EcN’s encoded colicins (Patzer et al., 2003). Third, since EcN normally resides in multi-species biofilms on the outer mucin layer (Conway and Cohen, 2015), introduction to the murine gut may drive adaptation in adhesins, increasing their specificity to mouse mucins. Finally, expression of a Phe-degrading enzyme (modeling an engineered probiotic therapy) (Isabella et al., 2018) may impose a metabolic burden (Fletcher et al., 2016; Lechner et al., 2016).
We tested these hypotheses using both whole-genome sequencing of in vivo adapted isolates and in vivo functional metagenomic selections. Isolates were adapted and metagenomic libraries (derived from healthy human fecal samples) were selected in mice subject to a spectrum of diets and microbiome complexities. In addition, some mice were the genetic model (Pahenu2-/enu2-) for phenylketonuria (PKU). This combination of whole-genome adaptive evolution and functional metagenomics enabled us to investigate the endogenous adaptations and human gut metagenome-encoded genes that can confer a selective advantage to EcN. The functional metagenomic selections served as an approximate model for adaptation via horizontal gene transfer, which is a major mechanism driving bacterial evolution (Ferreiro et al., 2018; Soucy et al., 2015), and frequently associated with key functional determinants such as antibiotic resistance (Smillie et al., 2011). In total we analyzed 225 longitudinal samples from functional metagenomic selections in 33 mice [Table 1], and 401 EcN isolates from 20 mice [Figure S2, Table S3].
Table 1. Summary of Functional Metagenomic Selection Experiments.
See also Figure S2, Tables S1, Table S2, and Table S4 for descriptions of the selection experiments, diet compositions and the 13-member community.
| Microbiome | Diet | #Mice |
|---|---|---|
| Germ-free | Mouse | 6 |
| Germ-free | Human | 5 |
| Germ-free | Human+Dextrin | 5 |
| Germ-free | Human+Inulin | 5 |
| Germ-free | Human | 3 |
| 13-member | Human | 3 |
| 13-member | Human+Dextrin | 3 |
| 13-member | Human+Inulin | 3 |
Results
Rationale for functional metagenomic selections in the low-diversity gut
The source of our metagenomic DNA was stool from two healthy human infants and six healthy human mothers to approximate the diversity of microbial taxa present in the gut through different life stages (Moore et al., 2015). Our library comprised ~1.5×10⁷ unique 2–5kb fragments of metagenomic DNA. We confirmed in a longitudinal in vivo experiment that the empty vector remained stable in EcN over 5 weeks in the mouse gut [Figure S3]. By competing millions of recombinant EcN strains against each other in vivo, we expected to observe significant enrichment of a subpopulation of strains with DNA inserts conferring a fitness advantage to EcN. Specifically, we hypothesized that functional metagenomic selections in germ-free mice would select for enzymes capable for degrading complex polysaccharides, a function that E. coli typically depends on gut anaerobes to carry out (Conway and Cohen, 2015; Fabich et al., 2008).
Selection for carbohydrate utilization in the germ-free gut
Metagenomic libraries were delivered to six germ-free C57BL/6 mice. These mice consumed a mouse diet (MD) composed primarily of plant-based carbohydrates and protein [Figure 1a, Tables S1–S2]. Over 5 weeks, we observed a striking reduction in the diversity of metagenomic inserts - the same 5 sequences were selected in all 6 mice [Figure 1b]. These inserts rose from a low starting abundance (0.187% for the most abundant fragment on day 1 of selection), to over 75% combined abundance in each mouse. Four out of these five inserts contained genes encoding a predicted glycosyl hydrolase family 32 (GH32) enzyme, and several of these inserts also contained genes encoding predicted transporters and other enzymes involved in sugar utilization [Figure 2b]. To test our hypothesis that these inserts enhance carbohydrate utilization, we cloned these metagenomic fragments into wild type (WT) EcN and looked for conferred carbon source utilization using phenotypic microarrays [Supplementary File 1].
Figure 1. Functional metagenomic selections in EcN mono-colonized mice.

A) Experimental design and sampling timeline. Mice were gavaged on day 0. N: number of replicate mice. B-E) Relative abundance of metagenomic fragments in replicate mice fed standard mouse diet and water (B), a high-fat human diet and water (C), a high-fat human diet and dextrin (D), or a high-fat human diet and inulin (E). MD: fragments enriched in mice fed Mouse Diet; HD: fragments enriched in mice fed Human Diet. See also Figures S1–S4, and Table S6.
Figure 2. Selection for carbohydrate utilization and acid tolerance in EcN mono-colonized mice.

A) Growth curves of strains expressing fragments enriched in the functional selections on minimal media supplemented with different carbon sources. *P < 6×10⁻³, Student’s t-test comparing time taken to reach OD600=0.25 between WT and MD04. B) Annotations of select metagenomic fragments enriched in the functional selections. C) Growth curves of 3 biologically-replicate EcN strains expressing the gadX DNA insert (MD04) or EcN carrying empty vector (WT) after a 30 minute pulse in acidic (pH 2.5) or neutral (pH 7.0) conditions. * P < 0.001, Student’s t-test for the time needed to return to the maximum optical density prior to the pulse between MD04 fragments and WT, Bonferroni correction for multiple comparisons. D) Growth of WT EcN on 1% raffinose minimal media pre-conditioned by EcN strains carrying MD01 or MD02, or by WT EcN, or on unconditioned 1% raffinose minimal M9 media (left). No growth was observed in uninoculated conditioned media (right). * P < 0.001, Student’s t-test on the K parameter of logistic models fit to the data using the growthcurver R package, Bonferroni correction for multiple comparisons. The shaded regions represent the standard deviation of 8 experimental replicates. See also Figure S2, Figure S4, and Table S6.
Each GH32-containing fragment enabled growth on sucrose, which commensal E. coli, including EcN, are unable to consume (Conway and Cohen, 2015) [Figure 2a]. Several GH32-containing fragments enabled growth on longer-chain oligosaccharides containing sucrose as a terminal moiety, including raffinose and stachyose [Figure 2a]. The growth rate of EcN strains containing two different GH32-encoding fragments (MD02 and MD05) was higher on these longer-chain oligosaccharides than sucrose (MD02: 0.04 h−1 on sucrose vs 0.208 h−1 on raffinose (p = 0.0017, t-test, two tailed, unequal variances) and 0.144 h−1 on stachyose (p = 0.011); MD05: 0.028 h−1 on sucrose vs 0.252 h−1 on raffinose (p = 8.8 × 10⁻⁵) and 0.153 h−1 (p = 0.00073) on stachyose), indicating specialization toward these molecules. We hypothesized that GH32 activity by an EcN subpopulation would release sugars upon which the rest of the EcN population can cross-feed. To test this, we grew WT EcN on raffinose minimal media pre-conditioned by EcN strains expressing recovered GH32 enzymes, or by WT EcN. We found WT EcN could only grow on media pre-conditioned by the EcN strains expressing GH32-encoding inserts [Figure 2d], indicating that these strains can support cross-feeding within the EcN population.
The remaining fragment (MD04), which did not encode GH32, encoded a transcription factor which was identical (100% nucleotide identity) to the gadX gene in EcN, and also contained the native gadX promoter. GadX plays an important role in acid tolerance by regulating the expression of the gad operon, whose combined activity generates a cycle that reduces cytosolic H+ (Tramonti et al., 2002). Presence of MD04 enabled EcN to recover more rapidly than WT from a 30-minute exposure to acidic conditions (pH 2.5) [Figure 2c]. Also, expression of this fragment in EcN uniquely increased cell density at 24 hours after switching from LB to minimal media with galactose, a mucin component, as the sole carbon source (Tailford et al., 2015) [Figure 2a]. At high extracellular concentrations, galactose is imported into E. coli by a low-affinity galactose permease (GalP), which is a proton symporter (Weickert and Adhya, 1993). Overexpression of gadX may therefore also mitigate an increase in cytosolic pH in galactose minimal media. Together with Gene Ontology (GO) annotation of the genes contained within recovered fragments [Figure 3a], these results indicated that the dominant selective pressure on EcN in the mono-colonized mouse gut is limited carbon source availability.
Figure 3. Comparison of functions enriched in functional selections in mice with different gut microbiome complexities.

A) Heatmap of the relative abundances of GO classifications present in EcN mono-colonized mice and mice pre-colonized with a 13-member defined community at the end of the selection period. Dendrograms represent the clustering applied to group similar rows/columns of the heatmap. B) Growth curves of EcN strains harboring metagenomic inserts shown in D on gluconate minimal media, or (C) glucose. N = 6 experimental replicates, error bars represent one standard deviation above and below the mean. D) Annotations of the metagenomic fragments characterized in B-C. See also Figure S2, S4–S5, and Table S6.
Diet-dependent selection
Because we found strong selection for expanded carbohydrate utilization in the previous experiment, we hypothesized that polysaccharide-specific enrichment of DNA inserts would occur in response to dietary prebiotics. To test this hypothesis, we delivered the EcN library to 3 groups of 5 germ-free mice. All mice were maintained on a high-fat, high-carbohydrate diet which mimics the diet of Western humans (HD) (Plump et al., 1992). One group of mice consumed HD alone, while the other two were supplemented with the prebiotics inulin or dextrin in the drinking water. Inulin is not degradable by WT EcN, while dextrin can support limited EcN growth (Fabich et al., 2008) [Figure S4]. Over 5 weeks, we again observed convergence toward ≤6 metagenomic fragments in each dietary condition [Figure 1c–1e]. Supporting our diet-dependency hypothesis, the collection of enriched fragments in each condition was different. However, one fragment was enriched in all three groups (HD04). Among enriched fragments, HD04 alone contained a gene encoding a GH32 enzyme, replicating our prior observations. Indeed, this fragment enabled EcN to consume sucrose and a water-soluble extract of HD, possibly due to the high amount of sucrose (341 g/kg) it contains [Figure 2a].
We classified ORFs in each enriched fragment into GO Pathways [Figure 3a]. We observed strong clustering of ORF annotation based on prebiotic supplementation. Reflecting the ubiquity of fragment HD04, “Carbohydrate Metabolic Process” was abundant (>23%) in all samples. In the presence of dextrin, we also observed “Pyrimidine Nucleotide Biosynthetic Process”, reflecting a predicted glutamate synthase. In the presence of inulin, the major fragment (reaching 32–67% relative abundance in all mice at the end of the experiment) contained a gene encoding a predicted “ATPase-coupled sulfate transmembrane transporter”. In the absence of prebiotic, the dominant fragment was HD04. No fragment besides HD04 enabled increased growth on dextrin or inulin, or on HD extract broth. We conclude that in these mice the dominant selective pressure remained the ability to degrade long-chain polysaccharides, but that once this function was fulfilled by a subpopulation of GH32-carrying EcN, secondary functions were enriched in a diet-specific manner.
Advantageous functions in a simplified microbial community.
Based on these results, we hypothesized that in the presence of polysaccharide-degrading taxa, non-polysaccharide degrading functions would be advantageous to EcN. To test this hypothesis, 8 germ-free C57BL/6 mice were colonized with 13 human gut-derived bacteria which model phylogenetic makeup of the human microbiome (Goodman et al., 2011) [Table S4], after which the EcN library was delivered and allowed to colonize for 5 weeks. 16S rRNA sequencing revealed that EcN colonized these mice at an average relative abundance of 15.3% [Figure S5]. Sequencing revealed a high diversity of enriched functions relative to the mono-colonization experiments. While no individual fragment reached a high abundance (>20%) in all mice in the same experimental treatment, we did observe functional convergence. As in prior experiments, the GO term “Carbohydrate Metabolic Process” was consistently recovered across the majority of replicates. We also observed condition-specific enrichment for “Gluconate Metabolic Process”, reflecting a E. coli transcriptional regulator (gntR) which achieved >7.6% abundance in mice containing the 13-member defined community [Figure 3a,d]. We hypothesized that these fragments altered the ability of EcN to metabolize gluconate. When these fragments were introduced to un-adapted EcN, the recombinant strain was no longer able to grow on minimal media containing gluconate as the sole carbon source, yet maintained its growth on glucose [Figure 3b,c], consistent with strong overexpression of gntR. Gluconate utilization has been shown to be necessary for E. coli to colonize the conventional or streptomycin-treated mouse gut (Chang et al., 2004; Sweeney et al., 1996a), so the recovery of fragments abolishing gluconate utilization could indicate an environment-specific benefit to gluconate use.
Together, these data indicated that the primary selective pressures faced by EcN in the low-diversity mammalian gut are related to carbon source limitation, and that once other taxa were introduced this selective pressure was removed. The presence of a strong constitutive promoter in our cloning vector did not bias ORF orientation. Rather, across all experiments and all recovered fragments, full-length ORFs in the same orientation as the promoter accounted for only 47.0% of full-length ORFs. We were intrigued by the recovery of E. coli genes in our selections (gadX and gntR). Based on this observation, we asked what genomic changes EcN undergoes after in vivo passage.
Within-genome evolutionary change
We next performed whole-genome sequencing on 401 EcN isolates collected from mice with four levels of microbiota complexity: mono-colonized with EcN, colonized with a defined community, streptomycin treated, or conventional. Mice from each of these conditions were either fed MD, HD, or HD+dextrin [Figure S2, Tables S1–S3]. We observed 456 total (336 unique) genomic changes across 171 genes [Figure 4, Figure S6b] relative to a high-quality closed assembly for WT EcN we generated. The most highly-mutated strain had 5 SNPs, while the average strain had 0.86 SNPs/genome. From longitudinal sampling of 2 mice fed a human diet and treated with streptomycin prior to EcN gavage, we estimate the mutation rate of EcN in the mouse gut to be 0.007 (± 0.002) SNPs/genome/generation [Figure S6a], assuming an in vivo generation time of 100 minutes (Rang et al., 1999), which is in broad agreement with that obtained for E. coli grown in vitro in the absence of antibiotic exposure: 0.001 SNPs/genome/generation (Lee et al., 2012). As evidence for consistent in vivo selective pressures, we observed multiple instances of SNP accumulation in the same gene in isolates from separately caged mice.
Figure 4. Summary of mutations detected in in vivo adapted EcN isolates.

The EcN chromosome, its 2 native plasmids pMut1 and pMut2, and the expression vector pZE21 are depicted in a Circos plot. Light gray regions are scaled 100x that of the rest of the chromosome for visibility. Genes of interest (orange) are labelled around the plot. The outer track depicts all detected intergenic (orange) and nonsynonymous (green) SNPs. The next track depicts all small insertions (blue) and deletions (red). The third tack depicts all large deletions > 1kb (shaded purple). The inner track depicts the number of isolates that contained each mutation. Mutations found in only one isolate are excluded the inner track for visibility. Isolate counts for each mutation are capped at 25, which only affects the rsmG mutants, (167). See also Figure S6 and Tables S3, S5–S7.
Adaptations involving nutrient utilization.
We found 10 different mutations to nagC in 19 isolates [Figure 5a]. These isolates were from 5 monocolonized mice used in the functional metagenomic selections. All mutations resulted in either a premature stop codon, elimination of the start codon, or a frameshift. NagC is a repressor of utilization of the mucin component N-acetylglucosamine (GlcNAc) (Tailford et al., 2015). We hypothesized that NagC inactivation would enhance the ability of EcN to consume GlcNAc. To test this hypothesis, three isolates with mutations to nagC were cured of their metagenomic vector (which encoded either gadX or GH32). We performed in vitro diauxic growth experiments and found that while these plasmid-cured nagC mutants grew similarly to WT EcN on glucose or GlcNAc minimal media, they were able to grow better on GlcNAc under glucose-limiting conditions [Figure 5b]. In porcine mucin minimal media under glucose-limiting conditions, the mutants had diauxic growth profiles that differed from WT, but these differences were not statistically significant [Figure S7a]. NagC mutants were exclusively isolated from mice mono-colonized with EcN populations expressing GH32 enzymes; mutations enhancing growth on a less-preferred carbon source may be due to a low diversity of polysaccharide degradation functions present and a concomitant carbon source limitation in the gut. It has also been found that nagC is mutated during adaptation to osmotic stress (Winkler et al., 2014), which may provide EcN an advantage during transit through the GI tract.
Figure 5. Phylogenies and phenotypic effects of nagC and gntT mutations.

Maximum parsimony gene phylogenies for adapted isolates based on their nucleotide sequences for A) nagC and C) gntT. The length of the branches corresponds to the number of SNPs separating the isolate gene sequence from the reference sequence. Color tracks depict the treatment conditions and the Mouse IDs from which isolates were isolated. The prefix of each Mouse ID indicates the cage in which the mouse was housed. B) Growth curves of nagC mutants on 0.4% glucose minimal media (left), 0.4% GlcNAc minimal media (middle), and 0.2% GlcNAc and 0.2% glucose minimal media (right). N = 3 experimental replicates per strain, * P < 0.05, Welch’s t-tests comparing the K parameter of logistic growth models fit to the data for WT or the mutant isolates, with Benjamini-Hochberg correction for multiple comparisons. D) Growth curves of gntT or gntT/nagC double mutants on gluconate (left), GlcNAc (middle), or porcine gastric mucin minimal media (right). ‘fs’: frameshift mutation S197T. * P < 1×10⁻⁵, Welch’s t-tests comparing the empirical areas under the curves for WT and the mutant isolates, Bonferroni correction for multiple comparisons. E) Growth curves of EcN transformed with plasmid-borne gntR-containing inserts from the functional metagenomic selections in 1.5% porcine gastric mucin (left, middle, 2 independent experiments), or in 20 mM GlcNAc minimal media (right). N = 4–6 experimental replicates per strain, *P < 0.05, Welch’s t-tests comparing the empirical areas under the curves for WT and the mutant isolates, Benjamini-Hochberg correction for multiple comparisons. F) gntT mutants were grown in 20 mM glucose (top) or 20 mM GlcNAc (bottom) minimal media supplemented with indicated gluconate. G) Summary of F, showing the areas under the growth curves (AUC) and the K parameter of logistic growth models fit to the data. N = 2–4 experimental replicates per strain, * P < 0.05, Welch’s t-tests, Benjamini-Hochberg correction for multiple comparisons. Black stars indicate both Isolates 3 and 21 had a significantly greater value than WT at a given gluconate concentration. Blue – only Isolate 3. Red – only Isolate 21. For all panels, K and AUC values were calculated using the growthcurver R package. Error bars and shaded regions represent one standard deviation above and below the mean. See also Figure S7.
GntT was found to be mutated in 6 different ways across 21 strains isolated from five different mice, including 2 isolates with >10kb deletions containing this gene [Figures 4, 5c]. The 4 other mutation types included 3 early stop codons and a D395N mutation. GntT encodes a high-affinity gluconate transporter (Porco et al., 1997). GntT mutants were significantly enriched in mice that had been pre-colonized with a 13-member defined community (p = 1.06×10⁻⁶, hypergeometric test), although gntT mutants were also observed in EcN-monocolonized mice [Figure 5c]. We hypothesized that gntT mutants would have an impaired ability to utilize gluconate, and so we tested the growth of two representative isolates in gluconate minimal media: Isolate 21 (gntT D395N) and Isolate 3 (gntT/nagC double mutant). Isolate 3 was unable to grow before 20 hours, and Isolate 21 had significantly impaired growth [Figure 5d]. Although this was the same phenotype conferred by the gntR-encoding fragments we recovered, we did not observe any mutations in gntR or in its surrounding intergenic regions in our isolate genomes.
Since we recovered inactivation of gluconate metabolism in independent experiments that spanned mouse litters, cages, and years, we investigated further. Surprisingly, we discovered that Isolate 3 and 21 grew better than WT on GlcNAc minimal media. Further, both grew better on porcine gastric mucin minimal media [Figure 5d]. These results were unexpected as there is no apparent regulatory or metabolic link between gluconate and GlcNAc utilization. Interestingly, we found that WT EcN transformed with gntR-containing fragments were able to grow better than WT on porcine gastric mucin minimal media [Figure 5E], yet were not able to grow better than WT on GlcNAc minimal media. GntR is a negative repressor of GntT; the data suggest repression of the entire Gnt-I gluconate utilization system, but not inactivation or inhibition of GntT alone, precludes enhanced consumption of GlcNAc. Both adaptations, however, enhance growth on mucin.
A metabolite in the Entner-Duodoroff pathway responsible for gluconate metabolism, 2-keto-3-deoxy-6-phosphogluconate, is toxic to E. coli (Sweeney et al., 1996b). We hypothesized that in the low-diversity, carbon-limited mouse gut where all gluconate utilization fragments or mutants were identified, increased degradation of the mucin layer increased local gluconate concentration, leading to toxicity. We found that in glucose minimal media, growth profiles of gntT mutants remained the same across gluconate concentrations of 0.5–8 mM while growth of WT EcN progressively declined [Figure 5f,g]. However, in GlcNAc minimal media these dynamics changed. The growth profiles of Isolate 3 (gntT/nagC) and WT were similar, whereas Isolate 21 (gntT) had significantly improved growth at 1 mM gluconate but approached the other strains at higher gluconate concentrations [Figure 5f,g]. The D395N mutation (present in Isolate 21) was common among gntT mutants, with 11/21 isolates from 3 separately caged mice hosting this mutation, suggesting this mutation offered a greater fitness advantage. Indeed, when grown on porcine gastric mucin minimal media, Isolate 21 consistently outperformed Isolate 3 and WT, although all strains responded similarly to increasing gluconate concentrations [Figure S7b]. Notably, both WT and Isolate 3 exhibited two growth stages (suggesting diauxic growth) on porcine gastric mucin minimal media while Isolate 21 did not. Together, these data suggest that there is a link between gluconate and GlcNAc utilization in EcN, and that inhibited gluconate utilization is advantageous when mucin components are the primary carbon source.
Adaptations involved in stress response
sgrR was mutated 4 different ways in 7 isolates from 2 mice [Figure 6c]. These mutations were nonsynonymous and did not result in a stop codon. All strains were isolated in the context of a very low diversity microbiome. Under conditions of excess sugar phosphates, SgrR is necessary to protect the cell from stress (Vanderpool and Gottesman, 2007). It is possible that in the low-diversity gut, lack of the preferred substrate glucose resulted in cytosolic accumulation of phosphates of less efficiently metabolized sugars, such as GlcNAc-6-P or gluconate-6-P. Additionally, rssB was mutated 4 different ways in 9 strains. Strikingly, all were frameshift mutations. RssB regulates RpoS expression by directing it to the ClpX protease. RssB mutants display elevated RpoS levels (Battesti et al., 2011). RpoS is a master regulator of the stress response in E. coli, and rpoS mutants show enhanced resistance to stress (Fontaine et al., 2008).
Figure 6. Phylogenies and phenotypic effects of kfiB, sgrR, and rsmG mutations.

Maximum parsimony gene phylogenies for adapted isolates based on their nucleotide sequences for A) kfiB, C) sgrR, and D) rsmG, as in Figure 5 B) Percentages of kfiB mutant cells adherent to Caco-2 (left) or HT29-MTX (right) monolayers after 3 washes. Shown are the means of ratios of adherent CFU to total CFU counts (N = 3 experimental replicates). Error bars are one standard deviation above and below the mean. * P < 0.05, ** P < 0.001, Welch’s t-test with Benjamini-Hochberg correction for multiple comparisons.
Adaptation in membrane-associated functions
kfiB was mutated in 24 strains from 4 mice, each with the same loss of an early stop codon at amino acid 366, resulting in a full-length protein of 562 amino acids [Figure 6a]. This potential gain-of-function variant was significantly enriched in mice that were pre-colonized with a defined community (p=3.01×10⁻¹⁵, hypergeometric test). kfiB is a member of the K5 capsule polysaccharide (heparosan) biosynthesis cluster, which has been implicated in mediating the interaction between EcN and epithelial cells (Hafez et al., 2010; Leroux and Priem, 2016). We hypothesized that our kfiB variants would exhibit altered adhesion to human epithelial cells. To test this hypothesis, we carried out an adhesion assay with 3 representative kfiB mutants and either Caco-2 or HT29-MTX cell monolayers. HT29-MTX cells produce MUC3, a membrane-bound mucin found throughout the gastrointestinal tract (Tailford et al., 2015). We found that the kfiB mutation provided significantly enhanced adhesion to Caco-2 and HT29-MTX cells [Figure 6b]. This loss of truncation may reflect re-adaptation of our reference EcN strain, which likely has been passaged often under laboratory conditions, to in vivo conditions.
Antibiotic resistance mutations
In streptomycin-treated mice, we observed that the majority of isolates (167/204) contained mutations in rsmG, which encodes a 16S rRNA methyltransferase [Figure 6d]. The three positions we identified with mutations (53, 71, and 79) were also mutated in prior work to give low-level streptomycin resistance (Benitez-Paez et al., 2012). We also observed 2 mutations to rpsL in 11 strains. All mutations occurred at residue 86 and converted it to a cysteine or serine. These mutations only occurred in streptomycin-treated mice, and 10/11 times occurred in conjunction with a mutation in rsmG. Residue 86 is adjacent to residues that have been mutated previously to provide streptomycin resistance to EcN (Timms et al., 1992). These streptomycin-resistant genotypes were preserved 5 weeks after streptomycin exposure, suggesting that this resistance did not carry a fitness trade-off. These results could indicate residual streptomycin present in the mouse gut, and are highly relevant considering the common practice of administering probiotics and fecal microbiota transplants after antibiotic administration (Hempel et al., 2012; Koenigsknecht and Young, 2013).
No in vivo plasmid acquisition
We searched our genome assemblies for sequences that did not map to the EcN genome. Interestingly, we did not observe acquisition of new sequences. The cause for this may be that EcN contains two endogenous plasmids (Grozdanov et al., 2004) in addition to the cloning vector we used for this study, which may pose a barrier due to plasmid incompatibility groups or other defense mechanisms. In agreement with these results, E. coli Nissle has been shown to be a poor recipient of horizontally-transferred DNA (Sonnenborn and Schulze, 2009).
In vivo excision of large genomic sections
In total, we observed 8 deletions larger than 1kb in size in 7 isolates. Two of these large deletions (24.3kb and 15.5kb in size) encompassed gntT. While EcN contains 5 putative phage regions (Arndt et al., 2016) [Table S5], only one (11.5kb) was observed to be excised. 3 deletions (23.3kb, 25kb, and 93kb in size) contained inverted repeat sequences, transposase, or integrase sequences. Copy number variation analysis indicated that multiple isolates from the same mouse exhibited copy number increases in two hypothetical proteins; a BLAST search revealed that these hypothetical proteins align significantly to an integrase and an inovirus Gp2 family protein. Together, these results indicate that large deletions or duplications occur in the EcN genome at low but significant rates during gut colonization, partially mediated by phage and transposon activity.
PKU treatment by engineered EcN
PAH-deficient PKU creates a blockage in the tyrosine synthetic pathway leading to Phe accumulation in tissues, which can be neurotoxic and impair cognitive development. As a model for an engineered probiotic therapy, we expressed PAL2 from Arabidopsis thaliana in EcN (McKenna and Nielsen, 2011) under the control of a weak, medium, or strong synthetic promoter (Anderson, 2006). The rationale for using different promoters is the sexual dimorphism exhibited in the Pahenu2 mouse model, where females show higher serum Phe than males (Sarkissian et al., 2008). These expression cassettes were placed on a high copy plasmid and transformed into EcN. As expected, the weak promoter drove slower Phe consumption in vitro than the medium or strong promoters [Figure 7a].
Figure 7. In vitro and in vivo degradation of phenylalanine by EcN:PAL2.

A) Phenylalanine concentration over time in minimal media supplemented with glucose and 10 μM Phe, and inoculated with EcN expressing PAL2 under promoters of indicated strength. Shown are the mean of three experimental replicates. Error bars represent one standard deviation above and below the mean. * P < 0.01, Welch’s t-test with Bonferroni correction for multiple comparisons. B-C) Paired serum phe concentrations for male (B) and female (C) homozygous mutant Pahenu2 mice before and 24 hours after gavage with WT EcN or EcN expressing PAL2 under a high or low strength promoter. Shown are means and standard deviations for three replicate mice. *** P < 0.0001, ** P < 0.01; P-values were calculated using the generalized linear hypothesis test with Bonferroni correction (glht function from the multcomp R package) on the coefficient estimates from a linear mixed-effects model generated by regressing Phe measurements on an interaction factor comprised of mouse gender, measurement timepoint (before or after treatment), and treatment (lme function from the nlme R package). Random intercepts by mouse were specified in the model. The model accounts for repeat measures variability.
In vivo, male PKU mice treated with EcN expressing PAL2 with a strong promoter, and female mice treated with strains harboring either the strong or weak promoters, saw significant reductions in serum Phe concentrations 24 hours after probiotic gavage [Figure 7b,c]. In male mice, serum Phe levels were reduced to half of their baseline levels by the strongly-expressing probiotic [Figure 7b]. As expected, we observed differences in efficacy among male and female mice [Figure 7c], and between the weak and strong promoters. No serum Phe reductions were observed after 1 week. We recovered isolates containing the PAL gene from feces one week after delivery, and did not observe any mutations to PAL2. Only 1/16 strains accrued genomic changes, corresponding with an estimated mutation rate of 0.001 SNPs/genome/generation. The two SNPs we observed in this strain were 1) a nonsynonymous mutation in the endoribonuclease ybeY and 2) a nonsense mutation in 4-alpha-glucanotransferase malQ. No other isolate sequenced during this study had mutations in these genes. Given the low frequency of the recovered mutations, our data did not support the hypothesis that PAL2 expression confers a significant selective pressure to EcN in the PKU gut.
Discussion
Unlike conventional abiotic therapeutics, the performance characteristics of probiotics can vary during treatment in response to natural selection. While probiotics have been broadly used in humans for decades, engineering probiotics for therapeutic applications in humans will only be acceptable if it is demonstrated that probiotics exhibit long-term safety. This study represents a necessary first step towards this aim and takes advantage of strictly controlled mouse models. We have demonstrated that in the context of low microbiome diversity, the greatest selective pressure on EcN is carbon source limitation. In this context, we also observed consistent inactivation of gluconate metabolism, and report evidence of a possible link between metabolism of gluconate and GlcNAc. Our observation of mutations in stress response pathways in low-diversity guts suggest that low gut diversity, known to be pathologic to the host (Lane et al., 2017), can also subject the present bacteria to stress which might exacerbate genomic instability. As a gut commensal we found the lowest evidence of selection in a high diversity microbiome, but as a probiotic and a chassis for engineered therapies we can expect future clinical use of EcN to occur in the context of dysbiosis. Future work should therefore include a systematic assessment of probiotic efficacy and adverse effects in relationship to personalized microbiome features prior to treatment. These results collectively indicate that EcN defines its gut niche through metabolic competition, painting EcN as not an opportunistically offensive player, but instead as a scavenger and survivalist.
In the context of engineered PAL activity in PKU mice, we achieved up to 50% reduction in serum Phe levels, depending on strain design and the extent of hyperphenylalaninemia, indicating the opportunity for personalized engineered probiotic therapies. We were unable to observe significant changes to the genome or plasmids of our engineered probiotic over one week of treatment, supporting EcN’s suitability as a chassis for engineered therapies. Coupled with continued development of biocontainment approaches (Chan et al., 2016), we envision the experiments described herein as a general pipeline to be applied to other probiotic strains in development, in the context of diverse healthy and dysbiotic microbiomes and other in vivo habitats to better understand their safety and engineering potential. The major selective pressures operating on any engineered probiotic may be substantially different than their WT counterparts and would warrant further study of their in vivo evolutionary trajectories. As such, this work presents a generalizable framework for developing and regulating living therapeutics.
STAR Methods
Contact for reagent and resource sharing
Further information and requests for resources and reagents should be directed to and will be fulfilled by the Lead Contact, Gautam Dantas (dantas@wustl.edu).
Experimental Model and Subject Details
Microbial Strains
E. coli Nissle was obtained as a kind gift from Dr. Phillip I. Tarr (Washington University in St. Louis School of Medicine) and authenticated via whole-genome sequencing. Unless otherwise indicated, EcN was grown in LB media under aerobic conditions at 37 °C. Agar was added at a concentration of 15 g/L for growth on solid media. For maintenance of the pZE21 plasmid (Lutz and Bujard, 1997) and its derivatives, kanamycin was added to a final concentration of 50 μg/mL after autoclaving.
Thirteen strains that were selected to mimic a healthy human microbiota composition were obtained as a kind gift from Dr. Andrew Goodman (Yale University) (Supplementary Table 4) and authenticated via sequencing of the 16S region. Strains were cultured in TYG medium supplemented with D-(+)-Cellobiose (0.1% w/v; Sigma), D-(+)-Maltose (0.1% w/v; Sigma), D-(−)-Fructose (0.1% w/v; Sigma), Tween 80 (0.05% v/v; Sigma), Meat Extract (0.5% w/v; Sigma), ATCC Trace Mineral Supplement (1% v/v), ATCC Vitamin Supplement (1% v/v), N-butyric acid (4mM), propionic acid (8mM), isovaleric acid (1mM), and acetic acid (30mM) as in Goodman et. al. (Goodman et al., 2009), referred to as Mega Medium. Culturing occurred under anaerobic conditions in a soft-sided plastic anaerobic chamber (Coy Laboratory Products). Stocks of strains were stored in E-Z crimp top vials (Wheaton) at −80°C in Mega Medium with 20% glycerol. Stocks were titered by plating on BHI blood agar plates. Strains were pooled immediately prior to gavage such that each member was equally represented, and washed 3x in PBS. Eubacterium rectale and Ruminococcus torques displayed poor recovery rates from freezer stocks, so overnight cultures at early stationary phase were included in the final pool in lieu of stocks. Mice were gavaged with a total dose of 1×10⁸ CFU in a volume of 200 μL.
Mice
All mouse experiments were approved by the Washington University in Saint Louis School of Medicine Division of Comparative Medicine.
E. coli Nissle monocolonization experiments were performed in germ-free C57BL/6 mice (University of Michigan). Upon arrival, mice were provided food and water ad libitum for one week prior to colonization. Mouse experiments were not blinded. For the mouse chow experiment, mice were provided autoclaved feed (Purina Conventional Mouse Diet (JL Rat/Mouse 6F Auto) #5K67) and autoclaved water. Human diet consisted of Envigo TD.88137, irradiated and vacuum-sealed. Inulin or Dextrin (Sigma) was provided in the drinking water at a concentration of 20 g/L, and autoclaved. 6 (for the mouse chow experiment) or 5 (for the Human Diet experiment) co-housed male mice were exposed to 108 colony forming units of E. coli Nissle via oral gavage of 100 μL cell suspension in phosphate buffered saline on day 1 of the experiment. Feces were collected at weekly intervals and immediately frozen at −80 °C. At the end of the experiment, mice were sacrificed through carbon dioxide asphyxiation and cecal contents were collected.
Experiments involving the 13-member synthetic microbiota were also performed in 3–5 week old germ-free C57BL/6 mice (University of Pennsylvania Gnotobiotic Mouse Facility). Upon arrival, 3 germ-free mice (1–2 male, 1–2 female) per condition (monocolonized + human diet, 13-member + human diet, 13-member + human diet + dextrin, 13-member + human diet + inulin) were housed separately in germ-free isolators. Mice were acclimated to their diet for one week prior to colonization with the synthetic microbiota. The synthetic microbiota was allowed to stabilize for one week prior to delivery of 108 colony forming units of E. coli Nissle via oral gavage of 100 μL cell suspension in phosphate buffered saline on day 1 of the experiment. Fecal samples were subsequently collected weekly for 5 weeks, and immediately frozen at −80 °C. At the end of the experiment, mice were sacrificed through carbon dioxide asphyxiation and cecal contents were collected.
Experiments involving the conventional mouse microbiota were performed in a specific-pathogen-free facility with mice 3–5 weeks of age. 2 cages of 5 mice (Jackson Labs C57BL/6J (RRID:IMSR_JAX:000664)) for each condition were maintained on the Human Diet with or without prebiotic for one week after arrival. After one week, mice were deprived of food and water for 4h, and given either 20mg streptomycin in 100 μL water, or 100 μL water alone via oral gavage. After this treatment, food and water was immediately returned. Daily over the next three days, 108 CFU of EcN was delivered in 100 μL PBS via oral gavage. Fecal samples and intestinal contents were collected as above.
Experiments involving PKU mice (C57BL/6 mice homozygous for the Pahenu2 mutation) were performed in a specific-pathogen-free mouse facility. For each condition (High PAL expression, Low PAL expression, or No PAL expression), 3 Male and 3 Female PKU mice (10–12 weeks of age, Washington University in St. Louis) were co-housed by gender and condition and maintained on Phe-containing mouse chow (18 mice total from 5 different litters). 100 μL blood was sampled from the femoral artery one week before the experiment to serve as a baseline for each mouse. Then, 109 CFU of the appropriate EcN strain was delivered via oral gavage. One day after gavage, 100 μL blood was again sampled from the femoral artery. Fecal samples were collected 1 week after gavage. After collection, all blood samples were allowed to coagulate then centrifuged in BD Microtainer ® SST ™ tubes for 2 minutes at 10,000g to collect serum. Serum samples were then passed through 10 kDA molecular weight cut-off filters by centrifugation. Phe levels of the filtrates were determined using a Phenylalanine Assay Kit (MAK005, Sigma-Aldrich).
For assessment of in vivo plasmid loss, 10 male C57BL/6J (RRID:IMSR_JAX:000664) mice 3–5 weeks of age housed in two separate cages were deprived of food and water for 4h and given 20 mg streptomycin in 100 μL water as above. Daily over the next three days, 108 CFU of EcN containing the pZE21 vector was delivered in 100 μL PBS via oral gavage. Fecal pellets were collected on the final day of gavage and weekly for 5 weeks. Pellets were weighed and then homogenized in 300 μL PBS on a bench-top vortexer. Dilutions were plated in parallel on MacConkey agar and LB agar with 50 ug/mL kanamycin and incubated overnight at 37 C, with the prior selecting for aerobic lactose fermenters and the latter selecting for EcN containing the pZE21 vector. CFUs/mg feces were estimated for each sample after colony enumeration. The colonies enumerated on the MacConkey agar plates were confirmed to be EcN by colony PCR of the chromosomally integrated GFP locus. A LOESS regression was applied to the longitudinal data for each selective agar.
Cell lines
Caco-2 or HT29-MTX cells were seeded overnight in a 24-well plate at 50,000 cells/cm2 in DMEM-HEPES media supplemented with Glutamax (10564–011, ThermoFisher) and 10% Fetal Bovine Serum. They were incubated at 37 °C, 5.0% CO2 and 90% relative humidity. Caco-2 cells (ATCC HTB-37) were derived from a human male, and HT29-MTX cells (Sigma Aldrich 12040401) were derived from a human female. The cell lines were authenticated by the commercial vendors.
Method details
Plasmids used in this study
All plasmids used in this study were constructed using a Golden Gate Assembly Mastermix from NEB, according to the manufacturer’s instructions. Plasmid pSPAL2At containing the PAL2 enzyme was obtained from Addgene (cat #78286), as a kind gift from David Nielsen (McKenna and Nielsen, 2011). Genbank files of all plasmids are provided in [Supplementary File 2].
Metagenomic library construction
Metagenomic libraries were sourced from a prior study examining the antibiotic resistome of the healthy maternal and infant microbiomes (Moore et al., 2015). Frozen glycerol stocks containing these libraries were thawed on ice, and plasmid DNA was extracted using a Qiagen Spin Miniprep kit. 100 ng of DNA was transformed into electrocompetent E. coli Nissle, and allowed to recover in SOC media for 1h at 37 °C. After 1h, 1 μL of SOC media was plated on LB+kan, to count transformants, and the remainder was placed in 50mL LB media containing kanamycin at room temperature overnight. After overnight growth, the library was centrifuged at 4000 rpm for 7 m, resuspended in 10mL LB+15% w/v glycerol, and frozen in 1mL aliquots at −80 °C. After freezing, one aliquot was thawed on ice, and serial dilutions were plated on LB+kan media to count viable cells. This procedure yielded a library containing 32.77 Gb of metagenomic DNA.
Functional metagenomic library sequencing
DNA was extracted from fecal samples and intestinal contents using the PowerSoil DNA extraction kit (MoBio/Qiagen). 10 ng of this DNA was used as a template for a multiplex PCR with primers 1–6 [Supplementary Table 6] at equimolar concentrations using Taq Reddymix (Fisher Scientific). PCR recipe per sample was as follows: 12.5 μL Taq Reddymix, 3 μL primer mix (10 μM total concentration), 10 ng template, nuclease free water to 25 μL. PCR protocol was as follows: 94 °C for 10 m, 94 °C for 45 s, 55 °C for 45 s, 72 °C for 5.5 m, go to step 2 24 times, 72 °C for 10 m, 4 °C forever. PCR products were purified using a Qiagen Spin PCR Purification Kit. 500 ng PCR products in 200 μL elution buffer (from purification kit) were then placed in an AB1900 half-skirted plate (Fisher Scientific) and sonicated using a Covaris E220 sonicator. The settings on the sonicator were as follows: Peak Incident Power: 140, Duty Cycle: 10%, Cycles per Burst: 200, Treatment Time: 600 s, Temp: 7 °C. Sonicated products were cleaned using a Qiagen MinElute PCR purification kit according to the manufacturer’s instructions, and eluted in 22 μL elution buffer. 20 μL sonicated products were end-repaired through addition of 2.5 μL DNA ligase buffer with 10 mM ATP (NEB), 1 μL 1 mM dNTP, 0.5 μL T4 Polymerase (NEB), 0.5 μL T4 PNK (NEB), and 0.5 μL Taq Polymerase (NEB), and incubating for 30 m at 25 °C, followed by 20 m at 75 °C. Then, 0.8 μL T4 DNA ligase (NEB) and 5 μL pre-annealed sequencing barcodes were added to the full end-repair reaction, followed by 40 m at 16 °C, and 10 m at 65 °C.
Sequencing barcodes were designed according to the template described in Primers 7–8 (Supplementary Table 6), and synthesized by IDT in 2 96-well plates to a concentration of 500 μM. Each barcode was designed to be at least 2 mismatches away from every other barcode. 2 μL of each primer pair were added to 96 μL of TES buffer (10mM Tris, 1mM EDTA, 50mM NaCl, pH 8.0), and this mixture was diluted 1:10 in TES buffer, to a final concentration of 1 μM. Adapters were annealed by incubating at 95 °C for 1 m, followed by slowly cooling (0.1 °C per second) to 4 °C. Annealed oligos were kept cold and transferred to a −20 °C freezer until use. Next, ligation products were size-selected to 300–400bp in size through gel electrophoresis. Briefly, the total ligation volume was loaded on a 2% (w/v) agarose gel in 0.5x TBE buffer using thin combs. This gel was run at 120V for 2h, or until the loading dye front reached ~2/3 of the way to the end of the gel. DNA fragments between 300 and 400bp were excised, and purified using the Qiagen MinElute Gel Extraction Kit, eluting in 15 μL elution buffer.
Sequencing adaptors were then added to the size-selected ligation products through PCR. PCR recipe was as follows: 12.5 μL Phusion HF Mastermix (ThermoFisher), 9.5 μL nuclease-free water, 1 μL 10 μM primer mix (Primers 9–10) and 2 μL gel-purified DNA. PCR conditions were as follows: 98 °C for 30 s, 98 °C for 10 s, 65 °C for 30 s, 72 °C for 30 s, return to step 2 17 times, 72 °C for 5 min, 4 °C forever. PCR products were then size-selected on a 2% agarose, 0.5x TBE gel as above. Sequencing libraries were quantified on a Qubit fluorimeter, and pooled at equimolar concentrations for sequencing. 100,000 2×150 paired-end sequencing reads were obtained per sample.
Functional metagenomic sequencing analysis
Functional metagenomic contigs were assembled from sequencing reads and annotated using PARFuMS (Boolchandani et al., 2017; Forsberg et al., 2012). For each experiment, contigs were clustered at 95% nucleotide identity using CD-HIT (Fu et al., 2012). Then, vector-trimmed sequencing reads (from PARFuMS) were uniquely mapped to each contig using bowtie2 (Langmead and Salzberg, 2012), and mapping reads were counted using SAMtools (Li, 2011). Contig abundance was estimated as the fraction of reads mapping to each contig. To perform Gene Ontology mapping, open reading frames (from PARFuMS) were mapped against all nonredundant protein sequences using BLASTp (Boratyn et al., 2012), and annotated using InterProScan (Jones et al., 2014). Outputs of these two operations were then used as input to Blast2GO, according to manufacturer’s instructions. Each contig was associated with a GO annotation if at least one of its constituent open reading frames was. The abundance of each GO annotation was then estimated as the sum of contig abundances associated with that GO annotation. Heatmaps of GO annotations were plotted using the heatmaply package in R.
16S rRNA sequencing and analysis
We performed sequencing of the variable region (V4) of the 16S rRNA gene on 7 longitudinal fecal samples from each of 17 mice (102 samples total). We used 515F/806R PCR primers including Illumina flowcell adapter sequences to amplify the V4 region using the Earth Microbiome Protocols (Caporaso et al., 2012) (described in more detail here: http://www.earthmicrobiome.org/ emp-standard-protocols/16s/ ).
The following 25 μL reaction was prepared in 96-well plates: 10 μL H20, 12.5 μL Taq Hot-Start DNA Polymerase (Takara R028A), 1 μL forward primer (10 uM), 1 μL reverse primer (10 uM), 0.5 μL template DNA (1 ng/uL). PCR cycle temperatures were as follows: 98 C for 30 s, then 35 cycles of [98 C for 10 s, 50 C for 30 s, 72 C for 30 s], then 72 C for 2 min. PCR reactions were carried out in triplicate for each reaction. In addition, a template-less control reaction was carried out for each primer pair. PCR products were assessed via gel electrophoresis to verify the amplicon size and absence of contamination, then were quantified using the PicoGreen kit (Invitrogen P11496), following the manufacturer’s protocols. 16S rRNA gene amplicons were sequenced by 2×250 bp paired-end sequencing on the Illumina MiSeq platform using custom primers (read 1: 5′-TAT GGT AAT TGT GTG CCA GCM GCC GCG GTA A-3′; read 2: 5′-AGT CAG TCA GCC GGA CTA CHV GGG TWT CTA AT-3′; and index: 5′-ATT AGA WAC CCB DGT AGT CCG GCT GAC TGA CT-3′) at a loading concentration of 8pM with 25% PhiX spike-in.
OTUs were generated using USEARCH7 (Edgar, 2010). Reads were demultiplexed by sample and read pairs merged (usearch -fastq_mergepairs -fastq_maxdiffs 0 -fastq_truncqual 3 -fastq_maxmergelen 258 -fastq_minmergelen 248). Merged reads were quality filtered (usearch -fastq_filter -fastq_maxee 0.5), dereplicated (usearch -derep_fulllength -sizeout), sorted and singletons removed (usearch –sortbysize –minsize 2), clustered (usearch –cluster_otus), and checked for chimeric sequences using the Gold database (usearch –uchime_ref –db gold.fa – strandplus –nonchimeras). OTUs were renamed (uparse/fasta_number.py), reads were mapped back to OTUs at 97% identity (usearch –usearch_global –strand both –id 0.97), and converted to the final OTU table (uparse/uc2otutab.py).
Taxonomy was assigned using the QIIME 1.9.0 (Caporaso et al., 2010) pipeline with the GreenGenes database. The OTU table was subsampled to 10,000 reads per sample (single_rarefaction.py).
Isolate sequencing
To isolate in vivo-adapted EcN isolates, intestinal contents or fecal samples were vortexed in phosphate-buffered saline and streaked on LB plates containing kanamycin. Single colonies were placed in liquid media and grown at 37 °C overnight. Un-adapted EcN strains were also grown overnight. Total DNA was extracted from each culture using the DNeasy UltraClean 96 Microbial kit (10196–4, Qiagen), and prepared for whole-genome sequencing using Nextera Tagmentation (Baym et al., 2015). Briefly, gDNA was brought to a concentration of 0.5 ng/μL in 1 μL volume. To each sample, 1.25 μL TD buffer, 0.125 μL TDE1 enzyme, and 0.125 μL nuclease-free water was added, and incubated at 55 °C for 15 m. Then, 11.2 μL KAPA HiFi master mix was added to each tagmented sample. Indexed sequencing adaptors (5 μM each) were thawed, and 8.8 μL was added to each sample. Then, PCR was performed using the following protocol: 72 °C for 3 m, 98 °C for 5 m, 98 °C for 10 s, 63 °C for 30 s, 72 °C for 30s, return to step 2 13 times, 72 °C for 5 m, 4 °C forever. PCR reactions were purified using AMPure XP beads according to the manufacturer’s protocol, and eluted in 60 μL resuspension buffer. Sequencing libraries were quantified using the Quant-iT PicoGreen dsDNA Assay Kit (Fisher Scientific), and pooled at equimolar concentrations for sequencing. 2 million 2×150bp sequencing reads were obtained per sample.
MinION sequencing
Genomic DNA from 30 mL of overnight culture of control EcN was extracted using a Genomic DNA Buffer Set (19060, Qiagen) with the Qiagen protocol for Gram-negative bacteria (Qiagen Genomic DNA Handbook 06/2015) and the Genomic-tip 500/G (10262, Qiagen). Purified genomic DNA was sheared to a target fragment size of 10 kilobases using the Covaris g-TUBE™. All following steps were carried out in Eppendorf DNA LoBind tubes. Sheared DNA was repaired using the NEBNext FFPE Repair Mix (M6630), and repaired DNA purified from the reaction using Agencourt AMPure XP beads. DNA was then end-repaired and dA-tailed using the NEBNext End repair / dA-tailing Module (E7546) and again purified with AMPure XP beads. DNA was then prepared for MinION sequencing using the MinION Ligation Sequencing Kit 1D (SQK-LSK108). Briefly, adapters were ligated to the DNA using the MinION Adapter Mix (AMX1D) and NEB Blunt/TA Ligase Master Mix (M0367). Then the DNA product was purified using AMPure XP beads and the Minion Adapter Bead Binding Buffer (ABB). 350 ng of DNA product was then sequenced on a MinION R9.4 flow cell for 48 hours using the Running Buffer with Fuel Mix (RBF) and the Library Loading Bead Kit (EXP-LLB001). Average read lengths were 7 kilobases and the genome was sequenced with an average coverage of 50 reads.
Isolate sequencing data analysis
Illumina sequencing reads were quality-filtered and adaptor-trimmed using Trimmomatic (Bolger et al., 2014). Isolate genomes were assembled with Illumina data using SPAdes (Bankevich et al., 2012). The control EcN genome (which had both Illumina and MinION data) was assembled using SPAdes in hybrid mode. Illumina reads were mapped to the assembled genome using bowtie2 and MinION reads were mapped using LAST (Frith and Noe, 2014). Mapping results were converted to indexed, sorted bam files using SAMtools and visualized using IGV (Thorvaldsdottir et al., 2013). The control EcN genome was then corrected manually by inspecting read alignments for dips in coverage, and correcting these regions using MinION data as well as homology to a published EcN genome (Reister et al., 2014) using an iterative process. After each iteration, Illumina and MinION reads were re-mapped to the corrected genome, and read alignments were inspected to verify an improved assembly. Coding sequences were annotated using Prokka (Seemann, 2014). One region of spurious assembly was due to imperfect tandem repeats present in the UpaH gene; this region was resolved by PCR amplification from the genome followed by Sanger sequencing. The result of this finishing process became the control genome to which all in vivo-adapted isolates were compared.
Mutation Calling
Single-nucleotide polymorphisms and indels were annotated using two complementary approaches. The first method was Breseq, using default parameters (Deatherage and Barrick, 2014). The second method was VarScan2, where SNPs and indels were called if supported by a minimum read coverage of 30 and 80% abundance in those reads (Koboldt et al., 2012). VarScan2 variant call format output was then annotated with ANNOVAR (Wang et al., 2010). Mutations called by each method were manually verified through visualization of Illumina read alignments using IGV. Anecdotally, both methods did recover some false positive mutation calls, primarily due to the presence of a homologous metagenomic DNA insert causing spurious read alignments to the EcN genome. Phage sequences were identified using the Phaster web server (Arndt et al., 2016). To look for potential plasmid sequences, assembled contigs for each isolate were aligned to 1) all nonredundant nucleotide sequences, and 2) the control EcN genome using BLASTn. Our criteria for plasmid sequences was the following: >500bp in length, <90% of bases mapping to the EcN genome, no homology to the functional metagenomic insert present in the strain (if any), and no obvious genomic contamination from other species. No contig satisfied these criteria, and therefore we concluded that no acquired plasmid sequences were obviously present in our in vivo adapted strains.
Annotation
To perform Gene Ontology mapping, mutated open reading frames were mapped against all nonredundant protein sequences using BLASTp, and annotated using InterProScan. Outputs of these two operations were then used as input to Blast2GO, according to manufacturer’s instructions. The abundance of each GO annotation was then estimated as the number of open mutated open reading frames with that annotation among the strains within a certain condition. Heatmaps of GO annotations were plotted using the heatmaply package in R.
Copy Number Variation
Copy number variation was assessed using the CNVkit pipeline (Talevich et al., 2016). Briefly, short reads for each isolate were mapped to an indexed reference assembly using bowtie2 with the --very-senstitive-local option to generate SAM files. SAM files were then converted to sorted BAM files using Samtools. Coverage was calculated in bins using the CNVkit coverage function and compared to the coverage of the reference strain using the CNVkit reference function with the --no-edge option. Biases were adjusted using the CNVkit fix and segment functions. CNV hits were called if the bias-adjusted log2 copy ratio was greater than 1.3 or less than −1.3.
Growth assays on functional metagenomic hits
Three biological replicates of EcN containing the appropriate plasmid were grown overnight in LB media containing kanamycin at 37 °C under anaerobic conditions. These were the overnight culture conditions for all growth assays unless otherwise indicated. The cell densities of these overnight cultures were measured, and EcN was transferred to M9 MOPS minimal media containing the carbon source of interest at a starting optical density of 0.01 in a 96-well plate. BIOLOG plates were prepared with M9-MOPS minimal media (Liu et al., 2015) per the manufacturer’s recommendations. A Breathe-Easy Sealing Membrane (Sigma) was placed over the plate. This plate was placed in a plate reader set to maintain 37 °C and read optical density (absorbance at 600 nm) every minute for 72h.
To test the acid tolerance of EcN strain MD04, overnight cultures of MD04 and WT EcN harboring the empty pzE21 plasmid were subcultured in LB broth pH 7.0 to an OD600 of approximately 0.4, then were washed with PBS and resuspended in either LB pH 7.0 or LB pH 2.5 (adjusted with HCl). The cultures were incubated at 37 °C for 30 minutes, then were washed again and resuspended in LB pH 7.0 and grown for 15 hours at 37 °C in a plate reader with optical density measured at 20 minute intervals.
To test whether EcN expressing glycosyl-hydrolase encoding fragments from the functional metagenomic selection can support growth of WT EcN, overnight cultures of EcN strains MD01, MD02, or WT EcN carrying empty pZE21 vector were subcultured in LB to an OD600 of 0.5, then washed three times with PBS and resuspended in 1% raffinose minimal M9-MOPS media. The cultures were incubated at 37 °C for 3 hours, then centrifuged at 6000g for 5 minutes. The supernatants were filter-sterilized using 0.2 μm filters. These pre-conditioned media, as well as unconditioned 1% raffinose minimal M9 media were inoculated with WT EcN and grown for 15 hours at 37 °C with optical density measured at 20 minute intervals.
To assess the ability of HD15 inserts to grow on mucin or GlcNAc, overnight cultures were normalized to an optical density of 0.1 in 1.5% porcine gastric mucin M9-MOPs minimal media or 20 mM GlcNAc M9-MOPs minimal media and incubated in a plate reader at 37 °C for 20 hours with optical density measured at 20 minute intervals. The assay in porcine gastric mucin M9-MOPs minimal media was repeated on separate days.
Growth assays on mutant isolates
NagC mutants were grown in standard or diauxic growth experiments. As before, overnight cultures were normalized to an optical density of 0.1 in 0.4% glucose, 0.4% GlcNAc, or 0.2% glucose / 0.2% GlcNAc M9-MOPS minimal media. Alternatively, overnight cultures were transferred to 0.2% glucose / 0.75% porcine gastric mucin M9-MOPS minimal media. The plates were set in a plate reader at 37 °C for 20 hours with optical density measured at 20 minute intervals.
Two representative gntT mutants were grown on 0.4% gluconate, 0.4% GlcNAc, or 1.5% porcine gastric mucin M9-MOPS minimal media. Overnight cultures were normalized in M9-MOPS minimal media supplemented with either of the three carbon sources at a starting optical density of 0.1 in a 96-well plate as before and incubated in a plate reader at 37 °C for 24 hours with optical density measured at 20 minute intervals.
For the gluconate sensitivity assays overnight cultures of the same gntT mutants were normalized as before in 20 mM glucose or 20 mM GlcNAc M9-MOPS minimal media supplemented with either 0.5, 1, 2, 4, or 8 mM gluconate and incubated in a plate reader at 37 °C for 20 hours with optical density measured at 20 minute intervals.
Epithelial cell binding assay
Overnight cultures of representative kfiB mutants or WT EcN were incubated in LB at 37 °C. The next day, wells with Caco-2 or HT29-MTX cells were inoculated with mutant or WT EcN that had been washed and resuspended in PBS. The multiplicity of infection was 1:100. The human and bacterial cells were co-incubated 37 °C, 5.0% CO2 and 90% relative humidity for 3 hours. Media was aspirated from each well. Three replicate wells for each strain were gently washed 3x with PBS, while three replicate wells for each strain were left untreated. All wells were then treated with 100 μL of 1% Triton-X for 10 minutes at room temperature to lyse the human cells. 900 μL LB was added to each well and the cells resuspended by pipetting. These cultures were diluted and plated on LB agar plates and incubated overnight at 37 °C. The next day CFUs were enumerated, and the percentage of adherent cells was calculated as the mean ratio of CFUs/mL from the washed and unwashed wells for each strain.
In vitro phenylalanine degradation assay
EcN strains expressing PAL2 in the pZE21 plasmid under promoters of low (p08), medium (p01), or high (p19) strength, or harboring only empty vector, were grown overnight in LB at 37 °C. The next day the optical densities (absorbance at 600nm) of these cultures were measured and the strains were transferred to M9 minimal media supplemented with 0.4% glucose and 20 μM L-phenylalanine with a starting optical density of 1.0. Fractions of these cultures were removed at 0, 30, 60, and 90 minutes and immediately centrifuged. Supernatants were passaged through 10 kDa molecular weight cut-off filters and the phenylalanine in the filtrates was measured using a Phenylalanine Assay Kit (MAK005, Sigma-Aldrich). Phenylalanine levels were reported as average absolute nanomoles of phenylalanine per well. Three technical replicates were carried out for each strain.
Gene phylogenies and enrichment testing
We searched for genes with variants significantly enriched in specific diet conditions or in specific microbiome complexities using the hypergeometric test for enrichment and Bonferroni correction for multiple hypothesis testing. The significant genes included gntT, nagC, sgrR, rsmG, and kfiB. Gene phylogenies were created for these genes by aligning the gene sequence for all isolates involved in the comparison in which the gene variants were found enriched in a condition (that is, all isolates along the axis of different diets, or the axis of microbiome complexity). Alignments were generated using Clustal Omega. Maximum parsimony phylogenies for each gene were generated using the Dnapars program included in PHYLIP 3.695 (Felsenstein, 2005), and visualized using iTOL (Letunic and Bork, 2016).
E. coli phylogeny construction
Representative E. coli genomes were downloaded from NCBI. PROKKA was used to generate general feature format (gff) files for each E. coli genome, including our assembled reference EcN genome (Seemann, 2014). Roary was used to generate a core gene alignment, using these gff files and the corresponding genome sequences (Page et al., 2015). The strain phylogeny was inferred with RaxML using the GTRGAMMA model and 1000 bootstraps (Stamatakis, 2014). The best tree was visualized using iTOL.
Analysis of selection
SgrR was analyzed for evidence of positive or negative selection. The previously generated gene alignment and phylogeny were provided as input to the aBSREL, MEME, and FUBAR modules included in the HyPhy application hosted by the Datamonkey webserver (Delport, 2010). Neither of the three modules reported evidence of selection.
Quantification and statistical analysis
All of the statistical details of experiments, including significance criteria, sample size, definition of center, and dispersion measures can be found in the figure legends and in the Results section. For all in vitro experiments involving synthetic DNA, n refers to the number of biological replicates of each strain (i.e. separate colonies) assayed per condition. For all in vitro experiments involving in vivo-adapted probiotic isolates, n refers to the number of technical replicates of each strain (i.e. same master stock). For mouse experiments, n refers to the number of mice in each group. All significance values were FDR-corrected as described. No sample size calculations were performed during the design of experiments. No samples were excluded. No blinding was performed.
Data and software availability
The raw reads for functional metagenomic selections have been deposited in NCBI under ID code PRJNA51754. Assembled contigs for functional metagenomic selections have been deposited in DDBJ/ENA/GenBank under the accession SHCT00000000. The version described in this paper is version SHCT01000000. The raw reads for all EcN isolates have been deposited in NCBI under ID code PRJNA517347. The assembled wild-type EcN genome has been deposited in NCBI under ID codes CP035486-CP035489. 16S rRNA sequencing for experiments involving the 13-member community have been deposited in NCBI under ID PRJNA517716.
Key resources table
See attached
Supplemental items
Data File 1 contains the raw data for EcN strains harboring empty vector, MD01-MD05, and HD04 on phenotypic microarray plates PM1 and PM2A. Related to Figure 2.
Data File 2 contains sequence files for all plasmids described in this study. Related to Figures 1, 2, and 7.
Supplementary Material
KEY RESOURCES TABLE
| REAGENT or RESOURCE | SOURCE | IDENTIFIER |
|---|---|---|
| Bacterial and Virus Strains | ||
| Escherichia coli Nissle 1917 | Dr. Phil Tarr | N/A |
| Escherichia coli DH10β (MegaX) | Invitrogen | Cat# C640003 |
| 13-member defined microbial community | Dr. Andrew Goodman | See Table S4 |
| Chemicals, Peptides, and Recombinant Proteins | ||
| Inulin | Sigma | Cat# I3754 |
| Dextrin | Sigma | Cat# D2006 |
| Glutamax | ThermoFisher | Cat# 10564–011 |
| Taq Reddymix | Fisher Scientific | Cat# AB0575DCLDB |
| T4 Polymerase | NEB | Cat# M0203S |
| T4 PNK | NEB | Cat# M0201S |
| Taq Polymerase | NEB | Cat# M0273S |
| T4 DNA Ligase | NEB | Cat# M0202S |
| Phusion HF Mastermix | ThermoFisher | Cat# F531S |
| Taq Hot-Start DNA Polymerase | Takara | Cat# R028A |
| Nextera XT Tagmentation reagents | Illumina | Cat# FC-131–1096 |
| Genomic DNA Buffer Set | Qiagen | Cat# 19060 |
| NEBNext FFPE Repair Mix | NEB | Cat# M6630 |
| NEBNext End repair / dA-tailing Module | NEB | Cat# E7546 |
| MinION Ligation Sequencing Kit 1D | Oxford Nanopore | Cat# SQK-LSK108 |
| MinION Adapter Mix | Oxford Nanopore | Cat# AMX1D |
| NEB Blunt/TA Ligase Master Mix | NEB | Cat# M0367 |
| Minion Adapter Bead Binding Buffer | Oxford Nanopore | Cat# ABB |
| Running Buffer with Fuel Mix | Oxford Nanopore | Cat# RBF |
| Library Loading Bead Kit | Oxford Nanopore | Cat# EXP-LLB001 |
| Critical Commercial Assays | ||
| Phenylalanine Assay Kit | Sigma | Cat# MAK005 |
| PowerSoil DNA Extraction Kit | Qiagen | Cat# 12955–4 |
| MinElute PCR Purification Kit | Qiagen | Cat# 28006 |
| MinElute Gel Extraction Kit | Qiagen | Cat# 28606 |
| PicoGreen kit | Invitrogen | Cat# P11496 |
| DNeasy UltraClean 96 Microbial kit | Qiagen | Cat# 10196–4 |
| BIOLOG Phenotypic Microarrays | BIOLOG, Inc | Cat#s PM1 and PM2A |
| Deposited Data | ||
| Raw reads for functional metagenomic selections | This paper | ID# PRJNA51754 |
| Raw reads for 16S sequencing | This paper | ID# PRJNA517716 |
| Raw reads for EcN isolates | This paper | ID# PRJNA51734 |
| Assembled wild-type EcN genome | This paper | ID#s CP035486-CP035489 |
| Assembled functional metagenomic contigs | This paper | ID# SHCT01000000 |
| Experimental Models: Cell Lines | ||
| Caco-2 | ATCC | Cat# ATCC HTB-37 |
| HT29-MTX | Sigma | Cat# 12040401 |
| Experimental Models: Organisms/Strains | ||
| Mus musculus C57BL/6 (Germ-free) | University of Michigan | N/A |
| Mus musculus C57BL/6 (Germ-free) | UPenn | N/A |
| Mus musculus C57BL/6J (Conventional) | Jackson Labs | Cat# JAX:000664 |
| Mus musculus C57BL/6J Pahenu2 | Dobrowolski Lab | N/A |
| Oligonucleotides | ||
| Primers | IDT | Supplementary Table 6 |
| Recombinant DNA | ||
| pSPAL2At | Addgene | Cat# 78286 |
| Other plasmids | This paper | Supplementary File 2 |
| pZE21 | Expressys | pZE21MCS |
| Software and Algorithms | ||
| PARFuMS | Boolchandani et al., 2017 | N/A |
| CD-HIT | Fu et al., 2012 | http://weizhongli-lab.org/cd-hit/ |
| Bowtie2 | Langmead and Salzberg, 2012 | http://bowtie-bio.sourceforge.net/bowtie2/index.shtml |
| SAMtools | Li, 2011 | http://www.htslib.org/ |
| BLASTp | Boratyn et al., 2012 | ftp://ftp.ncbi.nlm.nih.gov/blast/executables/blast+/LATEST/ |
| Interproscan | Jones et al., 2014 | https://www.ebi.ac.uk/interpro/download.html |
| BLAST2GO | BioBam | https://www.blast2go.com/ |
| R | R Core Team, 2018 | https://www.r-project.org/ |
| heatmaply | Galili et al., 2018 | https://cran.r-project.org/web/packages/heatmaply/vignettes/heatmaply.html |
| USEARCH7 | Edgar, 2010 | https://drive5.com/usearch/ |
| QIIME 1.9.0 | Caporaso et al., 2010 | http://qiime.org/ |
| Trimmomatic | Bolger et al., 2014 | http://www.usadellab.org/cms/?page=trimmomatic |
| SPAdes | Bankevich et al., 2012 | http://cab.spbu.ru/software/spades/ |
| LAST | Frith and Noe, 2014 | http://last.cbrc.jp/ |
| IGV | Thorvaldsdottir et al., 2013 | http://software.broadinstitute.org/software/igv/ |
| Prokka | Seemann, 2014 | https://github.com/tseemann/prokka |
| Breseq | Deatherage and Barrick, 2014 | http://barricklab.org/twiki/bin/view/Lab/ToolsBacterialGenomeResequencing |
| VarScan2 | Koboldt et al., 2012 | http://varscan.sourceforge.net/ |
| Annovar | Wang et al., 2010 | http://annovar.openbioinformatics.org/en/latest/ |
| Phaster | Arndt et al., 2016 | http://phaster.ca/ |
| CNVkit Pipeline | Talevich et al., 2016 | https://cnvkit.readthedocs.io/en/stable/ |
| PHYLIP 3.695 | Felsenstein, 2005 | http://evolution.genetics.washington.edu/phylip.html |
| iTOL | Letunic and Bork, 2016 | https://itol.embl.de/ |
| Roary | Page et al., 2015 | https://sanger-pathogens.github.io/Roary/ |
| RaxML | Stamatakis, 2014 | https://cme.h-its.org/exelixis/web/software/raxml/index.html |
| HyPhy | Delport, 2010 | http://hyphy.org/ |
| Other | ||
| Human Diet | Envigo | Cat# TD.88137 |
| Mouse Diet | Purina | Cat# 5K67 |
Highlights.
Carbohydrate availability in the gut drives E. coli Nissle adaptation in vivo Gut monocolonization selects for glycosyl hydrolases enabling population cross-feeding Mutations that enhance mucin utilization are enriched in low-diversity guts Prior antibiotic exposure in conventional guts can lead to evolved probiotic resistance
Acknowledgments
We would like to acknowledge Chyi Hsieh, Andrew Kau, and members of their labs for shared setup and maintenance of our germ-free mouse facility, Jessica Hoisington-Lopez, Eric Martin, and Brian Koebbe for next-generation sequencing and high-throughput computing support at the Edison Family Center for Genome Sciences and Systems Biology at Washington University in St Louis School of Medicine, and Thaddeus Stappenbeck, Tae Seok Moon, Phillip Tarr and members of the Dantas lab for helpful discussions. This work was supported by the NIH (DP2DK098089, R01GM099538, R01AI123394, and R01HD092414 to G.D; T32DK077653 to N.C. and A.J.G; T32GM007067 to A.J.G. and M.W.P.), the NSF (DGE-1143954 to M.K.G.) the Kenneth Rainin Foundation (13H5 to G.D.), the Chancellor’s Graduate Research Fellowship Program at Washington University in St. Louis (to A.F.), and the Mr. and Mrs. Spencer T. Olin Fellowship at Washington University in St Louis (to M.K.G.). The content is solely the responsibility of the authors and does not necessarily represent the official views of the funding agencies.
Footnotes
Publisher's Disclaimer: This is a PDF file of an unedited manuscript that has been accepted for publication. As a service to our customers we are providing this early version of the manuscript. The manuscript will undergo copyediting, typesetting, and review of the resulting proof before it is published in its final citable form. Please note that during the production process errors may be discovered which could affect the content, and all legal disclaimers that apply to the journal pertain.
Declaration of Interests
The authors declare no competing interests. The following authors have the current affiliations: AJG: VL55; MKG: Flagship Pioneering; DP: Eli Lilly & Company. The authors assert that VL55, Flagship Pioneering, and Eli Lilly & Company were not involved in and did not influence this research.
References
- Anderson C (2006. ). Anderson promoter collection. http://parts.igem.org/Promoters/Catalog/Anderson [Google Scholar]
- Arndt D, Grant JR, Marcu A, Sajed T, Pon A, Liang Y, and Wishart DS (2016). PHASTER: a better, faster version of the PHAST phage search tool. Nucleic Acids Res 44, W16–21. [DOI] [PMC free article] [PubMed] [Google Scholar]
- Bankevich A, Nurk S, Antipov D, Gurevich AA, Dvorkin M, Kulikov AS, Lesin VM, Nikolenko SI, Pham S, Prjibelski AD, et al. (2012). SPAdes: a new genome assembly algorithm and its applications to single-cell sequencing. J Comput Biol 19, 455–477. [DOI] [PMC free article] [PubMed] [Google Scholar]
- Battesti A, Majdalani N, and Gottesman S (2011). The RpoS-mediated general stress response in Escherichia coli. Annu Rev Microbiol 65, 189–213. [DOI] [PMC free article] [PubMed] [Google Scholar]
- Baym M, Kryazhimskiy S, Lieberman TD, Chung H, Desai MM, and Kishony R (2015). Inexpensive multiplexed library preparation for megabase-sized genomes. PLoS One 10, e0128036. [DOI] [PMC free article] [PubMed] [Google Scholar]
- Benitez-Paez A, Villarroya M, and Armengod ME (2012). Regulation of expression and catalytic activity of Escherichia coli RsmG methyltransferase. Rna 18, 795–806. [DOI] [PMC free article] [PubMed] [Google Scholar]
- Bolger AM, Lohse M, and Usadel B (2014). Trimmomatic: a flexible trimmer for Illumina sequence data. Bioinformatics 30, 2114–2120. [DOI] [PMC free article] [PubMed] [Google Scholar]
- Boolchandani M, Patel S, and Dantas G (2017). Functional Metagenomics to Study Antibiotic Resistance. Methods Mol Biol 1520, 307–329. [DOI] [PubMed] [Google Scholar]
- Boratyn GM, Schaffer AA, Agarwala R, Altschul SF, Lipman DJ, and Madden TL (2012). Domain enhanced lookup time accelerated BLAST. Biol Direct 7, 12. [DOI] [PMC free article] [PubMed] [Google Scholar]
- Caporaso JG, Kuczynski J, Stombaugh J, Bittinger K, Bushman FD, Costello EK, Fierer N, Peña AG, Goodrich JK, Gordon JI, et al. (2010). QIIME allows analysis of high-throughput community sequencing data. Nat Methods 7, 335–336. [DOI] [PMC free article] [PubMed] [Google Scholar]
- Caporaso JG, Lauber CL, Walters WA, Berg-Lyons D, Huntley J, Fierer N, Owens SM, Betley J, Fraser L, Bauer M, et al. (2012). Ultra-high-throughput microbial community analysis on the Illumina HiSeq and MiSeq platforms. The ISME journal 6, 1621–1624. [DOI] [PMC free article] [PubMed] [Google Scholar]
- Chan CT, Lee JW, Cameron DE, Bashor CJ, and Collins JJ (2016). ‘Deadman’ and ‘Passcode’ microbial kill switches for bacterial containment. Nat Chem Biol 12, 82–86. [DOI] [PMC free article] [PubMed] [Google Scholar]
- Chang DE, Smalley DJ, Tucker DL, Leatham MP, Norris WE, Stevenson SJ, Anderson AB, Grissom JE, Laux DC, Cohen PS, et al. (2004). Carbon nutrition of Escherichia coli in the mouse intestine. Proc Natl Acad Sci U S A 101, 7427–7432. [DOI] [PMC free article] [PubMed] [Google Scholar]
- Conway T, and Cohen PS (2015). Commensal and Pathogenic Escherichia coli Metabolism in the Gut. Microbiol Spectr. 10.1128/microbiolspec.MBP-0006-2014 [DOI] [PMC free article] [PubMed] [Google Scholar]
- Deatherage DE, and Barrick JE (2014). Identification of mutations in laboratory-evolved microbes from next-generation sequencing data using breseq. Methods Mol Biol 1151, 165–188. [DOI] [PMC free article] [PubMed] [Google Scholar]
- Delport WP, Frost AF, Pond SDW, S.L.K. (2010). Datamonkey 2010: a suite of phylogenetic analysis tools for evolutionary biology Bioinformatics 26, 2455–2457. [DOI] [PMC free article] [PubMed] [Google Scholar]
- Durrer KE, Allen MS, and Hunt von Herbing I (2017). Genetically engineered probiotic for the treatment of phenylketonuria (PKU); assessment of a novel treatment in vitro and in the PAHenu2 mouse model of PKU. PLoS One 12, e0176286. [DOI] [PMC free article] [PubMed] [Google Scholar]
- Edgar RC (2010). Search and clustering orders of magnitude faster than BLAST. Bioinformatics 26, 2460–2461. [DOI] [PubMed] [Google Scholar]
- Fabich AJ, Jones SA, Chowdhury FZ, Cernosek A, Anderson A, Smalley D, McHargue JW, Hightower GA, Smith JT, Autieri SM, et al. (2008). Comparison of carbon nutrition for pathogenic and commensal Escherichia coli strains in the mouse intestine. Infect Immun 76, 1143–1152. [DOI] [PMC free article] [PubMed] [Google Scholar]
- Felsenstein J (2005). PHYLIP (Phylogeny Inference Package) (Distributed by the author). http://evolution.genetics.washington.edu/phylip.html
- Ferreiro A, Crook N, Gasparrini AJ, and Dantas G (2018). Multiscale Evolutionary Dynamics of Host-Associated Microbiomes. Cell 172, 1216–1227. [DOI] [PMC free article] [PubMed] [Google Scholar]
- Fletcher E, Krivoruchko A, and Nielsen J (2016). Industrial systems biology and its impact on synthetic biology of yeast cell factories. Biotechnol Bioeng 113, 1164–1170. [DOI] [PubMed] [Google Scholar]
- Fontaine F, Stewart EJ, Lindner AB, and Taddei F (2008). Mutations in two global regulators lower individual mortality in Escherichia coli. Mol Microbiol 67, 2–14. [DOI] [PMC free article] [PubMed] [Google Scholar]
- Forsberg KJ, Reyes A, Wang B, Selleck EM, Sommer MO, and Dantas G (2012). The shared antibiotic resistome of soil bacteria and human pathogens. Science 337, 1107–1111. [DOI] [PMC free article] [PubMed] [Google Scholar]
- Frith MC, and Noe L (2014). Improved search heuristics find 20,000 new alignments between human and mouse genomes. Nucleic Acids Res 42, e59. [DOI] [PMC free article] [PubMed] [Google Scholar]
- Fu L, Niu B, Zhu Z, Wu S, and Li W (2012). CD-HIT: accelerated for clustering the next-generation sequencing data. Bioinformatics 28, 3150–3152. [DOI] [PMC free article] [PubMed] [Google Scholar]
- Goodman AL, Kallstrom G, Faith JJ, Reyes A, Moore A, Dantas G, and Gordon JI (2011). Extensive personal human gut microbiota culture collections characterized and manipulated in gnotobiotic mice. Proc Natl Acad Sci U S A 108, 6252–6257. [DOI] [PMC free article] [PubMed] [Google Scholar]
- Goodman AL, McNulty NP, Zhao Y, Leip D, Mitra RD, Lozupone CA, Knight R, and Gordon JI (2009). Identifying genetic determinants needed to establish a human gut symbiont in its habitat. Cell Host Microbe 6, 279–289. [DOI] [PMC free article] [PubMed] [Google Scholar]
- Grozdanov L, Raasch C, Schulze J, Sonnenborn U, Gottschalk G, Hacker J, and Dobrindt U (2004). Analysis of the genome structure of the nonpathogenic probiotic Escherichia coli strain Nissle 1917. J Bacteriol 186, 5432–5441. [DOI] [PMC free article] [PubMed] [Google Scholar]
- Hafez M, Hayes K, Goldrick M, Grencis RK, and Roberts IS (2010). The K5 capsule of Escherichia coli strain Nissle 1917 is important in stimulating expression of Toll-like receptor 5, CD14, MyD88, and TRIF together with the induction of interleukin-8 expression via the mitogen-activated protein kinase pathway in epithelial cells. Infect Immun 78, 2153–2162. [DOI] [PMC free article] [PubMed] [Google Scholar]
- Hempel S, Newberry SJ, Maher AR, and et al. (2012). Probiotics for the prevention and treatment of antibiotic-associated diarrhea: A systematic review and meta-analysis. JAMA 307, 1959–1969. [DOI] [PubMed] [Google Scholar]
- Hill C, Guarner F, Reid G, Gibson GR, Merenstein DJ, Pot B, Morelli L, Canani RB, Flint HJ, Salminen S, et al. (2014). Expert consensus document. The International Scientific Association for Probiotics and Prebiotics consensus statement on the scope and appropriate use of the term probiotic. Nat Rev Gastroenterol Hepatol 11, 506–514. [DOI] [PubMed] [Google Scholar]
- Hoskins LC, Agustines M, McKee WB, Boulding ET, Kriaris M, and Niedermeyer G (1985). Mucin degradation in human colon ecosystems. Isolation and properties of fecal strains that degrade ABH blood group antigens and oligosaccharides from mucin glycoproteins. J Clin Invest 75, 944–953. [DOI] [PMC free article] [PubMed] [Google Scholar]
- Hwang IY, Koh E, Wong A, March JC, Bentley WE, Lee YS, and Chang MW (2017). Engineered probiotic Escherichia coli can eliminate and prevent Pseudomonas aeruginosa gut infection in animal models. Nat Commun 8, 15028. [DOI] [PMC free article] [PubMed] [Google Scholar]
- Isabella VM, Ha BN, Castillo MJ, Lubkowicz DJ, Rowe SE, Millet YA, Anderson CL, Li N, Fisher AB, West KA, et al. (2018). Development of a synthetic live bacterial therapeutic for the human metabolic disease phenylketonuria. Nature Biotechnology 36, 857. [DOI] [PubMed] [Google Scholar]
- Jones P, Binns D, Chang HY, Fraser M, Li W, McAnulla C, McWilliam H, Maslen J, Mitchell A, Nuka G, et al. (2014). InterProScan 5: genome-scale protein function classification. Bioinformatics 30, 1236–1240. [DOI] [PMC free article] [PubMed] [Google Scholar]
- Koboldt DC, Zhang Q, Larson DE, Shen D, McLellan MD, Lin L, Miller CA, Mardis ER, Ding L, and Wilson RK (2012). VarScan 2: somatic mutation and copy number alteration discovery in cancer by exome sequencing. Genome Res 22, 568–576. [DOI] [PMC free article] [PubMed] [Google Scholar]
- Koenigsknecht MJ, and Young VB (2013). Fecal microbial transplantation for the treatment of Clostridium difficile infection: current promise and future needs. Curr Opin Gastroenterol 29, 628–632. [DOI] [PMC free article] [PubMed] [Google Scholar]
- Kurtz CB, Millet YA, Puurunen MK, Perreault M, Charbonneau MR, Isabella VM, Kotula JW, Antipov E, Dagon Y, Denney WS, et al. (2019). An engineered E. coli Nissle improves hyperammonemia and survival in mice and shows dose-dependent exposure in healthy humans. Science Translational Medicine 11, eaau7975. [DOI] [PubMed] [Google Scholar]
- Lane ER, Zisman TL, and Suskind DL (2017). The microbiota in inflammatory bowel disease: current and therapeutic insights. Journal of inflammation research 10, 63–73. [DOI] [PMC free article] [PubMed] [Google Scholar]
- Langmead B, and Salzberg SL (2012). Fast gapped-read alignment with Bowtie 2. Nat Methods 9, 357–359. [DOI] [PMC free article] [PubMed] [Google Scholar]
- Lechner A, Brunk E, and Keasling JD (2016). The Need for Integrated Approaches in Metabolic Engineering. Cold Spring Harb Perspect Biol 8, a023903. [DOI] [PMC free article] [PubMed] [Google Scholar]
- Lee H, Popodi E, Tang H, and Foster PL (2012). Rate and molecular spectrum of spontaneous mutations in the bacterium Escherichia coli as determined by whole-genome sequencing. Proc Natl Acad Sci U S A 109, E2774–E2783. [DOI] [PMC free article] [PubMed] [Google Scholar]
- Leroux M, and Priem B (2016). Chaperone-assisted expression of KfiC glucuronyltransferase from Escherichia coli K5 leads to heparosan production in Escherichia coli BL21 in absence of the stabilisator KfiB. Applied Microbiology and Biotechnology 100, 10355–10361. [DOI] [PubMed] [Google Scholar]
- Letunic I, and Bork P (2016). Interactive tree of life (iTOL) v3: an online tool for the display and annotation of phylogenetic and other trees. Nucleic Acids Res 44, W242–245. [DOI] [PMC free article] [PubMed] [Google Scholar]
- Li H (2011). A statistical framework for SNP calling, mutation discovery, association mapping and population genetical parameter estimation from sequencing data. Bioinformatics 27, 2987–2993. [DOI] [PMC free article] [PubMed] [Google Scholar]
- Lieberman TD, Flett KB, Yelin I, Martin TR, McAdam AJ, Priebe GP, and Kishony R (2014). Genetic variation of a bacterial pathogen within individuals with cystic fibrosis provides a record of selective pressures. Nat Genet 46, 82–87. [DOI] [PMC free article] [PubMed] [Google Scholar]
- Liu D, Xiao Y, Evans BS, and Zhang F (2015). Negative Feedback Regulation of Fatty Acid Production Based on a Malonyl-CoA Sensor–Actuator. ACS Synthetic Biology 4, 132–140. [DOI] [PubMed] [Google Scholar]
- Lutz R, and Bujard H (1997). Independent and tight regulation of transcriptional units in Escherichia coli via the LacR/O, the TetR/O and AraC/I1-I2 regulatory elements. Nucleic Acids Res 25, 1203–1210. [DOI] [PMC free article] [PubMed] [Google Scholar]
- McKenna R, and Nielsen DR (2011). Styrene biosynthesis from glucose by engineered E. coli. Metab Eng 13, 544–554. [DOI] [PubMed] [Google Scholar]
- Moore AM, Ahmadi S, Patel S, Gibson MK, Wang B, Ndao MI, Deych E, Shannon W, Tarr PI, Warner BB, et al. (2015). Gut resistome development in healthy twin pairs in the first year of life. Microbiome 3, 27. [DOI] [PMC free article] [PubMed] [Google Scholar]
- Page AJ, Cummins CA, Hunt M, Wong VK, Reuter S, Holden MT, Fookes M, Falush D, Keane JA, and Parkhill J (2015). Roary: rapid large-scale prokaryote pan genome analysis. Bioinformatics 31, 3691–3693. [DOI] [PMC free article] [PubMed] [Google Scholar]
- Palmer JD, Piattelli E, McCormick BA, Silby MW, Brigham CJ, and Bucci V (2018). Engineered Probiotic for the Inhibition of Salmonella via Tetrathionate-Induced Production of Microcin H47. ACS Infect Dis 4, 39–45. [DOI] [PMC free article] [PubMed] [Google Scholar]
- Patzer SI, Baquero MR, Bravo D, Moreno F, and Hantke K (2003). The colicin G, H and X determinants encode microcins M and H47, which might utilize the catecholate siderophore receptors FepA, Cir, Fiu and IroN. Microbiology 149, 2557–2570. [DOI] [PubMed] [Google Scholar]
- Plump AS, Smith JD, Hayek T, Aalto-Setälä K, Walsh A, Verstuyft JG, Rubin EM, and Breslow JL (1992). Severe hypercholesterolemia and atherosclerosis in apolipoprotein E-deficient mice created by homologous recombination in ES cells. Cell 71, 343–353. [DOI] [PubMed] [Google Scholar]
- Porco A, Peekhaus N, Bausch C, Tong S, Isturiz T, and Conway T (1997). Molecular genetic characterization of the Escherichia coli gntT gene of GntI, the main system for gluconate metabolism. J Bacteriol 179, 1584–1590. [DOI] [PMC free article] [PubMed] [Google Scholar]
- Rang CU, Licht TR, Midtvedt T, Conway PL, Chao L, Krogfelt KA, Cohen PS, and Molin S (1999). Estimation of growth rates of Escherichia coli BJ4 in streptomycin-treated and previously germfree mice by in situ rRNA hybridization. Clinical and diagnostic laboratory immunology 6, 434–436. [DOI] [PMC free article] [PubMed] [Google Scholar]
- Reister M, Hoffmeier K, Krezdorn N, Rotter B, Liang C, Rund S, Dandekar T, Sonnenborn U, and Oelschlaeger TA (2014). Complete genome sequence of the gram-negative probiotic Escherichia coli strain Nissle 1917. J Biotechnol 187, 106–107. [DOI] [PubMed] [Google Scholar]
- Rothschild D, Weissbrod O, Barkan E, Kurilshikov A, Korem T, Zeevi D, Costea PI, Godneva A, Kalka IN, Bar N, et al. (2018). Environment dominates over host genetics in shaping human gut microbiota. Nature 555, 210–215. [DOI] [PubMed] [Google Scholar]
- Sarkissian CN, Gamez A, Wang L, Charbonneau M, Fitzpatrick P, Lemontt JF, Zhao B, Vellard M, Bell SM, Henschell C, et al. (2008). Preclinical evaluation of multiple species of PEGylated recombinant phenylalanine ammonia lyase for the treatment of phenylketonuria. Proc Natl Acad Sci U S A 105, 20894–20899. [DOI] [PMC free article] [PubMed] [Google Scholar]
- Scaldaferri F, Gerardi V, Mangiola F, Lopetuso LR, Pizzoferrato M, Petito V, Papa A, Stojanovic J, Poscia A, Cammarota G, et al. (2016). Role and mechanisms of action of Escherichia coli Nissle 1917 in the maintenance of remission in ulcerative colitis patients: An update. World J Gastroenterol 22, 5505–5511. [DOI] [PMC free article] [PubMed] [Google Scholar]
- Seemann T (2014). Prokka: rapid prokaryotic genome annotation. Bioinformatics 30, 2068–2069.24642063 [Google Scholar]
- Smillie CS, Smith MB, Friedman J, Cordero OX, David LA, and Alm EJ (2011). Ecology drives a global network of gene exchange connecting the human microbiome. Nature 480, 241–244. [DOI] [PubMed] [Google Scholar]
- Sonnenborn U, and Schulze J (2009). The non-pathogenic Escherichia coli strain Nissle 1917 – features of a versatile probiotic. Microbial Ecology in Health and Disease 21, 122–158. [Google Scholar]
- Soucy SM, Huang J, and Gogarten JP (2015). Horizontal gene transfer: building the web of life. Nat Rev Genet 16, 472–482. [DOI] [PubMed] [Google Scholar]
- Stamatakis A (2014). RAxML version 8: a tool for phylogenetic analysis and post-analysis of large phylogenies. Bioinformatics 30, 1312–1313. [DOI] [PMC free article] [PubMed] [Google Scholar]
- Suez J, Zmora N, Zilberman-Schapira G, Mor U, Dori-Bachash M, Bashiardes S, Zur M, Regev-Lehavi D, Ben-Zeev Brik R, Federici S, et al. (2018). Post-Antibiotic Gut Mucosal Microbiome Reconstitution Is Impaired by Probiotics and Improved by Autologous FMT. Cell 174, 1406–1423.e1416. [DOI] [PubMed] [Google Scholar]
- Sweeney NJ, Klemm P, McCormick BA, Moller-Nielsen E, Utley M, Schembri MA, Laux DC, and Cohen PS (1996a). The Escherichia coli K-12 gntP gene allows E. coli F-18 to occupy a distinct nutritional niche in the streptomycin-treated mouse large intestine. Infect Immun 64, 3497–3503. [DOI] [PMC free article] [PubMed] [Google Scholar]
- Sweeney NJ, Laux DC, and Cohen PS (1996b). Escherichia coli F-18 and E. coli K-12 eda mutants do not colonize the streptomycin-treated mouse large intestine. Infect Immun 64, 3504–3511. [DOI] [PMC free article] [PubMed] [Google Scholar]
- Tailford LE, Crost EH, Kavanaugh D, and Juge N (2015). Mucin glycan foraging in the human gut microbiome. Front Genet 6, 81. [DOI] [PMC free article] [PubMed] [Google Scholar]
- Talevich E, Shain AH, Botton T, and Bastian BC (2016). CNVkit: Genome-Wide Copy Number Detection and Visualization from Targeted DNA Sequencing. PLOS Computational Biology 12, e1004873. [DOI] [PMC free article] [PubMed] [Google Scholar]
- Thorvaldsdottir H, Robinson JT, and Mesirov JP (2013). Integrative Genomics Viewer (IGV): high-performance genomics data visualization and exploration. Brief Bioinform 14, 178–192. [DOI] [PMC free article] [PubMed] [Google Scholar]
- Timms AR, Steingrimsdottir H, Lehmann AR, and Bridges BA (1992). Mutant sequences in the rpsL gene of Escherichia coli B/r: mechanistic implications for spontaneous and ultraviolet light mutagenesis. Mol Gen Genet 232, 89–96. [DOI] [PubMed] [Google Scholar]
- Tramonti A, Visca P, De Canio M, Falconi M, and De Biase D (2002). Functional characterization and regulation of gadX, a gene encoding an AraC/XylS-like transcriptional activator of the Escherichia coli glutamic acid decarboxylase system. J Bacteriol 184, 2603–2613. [DOI] [PMC free article] [PubMed] [Google Scholar]
- Vanderpool CK, and Gottesman S (2007). The novel transcription factor SgrR coordinates the response to glucose-phosphate stress. J Bacteriol 189, 2238–2248. [DOI] [PMC free article] [PubMed] [Google Scholar]
- Wang K, Li M, and Hakonarson H (2010). ANNOVAR: functional annotation of genetic variants from high-throughput sequencing data. Nucleic Acids Res 38, e164–e164. [DOI] [PMC free article] [PubMed] [Google Scholar]
- Weickert MJ, and Adhya S (1993). The galactose regulon of Escherichia coli. Mol Microbiol 10, 245–251. [DOI] [PubMed] [Google Scholar]
- Westendorf AM, Gunzer F, Deppenmeier S, Tapadar D, Hunger JK, Schmidt MA, Buer J, and Bruder D (2005). Intestinal immunity of Escherichia coli NISSLE 1917: a safe carrier for therapeutic molecules. FEMS Immunol Med Microbiol 43, 373–384. [DOI] [PubMed] [Google Scholar]
- Wexler AG, Bao Y, Whitney JC, Bobay L-M, Xavier JB, Schofield WB, Barry NA, Russell AB, Tran BQ, Goo YA, et al. (2016). Human symbionts inject and neutralize antibacterial toxins to persist in the gut. Proc Natl Acad Sci U S A 113, 3639–3644. [DOI] [PMC free article] [PubMed] [Google Scholar]
- Winkler JD, Garcia C, Olson M, Callaway E, and Kao KC (2014). Evolved osmotolerant Escherichia coli mutants frequently exhibit defective N-acetylglucosamine catabolism and point mutations in cell shape-regulating protein MreB. Appl Environ Microbiol 80, 3729–3740. [DOI] [PMC free article] [PubMed] [Google Scholar]
- Zhao S, Lieberman TD, Poyet M, Groussin M, Gibbons SM, Xavier RJ, and Alm EJ (2018). Adaptive evolution within the gut microbiome of individual people. bioRxiv. 10.1101/208009 [DOI] [PMC free article] [PubMed] [Google Scholar]
- Zmora N, Zilberman-Schapira G, Suez J, Mor U, Dori-Bachash M, Bashiardes S, Kotler E, Zur M, Regev-Lehavi D, Brik RB-Z, et al. (2018). Personalized Gut Mucosal Colonization Resistance to Empiric Probiotics Is Associated with Unique Host and Microbiome Features. Cell 174, 1388–1405.e1321. [DOI] [PubMed] [Google Scholar]
Associated Data
This section collects any data citations, data availability statements, or supplementary materials included in this article.
Supplementary Materials
Data Availability Statement
The raw reads for functional metagenomic selections have been deposited in NCBI under ID code PRJNA51754. Assembled contigs for functional metagenomic selections have been deposited in DDBJ/ENA/GenBank under the accession SHCT00000000. The version described in this paper is version SHCT01000000. The raw reads for all EcN isolates have been deposited in NCBI under ID code PRJNA517347. The assembled wild-type EcN genome has been deposited in NCBI under ID codes CP035486-CP035489. 16S rRNA sequencing for experiments involving the 13-member community have been deposited in NCBI under ID PRJNA517716.