Abstract
Objectives:
We examined trends in racial/ethnic, socioeconomic, and geographic disparities in age- and cause-specific infant mortality in the United States during 1915-2017.
Methods:
Log-linear regression and inequality indices were used to analyze temporal infant mortality data from the National Vital Statistics System and the National Linked Birth/Infant Death files according to maternal and infant characteristics.
Results:
During 1915-2017, the infant mortality rate (IMR) declined dramatically overall and for black and white infants; however, black/white disparities in mortality generally increased through 2000. Racial disparities were greater in post-neonatal mortality than neonatal mortality. Detailed racial/ethnic comparisons show an approximately five-fold difference in IMR, ranging from a low of 2.3 infant deaths per 1,000 live births for Chinese infants to a high of 8.5 for American Indian/Alaska Natives and 11.2 for black infants. Infant mortality from major causes of death showed a downward trend during the past 5 decades although there was a recent upturn in mortality from prematurity/low birthweight and unintentional injury. In 2016, black infants had 2.5-2.8 times higher risk of mortality from perinatal conditions, sudden infant death syndrome, influenza/pneumonia, and unintentional injuries, and 1.3 times higher risk of mortality from birth defects compared to white infants. Educational disparities in infant mortality widened between 1986 and 2016; mothers with less than a high school education in 2016 experienced 2.4, 1.9, and 3.7 times higher risk of infant, neonatal, and post-neonatal mortality than those with a college degree. Geographic disparities were marked and widened across regions, with states in the Southeast region having higher IMRs.
Conclusions and Global Health Implications:
Social inequalities in infant mortality have persisted and remained marked, with the disadvantaged ethnic and socioeconomic groups and geographic areas experiencing substantially increased risks of mortality despite the declining trend in mortality over time. Widening social inequalities in infant mortality are a major factor contributing to the worsening international standing of the United States.
Keywords: Infant Mortality, Cause of Death, Race/Ethnicity, Socioeconomic Status, Geographic, Inequality, Trend, United States
1. Introduction
Infant mortality is an important indicator of a nation’s health and well-being and is often seen as a marker for social progress and human development.1-4 Healthy People 2020, the national health initiative in the United States (US), continues to recognize infant mortality as a leading health indicator for the US.5 Although the overall US rate has declined dramatically over time, racial/ethnic, socioeconomic, and geographic disparities in infant mortality have remained marked.1,2,4,6 The US lags behind other developed countries in its international ranking, as the decline in infant mortality has not kept pace with that for other nations.1,2,3,6,7
Few studies have presented a comprehensive picture of time trends and socio-demographic differentials in infant mortality in the US although high-quality statistics have been available for the nation for over a century.1,2,6,8 A comprehensive analysis of long-term trends can provide important insights into the effectiveness of social and public health policies and interventions in reducing overall infant mortality, the nature and extent of contemporary social inequalities, and potential policy actions that could bring about further declines in infant mortality.1,2,8 Historical accounts and major findings from such analyses can be immensely useful for researchers, public health professionals, and policymakers concerned with improvement in overall population health, and infant and child health in particular. Analyzing the dynamics of infant mortality inequalities for the US can yield valuable data and insights for international comparative studies involving other developed nations with similar levels of industrialization, human development, and economic achievement.
In this paper, we analyze long-term trends in US infant mortality rates (IMRs) according to race/ethnicity, maternal socioeconomic status (SES), infant age at death, birthweight, length of gestation, maternal age, state and region of residence, and cause of death by using both historical and the latest national vital statistics data.1,2,6,8,9 Our aim is to document the full extent of social inequalities by estimating educational gradients in infant mortality for the total population and for major racial/ethnic groups. While this study focuses on trends and inequalities within the US, a cross-national comparison of trends in IMRs for 37 industrialized countries provides an international context for the infant mortality disparities.
2. Methods
The national vital statistics mortality database was used to analyze trends in IMRs by infant age at death, maternal race, place of residence, and cause of death.1,2,6,10-12 National linked birth and infant death files, developed by the National Center for Health Statistics as a byproduct of the natality and mortality components of the National Vital Statistics System, were used to compute IMRs by maternal age, birthweight, gestational age, detailed race/ethnicity, and maternal education disparities over time.13-15 These linked databases are available as public-use files for the 1983 through 2011 birth cohorts and as period linked files from 2003 to 2016.13-15 In the linked dataset, the death certificate is linked with corresponding birth certificate for each infant who dies in the US. For each national birth cohort, more than 23,000 infant deaths are linked to a cohort of about 4 million births each year.13,14 The purpose of the linkage is to use many additional variables available from the birth certificate in infant mortality analysis.13,14 The 2016 period-linked file contained 3,945,875 live births and 23,157 infant death records.14
To analyze trends in overall and racial disparities, we calculated IMRs for all races and white and black infants from 1915 through 2017. Detailed racial/ethnic disparities were analyzed by computing IMRs for the 2014-2016 period for non-Hispanic whites, non-Hispanic blacks, American Indians/Alaska Natives (AIANs), and Asian/Pacific Islander (API) and Hispanic subgroups. To analyze SES trends, we computed infant, neonatal, and postneonatal mortality rates by maternal education using the national linked birth/infant death files for the 1986, 1991, 1996, and 2001 birth cohorts, and 2007 and 2016 period files.1,2,8,14 Maternal education, measured by years of school completed, was grouped into four categories: <12, 12, 13-15, and ≥16 years. Other measures of SES, such as income, occupation, or employment status were not available in the linked files.1,8,14 We examined geographic disparities over time by computing IMRs from 1969 to 2016 for 9 census regions and all US 50 states and the District of Columbia (DC).10,12
Log-linear regression was used to calculate average annual exponential rates of decline in infant mortality for various groups and geographic areas.1,8 An index of disparity, which approximated in relative terms the average deviation of the rates from the rate for the highest-educated group, was used to summarize disparities over time across all educational groups.8,16 This relative index of disparity was calculated as:

Where Eri is the rate for the ith group (i=1,2,3,4), Er4 is the rate for the highest-educated group, and I is the number of education groups being compared. Additionally, a population attributable risk (PAR%) measure was computed to assess the extent of improvement in infant mortality if all maternal education groups were to have the rate of the highest-educated group.8
3. Results
3.1. International disparities in infant mortality
The US ranks poorly in IMR when compared to other industrialized nations. The latest available data from 2015 shows a 3-to-4 times higher infant mortality rate in the US compared to Hong Kong, Singapore, and Finland (Figure 1) and 31-51% higher than the rate for Canada and England & Wales. Among the 37 countries, the US had the seventh highest IMR, exceeded only by Bulgaria, Costa Rica, Romania, Chile, Puerto Rico, and Russia. The US also lags behind other developed countries in terms of infant mortality decline.7 In 1960, the US ranked 12th lowest in infant mortality.2,6 Its international ranking had slipped to 31st in 2015.
Figure 1.
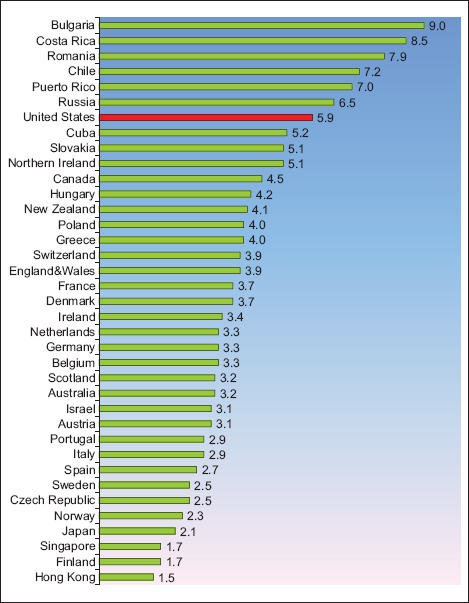
Infant Mortality Rate (IMR) per 1,000 Live Births for Selected Countries, 2015
Source: WHO. OECD, Global Health Observatory and Official National Health Statistics for Selected Countries.
3.2. Long-term trends in infant, neonatal, and postneonatal mortality by race/ethnicity
The IMR in the US showed a consistently downward trend between 1915 and 2000, with the rate declining from 99.9 per 1,000 live births in 1916 to 6.9 in 2000, at an impressive pace of 3.1% per year (Figure 2). However, between 2001 and 2017, the IMR declined more slowly from 6.8 in 2001 to 5.8 in 2017, at an annual rate of 1.3%.
Figure 2.
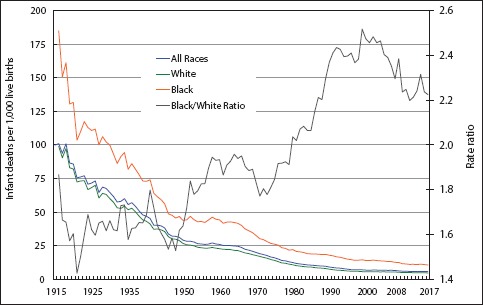
Infant Mortality Rate by Race, United States, 1915-2017
Source: US National Vital Statistics System.
During 1916-2017, the IMR for white infants declined by 3.1% per year, while the rate for black infants declined by 2.6% annually. Due to a slower decline in mortality for black infants, the racial disparity in the IMR increased between 1916 and 2017. In 1916, the rate for black infants was 184.9 deaths per 1,000 live births, 87% higher than the rate for white infants (99.0). In 1920, the black IMR was 43% higher than the white IMR. In 2017, the black IMR was 10.8 per 1,000 live births, 122% higher than the white IMR of 4.9.
In 2017, approximately two-thirds of infant deaths occurred in the neonatal period – the first 27 days of life (Figure 3). The racial disparity in neonatal mortality increased between 1916 and 2017, as white infants experienced faster declines (2.9% per year) in neonatal mortality than black infants (2.2% per year). Compared to white infants, the risk of neonatal mortality was 36% higher for black infants in 1920, but 109% higher in 2017 (Figure 3). Since 1950, the risk of postneonatal mortality (between 28 days and 1 year of age) for black infants has been more than twice the risk for white infants. In 2017, the postneonatal mortality rate for black infants was 151% higher than the rate for white infants. Since 1982, the postneonatal mortality rate of black infants has exceeded the neonatal mortality rate of white infants (Figure 3).
Figure 3.
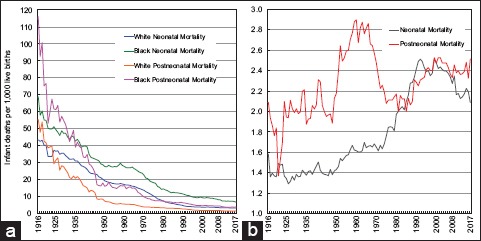
(a) Neonatal and Postneontal Mortality Rates by Race, United States, 1916-2017. (b) Black/White Ratios of Neonatal and Postneonatal Mortality Rates, United States, 1916-2017
Source: US National Vital Statistics System.
According to detailed racial/ethnic data for 2014-2016, the IMR was highest for non-Hispanic blacks (11.2), followed by AIANs (8.5), Hawaiians (7.0), Samoans (6.9), Puerto Ricans (6.6), non-Hispanic whites (5.0), Mexicans (4.9), Filipinos (4.5), Central/South Americans (4.2), Cubans (4.0), Asian Indians (3.8), Vietnamese (3.8), Japanese (3.3), Koreans (2.9), and Chinese (2.3). Compared to non-Hispanic whites, the IMR was significantly higher for non-Hispanic blacks, AIANs, and Puerto Ricans and significantly lower for APIs and Central/South Americans. Thus, a detailed comparison shows an approximately five-fold racial/ethnic difference in the IMR (Figure 4).
Figure 4.
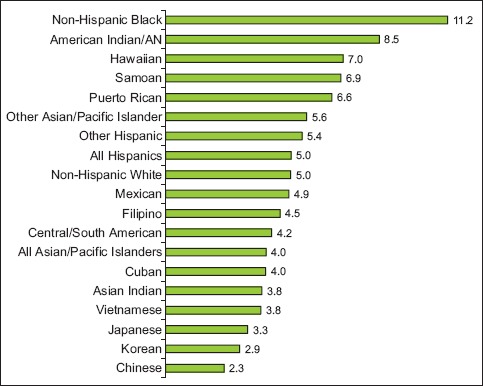
Infant Mortality Rate (IMR) per 1,000 Live Births for Detailed Racial/Ethnic Groups, United States, 2014-2016 (US Total =5.9)
Source: Derived from the 2014-2016 Linked Birth/Infant Death Period Files.
3.3. Trends in infant mortality by birthweight, length of gestation, and maternal age
In 2016, the mortality rate for low-birthweight (<2,500 grams) infants was 23 times greater than the rate for normal-birthweight (≥2,500 grams) infants (Figure 5). Nearly a quarter of all infants born with very low birthweight (<1,500 grams) die during the first year of life. The magnitude of decline in mortality over the past five decades was smaller for very-low-birthweight infants than for moderately-low-birthweight (1,500-2,499 grams) and normal-birthweight infants (Figure 5).
Figure 5.
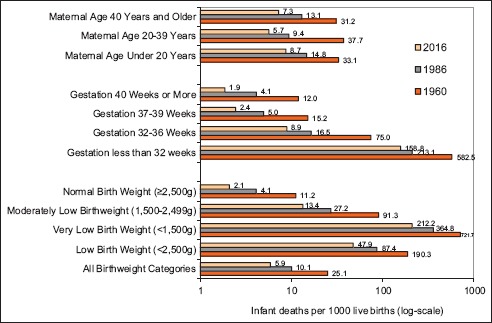
Infant Mortality Rate by Maternal Age, Length of Gestation and Birthweight, United States, 1960-2016
Source: US National Vital Statistics System and National Linked Birth/Infant Death Data Sets, 1986 Birth Cohort and 2016 Period Files.
In 2016, the mortality rate for very-preterm (<32 weeks of gestation) infants was 65 times greater than the rate for infants born at term (37-39 weeks of gestation). Between 1960 and 2016, the mortality rates for very-preterm and term infants fell by 73% and 84%, respectively. The risk of mortality was higher among infants born to teen mothers and mothers aged ≥40 years. Between 1960 and 2016, the mortality rates for infants born to teen mothers, mothers aged 20-39, and older mothers fell by 74%, 85%, and 77% respectively.
3.4. Leading causes of infant death
The leading causes of infant death in 2016 were congenital anomalies (birth defects), short gestation/low birthweight, sudden infant death syndrome (SIDS), maternal complications of pregnancy, unintentional injuries, cord and placental complications, and respiratory distress syndrome (RDS).11,12 Together, these causes accounted for 65% of all infant deaths in 2016 and 58% of all infant deaths in 1970, and the leading causes differed for the two time periods (Figure 6).
Figure 6.
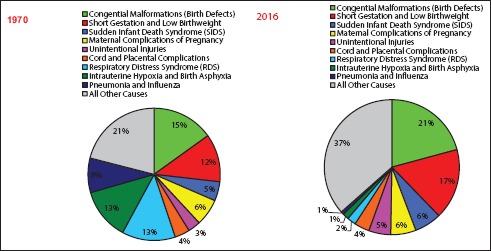
Leading Causes of Infant Death: United States, 1970 and 2016
Source: US National Vital Statistics System.
The annual trends in mortality from six major causes of infant death indicated generally downward trends in mortality from all causes, except for an upturn in mortality from unintentional injuries and a stable trend in mortality from prematurity/low birthweight in the past 2½ decades (Figure 7).2 Infant mortality from birth defects fell sharply and consistently from 361.4 deaths/100,000 live births in 1960 to 122.1 in 2016, at an annual rate of 2.2%. Although infant mortality from prematurity/low birthweight fell dramatically from 457.0 deaths/100,000 live births in 1960 to 83.6 in 1988, it showed a slightly upward trend between 1988 and 2016. SIDS mortality declined markedly from 152.5 deaths/100,000 live births in 1980 to 38.0 in 2016, at an annual rate of 4.3%. RDS mortality showed a rapid downward trend between 1972 and 2016, falling at an annual rate of 7.6%. During 1960-2016, infant mortality from pneumonia and influenza fell by 7.5% per year. Between 1998 and 2016, infant mortality from unintentional injuries increased by 62%.
Figure 7.
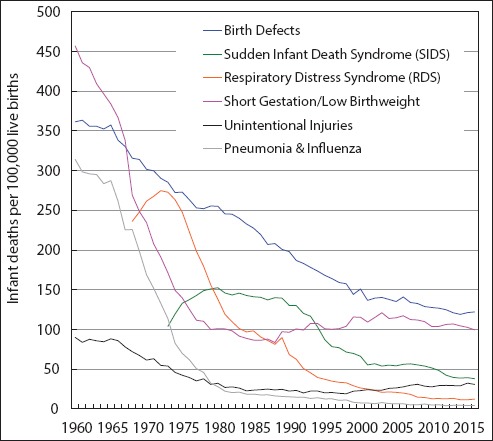
Trends in Infant Mortality from Major Causes of Death, United States,1960-2016
Source: US National Vital Statistics System
3.5. Trends in racial disparity in mortality from major causes of infant death
The black/white disparity in mortality from perinatal conditions increased consistently from 1970 through the early 1990s, but decreased slightly between 1993 and 2016. Compared to white infants, black infants had 2 times higher mortality from perinatal conditions in 1970, but a 2.6 times higher risk in 2016 (data not shown for brevity). Although infant mortality from birth defects showed a downward trend for both white and black infants, the pace of mortality decline was faster for white infants, leading to an increased racial disparity between 1970 and 2016. Black infants, whose mortality rate did not differ significantly from the white rate in 1970, had a 26% higher risk of birth defects mortality than white infants in 2016 (data not shown).
Infant mortality from pneumonia/influenza declined sharply for both white and black infants during 1970-2016. However, in 2016, black infants were still 3.1 times more likely to die from pneumonia/influenza than white infants. Between 1970 and 2016, mortality from unintentional injuries was more than halved for both white and black infants (data not shown).2 However, in 2016, the rate for black infants was 66.8 deaths from unintentional injuries per 100,000 live births, 2.7 times higher than the rate for white infants (24.9).
3.6. Widening educational disparities in infant mortality
Table 1 shows increasing educational disparities in infant mortality between 1986 and 2016. All education groups showed substantial declines in mortality, with the mortality rate for infants born to mothers with <12 years of education decreasing by 49% from 15.3 in 1986 to 7.8 deaths/1,000 live births in 2016. The rate for infants born to mothers with ≥16 years of education fell by 51% from 6.9 in 1986 to 3.3 deaths/1,000 live births in 2016.
Table 1.
Infant, Neonatal, and Postneonatal Mortality Rates per 1,000 Live Births by Maternal Education, Excess Mortality, and Index of Disparity, United States, 1986-2016
| Maternal education (years of schooling) | Infant deaths | Infant mortality rate | Neonatal deaths | Neonatal mortality rate | Post neonatal deaths | Post neonatal mortality rate | Educational gradient | |||||
|---|---|---|---|---|---|---|---|---|---|---|---|---|
| Infant mortality | Neonatal mortality | Postneonatal mortality | ||||||||||
| RR | 95% CI | RR | 95% CI | RR | 95% CI | |||||||
| Time period=1986 (number of births=2,906,066) | ||||||||||||
| <12 | 8,035 | 15.32 | 4,635 | 8.84 | 3,400 | 6.48 | 2.24 | 2.14─2.33 | 1.78 | 1.69─1.87 | 3.45 | 3.18─3.71 |
| 12 | 10,935 | 10.11 | 7,351 | 6.80 | 3,584 | 3.32 | 1.48 | 1.42─1.54 | 1.37 | 1.30─1.43 | 1.77 | 1.63─1.90 |
| 13-15 | 4,243 | 8.31 | 2,909 | 5.70 | 1,334 | 2.61 | 1.21 | 1.16─1.27 | 1.15 | 1.08─1.21 | 1.39 | 1.27─1.51 |
| 16+ | 3,014 | 6.85 | 2,188 | 4.97 | 826 | 1.88 | 1.00 | reference | 1.00 | reference | 1.00 | reference |
| All levels | 30,332 | 10.44 | 19,962 | 6.87 | 10,370 | 3.57 | ||||||
| Excess mortality (%) | 34.39 | 27.66 | 47.34 | |||||||||
| Relative Index of disparity | 48.14 | 32.34 | 90.03 | |||||||||
| Time period=1991 (number of births=4,111,059) | ||||||||||||
| <12 | 10,863 | 11.44 | 6,052 | 6.37 | 4,811 | 5.07 | 2.15 | 2.07─2.23 | 1.69 | 1.61─1.76 | 3.29 | 3.08─3.51 |
| 12 | 13,147 | 8.81 | 8,273 | 5.55 | 4,874 | 3.27 | 1.66 | 1.60─1.72 | 1.47 | 1.40─1.53 | 2.12 | 1.98─2.26 |
| 13-15 | 5,532 | 6.77 | 3,720 | 4.55 | 1,812 | 2.22 | 1.27 | 1.22─1.33 | 1.20 | 1.14─1.26 | 1.44 | 1.33─1.55 |
| 16+ | 3,825 | 5.32 | 2,718 | 3.78 | 1,107 | 1.54 | 1.00 | reference | 1.00 | reference | 1.00 | reference |
| All levels | 35,496 | 8.63 | 22,384 | 5.44 | 13,112 | 3.19 | ||||||
| Excess mortality (%) | 38.35 | 30.51 | 51.72 | |||||||||
| Relative Index of disparity | 51.97 | 33.93 | 96.43 | |||||||||
| Time period=1996 (number of births=3,892,133) | ||||||||||||
| <12 | 8,002 | 9.31 | 4,547 | 5.29 | 3,455 | 4.02 | 2.04 | 1.96─2.12 | 1.59 | 1.52─1.67 | 3.24 | 3.02─3.47 |
| 12 | 9,823 | 7.67 | 6,392 | 4.99 | 3,431 | 2.68 | 1.68 | 1.62─1.74 | 1.50 | 1.44─1.57 | 2.16 | 2.01─2.31 |
| 13-15 | 5,187 | 6.12 | 3,573 | 4.22 | 1,614 | 1.90 | 1.34 | 1.29─1.40 | 1.27 | 1.21─1.33 | 1.53 | 1.41─1.65 |
| 16+ | 3,867 | 4.56 | 2,814 | 3.32 | 1,053 | 1.24 | 1.00 | reference | 1.00 | reference | 1.00 | reference |
| All levels | 28,257 | 7.26 | 18,537 | 4.76 | 9,720 | 2.50 | ||||||
| Excess mortality (%) | 37.19 | 30.25 | 50.40 | |||||||||
| Relative Index of disparity | 51.64 | 34.19 | 98.39 | |||||||||
| Time period=2001 (number of births=4,026,323) | ||||||||||||
| <12 | 7,314 | 8.49 | 4,285 | 4.97 | 3,029 | 3.52 | 2.00 | 1.92─2.09 | 1.54 | 1.47─1.61 | 3.49 | 3.24─3.73 |
| 12 | 9,286 | 7.41 | 6,030 | 4.81 | 3,256 | 2.60 | 1.75 | 1.68─1.81 | 1.49 | 1.43─1.55 | 2.57 | 2.39─2.76 |
| 13-15 | 5,217 | 6.09 | 3,611 | 4.21 | 1,606 | 1.87 | 1.44 | 1.38─1.49 | 1.30 | 1.24─1.37 | 1.85 | 1.71─2.00 |
| 16+ | 4,237 | 4.24 | 3,228 | 3.23 | 1,008 | 1.01 | 1.00 | reference | 1.00 | reference | 1.00 | reference |
| All levels | 27,435 | 6.81 | 18,369 | 4.56 | 9,066 | 2.25 | ||||||
| Excess mortality (%) | 37.74 | 29.17 | 55.11 | |||||||||
| Relative Index of disparity | 54.66 | 33.28 | 122.77 | |||||||||
| Time period=2007 (number of births=4,316,233) | ||||||||||||
| <12 | 7,545 | 8.37 | 4,342 | 4.81 | 3,205 | 3.55 | 2.05 | 1.98─2.13 | 1.58 | 1.51─1.65 | 3.41 | 3.18─3.64 |
| 12 | 9,429 | 7.78 | 6,018 | 4.96 | 3,411 | 2.81 | 1.91 | 1.84─1.97 | 1.63 | 1.56─1.70 | 2.70 | 2.52─2.88 |
| 13-15 | 6,375 | 6.17 | 4,225 | 4.09 | 2,151 | 2.08 | 1.51 | 1.45─1.57 | 1.35 | 1.28─1.41 | 2.00 | 1.86─2.14 |
| 16+ | 4,548 | 4.08 | 3,391 | 3.04 | 1,157 | 1.04 | 1.00 | reference | 1.00 | reference | 1.00 | reference |
| All levels | 29,154 | 6.75 | 19,095 | 4.42 | 10,059 | 2.33 | ||||||
| Excess mortality (%) | 39.56 | 31.22 | 55.36 | |||||||||
| Relative Index of disparity | 61.76 | 38.98 | 127.88 | |||||||||
| Time period=2016 (number of births=3,945,875) | ||||||||||||
| <12 | 4,213 | 7.82 | 2,498 | 4.64 | 1,715 | 3.18 | 2.35 | 2.25─2.45 | 1.89 | 1.79─1.99 | 3.66 | 3.38─3.93 |
| 12 | 7,155 | 7.30 | 4,547 | 4.64 | 2,608 | 2.66 | 2.19 | 2.11─2.28 | 1.89 | 1.80─1.97 | 3.06 | 2.84─3.27 |
| 13-15 | 6,576 | 5.82 | 4,277 | 3.79 | 2,298 | 2.03 | 1.75 | 1.68─1.82 | 1.54 | 1.47─1.61 | 2.33 | 2.16─2.50 |
| 16+ | 4,145 | 3.33 | 3,062 | 2.46 | 1,083 | 0.87 | 1.00 | reference | 1.00 | reference | 1.00 | reference |
| All levels | 23,157 | 5.87 | 15,303 | 3.88 | 7,854 | 1.99 | ||||||
| Excess mortality (%) | 43.27 | 36.60 | 56.28 | |||||||||
| Relative Index of disparity | 82.21 | 57.83 | 151.15 | |||||||||
RR=rate ratio; CI=confidence interval. Source: National Linked Birth/Infant Death Data Sets, 1986-2001 Birth Cohorts, and 2007 and 2016 Period Files.
The index of inequality, summarizing the magnitude of disparities across four educational groups, shows an increasing overall disparity in infant mortality between 1986 and 2016, with the index score increasing from 48% in 1996 to 82% in 2016. The index also shows increasing educational disparities in neonatal and post-neonatal mortality over the same time period. The excess mortality estimates in Table 1 indicate that neonatal and post-neonatal mortality in 2016 would have declined by 37% and 56% if the mortality rate for all educational groups were the same as the rate for infants born to mothers with a college degree.
In 2016, relative risks (RRs) of mortality associated with maternal education indicate 135%, 119%, and 75% higher mortality risks for infants born to mothers with <12, 12, and 13-15 years of education than infants born to mothers with a college degree (Table 1). Relative educational disparities in infant, neonatal, and post-neonatal mortality were generally greater in 2016 than in 1986 although RRs of mortality associated with <12 years of education were generally similar over time. Educational differentials in post-neonatal mortality were greater than those in neonatal mortality. In 2016, the risk of post-neonatal mortality was 3.7 times greater for mothers with <12 years of education than for those with ≥16 years of education.
Educational gradients in infant mortality existed for all racial/ethnic groups, with IMRs varying from 2.9 for white and API mothers with a college degree to 13.4 for black mothers without a high school diploma (Figure 8). Educational gradients in post-neonatal mortality were marked for all racial/ethnic groups. Non-Hispanic white and API mothers without a high school diploma had 5.2 and 3.4 times higher post-neonatal mortality rates than their counterparts with a college degree, respectively.
Figure 8.
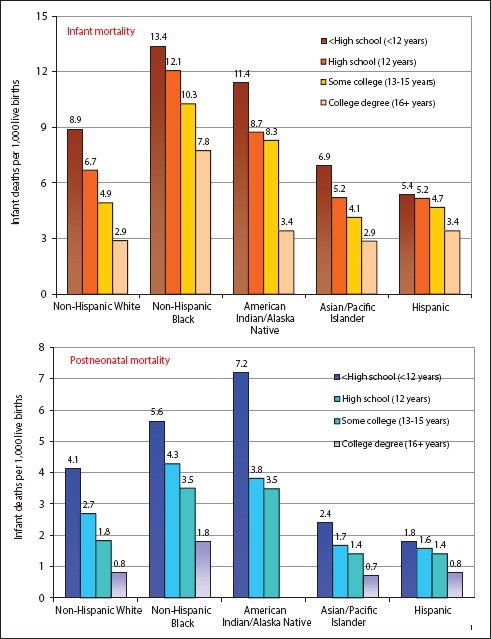
Maternal educational gradients in infant and postneonatal mortality by race/ethnicity, United States, 2016.
Notes: Educational gradients in infant and postneontal mortality rates for each racial/ethnic group were statistically significant at p<.01 using trend t-tests. The postneonatal mortality rate for infants born to American Indian/Alaska Native mothers with a college degree is not shown because of small number of deaths (<10).
Source: Data derived from the 2016 National Linked Birth/Infant Death Period File.
3.7. Widening geographic disparities in infant mortality
In 2015, the IMR varied considerably by state of residence, ranging from of 9.3/1,000 live births for Mississippi to 4.2 for New Hampshire and Iowa. DC and Mississippi had the highest IMRs (29.1 and 28.5, respectively) in 1970, with New Jersey having the lowest rate of 10.9. States in the Southeastern region had a substantially higher IMR than the rest of the US (Figure 9). Between 1970 and 2015, the IMR for each state declined by >50%. However, the state pattern in IMR has remained essentially the same over time. Coefficients of variation and relative indices of disparity show widening state-level disparities in IMR across time (data not shown).
Figure 9.
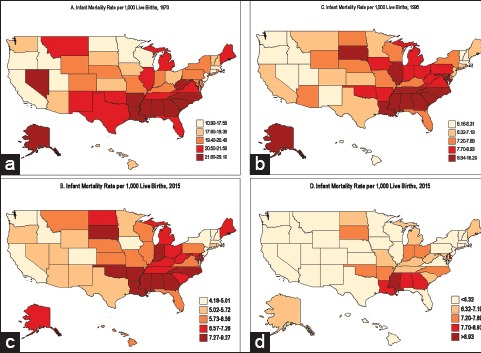
(a-d) State disparities in infant mortality, United States, 1970, 1995, and 2015
Trends by census regions show widening regional disparities in infant mortality (Figure 10). Southeast has the highest and New England and Pacific regions have the lowest IMRs. The rate of decline in infant mortality has been slower in the Southeast than in New England and Pacific regions, which has led to widening regional disparities in mortality over time. In 1970, compared to New England, the IMR was 10% higher in the East Northcentral region and 41% higher in the Southeast region. These disparities increased to 55% and 79% higher in 2016, respectively.
Figure 10.
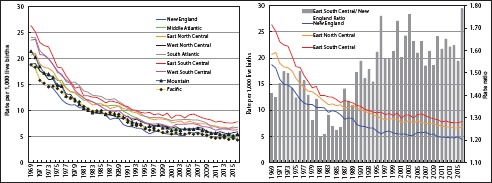
Trends in Infant Mortality by Geographic Region, United States, 1969-2016
Source: US National Vital Statistics System.
4. Discussion
Dramatic declines in infant mortality among all sociodemographic groups over the past century represent a remarkable public health achievement for the US.1,2,8 However, despite the impressive decline in overall infant mortality, three-to-five-fold racial/ethnic, socioeconomic, and geographic disparities in IMRs remain. Although infant mortality has declined in all educational groups over time, educational inequalities in infant mortality have increased in relative terms during the past three decades. The declines in infant mortality have been slower for the lower educational strata, the black population, and the Southeastern region, leading to widening socioeconomic, racial, and geographic disparities in infant mortality.
The current IMRs for many social groups and geographic areas fall short of the Healthy People 2020 target of 6.0 deaths/1,000 live births.5 The racial/ethnic groups falling short of the national target include blacks, AIANs, Hawaiians, Samoans, and Puerto Ricans. Many states, particularly those in the Southern region, such as Mississippi, DC, Alabama, Georgia, and Louisiana, face a formidable task of reducing their IMRs by 30-55% toward meeting the national target by 2020. Similarly, those in the lower educational strata (i.e., mothers with high school or lower education) will have to reduce their IMRs by 18-23% to meet the national target by 2020. In view of the recent slowdown of the decline in IMRs following several decades of consistent decline, efforts to reduce infant mortality must continue to target large socioeconomic, racial/ethnic, and geographic disparities that continue to exist.2
The pattern of educational disparities in US infant mortality over the past three decades is consistent with studies showing persistent social class inequalities in infant mortality in the UK between 1975 and 2001 and widening inequalities between 1994 and 2006.8,17-19 Inequalities in infant mortality based on area-based measures of deprivation or social disadvantage are substantial for the US, which have widened in the past three decades, a pattern similar to that for the UK and Europe.8,17-19 The social patterning of infant mortality is generally similar across industrialized countries, with socioeconomic inequalities persisting over time, particularly in post-neonatal mortality.7,8,17-19
A number of factors may have contributed to the persistent or widening inequalities in infant mortality reported here. Temporal inequalities in IMR may partly reflect persistent or widening disparities in material and social living conditions as well as differences in behavioral and healthcare factors among social groups and geographic areas.8 In the US, racial/ethnic groups vary greatly in their socioeconomic, demographic, medical, and healthcare characteristics that are associated with infant mortality.1,2,6 Poverty rates are at least two times higher among AIANs, blacks, Hispanics, and Native Hawaiians/other Pacific Islanders, and 15% higher among Asians compared with non-Hispanic whites.20,21 In terms of maternal education, 78% of Asian Indians and 77% of Koreans have a college degree, compared with 40% of non-Hispanic whites, 16% of blacks, 18% of Hawaiians, 15% of Puerto Ricans, 9% of Mexicans, and 7% of Samoans.22 Ethnic-minority children and adults in the US have lower rates of health insurance compared to non-Hispanic whites.20,21,23 In 2015, 6.3% of non-Hispanic whites lacked health insurance, compared with 11.0% of blacks, 20.7% of AIANs, 7.8% of Asians, and 9.9% of Hawaiians/other Pacific Islanders.20,21
AIANs, Hawaiians, and non-Hispanic whites have the highest rates of smoking during and before pregnancy, whereas women in all Asian groups have the lowest rates.22 Samoans, AIANs, blacks, and Hawaiians are significantly less likely to receive early prenatal care (first trimester of pregnancy) than whites and Asians. Conversely, Samoans, AIANs, and blacks are 2 to 3 times more likely to receive late (third trimester) or no prenatal care.8 Racial/ethnic disparities in these social determinants and behavioral risk factors have existed for several decades.6,24
Income differences among educational groups in the US have increased over time, both in absolute and relative terms. The mean earnings differential between those without a high school diploma and those with more than a bachelor’s education increased from $10,527 in 1975 to $67,631 in 2012, and the ratio of mean earnings increased from 2.7 in 1975 to 4.1 in 2012.8,25 There are strong educational gradients in smoking during pregnancy and prenatal care. Although rates of smoking during pregnancy have declined for all educational groups, they have declined faster for higher educational groups, leading to greater inequalities, as has been the case with smoking patterns in the general population.6,8,24 Compared with those with a college degree, women without a high school diploma were 7.1, 11.6, and 15.8 times more likely to smoke during pregnancy in 1992, 2001, and 2015, respectively.8,14,26,27 Educational disparities in prenatal care have persisted over the past three decades, with women without a high school diploma in 2015 almost 4 times more likely to receive delayed or no prenatal care than college graduates.14,24,27
Previous studies have attributed dramatic declines in IMRs over the long term to declines in mortality from pneumonia/influenza, birth defects, prematurity/low birthweight, RDS, SIDS, and injuries.1,2,8 Improvements in living conditions, advances in neonatal medicine and infant healthcare, reductions in smoking during pregnancy, and increased access to and use of prenatal care have been suggested as factors responsible for decreases in IMRs over the past several decades.1,2,8 During 1960-2016, steep declines in mortality from birth defects, prematurity/low birthweight, pneumonia/influenza, and infections might indicate the role of improved perinatal and neonatal medical care.1,2,8 However, birthweight-specific infant mortality analyses show a continuing gap in access to high-quality neonatal and infant healthcare across various social groups.8
Besides reductions in prenatal smoking and improved medical care, the US Title V Maternal and Child Health (MCH) Program since its inception in 1935 and Medicaid (a federally funded public insurance program for poor children and socially disadvantaged groups since 1965) have been mentioned as important federal programs in lowering IMRs and narrowing social inequalities in infant mortality and child health.8,21,28 Other federal programs such as the Healthy Start and Maternal, Infant, and Early Childhood Home Visiting Programs, which provide MCH services to underserved and socially disadvantaged populations across the US communities, may have also contributed to improvements in infant mortality and child health and in reducing related social inequalities.21,28
5. Conclusions and Global Health Implications
Social inequalities in US infant mortality rates have persisted and remained marked, with the disadvantaged racial/ethnic and socioeconomic groups and geographic areas experiencing substantially increased risks of mortality despite the declining trend in mortality over time. Widening social inequalities in infant mortality have been cited as a major factor contributing to the worsening international standing of the United States.1,2,8 Large and increasing disparities in infant mortality, particularly in recent decades, are contrary to the national health policy goal of reducing and eliminating health inequalities in the US and pose a significant barrier to further improvements in population health.5,8,21 Narrowing the gap in infant mortality might require policies that are not only aimed at improving access to and use of early and comprehensive prenatal care, reducing tobacco and alcohol use during pregnancy and other health risks such as pre-pregnancy obesity, gestational diabetes, and hypertension, but also at mitigating the effects of inequalities in material and social living conditions, the underlying determinants of health inequities in infant mortality.4,8,17,21
Key Messages.
During 1916-2017, the infant mortality rate declined dramatically for both black and white infants; however, racial disparities in mortality generally increased through 2000 due to a slower decline in mortality for black infants. In 2017, black infants had a 122% higher risk of infant mortality than white infants.
Detailed comparisons show an approximately five-fold difference in infant mortality among ethnic groups, with rates ranging from a low of 2.3 infant deaths per 1,000 live births for Chinese infants to a high of 8.5 for American Indian/Alaska Natives and 11.2 for black infants.
Infant mortality from major causes of death such as perinatal conditions, birth defects, sudden infant death syndrome, respiratory distress syndrome, and pneumonia and influenza showed a downward trend during the past 5 decades. However, there was a recent upturn in mortality from prematurity/low birthweight and unintentional injury.
Educational disparities in infant mortality widened between 1986 and 2016. Mothers with less than a high school education in 2016 experienced 2.4, 1.9, and 3.7 times higher risk of infant, neonatal, and post-neonatal mortality than those with a college degree. Geographic disparities were marked and widened across regions and states during 1969-2016, with states in the Southeast region having higher infant mortality rates than those in New England and Pacific regions.
Large and increasing disparities in infant mortality, particularly in recent decades, are contrary to the national health policy goal of reducing and eliminating health inequalities in the US and pose a significant barrier to further improvements in population health.
Acknowledgments
None. The views expressed are the authors’ and not necessarily those of the US Department of Health and Human Services or the Health Resources and Services Administration.
Footnotes
Financial Disclosure: None.
Funding/Support: None.
Conflicts of Interest: None.
Ethical approval: This study uses existing de-identified publicly available datasets and was deemed exempt.
References
- 1.Singh GK, Yu SM. Infant Mortality in the United States:Trends, Differentials, and Projections, 1950 through 2010. Am J Public Health. 1995;85(7):957–964. doi: 10.2105/ajph.85.7.957. [DOI] [PMC free article] [PubMed] [Google Scholar]
- 2.Singh GK, van Dyck PC. A 75thAnniversary Publication. Health Resources and Services Administration, Maternal and Child Health Bureau. Rockville, MD: US Department of Health and Human Services; 2010. Infant Mortality in the United States, 1935-2007:Over Seven Decades of Progress and Disparities. [Google Scholar]
- 3.World Health Organization. World Health Statistics 2016:Monitoring Health for the SDGs, Sustainable Development Goals. Geneva, Switzerland: WHO; 2016. [Google Scholar]
- 4.Singh GK, Kogan MD, Slifkin RT. Widening Disparities in Infant Mortality and Life Expectancy between Appalachia and the Rest of the United States, 1990-2013. Health Aff (Millwood) 2017;36(8):1423–1432. doi: 10.1377/hlthaff.2016.1571. [DOI] [PubMed] [Google Scholar]
- 5.US Department of Health and Human Services. Healthy People. 2020. http://www.healthypeople.gov/2020/default.aspx . [DOI] [PubMed]
- 6.National Center for Health Statistics. Health, United States, 2015 with Special Feature on Racial and Ethnic Health Disparities. Hyattsville, MD: US Department of Health and Human Services; 2016. [PubMed] [Google Scholar]
- 7.OECD. Health at a Glance 2017:OECD Indicators. Paris, France: Organisation for Economic Co-operation and Development (OECD); 2017. [Google Scholar]
- 8.Singh GK, Kogan MD. Persistent Socioeconomic Disparities in Infant, Neonatal, and Postneonatal mortality in the United States, 1969-2001. Pediatrics. 2007;119(4):e928–e939. doi: 10.1542/peds.2005-2181. [DOI] [PubMed] [Google Scholar]
- 9.Grove RD, Hetzel AM, Ventura S. National Center for Health Statistics. Washington, DC: US Department of Health, Education, and Welfare; 1968. Vital Statistics Rates in the United States, 1940-1960. [Google Scholar]
- 10.Xu JQ, Murphy SL, Kochanek KD, Bastian B, Arias E. Deaths:Final Data for 2016. Natl Vital Stat Rep. 2018;67(5):1–76. [PubMed] [Google Scholar]
- 11.Murphy SL, Xu JQ, Kochanek KD, Arias E. Mortality in the United States, 2017. NCHS Data Brief. 2018;328:1–8. [PubMed] [Google Scholar]
- 12.National Center for Health Statistics. National Vital Statistics System, Mortality Multiple Cause-of-Death Public Use Data File Documentation. Hyattsville, MD: US Department of Health and Human Services; 2018. http://www.cdc.gov/nchs/nvss/mortality_public_use_data.htm . [Google Scholar]
- 13.Mathews TJ, MacDorman MF. Infant Mortality Statistics from the 2013 Period Linked Birth/Infant Death Data Set. Natl Vital Stat Rep. 2015;64(9):1–30. [PubMed] [Google Scholar]
- 14.National Center for Health Statistics. User Guide to the 2016 Period Linked Birth/Infant Death Public Use File. Hyattsville, MD: Centers for Disease Control and Prevention, US Department of Health and Human Services; 2018. ftp://ftp.cdc.gov/pub/Health_Statistics/NCHS/Dataset_Documentation/DVS/periodlinked/LinkPE16Guide.pdf . [Google Scholar]
- 15.Ventura S The U.S. National Vital Statistics System:Transitioning into the 21st Century, 1990-2017. National Center for Health Statistics. Vital Health Stat. 2018;1(62) [PubMed] [Google Scholar]
- 16.Pearcy JN, Keppel KG. A Summary Measure of Health Disparity. Public Health Rep. 2002;117(3):273–280. doi: 10.1016/S0033-3549(04)50161-9. [DOI] [PMC free article] [PubMed] [Google Scholar]
- 17.Department of Health. Tackling Health Inequalities:10 Years On. London, UK: Health Inequalities Unit, Department of Health; 2009. [Google Scholar]
- 18.Weightman AL, Morgan HE, Shepherd MA, Kitcher H, Roberts C, Dunstan FD. Social Inequality and Infant Health in the UK:Systematic Review and Meta-Analyses. BMJ Open. 2012;2:e000964. doi: 10.1136/bmjopen-2012-000964. [DOI] [PMC free article] [PubMed] [Google Scholar]
- 19.Dummer TJB, Parker L. Changing Socioeconomic Inequality in Infant Mortality in Cumbria. Arch Dis Child. 2005;90(2):157–162. doi: 10.1136/adc.2003.036111. [DOI] [PMC free article] [PubMed] [Google Scholar]
- 20.US Census Bureau. The American Community Survey. Washington, DC: US Census Bureau; 2018. http://www.census.gov/acs/www/ [Google Scholar]
- 21.Singh GK, Daus GP, Allender M, Ramey CT, Martin EK, Perry C, et al. Social Determinants of Health in the United States:Addressing Major Health Inequality Trends for the Nation, 1935-2016. Int J MCH AIDS. 2017;6(2):139–164. doi: 10.21106/ijma.236. [DOI] [PMC free article] [PubMed] [Google Scholar]
- 22.Singh GK, Siahpush M, Liu L, Allender M. Racial/Ethnic, Nativity, and Sociodemographic Disparities in Maternal Hypertension in the United States, 2014-2015. Int J Hypertens. 2018 May;:17. doi: 10.1155/2018/7897189. DOI:10.1155/2018/7897189. [DOI] [PMC free article] [PubMed] [Google Scholar]
- 23.Singh GK, Lin SC. Marked Ethnic, Nativity, and Socioeconomic Disparities in Disability and Health Insurance among US Children and Adults. [Epub 22 Oct 2013];Biomed Res Int. 2013 :1–17. doi: 10.1155/2013/627412. DOI:10.1155/2013/627412. [DOI] [PMC free article] [PubMed] [Google Scholar]
- 24.National Center for Health Statistics. Health, United States, 1998 with Socioeconomic and Health Chartbook. Hyattsville, MD: US Department of Health and Human Services; 1998. [Google Scholar]
- 25.Ryan CL, Bauman K Educational attainment in the United States, 2015. Current Population Reports. No. P20-578. Washington, DC: US Census Bureau; 2016. https://www.census.gov/data/tables/2016/demo/education-attainment/cps-detailed-tables.html . [Google Scholar]
- 26.Ventura SJ, Martin JA, Taffel SM, Mathews, Clarke SC. Advance Report of Final Natality Statistics, 1992. Monthly Vital Stat Rep. 1994;43(5 Supplement):1–88. [PubMed] [Google Scholar]
- 27.Martin JA, Hamilton BE, Osterman MJK, Driscoll AK, Mathews TJ. Births:Final Data for 2001. Natl Vital Stat Rep. 2002;51(2):1–102. [PubMed] [Google Scholar]
- 28.Health Resources and Services Administration. Maternal and Child Health. Programs and Initiatives. Rockville, Maryland: https://mchb.hrsa.gov/maternal-child-health-initiatives/mchb-programs . [Google Scholar]


