Abstract
The laboratory rat, Rattus norvegicus, is an important model of human health and disease, and experimental findings in the rat have relevance to human physiology and disease. The Rat Genome Database (RGD, http://rgd.mcw.edu) is a model organism database that provides access to a wide variety of curated rat data including disease associations, phenotypes, pathways, molecular functions, biological processes and cellular components for genes, quantitative trait loci, and strains. We present an overview of the database followed by specific examples that can be used to gain experience in employing RGD to explore the wealth of functional data available for the rat.
Keywords: Rat, Database, Quantitative trait locus, Ontology, Genomics, Gene
1. Introduction
The Rat Genome Database (RGD) provides the scientific community with a public source for a variety of information related to the laboratory rat (http://rgd.mcw.edu) [1]. RGD incorporates manually curated data and information obtained through electronic resources into a comprehensive and dynamic database containing information on genes, strains, quantitative trait loci (QTLs), simple sequence length polymorphisms (SSLPs), sequences, maps, cell lines, and orthologs, all with supporting references. RGD also provides a collection of visualization and analysis applications to assist researchers in effectively utilizing the information available in the database. This integration of manually curated data with electronically imported data obtained from major public data repositories (e.g., NCBI, UniProt), combined with diverse analysis tools, makes RGD a uniquely valuable resource to the scientific community.
This chapter focuses on the disease, phenotypic, genomic, and functional information that is available in the database and the RGD tools available to analyze that information. An overview of the RGD home page will be presented, followed by sections on search functions, report pages, data portals, and tools for analysis and visualization.
2. Navigating the RGD Home Page
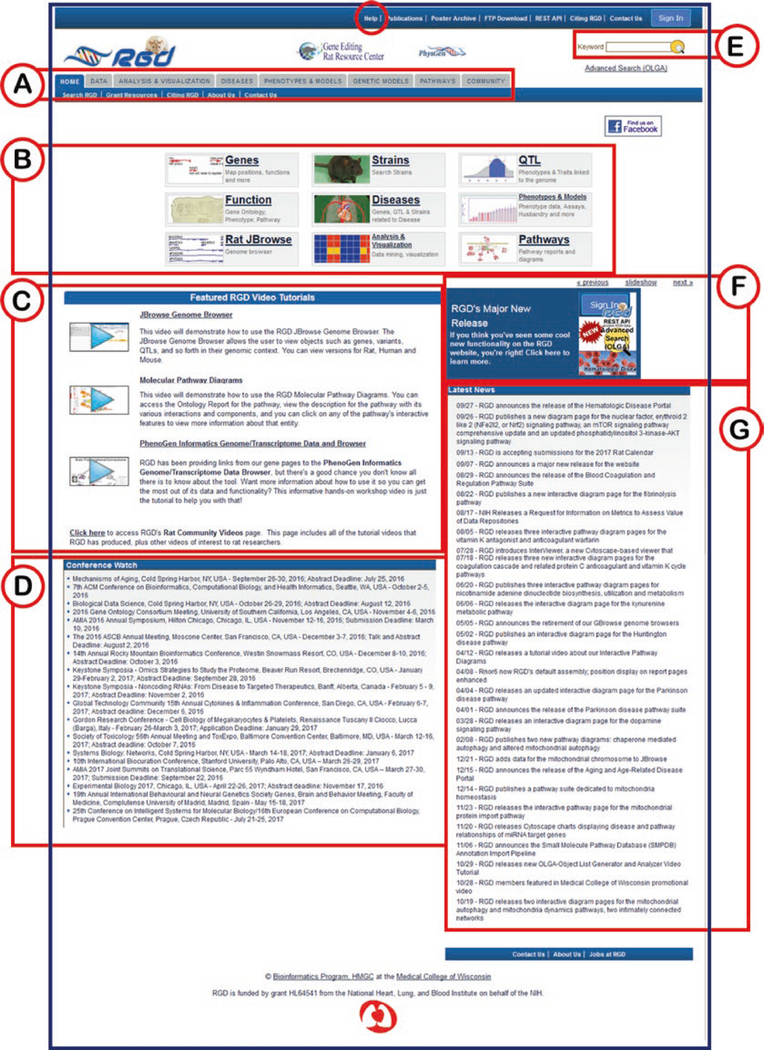
The RGD home page at http://rgd.mcw.edu/ provides entry points to all the basic resource categories in RGD (Fig. 1). Resource categories are arranged on tabs at the top of the page and are divided into the seven major areas of the RGD web site: Data, Analysis and Visualization, Diseases, Phenotypes & Models, Genetic Models, Pathways, and Community (Fig. 1A). Each tab provides quick access to the corresponding section of the RGD web site. Expanded data and tool links are also available in the center of the home page (Fig. 1B). Note that the Keyword Search text box (Fig. 1E) is located in the top right corner of most RGD pages.
Fig. 1.
The RGD home page. (A and B) Tabs and links to all of the data and analysis tools at RGD are found here. (C) Links to RGD video tutorials. (D) Links to websites of scientific conferences relevant to RGD users. (E) Keyword search text box. (F) Rotating news banner. (G) Chronological list of news items. Red circle at top of page indicates link to help page
Other features of the home page include:
Below and left of center is a section containing links to RGD video tutorials (Fig. 1C), which provide general introductions to various analysis tools and sections of the RGD web site.
The bottom left portion of the home page has a list of upcoming conferences which may be of interest to RGD users (Fig. 1D). Each line in the list is a link to the home page of that particular conference.
Below and right of center is the RGD home page revolving banner (Fig. 1F), which announces new information and features at RGD. Each banner item is linked to information about, or an example of, what is described in the item. Below the banner is a chronological list of news items that appear or have previously appeared on the revolving banner (Fig. 1G). All of the listed items are hyperlinked to the corresponding web page.
At the top of the home page and most RGD pages, a link to the help pages can be found as the first choice on the left side of the menu bar (Fig. 1). The home page for RGD help lists many links to individual help pages for data pages, tool pages, portal pages, and a glossary of terms used throughout the site.
2.1. Using the RGD Search Functions
The RGD web site has a number of ways to search for data, depending on the scope of the specific information desired. The keyword search text box, available in the upper right-hand corner of most RGD web pages (Fig. 1E), provides a fast way to get at specific data, such as gene or QTL information, when a name, keyword, or accession number is known. It searches across most object types (genes, QTLs, strains, homologs, SSLPs, ESTs, and references) and many data types. It also searches the many controlled vocabularies used at RGD, including the gene ontology (biological process, molecular function, and cellular component), mammalian phenotype ontology, human phenotype ontology, pathway ontology, and disease vocabulary. Also, one can search specific object types and ontologies directly.
2.1.1. Performing an Object-Specific Search
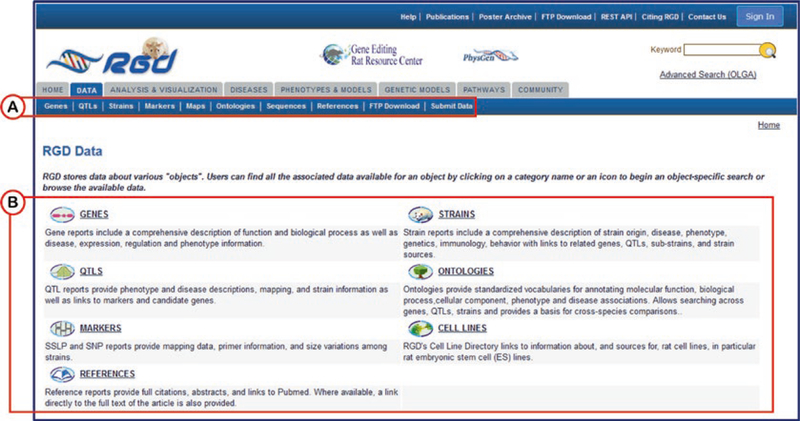
To perform an object-specific search the Data tab under the RGD logo of any RGD web page is selected to access the “Data” page (Fig. 2).
Fig. 2.
The RGD Data page. Specific data types are selected by clicking a link on the menu bar (A) under the tabs or by clicking an icon/term from the middle of the page (B)
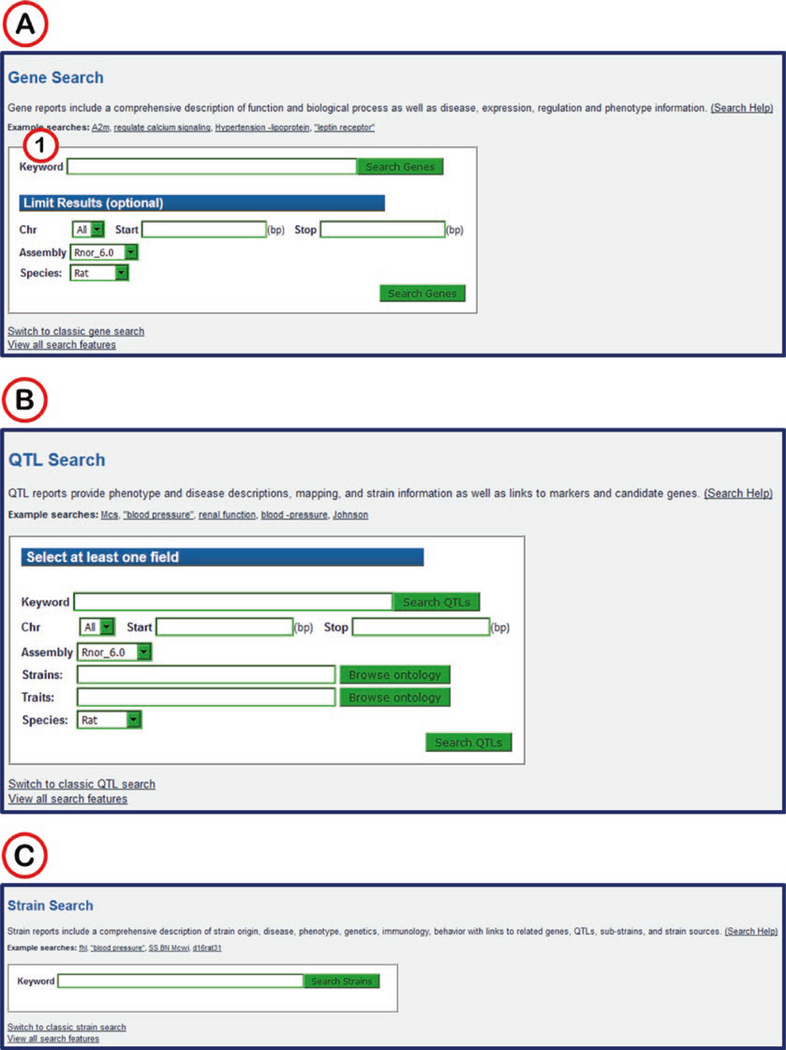
A data type is selected by clicking the data name or adjacent icon. For example if “GENES” is selected, a new page is returned for gene-specific searches (Fig. 3A). On all object search pages and the ontology search home page, there are “example searches” above the main keyword search box. These examples are hyperlinked words which are provided as sample searches.
A “Keyword” search box on the left side of the gene search page is used with a selection of options to limit the results (Fig. 3A1).
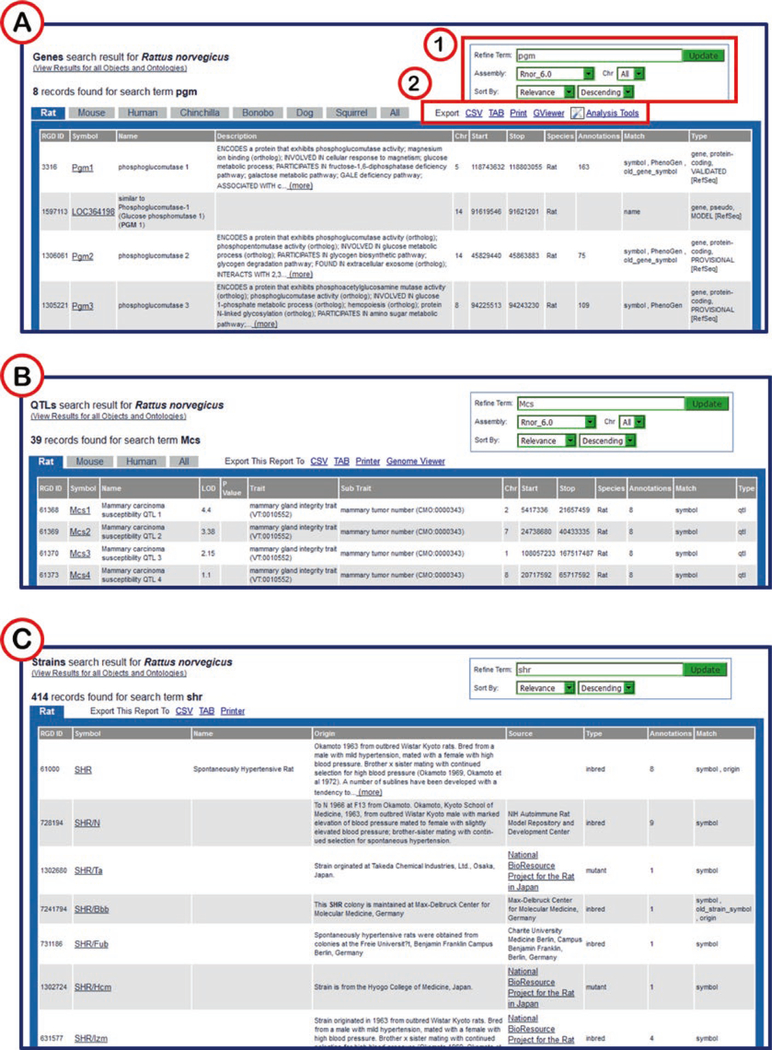
On the gene results page the entries are listed by species, with rat as the default display (Fig. 4A). If it is desirable to view gene lists in other species, the “Mouse,” “Human,” “Chinchilla,” “Bonobo,” “Dog,” “Squirrel,” or “All” tab at the top of the gene list may be selected.
The results can be sorted alphabetically or numerically on any column. To sort by chromosome, select “Chr” in the first “Sort By” drop-down menu and “Descending” or “Ascending” in the second drop-down menu on the upper right side of the results page (Fig. 4A1).
To download the results to an Excel or other type of file, click the “CSV” or “TAB” link at the top of the results list (Fig. 4A2).
To print the results or to view the results in RGD’s GViewer tool, click the “Printer” or “Genome Viewer” link, respectively, also at the top of the results list.
Clicking “Other Analysis Tools” opens a pop-up window with multiple options to analyze the gene list in various tools at RGD.
To display a certain gene report page, select that gene record by clicking the symbol, which is hyperlinked to the gene report page.
Fig. 3.
Object-Specific Search Pages. (A) Gene Search with free text search box (1) and limiting options underneath the text box. (B) QTL search with multiple text box options for searching. (C) Strain Search with keyword search box
Fig. 4.
Object-Specific Results Pages. (A) Genes search results. (1) Search editing and sorting options. (2) Data export options. (B) QTL results page. (C) Strains result page
The QTL and strain searches (Fig. 3B, C) and search results pages (Fig. 4B, C) work much the same way as the gene search/ results pages. While rat, mouse, and human QTLs are available at RGD, the strain data availability is restricted to rat.
2.1.2. Using the Ontology Search
The ontology/vocabulary browser can be accessed via the “Function” icon on the RGD home page, and from the menu bar via the “Ontologies” link in the data list of the Data page (http://rgd.mcw.edu/wg/data-menu) (Fig. 2). Any of the 20 ontologies/vocabularies can be browsed from the top node by clicking the appropriate name in the list on the Ontologies page.
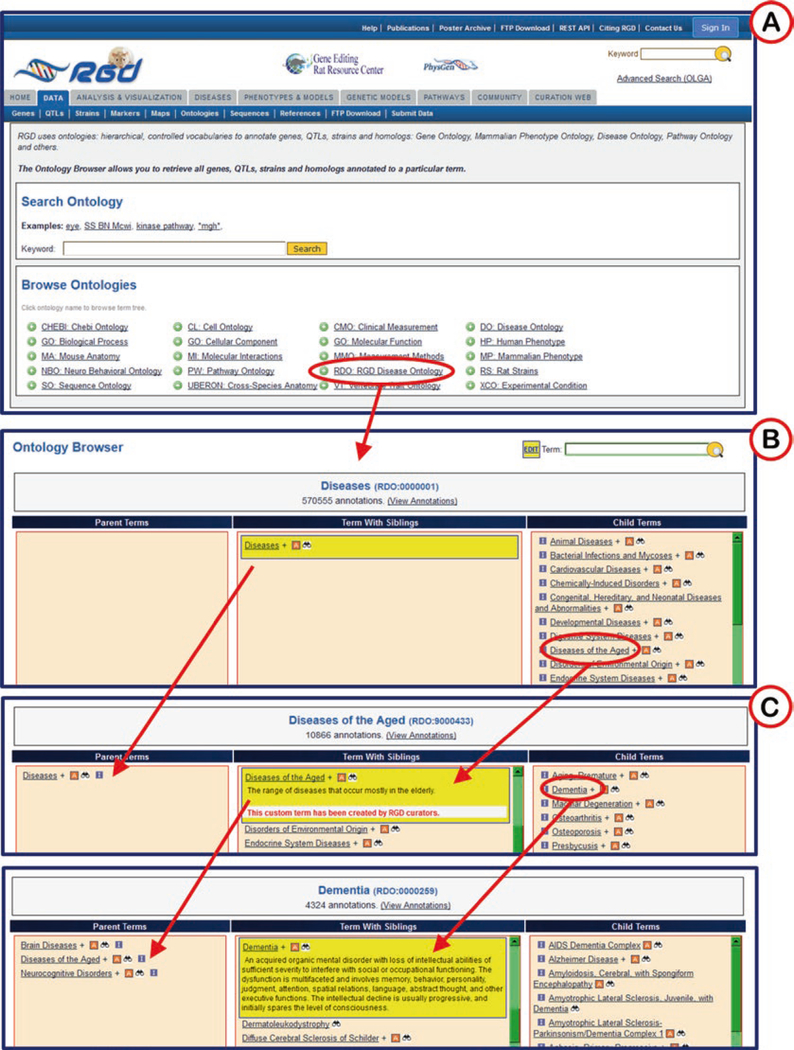
Clicking on an ontology/vocabulary opens the browser with three horizontal frames listing parent terms, selected term with siblings, and child terms (Fig. 5A, B).
When each term is clicked, it moves to the center column with its siblings and the adjacent columns refresh to show parent terms to the left and child terms to the right (Fig. 5B–D). This allows easy navigation of the ontology in both directions, with three levels of terms being visible at all times. An “A” icon to the right of a term means that gene annotations for that term exist in RGD, and clicking on the “A” icon takes the user to the ontology report page for that specific term.
Fig. 5.
Ontology Term Browser. The RGD Disease Ontology is selected (indicated by red oval) in (A), followed by selection of terms “Diseases of the Aged” in (B) and “Dementia” in (C). Red arrows show movement of terms from one column to another when a term is selected
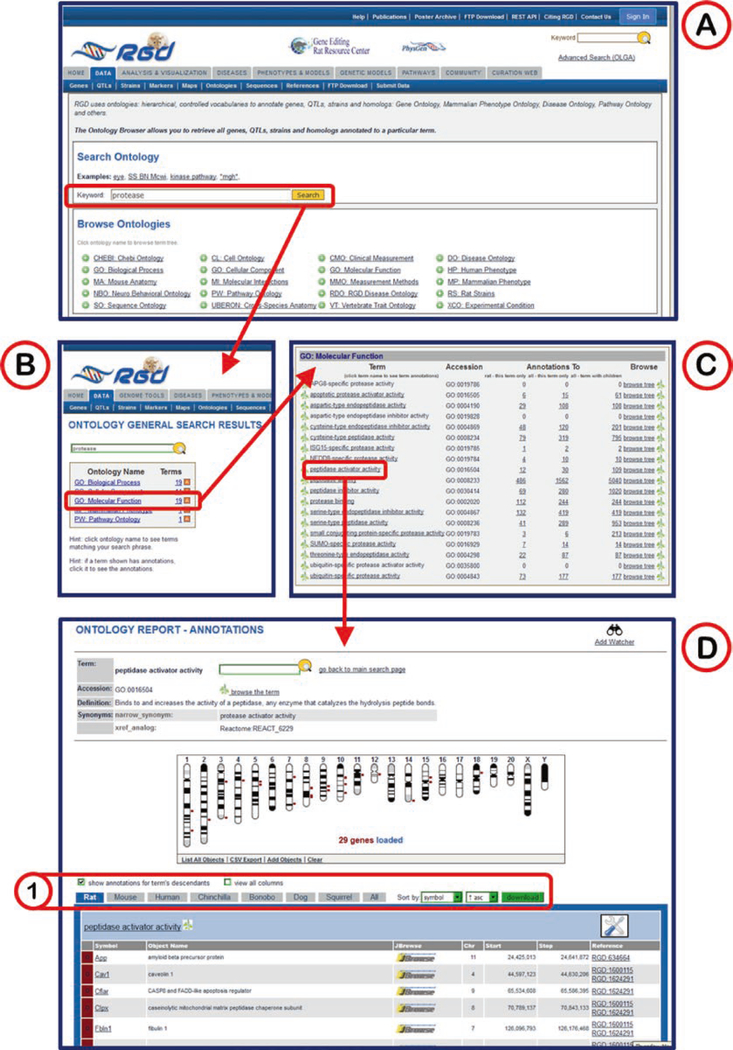
Another option to find ontology/vocabulary terms is by using the keyword search in the middle of the ontology search page (Fig. 6A).
Any searched entry will lead to a results page with a box showing an “Ontology Name” column which lists all ontologies with terms which at least partially match the query term and a “Terms” column which lists the number of matching terms in each ontology (Fig. 6B).
Clicking any ontology in the list returns a list of all the terms in that ontology which contain the query term (Fig. 6C). An underlined term means that annotations exist in RGD for that term. Additional columns in the table include accession ID number, a count of annotations to the term and its children, and links (“browse tree” and “branch” icons) to the ontology browser.
The term results list provides access to either the term browser (Fig. 5) or the ontology report page with all annotations listed for that term (Fig. 6D).
Fig. 6.
Ontology General Search. (A) Ontology home page with keyword search indicated (red box). (B) General search results across all listed ontologies/vocabularies for “protease.” (C) Detailed list of Molecular Function terms matching the searched word. Clicking on any term in the list links to the ontology report page for that term. (D) The ontology report page for “peptidase activator activity.” The top of the page defines the ontology term, lists synonyms, and provides external database links, followed by a GViewer display of all the genes annotated to the ontology term. Below the GViewer display is a list of all genes annotated to the term and its child terms. (1) Species-specific tabs and sorting controls for the list are indicated in red box
Ontology term report pages feature definitions, synonyms, and annotations across all data types made to the specific term and its child terms.
1. A visual display of annotated objects is presented in a genome viewer (GViewer) (Fig. 6D) which illustrates the genomic location of each gene or other data object. The approximate location of genes, QTLs, and congenic segments are shown in an ideogrammic view of chromosomes.
2. The species tabs underneath the GViewer access separate lists of annotated rat, mouse, human, or other species genes (Fig. 6D1). Above the species tabs is a check box to display genes annotated to the ontology term or both the term and its child terms. There are also two drop-down menus for sorting the annotation gene list by any of its columns, a download button, and a check box for an expanded view. The Symbols, JBrowse links, Evidence source, and Reference IDs in the gene list are all hyperlinked to relevant information at RGD and at external databases.
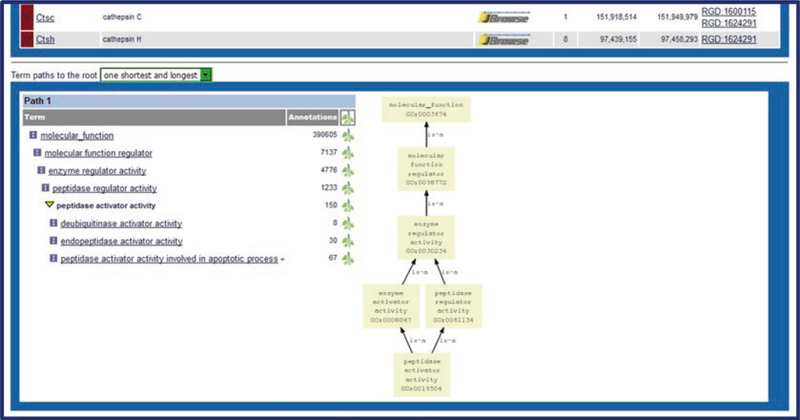
3. The bottom of the page shows a conventional, vertical view and a graph representation (Fig. 7) of the branch of the ontology where the selected term resides. Clicking on a branch icon next to the annotation count for any of the listed terms accesses the main RGD ontology term browser.
Fig. 7.
Bottom of Ontology Report Page. Underneath the annotated object list are text and graph representations of the ontology branch(s) containing the selected term
2.2. Data-Specific Report Pages
RGD data report pages compile all of the curated data for the specific object: gene, QTL, variant, or strain. For example, click on one of the annotated genes in the rat species tab (Fig. 6D).
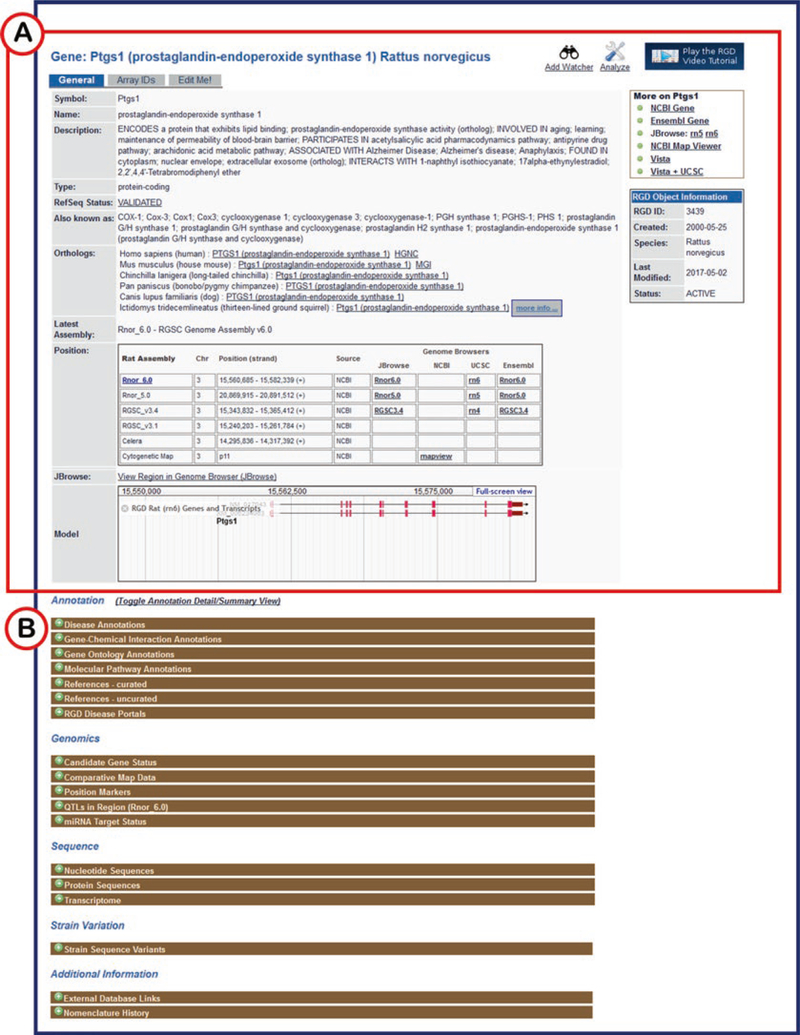
RGD report pages contain many of the same elements regardless of the data type. These include official nomenclature for the object, annotations in the form of both ontology terms and free-text notes, and links to related information in other databases. In addition, reports for genomic and genetic data types include information on mapping and a link to various genome browsers to permit viewing of the object in its genomic context (Fig. 8A).
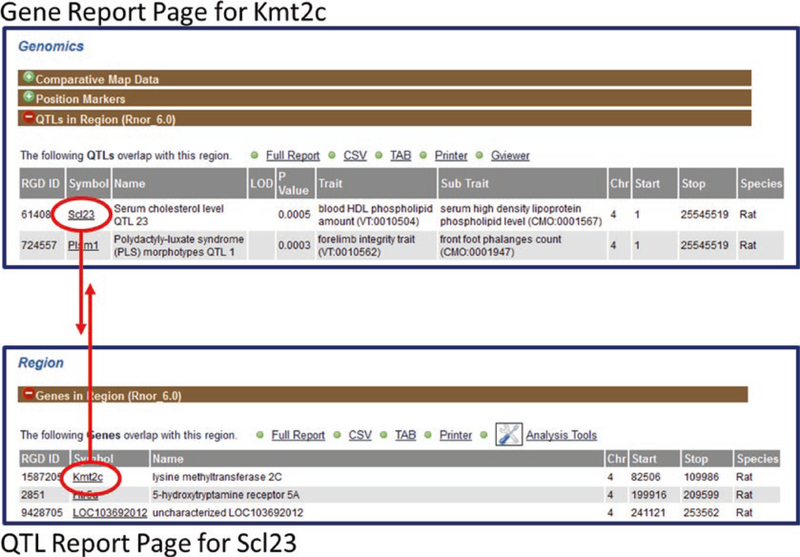
Some of the data elements are reciprocally linked to information of other data types. A link on a gene report page, for instance, will lead to a QTL report page which will, in turn, link back to the gene (Fig. 9).
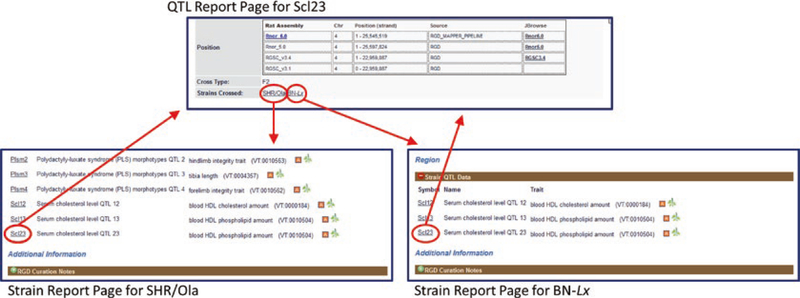
Typically, a QTL will be defined by the cross of two strains. The source strain(s) of a QTL are listed with hyperlinked symbols in the general information section of a QTL report page. Those links lead to the report pages for the respective strains (Fig. 10). Reciprocally, the QTLs that are derived from a particular strain are listed in the “Strain QTL Data” section of the strain report page. Those listed QTLs are linked back to the appropriate QTL report page.
Fig. 8.
Gene Report Page for Rat Ptgs1. (A) The top half of the page contains general information, ortholog assignments, genomic positions, JBrowse model, and links to external sites. (B) The bottom half of the page has annotations in various categories, genomic information, sequence information, and more, all in expandable, labeled bars
Fig. 9.
Reciprocal Links between Gene and QTL Report Pages. The rat gene Kmt2c is located within the QTL Scl23. The Scl23 link in the “QTLs in Region” section connects (downward arrow) to the report page for Scl23. Reciprocally, the Kmt2c link in the “Genes in Region” section of the Scl23 QTL report page connects (upward arrow) to the report page for Kmt2c
Fig. 10.
Reciprocal Links between QTL and Strain Report Pages. The rat QTL Scl23 was generated by crossing rat strains SHR/Ola and BN-Lx (marked by red ovals). The symbols listed as “Strains-Crossed” on the QTL page link to the strain pages (downward arrows). The QTL symbol “Scl23” is found on both strain pages in the “Strain QTL Data” sections (red ovals). The QTL symbols link to the QTL report page (upward arrows)
3. Data Portals in RGD
There are particular types of data at RGD that are presented in their own sections of the web site called “portals.” Disease information is currently divided into 11 different “portals,” separated by disease category. Phenotype data is accessible through the “Phenotypes & Models” portal, which includes quantitative PhenoMiner data, strain medical records, and more. Finally, the pathway portal contains both molecular pathway and physiological pathway diagrams. Whereas the physiological pathways are limited to a few interactive diagrams, the pathway portal currently has 200 interactive molecular pathway diagrams across five nodes (classic metabolic pathway, signaling pathway, regulatory pathway, disease pathway, and drug pathway) of the Pathway Ontology. Related pathway diagrams are organized in “suites” and “suite networks.”
Access to the portals is provided by the tabs at the top of most RGD web pages and by the icons in the middle of the RGD home page. In addition disease portals may be accessed by icons found in the “RGD Disease Portals” section of the “Annotation” portion of gene, QTL, and strain report pages. Also, pathway diagrams may be accessed directly from the appropriate term entry in the RGD ontology term browser and from the ontology report page of the appropriate pathway term.
3.1. Disease Portals
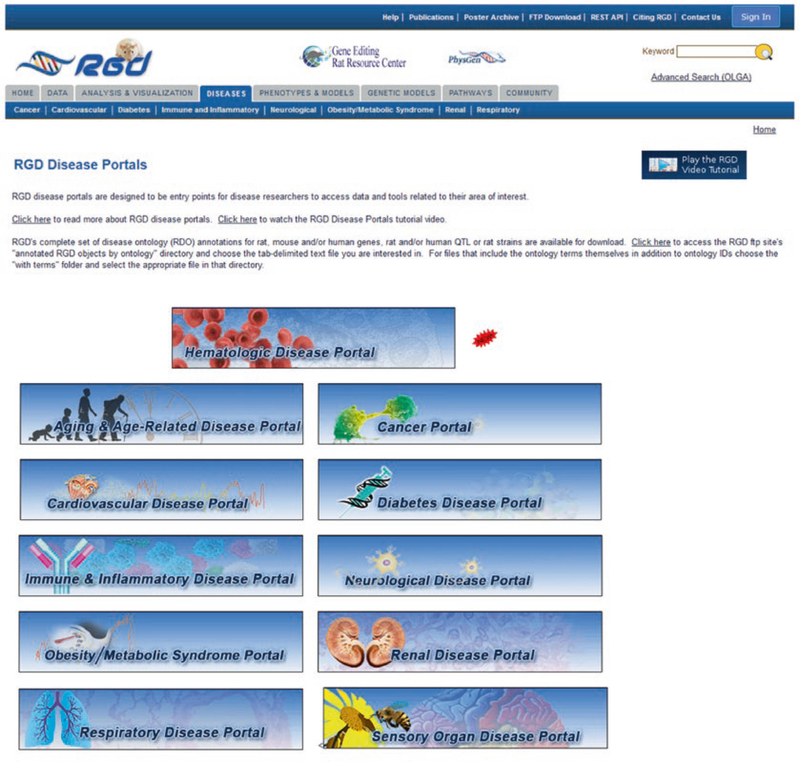
The RGD Disease Portals home page (Fig. 11) has icons that link to the individual disease portals. RGD maintains a growing list of disease portals, each designed to be an entry point for researchers to access consolidated data and tools related to a particular category of disease.
Fig. 11.
Disease Portals Home Page. Icons for all current disease portals are shown here. All icons link to their respective portals
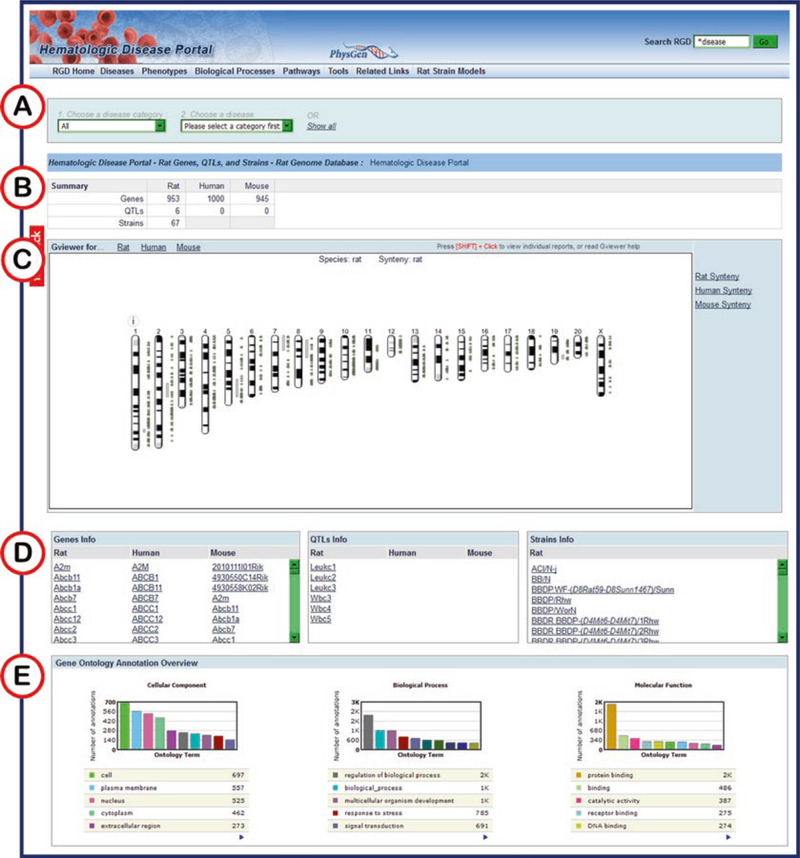
On a portals main page disease terms can be selected by the use of two drop-down menus (Fig. 12A) and the count of objects annotated to the selected disease(s) are summarized in a matrix below the drop-down menus (Fig. 12B).
Directly below the matrix summary is an ideogrammic view of chromosomes (an instance of GViewer) of all the annotated objects in their approximate chromosomal locations. The chromosome view is interchangeable between rat, mouse, and human, with an option to view one species synteny while viewing the primary species.
Below the GViewer are scrollable lists of the annotated objects: genes, QTLs, and strains.
Finally, at the bottom of the page are enrichment charts for GO terms annotated to all the rat genes in the disease list.
Fig. 12.
Hematologic Disease Portal Home Page. (A) Drop-down menus for selection of disease category and specific disease. (B) Numerical summary of results for the selected disease category/disease. (C) GViewer display of results with approximate positions of all genes, QTLs, and strains. (D) Lists of genes, QTLs, and strains annotated to selected disease category/disease. (E) Enrichment charts showing Gene Ontology annotations for all selected disease-annotated genes
In addition to disease-related genes, QTLs and strains, RGD’s disease portals contain sections for Phenotypes, Biological Processes and Pathways related to the disease category covered by that portal. The data for those categories are accessed and presented in the same way as the disease data. These other data categories, along with links to tools and related information, are accessed via the menu tabs along the top of each portal page (Fig. 12).
3.2. Phenotypes & Models Portal
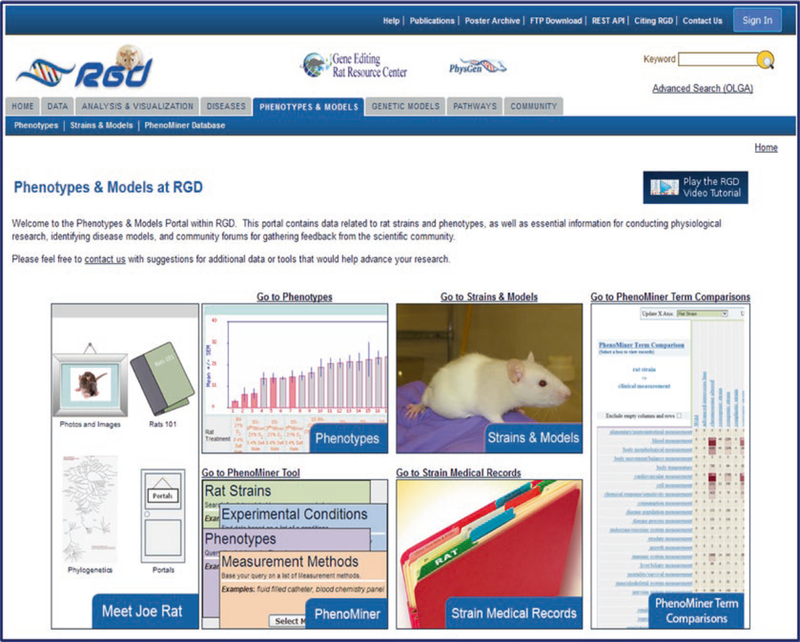
The Phenotypes & Models Portal contains data related to rat strains and phenotypes, as well as essential information for conducting physiological research, identifying disease models, and community forums for gathering feedback from the scientific community. The various sections of the portal have icons on the portal home page linking to the respective data or tools (Fig. 13).
Fig. 13.
Phenotypes & Models Home Page
“Meet Joe Rat” has general information about the phylogenetics of the laboratory rat, laboratory techniques using rat, strain availability from vendors, and data submission.
The “Phenotypes” section is another way to access data from the Program for Genomics Applications (PGA) project (a large scale phenotyping project which has collected data for consomic, ENU mutant, and knock-out rat strains) (http://pga.mcw.edu). In this case static tables of data are available by multiple links based on type of physiological data.
“Strain Medical Records” contains the same data as “Phenotypes,” but with a strain-specific view.
“PhenoMiner” is a link to the quantitative phenotype tool to be described later.
The “Strains & Models” section is a hub to access any of the rat strain information at RGD, including strain search, strain commercial availability, disease models, animal husbandry, and links to outside sources of information.
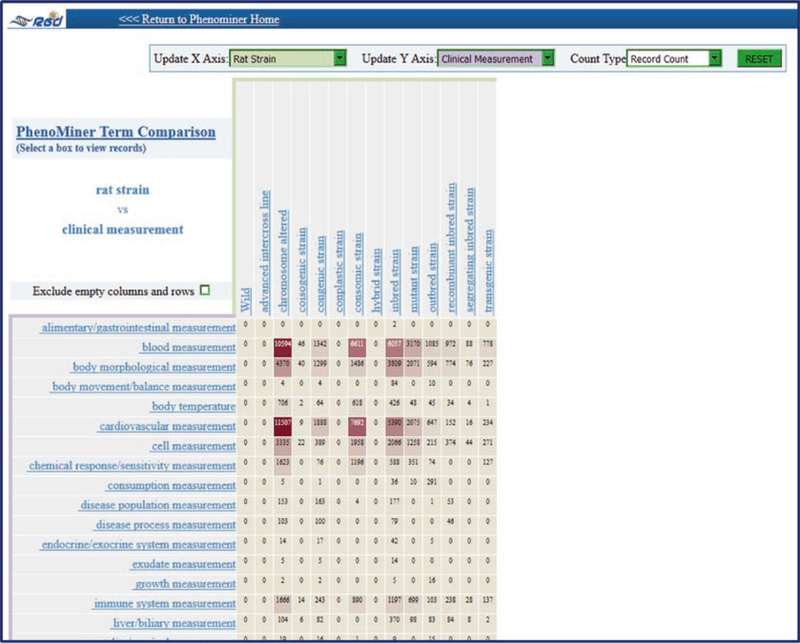
The final icon on the Phenotypes & Models home page is “PhenoMiner Term Comparisons”. This accesses a tool similar to the heat map in the Gene Annotator (GA; see Subheading 4.5) tool, with the default view being rat strain on one axis and clinical measurement on the other axis (Fig. 14). The heat map is interactive with the axes changeable via drop-down menu and by clicking on terms on the axes to access child terms. Clicking any numbered square in the heat map accesses that data in PhenoMiner.
Fig. 14.
PhenoMiner Term Comparisons Default Page
3.3. Pathway Portal
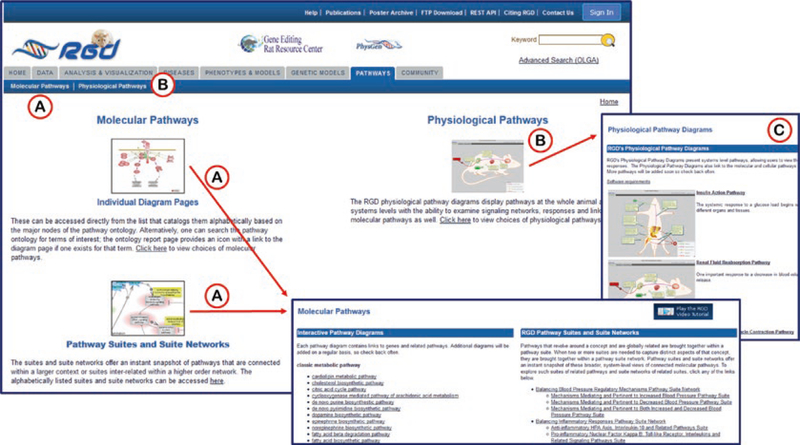
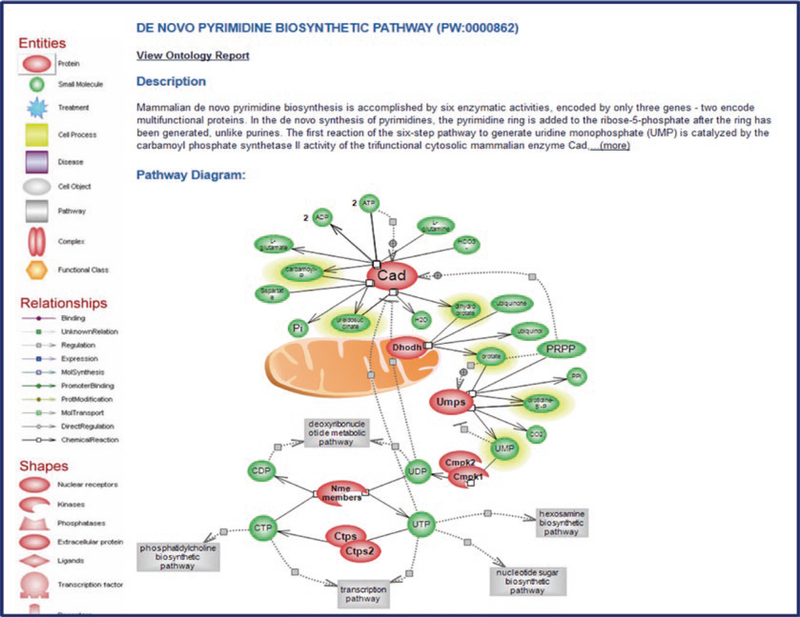
The home page of the pathway portal provides access to the list of molecular pathway diagrams via two separate icons (“Individual Diagram Pages” and “Pathway Suites and Suite Networks”) (Fig. 15) and to the list of physiological pathway diagrams (Fig. 15C) via its own icon. Both diagram list pages are also accessible by the links at the top of the page under the “Pathways” tab. The molecular pathway diagrams (Fig. 16) are designed with Elsevier’s Pathway Studio software (http://support.pathwaystudio.com/) and feature hyperlinks from most of the objects in the diagram to RGD pages representing the respective term, gene, chemical, or associated secondary pathway. Beneath the diagrams on the molecular pathway pages are several lists:
Fig. 15.
Pathway Portal Home Page. (A) Links to the page containing lists of all interactive pathway diagrams and pathway suites/networks. (B) Links to the page containing the list of physiological pathway diagrams. (C) Both the icons and underscored names of the pathways are links to the individual diagram pages. Because the physiological diagrams are made with RGD software, the user side software requirements can be found by using the link above the pathway icons
Fig. 16.
De Novo Pyrimidine Biosynthetic Pathway Diagram. The diagram is accompanied by a text description above it and a key to the left of it
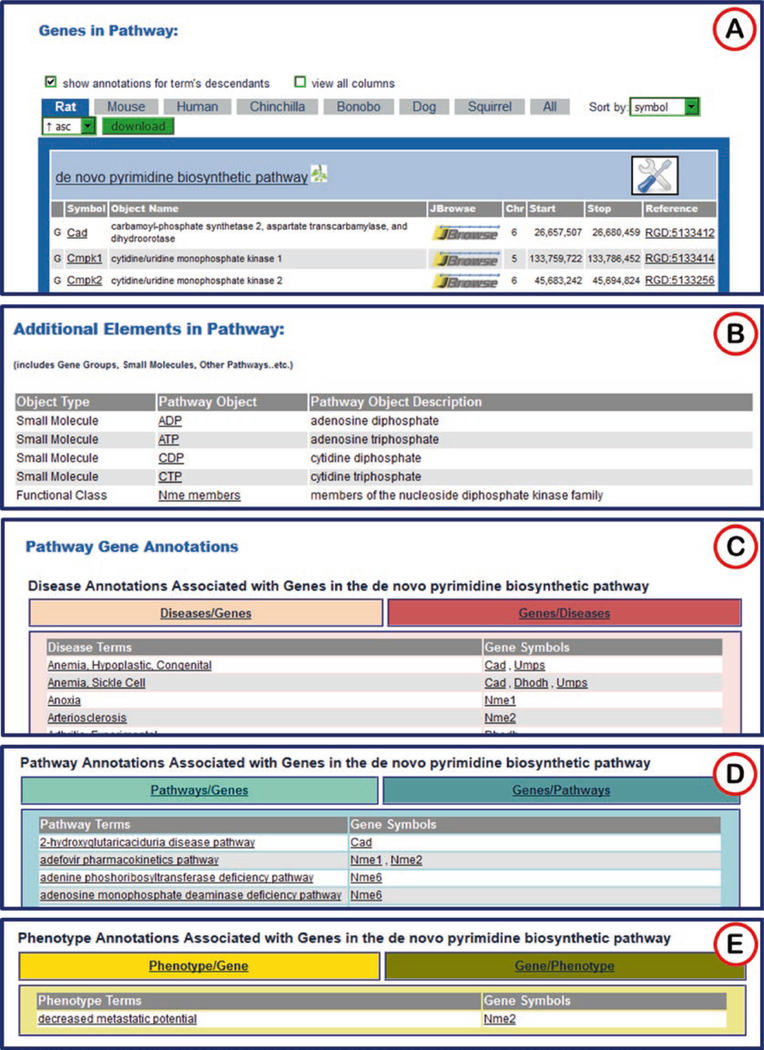
“Genes in Pathway”: genes with annotations to the title term of the diagram and to child terms of the title pathway from the Pathway Ontology [2]. This is the same type of list found on the ontology term report page for the title term (see Subheading 2.1.2, Figs. 6D and 17A).
“Additional Elements in Pathway” is a list found on some pathway diagram pages. This list may include small molecules, gene groups, other pathways, etc. (Fig. 17B).
“Pathway Gene Annotations”: A list of disease terms associated with the genes involved in the pathway. This list toggles between disease term to genes and gene to disease terms (Fig. 17C).
A list of additional pathways with which the genes are involved. This list toggles between pathway term to genes and gene to pathway terms (Fig. 17D). The terms and gene symbols of all three lists link to the appropriate report pages in RGD.
Some diagram pages also have a list of phenotype terms associated with the genes involved in the pathway. This list toggles between phenotype term to genes and gene to phenotype terms (Fig. 17E).
Below the gene lists there is a reference list of publications associated with the diagrammed pathway.
Below the references is an ontology graph that shows the diagrammed term and all its ancestor terms up to the root term.
Finally, at the bottom of the page is a link to download the pathway diagram into a user’s instance of Pathway Studio.
Fig. 17.
Gene to Pathway and Gene to Disease Lists. A number of gene/term lists are found on pathway diagram pages below the diagram. (A) A list of genes annotated to “de novo pyrimidine biosynthetic pathway” and its child terms. The list includes links to RGD gene report pages, JBrowse, and reference pages. (B) A list of additional elements in pathway. (C) A list of disease terms/genes that can be toggled by the title bar to genes/disease terms. All the disease terms link to ontology report pages and the gene symbols link to gene report pages. (D) A list of additional pathways associated with genes annotated to the diagrammed pathway. (E) A list of phenotypes associated with the genes annotated to the diagrammed pathway
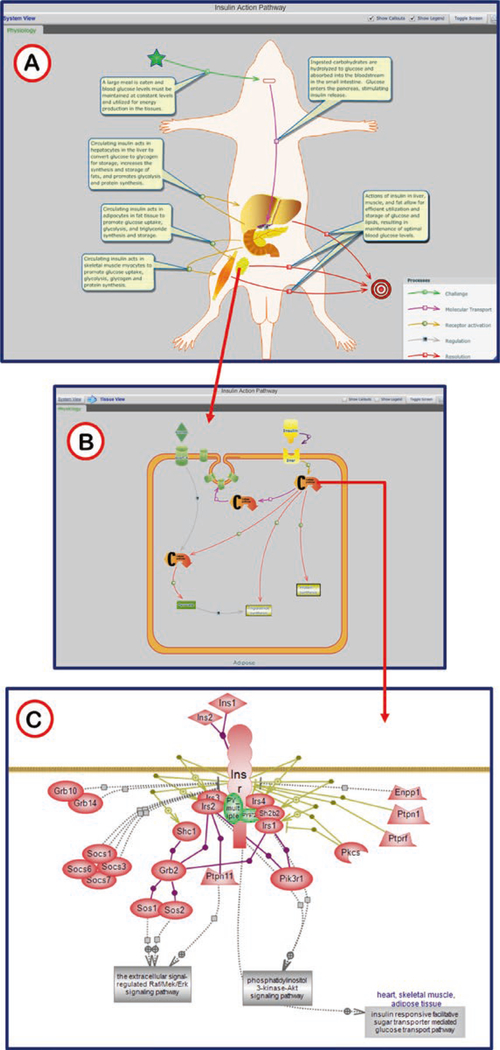
The physiological pathway diagrams present systems level pathways, allowing users to view the interactions at the whole animal level or drill down to explore the complex networks of signals and responses. The Physiological Pathway Diagrams also link to the molecular and cellular pathways giving users a glimpse into how these pathways work together to build the physiological systems (Fig. 18).
Fig. 18.
Insulin Action Pathway Diagram. (A) The system view gives the overall view of insulin action. The callout pop-ups for the separate processes can be toggled on and off by way of the check box in the upper right. In off mode individual callouts will show if the cursor hovers over a circle or square in the center of a process arrow. Organs may be identified by hovering the cursor over the organ image. (B) Detailed cellular pathways are visualized by clicking on the organ images (red arrow). As in the organismal view, hovering over parts of the diagram with reveal pop-up labels. (C) Individual molecular pathways are accessed by clicking any of the “Cellular pathway” icons in the cellular diagram (red arrow)
4. Data Analysis and Visualization Tools
4.1. Overview
Some of the data analysis tools at RGD are database-specific instances of freely available software. These include JBrowse, RatMine, and InterViewer (Cytoscape). The remaining analysis/visualization tools described in this section were developed at RGD: Gene Annotator, GViewer (Genome Viewer), OLGA (Object List Generator & Analyzer), PhenoMiner, and Variant Visualizer. They all provide different views or different types of analysis of the data in RGD. All of the tools may be accessed by the “Analysis & Visualization” icon in the middle of the RGD home page or the “Analysis & Visualization” tab near the top of most RGD pages.
4.2. InterViewer
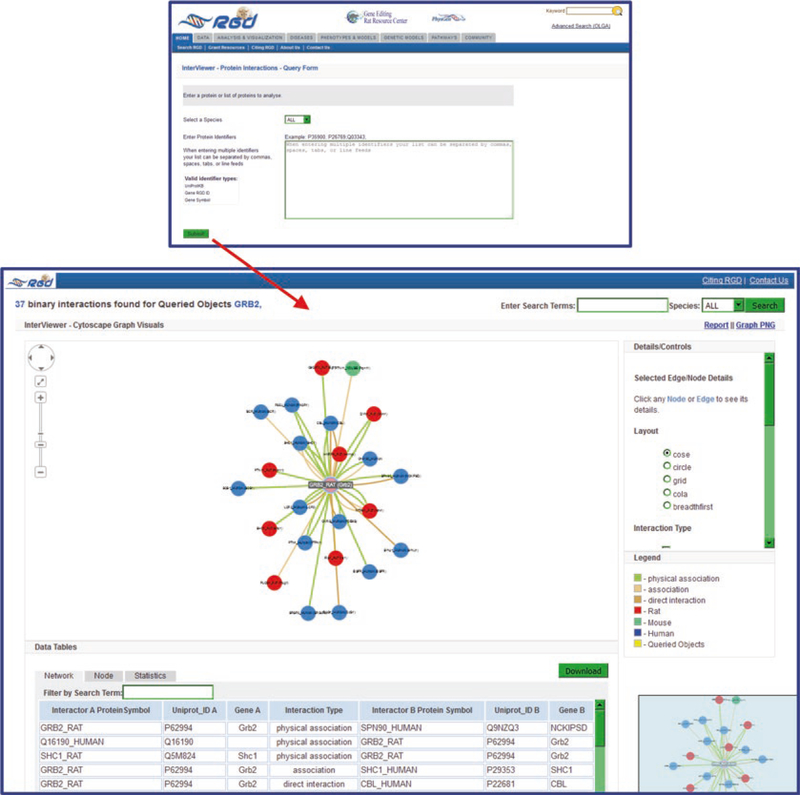
InterViewer, RGD’s Cytoscape-based (http://www.cytoscape.org/) [3] protein–protein interaction viewer, takes one or more gene symbols, RGD gene IDs, or UniProtKB protein IDs for rat, mouse, human, and/or dog (Fig. 19) and displays pairwise protein interactions for them, with information about the types of interactions and links to the associated genes in RGD and the originating interaction records at IMEX [4, 5].
A basic InterViewer results display is shown in Fig. 19. The results page features an interactive graphic display (linked to interactive thumbnail display), a list of interactions, detail/control options, and a legend for the graphic display.
Clicking on any circle in the display generates a detail box in the details/control frame, which gives information about the protein and provides a link to the UniProt page for that protein. Simultaneously a pop-up appears with the UniProt link and a link to the corresponding gene page at RGD.
The interaction edges between circles can also be clicked. Again a detail box appears with information about the specific interaction. A link to the PubMed source(s) of information is included.
Options to print the graphic display are available via links in the upper right hand of the page. A download link for the interactions list is available at the upper right side of the list.
Fig. 19.
Interviewer Search/Results. The target protein (rat Grb2) that initiated the search is shown in the center of the graphic display. Individual proteins are indicated by color-coded circles (red—rat, green—mouse, blue—human). The types of interactions are designated by color-coded lines between the circles
4.3. JBrowse
The JBrowse genome browser [6–8] from the Generic Model Organism Database project (http://www.gmod.org) is an interactive tool which allows researchers to visualize a variety of genetic and phenotypic data types in their genomic context. Virtually all of the data within the Rat Genome Database have been associated with the genome sequence in one way or another. As fundamental datasets such as genes, quantitative trait loci, microsatellite and SNP markers, and sequence resources such as ESTs, are aligned with the genome sequence, they bring with them phenotypic and other information. This information includes gene-chemical interaction data, genetic associations with disease, RNA-Seq data, synteny views of rat, mouse, and human genomes, and many types of variant/mutation data. Any or all of these can be accessed via the JBrowse genome browser and their relationship to the genomic sequence explored.
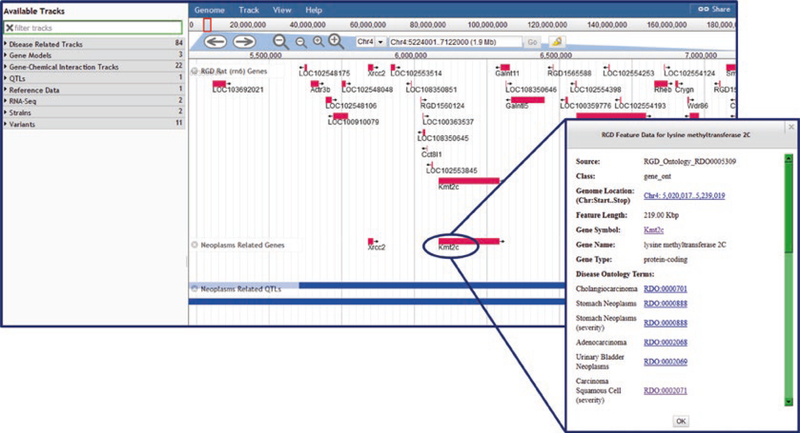
Any data object in JBrowse can be clicked to access a pop-up window containing relevant information for that object (Fig. 20). Included in that information are links to the RGD report page for that object, the annotation report page, an RGD data analysis page, or external database page with relevant information.
Fig. 20.
JBrowse Display. Display shows RGD genes on chromosome 4 and neoplasm-related genes and QTLs. Pop-up shows details for the Kmt2c gene
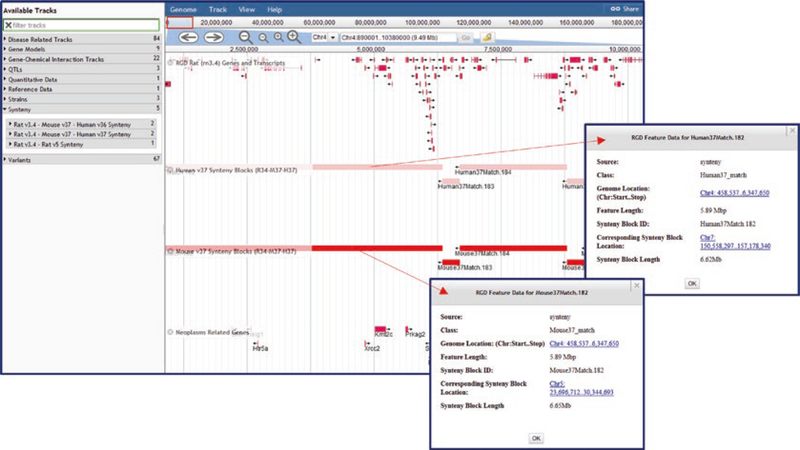
To allow comparison across species, RGD provides instances of JBrowse for mouse, human, and other species in addition to the rat version, which includes assemblies Rnor 6.0, Rnor 5.0, and Rnor 3.4. Multiple assemblies are provided for mouse (GRCmv37, GRCmv38) and human (GRChv36.3, GRChv37, and GRChv38.7) to make it easy to look at data that was generated for a specific genome assembly. The rat JBrowse v3.4 includes synteny tracks for rat v5.0, mouse v37, human v36, and human v37 (Fig. 21). The corresponding mouse and human browsers contain the reciprocal synteny tracks.
Fig. 21.
JBrowse Synteny Display. Display shows RGD genes on chromosome 4 and neoplasm-related genes aligned with human and mouse synteny tracks. Pop-up windows (indicated by red arrows) show details of human and mouse synteny blocks that match the rat chromosome segment containing the Kmt2c gene, among other neoplasm-related genes
4.4. RatMine
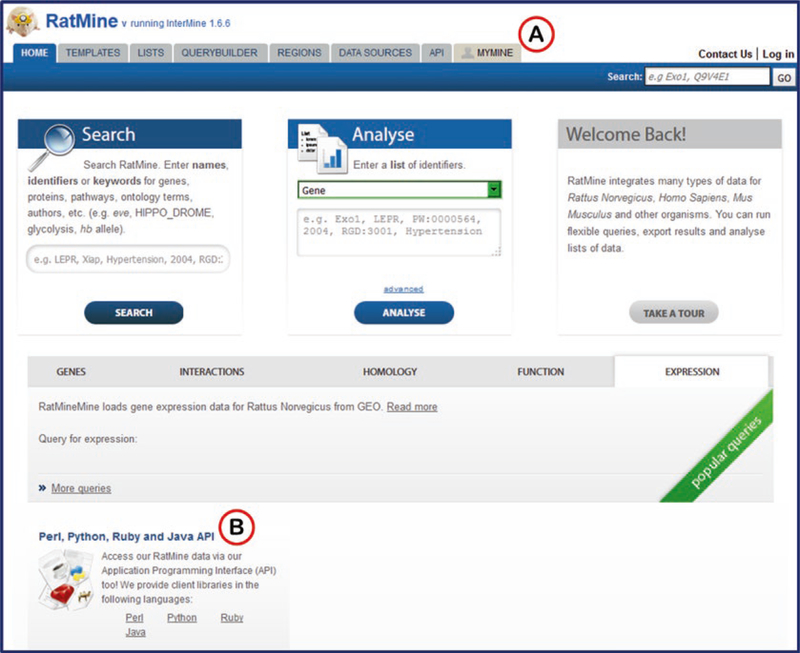
RatMine (Fig. 22) integrates data on function, disease, phenotype, variation, and comparative genomics from RGD, UniProtKB (http://www.uniprot.org/), Ensembl (http://www.ensembl.org), NCBI (https://www.ncbi.nlm.nih.gov/), PubMed (https://www.ncbi.nlm.nih.gov/pubmed) and KEGG (http://www.genome.jp/kegg/) to form a web-based data warehousing, mining and analysis tool tailored to the needs of rat researchers. Datasets derived from querying this data or from uploading researchers’ own data can be saved, manipulated and/or downloaded for use in other applications.
Fig. 22.
RatMine Home Page. (A) The tab for MyMine, a personalizing feature of RatMine, a feature allowing saving of queries and datasets within RatMine. (B) RatMine data is accessible by API
RatMine also has interaction datasets imported from BioGrid (Biological General Repository for Interaction Datasets) (https://thebiogrid.org) [9] and IntAct (http://www.ebi.ac.uk/intact) [5]. The BioGRID database manually curates the biomedical literature for genetic, protein, and chemical interaction data for major model organisms and humans. IntAct is a molecular interaction database that provides data derived from literature curation or direct user submissions to IntAct.
A key component of RatMine and of InterMine instances in general is the “MyMine” feature (Fig. 22A). Logging in as a specific user allows one to keep object lists (genes, etc.), user-created queries, and a history of activity. An API (application program interface) allows queries to run in RatMine from various web-based programs (Perl, Python, Ruby, or Java) (Fig. 22B).
4.5. Gene Annotator
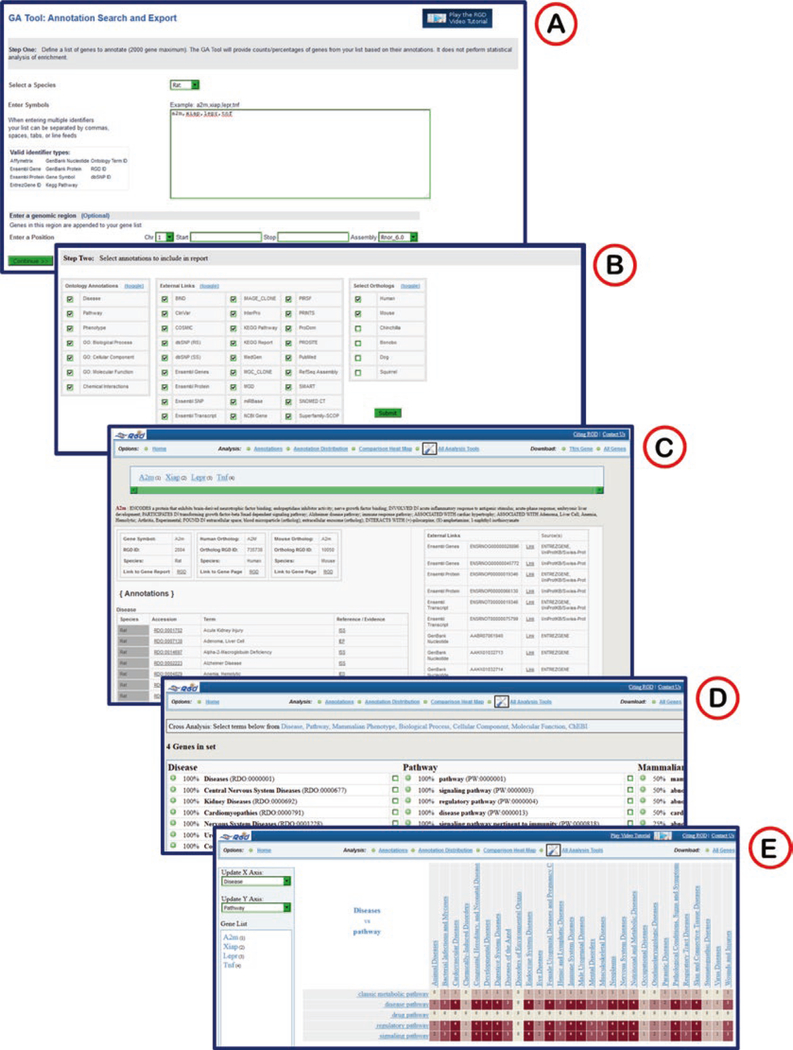
The Gene Annotator (GA) takes a list of gene symbols, RGD IDs, GenBank accession numbers, Ensembl identifiers, and/or a chromosomal region, and retrieves annotation data from RGD. The tool will retrieve annotations from most ontologies used at RGD for genes and their orthologs, as well as links to additional information at other databases. The entry page (Fig. 23A) is very similar to the InterViewer entry page.
Fig. 23.
The Gene Annotator (GA) Tool. (A) The start page of the GA tool with large text box for entry of gene lists or object identifiers. (B) The results selection page where category of ontology annotations, external links, and orthologs may be chosen. (C) Results page listing annotations and external links for the rat, human, and mouse A2M genes. (D) Annotation distribution shows what percentage of the gene list is annotated to lists of terms in various ontologies/vocabularies. (E) The Comparison Heat Map shows an interactive matrix comparing numbers of annotated genes between terms of the disease vocabulary and the pathway ontology
The first GA page after a search is an annotation/external link/species selection page where everything is selected by default (Fig. 23B).
Clicking the submit button returns a page with all annotations for the first gene (and selected orthologs) in the list. The lists include links to RGD gene pages, ontology term pages, annotation pages, and external data pages (Fig. 23C).
A list of links at the top of the page allows the user to pick a particular type of analysis to view (Annotation Distribution or Comparison Heat Map) or to send the gene list to another tool by selecting the “All Analysis Tools” link.
On the “Annotation Distribution” page (Fig. 23D) there are enrichment lists of terms by category, which rank the terms according to how many of the searched genes are annotated to those particular terms. Each entry in the list can be opened to see which genes and which specific terms are in the annotations. Subsets of annotations can be displayed by selecting at least two of the check boxes which appear to the right of every term in the lists.
The “Comparison Heat Map” (Fig. 23E) compares the number of genes annotated to selected terms of two different ontologies by displaying how many genes are annotated to specific terms in one ontology while also being annotated to the selection of terms in the other ontology. The default view shows annotations to disease terms versus annotations to pathway terms. The drop-down menus on the left side of the page allow the ontology to be changed on either axis of the heat map. Also, clicking on any of the hyperlinked terms on either axis of the heat map will reset that respective axis to include just child terms of the selected term. By clicking on any nonzero numbered square in the heat map, a list is returned of all genes annotated to both terms which cross at that spot in the matrix.
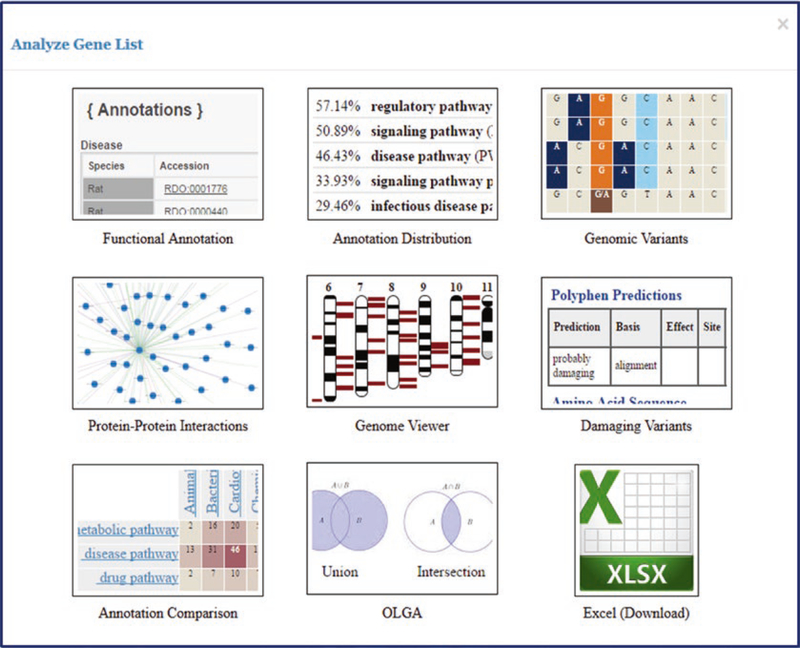
Finally, by selecting “All Analysis Tools,” an “Analyze Gene List” pop-up appears (Fig. 24) with icons of various RGD analysis tools that link to those respective tools. Clicking a tool sends the gene list from the GA tool to the selected tool.
To download annotations retrieved by the tool at any stage in viewing results, the “This Gene” or “All Genes” links are available at the upper right corner of the results pages.
Fig. 24.
“Analyze Gene List” Pop-up. A pop-up window with a set of icon links to various tools to which gene lists may be transferred. This pop-up is accessible in the GA tool, as well as in other RGD tools, on gene report pages, and on ontology term report pages
4.6. GViewer
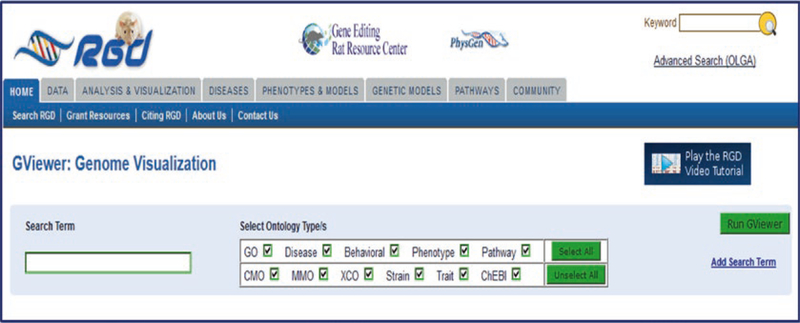
The Genome Viewer (GViewer) provides users with a complete genome view of genes, QTLs, and congenic strains annotated to a molecular function, biological process, cellular component, phenotype, disease, or pathway. The tool will search for matching terms from the Gene Ontology, Mammalian Phenotype Ontology, RGD Disease Ontology or Pathway Ontology. The search page for GViewer (Fig. 25) features an autocomplete text box accompanied by an ontology selection section where any or all available ontologies may be chosen. Complex searches may be made by clicking “Add Search Term” on the right side of the page. Each succeeding text box is accompanied by a drop-down menu with the Boolean-type choices of OR, AND, NOT. The returned results include all annotations to the chosen term and its child terms.
Fig. 25.
GViewer Search Page. The GViewer search page has one text box and optional additional text boxes (“Add Search Term” link) with multiple ontology check boxes to restrict the search. A link to a tutorial video is available on the right side of the page
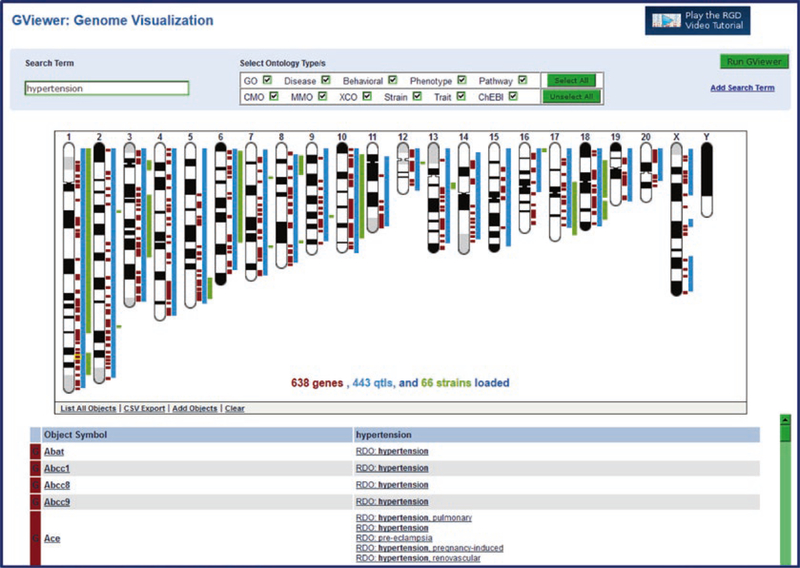
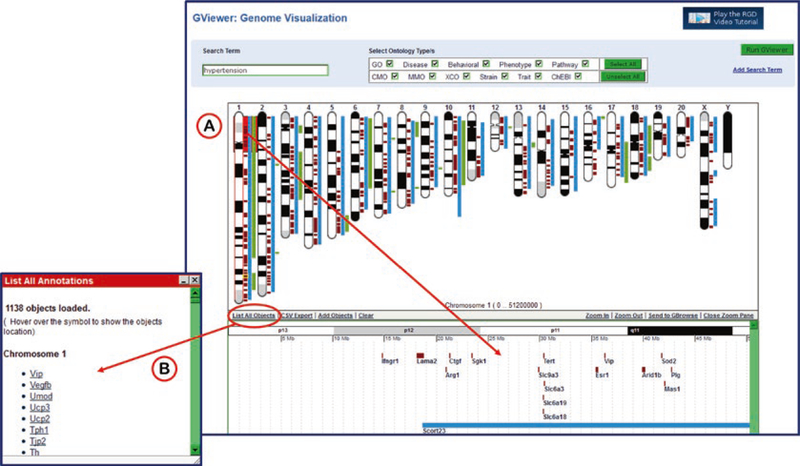
The main feature of the GViewer results page is the ideogrammic view of chromosomes with genes, QTLs, and congenic strains marked by color-coded bars in their approximate positions according to genome coordinates (Fig. 26). This GViewer graphic is used on every ontology term report page to visualize annotated objects. Below the chromosome view in the GViewer tool is a list of returned objects (alphabetical under type of object) and the searched ontology term(s), all of which link to the appropriate RGD report page. Clicking on any chromosome opens the zoom pane (Fig. 27A) that is displayed beneath the chromosome view. The zoom pane features a horizontal view of the chosen locus with a closer view featuring labeled genes, QTLs, and congenic strains. The zoom pane can be scrolled and zoomed.
Fig. 26.
GViewer Genome Visualization. The ideogrammic view of chromosomes with the location of returned genes marked in brown, QTLs in blue, and strains in green. A list of returned objects matched with their exact ontology term hit is shown below the genome display
Fig. 27.
GViewer Genome Visualization Functionality. (A) Clicking on the end of chromosome 1 opens the zoom pane to show a closer view of genes and QTL in the locus. (B) Clicking on “List All Objects” opens a pop-up window with a chromosome by chromosome list of all objects returned by the GViewer search
Alternate views of the data and other options are available on the bottom menu of the chromosome display. “List all objects” displays a pop-up window (Fig. 27B) to show a chromosome by chromosome list of annotated objects. All of those symbols in the list link to a close-up view of the object in the zoom pane. Other options on the chromosome view bottom menu are links for data download (CSV export) and an “Add Object” function which allows the user to add any specific gene, QTL, or congenic strain that isn’t already displayed.
4.7. OLGA: Object List Generator & Analyzer
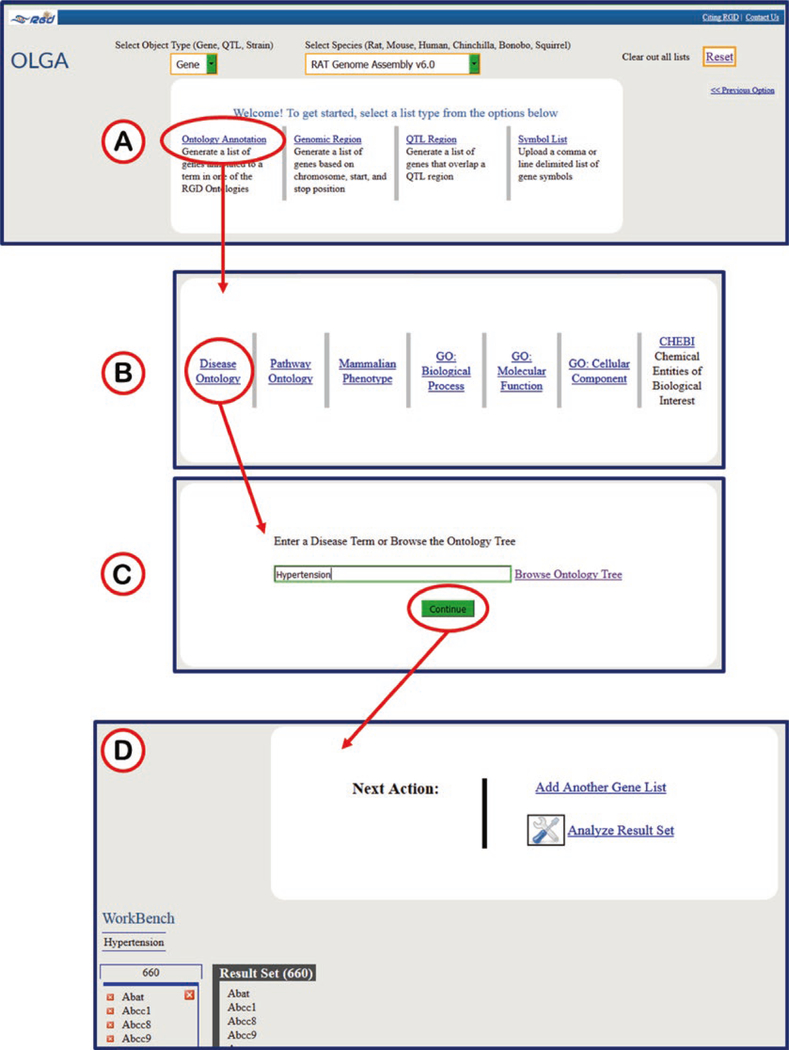
OLGA, the Object List Generator & Analyzer tool, is a list builder for rat, mouse, human, and other species genes, rat, mouse, or human QTLs, or rat strains, using any of a variety of querying options. Find objects in RGD using any of RGD’s functional annotations (Fig. 28), or using genomic positions. There are various options for using the generated list: download the list to your own computer for analysis or loading into other tools, send the list to RGD’s GA Tool for functional analyses, InterViewer for interaction analysis, GViewer for genomic visualization, or for rat and human, send the list to the Variant Visualizer to find sequence variants.
Fig. 28.
Object List Generator & Analyzer (OLGA) tool. (A) OLGA selection screen for object, species/assembly, ontology, and genomic region. (B) Ontology/vocabulary selection screen. (C) Autocomplete text entry box. (D) Results page with links to “Add Another Gene List” (which adds another A, B, and C to the search process) and the “Analyze Result Set” pop-up window
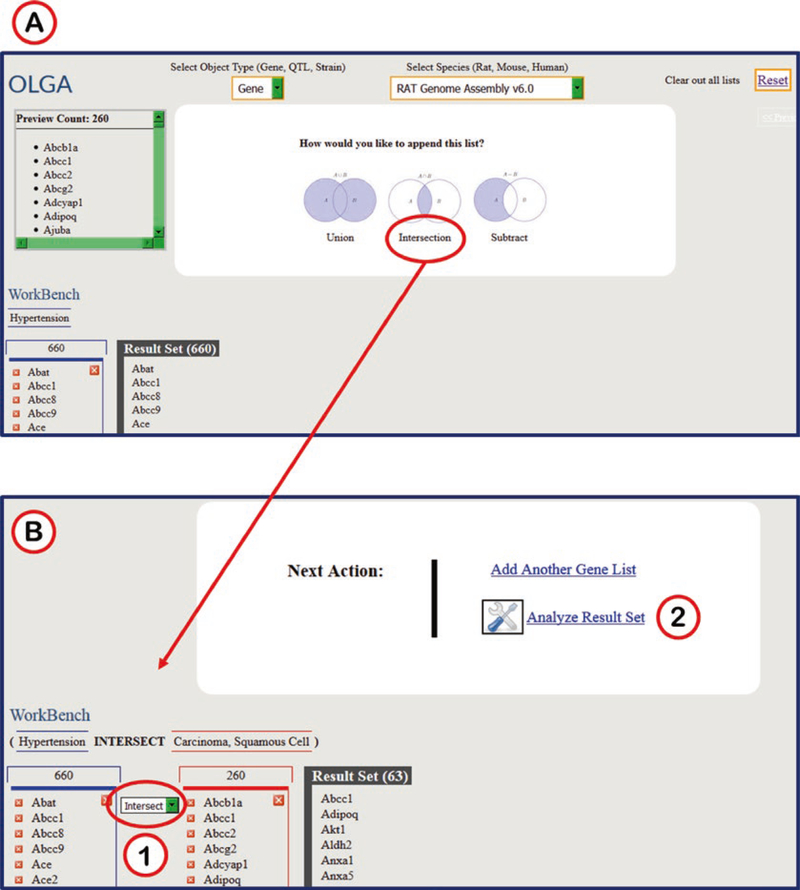
OLGA can generate multiple lists and integrate them in a number of ways. OLGA gives the user a choice of union, intersection, or subtraction for combining a second list with a previously generated list (Fig. 29A). A drop-down menu between results lists (Fig. 29B1) gives the user an easy way to switch to another integration option. After two or more lists have been integrated, the result list may be transferred to another tool via the “Analyze Result Set” link (Figs. 24 and 29B2).
Fig. 29.
OLGA Results Options. (A) After generating a second gene list, the option of combining the two lists by “Union,” “Intersection,” or “Subtract” are shown here. (B) The results of the “Intersection” function on two gene lists is shown here. (B1) A drop-down menu between the two gene lists gives further options to compare the lists. (B2) The option of “Analyze Result Set” is available here to further manipulate the resultant set of genes
4.8. PhenoMiner
The purpose of the PhenoMiner tool is to integrate phenotypic data from different rat strains, collected by a variety of measurement methods under various experimental conditions. The data in PhenoMiner is comprised of results from the PhysGen Program for Genomic Applications (http://pga.mcw.edu) [10], the National BioResource Project—Rat (http://www.anim.med.kyoto-u.ac.jp/nbr/) (a large scale phenotyping project which has collected data for inbred rat strains) [11], and manual annotation from the rat physiological literature.
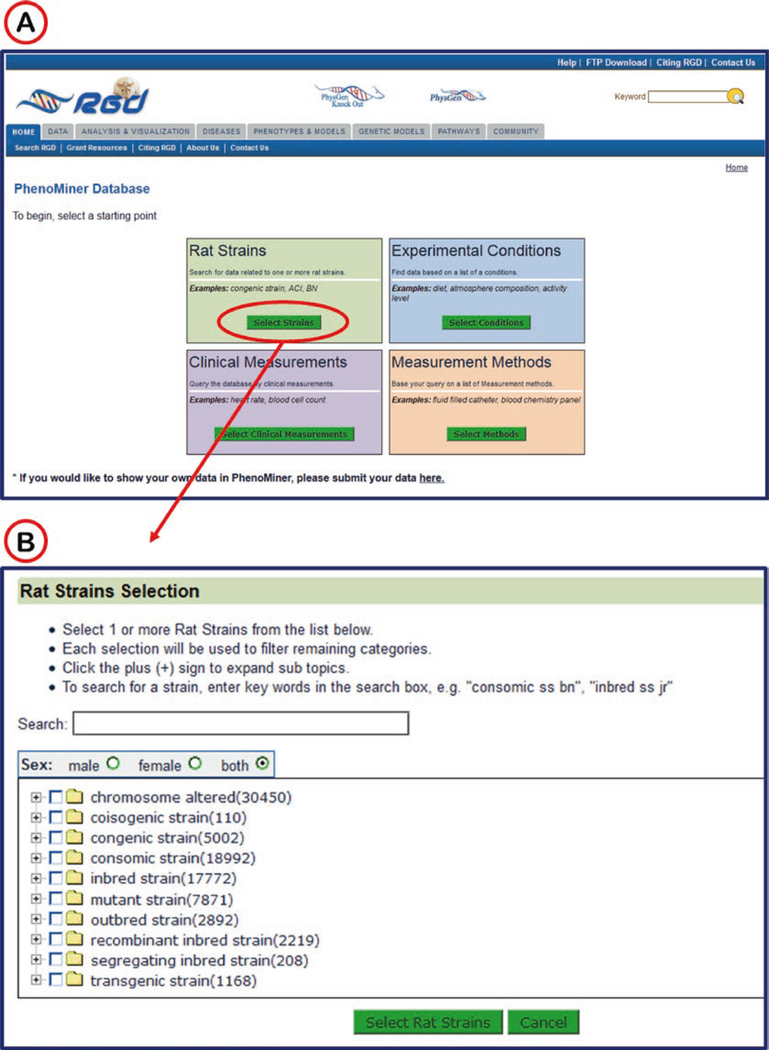
The PhenoMiner start page (Fig. 30A) features a choice of rat strains, clinical measurements, measurement methods, or experimental conditions to begin a search for quantitative phenotypic data.
Fig. 30.
PhenoMiner Start Page. Selection of “Rat Strains” (A) opens a new window (red arrow) with a text search box and a browsable vocabulary tree (B)
Selecting one of the four parameters returns a search box and a list of specific options (Fig. 30B). For example the “rat strains” selection involves a simple search and/or drilling through the rat strain nomenclature in a vocabulary tree.
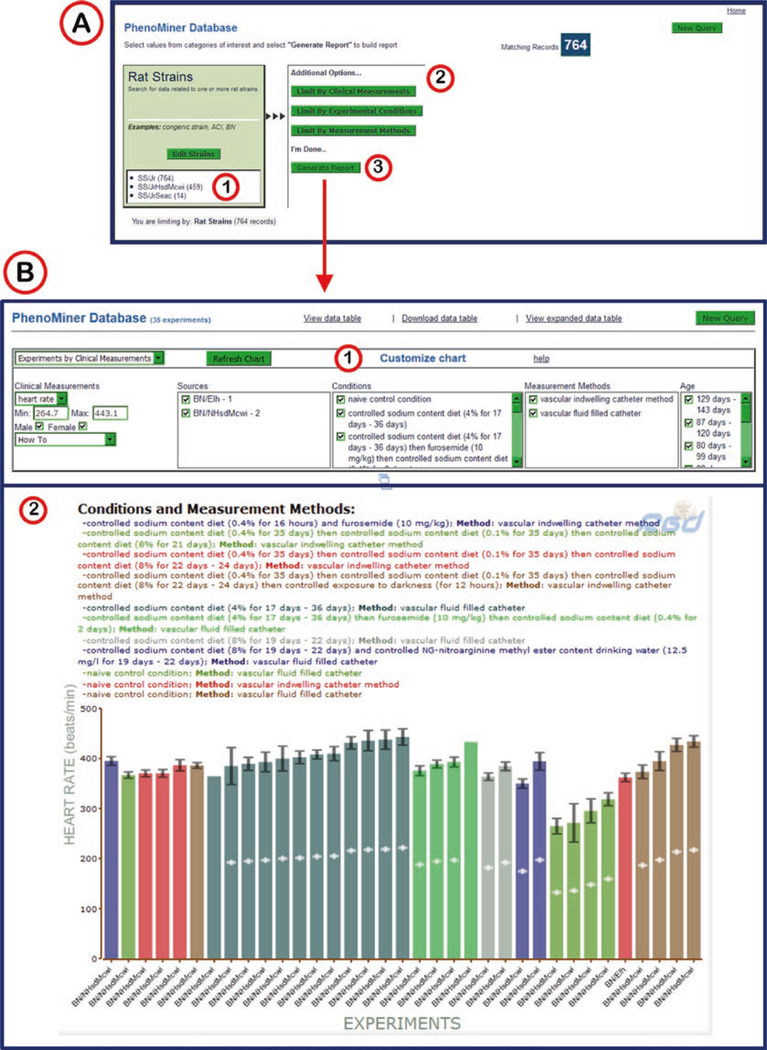
After a selection is made, a tally of results is made (Fig. 31A1) and the other three categories remain as options (Fig. 31A2). The selection of terms from the clinical measurement ontology, experimental conditions ontology, and the measurement methods ontology are all set up similarly to the strain selection. Each consecutive selection limits the remaining selections based on what strains were measured for what parameter, by which method, and under what condition.
A running tally of results obtained at each step of the query building process is provided. “Generate Report” may be clicked at any point after at least one category has been selected (Fig. 31A3).
All the data available for the selected parameters is displayed or made accessible on the PhenoMiner report page (Fig. 31B). The top of the report page has a series of drop-down menus and check boxes that correspond to the item choices made on the previous pages and to the data displayed in the bar graph in the center of the page. The presentation of the data can be manipulated by altering the choices in the drop-down menus or the check boxes.
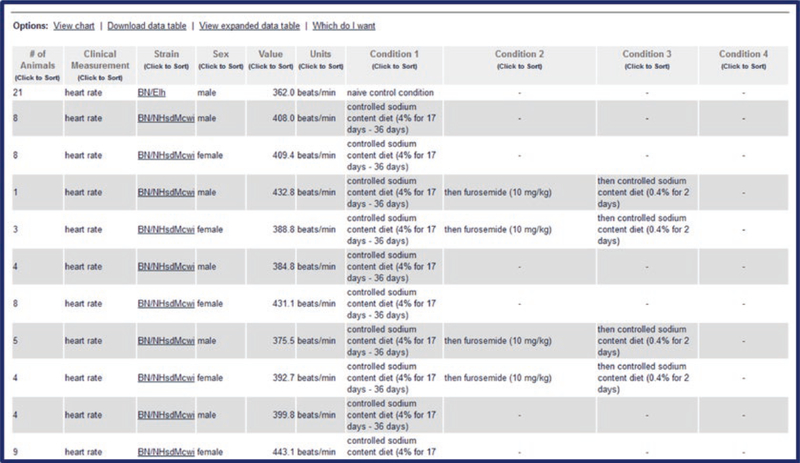
The data is also presented in table form below the bar graph (Fig. 32). The table is sortable on any column. There are also options of download, expanded form, and help at the top of the table.
Fig. 31.
PhenoMiner Selection Process and Report Page. (A) Intermediate selection page with scoreboard (1) of selected strains, more limiting options (2), and a “Generate Report” link (3). (B) PhenoMiner Report Page with customizable result options (1), featuring a color-coded bar graph (2) with all selected strains, methods, and conditions
Fig. 32.
PhenoMiner Results Table. This is located below the column chart on the PhenoMiner Report Page. Options for download and table expansion are shown at the top of the table. The table is sortable by clicking the title of any column and all of the strain symbols link to the respective strain report pages
4.9. Variant Visualizer
Variant Visualizer is a viewing and analysis tool for rat strain-specific sequence polymorphisms and human ClinVar variants. Select rat strains or human assembly of interest, define one or more genomic regions and, if desired, set parameters for the type(s) of desired variants and the tool will return all of the single nucleotide variants (SNVs) which match the input criteria, including information on read depth, zygosity, conservation score and more.
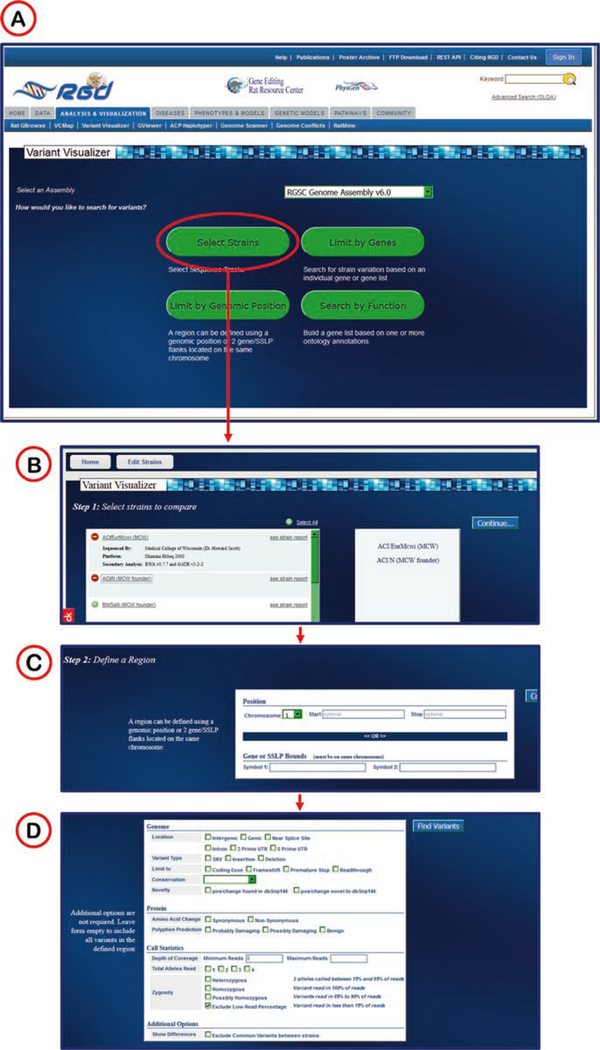
Beginning on the main page of the tool (Fig. 33), the user selects a genome assembly, followed by selection pages to limit output by strain, gene, genomic position, or function of gene product (link to OLGA).
The user then chooses what kind of variants to see in the graphic display of results. This includes choices of type of variant, genomic feature, potential effect of variant upon protein product, and statistics involved in the variant calls (Fig. 33D).
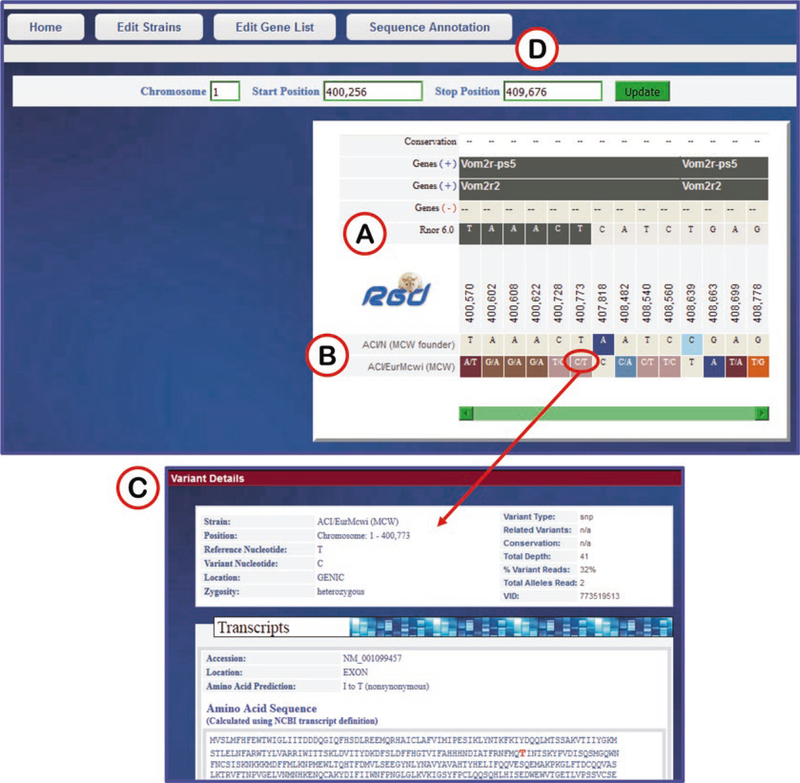
The graphic display of results shows a horizontal view of DNA sequence of strain/assembly compared to reference sequence (Fig. 34). Variants are identified by chromosome coordinate and base designation. It is easy to compare many rat strains simultaneously since the variants are stacked up on each other based on chromosome coordinate in a scrollable display frame. For details of any variant, clicking on the base will open a popup window with details (Fig. 34C).
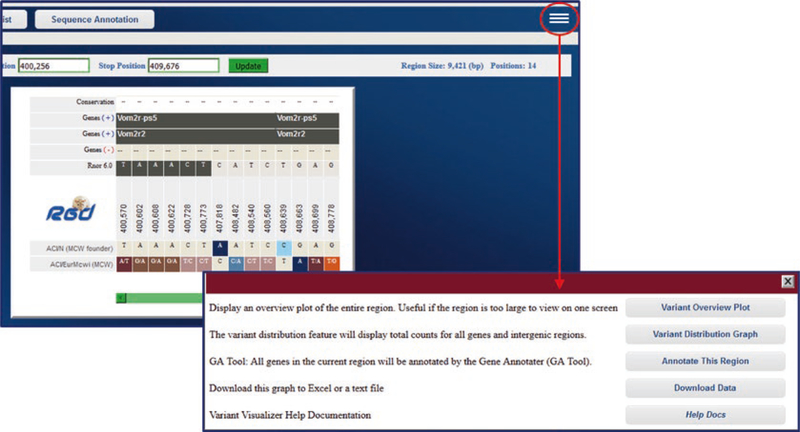
From the sequence display page optional views and links to further analysis are available from a pop-up selection box accessed by a link in the upper right corner of the display page (Fig. 35). The options include an overview plot of the data, a distribution graph of the data, a link to the GA tool (Gene Annotator—see Subheading 4.5) for functional analysis of the selected region, a download link for the data, and help documentation.
Fig. 33.
Variant Visualizer Selection Screens. (A) The Variant Visualizer home page with drop-down menu for assembly selection and selection buttons for strain (red oval), gene(s), genomic position, and function. (B) Strain selection page listing all strains annotated to the selected assembly. The first two strains in the list have been selected and appear in the box on the right. (C) Region/Genomic position selection page with drop-down menu for chromosome and text boxes for start/stop coordinates. (D) Selection page for filtering on variant type, variant location, variant at protein level, and call statistics for variants
Fig. 34.
Variant Visualizer Results Display. (A) The reference sequence of selected region. (B) Selected Strains. (C) Pop-up window with details of variant (red oval) selected from result display. (D) Options of editing prior selections of strain, gene, annotation, or coordinates
Fig. 35.
Further Options on Variant Visualizer Results Page
4.10. VCMap
The Virtual Comparative Map (VCMap) tool was originally developed at RGD to explore the syntenic relationships between rat, mouse, and human genomes. A newer version of VCMap has been developed by a collaboration of Iowa State University, University of Iowa, Medical College of Wisconsin and RGD. The tool was updated by Bio::Neos (http://bioneos.com/). The current VCMap expands both the versatility and utility of this valuable tool by incorporating pig, chicken, cow, and horse genomes. Access to the tool is available through Chrome, Firefox, and Internet Explorer web browsers through a Java applet. To run the applet an exception in the Java security settings should be added for http://www.animalgenome.org, the site which hosts VCMap.
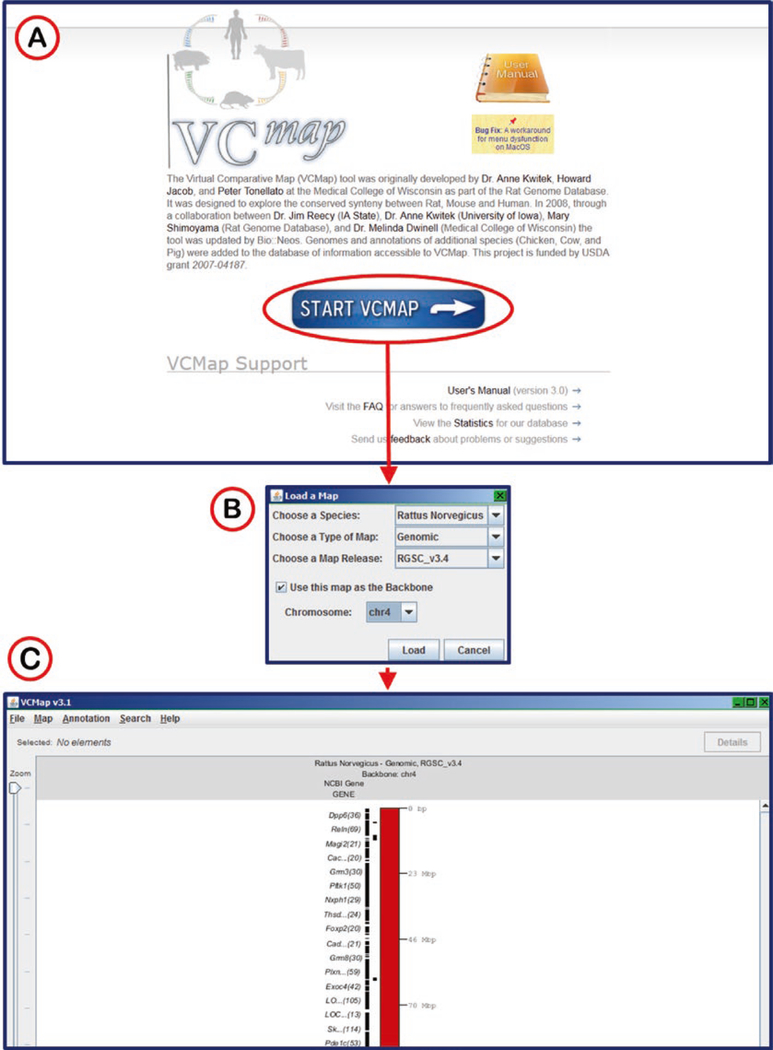
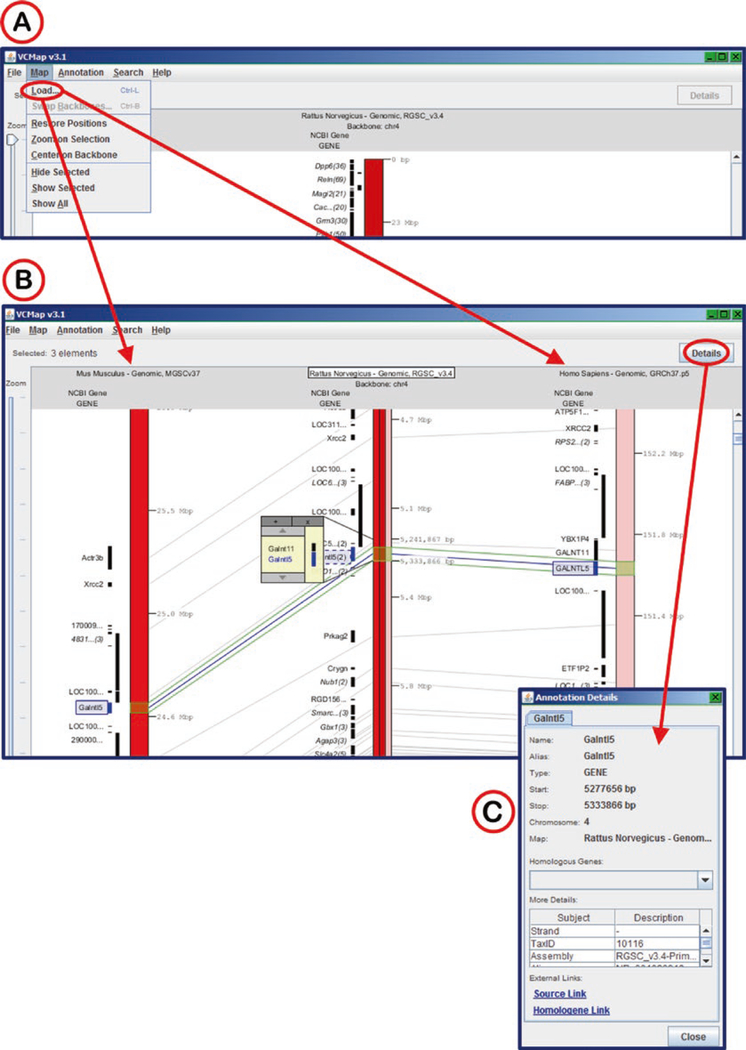
The link on the RGD tools page connects to the VCMap hosted at http://www.animalgenome.org/ (Fig. 36). The Start button launches the Java applet followed by a selection window with a choice of species, map choice (genomic, radiation hybrid, and genetic), map version (RGSC_v3.4 for rat), and chromosome (Fig. 36B). After the anchor species is chosen, additional species may be successively chosen for comparison (Fig. 37A) by using the “load” function under the “Map” menu. The chromosomes are displayed vertically, with the coordinates of the anchor chromosome increasing from top to bottom. The chromosome sections of the other species are arranged such that orthologs and syntenic regions line up, as much as possible, along the horizontal axis. Using the zoom slider on the left side of the display window and the scroll bar on the right side of the display, specific genes may be viewed. By clicking on a specific gene symbol in the display, highlighting appears on that symbol, the ortholog symbols on the other maps, and on lines connecting the orthologs (Fig. 37B). Information details of genes may be accessed by double-clicking gene symbols or by clicking the “Details” button at the upper right when a gene symbol is highlighted.
Fig. 36.
VCMap Start Page and Map Selection. (A) VCmap start page. (B) Pop-up map selection window for choosing species, type of map, map release, and chromosome. (C) Result display for rat chromosome 4
Fig. 37.
Using VCMap for Interspecies Comparisons. (A) Choosing mouse and human maps for comparison to rat. (B) Display of mouse and human homologous chromosomes as compared to rat. The Galntl5 gene orthologs have been selected and are highlighted in blue across the three species. (C) Annotation details pop-up window for rat Galntl5
5. Automated Access to RGD Data
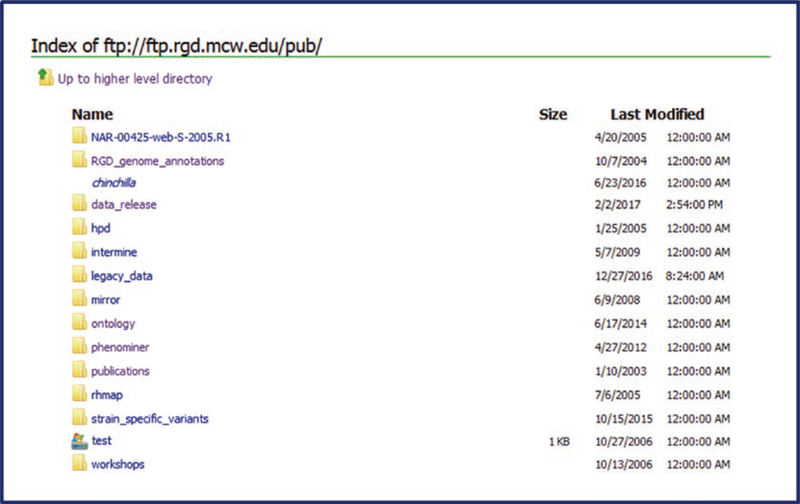
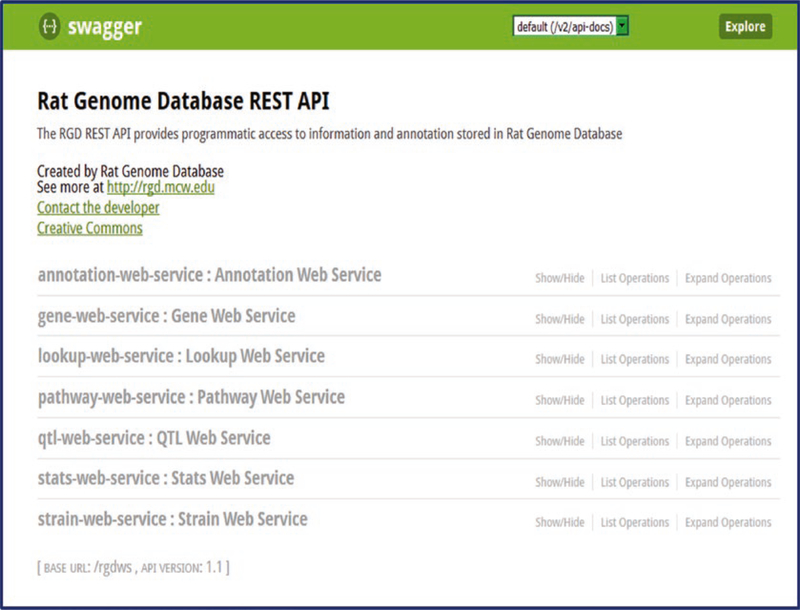
RGD has facilitated bulk download and other automated access to curated and other data. Data is accessible by both FTP download (Fig. 38) and REST API (Fig. 39). The RGD FTP site maintains regularly updated files of all RGD data that can be downloaded and used in subsequent studies. These include the curated gene, QTL, strain and marker datasets, mapping information, genome annotation (in GFF format), sequence files for RGD data, and RGD-developed ontologies/vocabularies. The FTP site can be reached by clicking the “FTP Download” link found in the menu bar on the upper right of most RGD web pages. This link will lead to the FTP site ( ftp://ftp.rgd.mcw.edu/pub), where one can browse the files available for download. The “REST API” link may be found adjacent to the FTP link.
Fig. 38.
FTP Download Page
Fig. 39.
REST API page
6. Summary
The Rat Genome Database was established in 1999 as a resource to support the emerging genomic data for the rat. This role has continued to expand with continuing work on the rat reference genome sequence (current assembly is Rnor_6.0—RGSC Genome Assembly v6.0), strain-specific DNA sequencing [12], expanded SNP discovery, and large-scale phenotyping projects such as the PhysGen project (http://pga.mcw.edu) and NBRP [11], all needing to be integrated with existing and newly published research data. As the amount of data has grown, so has the challenge of mining relevant information and defining its meaning in the broader context of biomedical science. With this in mind, much effort has gone into the development and incorporation of biomedical ontologies such as the Gene Ontology [13], the Mammalian Phenotype Ontology [14], the Pathway Ontology [2], and others [15]. These are incorporated into the search and analysis tools, greatly facilitating the discovery of information and interpretation of its meaning.
Many researchers using the rat as a model system are ultimately studying a specific phenotype or disease with the goal of applying this knowledge to humans. To meet this need, RGD has developed “disease portals” that present RGD data and tools from the perspective of a particular disease. The disease portals allow researchers to visit a single page that is focused on a single disease area like cardiovascular, neurological, or respiratory disease. These disease categories are being expanded in an ongoing process of targeted curation to create more portals devoted to particular disease areas that will cater directly to researchers working in those areas. The rest of RGD is accessible via these portals, but researchers will find the items of greatest interest first, reducing the challenge of finding the data and interpreting its meaning. Similarly, the Phenotypes & Models portal and the Pathways Portal focus on specific areas of research, which allows easier access to targeted searches for relevant data.
In addition to the portal style of data organization, the access to different software tools at RGD is an important part of the database. Ranging from annotation-based analysis to sequence-based analysis, the options are extensive to manipulate both RGD data and user-uploaded data. Further analysis may be done with downloaded data via the FTP site or the REST API.
Acknowledgments
RGD is supported by the National Heart, Lung, and Blood Institute on behalf of the National Institutes of Health [HL64541].
Footnotes
Dedication We wish to dedicate this chapter to the memory of our colleague and longtime RGD curator Dr. Victoria Petri, who recently passed away. Her legacy lives on through the RGD Pathway Ontology and Pathway Diagrams that she created.
References
- 1.Shimoyama M, De Pons J, Hayman GT, Laulederkind SJ, Liu W, Nigam R, Petri V, Smith JR, Tutaj M, Wang SJ, Worthey E, Dwinell M, Jacob H (2015) The Rat Genome Database 2015: genomic, phenotypic and environmental variations and disease. Nucleic Acids Res 43(Database issue):D743–D750. 10.1093/nar/gku1026 [DOI] [PMC free article] [PubMed] [Google Scholar]
- 2.Petri V, Jayaraman P, Tutaj M, Hayman GT, Smith JR, De Pons J, Laulederkind SJ, Lowry TF, Nigam R, Wang SJ, Shimoyama M, Dwinell MR, Munzenmaier DH, Worthey EA, Jacob HJ (2014) The pathway ontology - updates and applications. J Biomed Semantics 5(1):7 10.1186/2041-1480-5-7 [DOI] [PMC free article] [PubMed] [Google Scholar]
- 3.Shannon P, Markiel A, Ozier O, Baliga NS, Wang JT, Ramage D, Amin N, Schwikowski B, Ideker T (2003) Cytoscape: a software environment for integrated models of biomolecular interaction networks. Genome Res 13(11):2498–2504. 10.1101/gr.1239303 [DOI] [PMC free article] [PubMed] [Google Scholar]
- 4.Orchard S, Kerrien S, Abbani S, Aranda B, Bhate J, Bidwell S, Bridge A, Briganti L, Brinkman FS, Cesareni G, Chatr-Aryamontri A, Chautard E, Chen C, Dumousseau M, Goll J, Hancock RE, Hannick LI, Jurisica I, Khadake J, Lynn DJ, Mahadevan U, Perfetto L, Raghunath A, Ricard-Blum S, Roechert B, Salwinski L, Stumpflen V, Tyers M, Uetz P, Xenarios I, Hermjakob H (2012) Protein interaction data curation: the International Molecular Exchange (IMEx) consortium. Nat Methods 9(4):345–350. 10.1038/nmeth.1931 [DOI] [PMC free article] [PubMed] [Google Scholar]
- 5.Orchard S, Ammari M, Aranda B, Breuza L, Briganti L, Broackes-Carter F, Campbell NH, Chavali G, Chen C, del-Toro N, Duesbury M, Dumousseau M, Galeota E, Hinz U, Iannuccelli M, Jagannathan S, Jimenez R, Khadake J, Lagreid A, Licata L, Lovering RC, Meldal B, Melidoni AN, Milagros M, Peluso D, Perfetto L, Porras P, Raghunath A, Ricard-Blum S, Roechert B, Stutz A, Tognolli M, van Roey K, Cesareni G, Hermjakob H (2014) The MIntAct project—IntAct as a common curation platform for 11 molecular interaction databases. Nucleic Acids Res 42(Database issue):D358–D363. 10.1093/nar/gkt1115 [DOI] [PMC free article] [PubMed] [Google Scholar]
- 6.Skinner ME, Holmes IH (2010) Setting up the JBrowse genome browser. Curr Protoc Bioinformatics 32:9.13.1–9.13.13. 10.1002/0471250953.bi0913s32 [DOI] [PMC free article] [PubMed] [Google Scholar]
- 7.Westesson O, Skinner M, Holmes I (2013) Visualizing next-generation sequencing data with JBrowse. Brief Bioinform 14(2):172–177. 10.1093/bib/bbr078 [DOI] [PMC free article] [PubMed] [Google Scholar]
- 8.Buels R, Yao E, Diesh CM, Hayes RD, Munoz-Torres M, Helt G, Goodstein DM, Elsik CG, Lewis SE, Stein L, Holmes IH (2016) JBrowse: a dynamic web platform for genome visualization and analysis. Genome Biol 17:66 10.1186/s13059-016-0924-1 [DOI] [PMC free article] [PubMed] [Google Scholar]
- 9.Chatr-Aryamontri A, Oughtred R, Boucher L, Rust J, Chang C, Kolas NK, O’Donnell L, Oster S, Theesfeld C, Sellam A, Stark C, Breitkreutz BJ, Dolinski K, Tyers M (2017) The BioGRID interaction database: 2017 update. Nucleic Acids Res 45(D1):D369–d379. 10.1093/nar/gkw1102 [DOI] [PMC free article] [PubMed] [Google Scholar]
- 10.Dwinell MR (2010) Online tools for understanding rat physiology. Brief Bioinform 11(4):431–439. 10.1093/bib/bbp069 [DOI] [PMC free article] [PubMed] [Google Scholar]
- 11.Serikawa T, Mashimo T, Takizawa A, Okajima R, Maedomari N, Kumafuji K, Tagami F, Neoda Y, Otsuki M, Nakanishi S, Yamasaki K, Voigt B, Kuramoto T (2009) National BioResource Project-Rat and related activities. Exp Anim 58(4):333–341 [DOI] [PubMed] [Google Scholar]
- 12.Hermsen R, de Ligt J, Spee W, Blokzijl F, Schafer S, Adami E, Boymans S, Flink S, van Boxtel R, van der Weide RH, Aitman T, Hubner N, Simonis M, Tabakoff B, Guryev V, Cuppen E (2015) Genomic landscape of rat strain and substrain variation. BMC Genomics 16:357 10.1186/s12864-015-1594-1 [DOI] [PMC free article] [PubMed] [Google Scholar]
- 13.Ashburner M, Ball CA, Blake JA, Botstein D, Butler H, Cherry JM, Davis AP, Dolinski K, Dwight SS, Eppig JT, Harris MA, Hill DP, Issel-Tarver L, Kasarskis A, Lewis S, Matese JC, Richardson JE, Ringwald M, Rubin GM, Sherlock G (2000) Gene ontology: tool for the unification of biology. The Gene Ontology Consortium. Nat Genet 25(1):25–29. 10.1038/75556 [DOI] [PMC free article] [PubMed] [Google Scholar]
- 14.Smith CL, Goldsmith CA, Eppig JT (2005) The Mammalian Phenotype Ontology as a tool for annotating, analyzing and comparing phenotypic information. Genome Biol 6(1):R7 10.1186/gb-2004-6-1-r7 [DOI] [PMC free article] [PubMed] [Google Scholar]
- 15.Laulederkind SJ, Tutaj M, Shimoyama M, Hayman GT, Lowry TF, Nigam R, Petri V, Smith JR, Wang SJ, de Pons J, Dwinell MR, Jacob HJ (2012) Ontology searching and browsing at the Rat Genome Database. Database (Oxford) 2012:bas016 10.1093/database/bas016 [DOI] [PMC free article] [PubMed] [Google Scholar]


