Abstract
Worldwide, metastatic melanoma of the skin has an aggressive course with high morbidity and mortality. Therefore, an increased understanding of the pathogenesis of metastatic melanoma has gained increasing attention, including the role of epigenetic modification and competing endogenous RNA (ceRNA). This study aimed to used bioinformatics data to undertake an integrative analysis of long noncoding RNA (lncRNA), microRNA (miRNA) and mRNA expression to construct a ceRNA network in metastatic melanoma.
Data from the Cancer Genome Atlas (TCGA), the Gene Ontology (GO) database, and Kyoto Encyclopedia of Genes and Genomes (KEGG) pathway were analyzed. There were 471 cases that included 103 primary solid tumors and 368 cases of metastatic melanoma that included transcriptome sequencing data (including lncRNA and mRNA); 452 cases had miRNA sequencing data.
Analysis of chip data identified 85 6 mRNAs, 67 miRNAs, and 250 lncRNAs that were differentially expressed in cases of metastatic melanoma, of which 25 miRNAs, 18 lncRNAs, and 18 mRNAs participated in the formation of ceRNAs. Survival analysis identified seven differentially expressed mRNAs, five differentially expressed miRNAs (miRNA-29c, miRNA-100, miR-142-3p, miR-150, miR-516a-2), and six differentially expressed lncRNAs (AC068594.1, C7orf71, FAM41C, GPC5-AS1, MUC19, LINC00402) that were correlated with survival time in patients with metastatic melanoma.
Bioinformatics data and integrative analysis identified lncRNA, miRNA, and mRNA expression to construct a ceRNA and patient survival network in metastatic melanoma. These findings support the need for further studies on the mechanisms involved in the regulation of metastatic melanoma by ceRNAs.
MeSH Keywords: 1-Acylglycerol-3-Phosphate O-Acyltransferase; MicroRNAs; NM23 Nucleoside Diphosphate Kinases; RNA Caps; RNA, Long Noncoding
Background
Worldwide, metastatic melanoma of the skin has an aggressive course with high morbidity and mortality, and the incidence of melanoma continues to increase. Although non-metastatic primary melanoma of the skin has a favorable outcome if diagnosed early, metastatic melanoma can be fatal. Therefore, an improved understanding of the pathogenesis of metastatic melanoma has gained increasing attention, including the role of epigenetic modification and competing endogenous RNA (ceRNA). In 2017, the US National Cancer Database identified 80,907 patients with stage 0–IV melanoma and analyzed the patterns of patient outcome [1]. The occurrence and progression of metastatic melanoma arise due to the separate or combined action of genetic and epigenetic factors [2–4].
Recent studies have been undertaken to determine the genetic associations with the progression of melanoma, including the epigenetic mechanisms that modulate gene expression, such as gene methylation, changes in chromatin, and the roles of noncoding RNAs [5,6]. The functions of microRNAs (miRNAs) in melanoma have been relatively well studied [7], but some differentially expressed long noncoding RNAs (lncRNAs) can also modulate essential genes [8]. The findings of these studies indicate that genetic factors influence the functions of signaling pathways that interact to form ceRNA networks.
In the pathogenesis of melanoma, the ability of tumor cells to migrate and metastasize is an important property. During this complex regulatory process, the mRNAs of tumor cells and the proteins they encode become abnormal, while the involved noncoding RNAs exhibit spatial and temporal specificity and include miRNAs. For example, miRNA-331 can inhibit the proliferation and metastasis of melanoma cells by down-regulating AEG-1 gene expression [9]. Recently, the lncRNAs have also been identified as noncoding RNAs that participate in the regulation of gene and protein expression at the epigenetic level [10]. There has been increasing interest in the role of lncRNA in the regulation of the function of miRNA by acting as endogenous sponges to regulate mRNA. Therefore, an increased understanding of the processes involved in the development of the ceRNA network in melanoma may result in improved understanding of the mechanisms involved of metastasis of melanoma.
This study aimed to used bioinformatics data to undertake an integrative analysis of lncRNA, miRNA, and mRNA expression to construct a ceRNA network in metastatic melanoma. Data from the Cancer Genome Atlas (TCGA), the Gene Ontology (GO) database, and Kyoto Encyclopedia of Genes and Genomes (KEGG) pathway were analyzed and cases of non-metastatic melanoma and metastatic melanoma were compared.
Material and Methods
Dataset selection from The Cancer Genome Atlas (TCGA)
Data were downloaded from The Cancer Genome Atlas (TCGA) (https://cancergenome.nih.gov/), and level 3 counts data were analyzed. There were 471 cases of metastatic melanoma that included transcriptome sequencing data, including long noncoding RNA (lncRNA) and mRNA, and 452 cases of microRNA (miRNA) sequencing data. Of the 471 samples, there were 103 primary solid tumors and 368 metastatic melanoma samples.
Selection of differentially expressed genes
Differentially expressed genes were compared between cases of metastatic melanoma and non-metastatic primary melanoma and were processed and analyzed using the edgeR package in R language version 3.4.4. Using the fold change (FC), the standard for differential expression was logFC ≥2 and false discovery rate (FDR) <0.05. The significant difference in miRNA data was logFC ≥1 and FDR <0.05.
Gene Ontology (GO) analysis and Kyoto Encyclopedia of Genes and Genomes (KEGG) pathway enrichment analysis
Gene Ontology (GO) analysis and Kyoto Encyclopedia of Genes and Genomes (KEGG) pathway enrichment analysis of mRNA was performed using the R language version 3.4.4 cluster Profiler, org.Hs.eg.db genome-wide annotation, the pathview R package, the topGO package, and the enrichplot package to analyze enrichment status. The ggplot2 package to was used to create graphics in R. An FDR <0.05 was used to compare the results.
Interactions between miRNAs and mRNAs and between IncRNAs and miRNAs
The relationship between miRNAs and target mRNAs was analyzed using three databases that included the miRDB database for miRNA target prediction, the miRTarBase database containing miRNA-target interactions (MTIs), and TargetScan to predict biological targets of miRNAs. The intersection of the results predicted by the three databases was used to make the final determination. The relationship between IncRNAs and miRNAs was analyzed to predict the target site binding using the miRcode database.
Construction of the competing endogenous RNA (ceRNA) network
The competing endogenous RNA (ceRNA) network was constructed from the data of the differential expression of miRNAs, mRNAs, and IncRNAs. The cross-linking relationship and network construction were performed using Cytoscape version 3.6.0.
Survival analysis
The survival diversity of differentially expressed miRNAs, mRNAs, and IncRNAs were analyzed, and the results of the survival analysis of miRNAs, mRNAs, and IncRNAs involved in ceRNA regulation were evaluated. The analysis was conducted using the survival package of R language 3.4.4 and used the Cox regression model.
Results
Identification of differentially expressed mRNAs (DEmRNAs), differentially expressed long noncoding RNAs (DEIncRNAs), and differentially expressed microRNAs (DEmiRNAs)
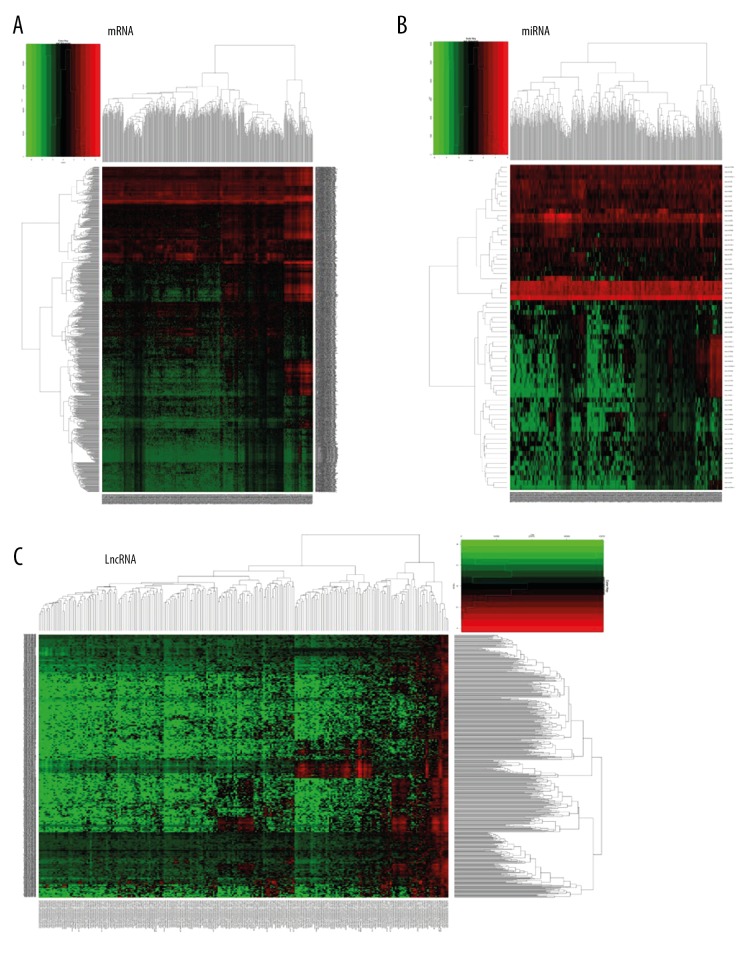
There were 368 tissue samples of metastatic melanoma that were compared with 103 tissue samples from cases of primary melanoma. Data processing identified the mRNA of 426 upregulated genes, including C7, CR1, LIFR, SFTPB, TNFSF11, and ADAMTSL3, in tissue samples of metastatic melanoma and mRNA from 430 down-regulated genes, including CNFN, TGM1, S100A9, ASPRV1, CYSRT1, and S100A8). The volcano maps and heat maps are shown in Figures 1 and 2, respectively. The miRNA dataset involved only 449 samples, including 352 samples of metastatic melanoma and 97 samples of primary non-metastatic melanoma, of which 47 were upregulated human (hsa) miRNAs (hsa-mir-675, -153-2, -326, -1224, -29c, and -150) and 20 were down-regulated miRNAs (hsa-mir-944, -122, -200c, -203, -200a and -141). The volcano and heat maps are shown in Figures 1 and 2. There were 368 metastatic melanoma IncRNA samples identified with 184 upregulated genes, including LINC01235, LINC00824, AC243960.1, CHRM3-AS2, MEOX2-AS1, and LINC00861, and 66 down-regulated genes, including AL512274.1, AC012313.4, FAM83A-AS1, LINC01214, FAM41C, and NCF4-AS1. The volcano and heat maps are shown in Figures 1 and 2. The ten main differentially expressed genes are shown in Table 1.
Figure 1.
Volcano plots showing upregulated and down-regulated mRNAs, microRNAs (miRNAs), and long noncoding RNAs (lncRNAs). (A) The red dots represent high expression, and the green dots represent low expression of mRNAs. (B) The red dots represent high expression, and the green dots represent low expression of microRNAs (miRNAs). (C) The red dots represent high expression, and the green dots represent low expression of long noncoding RNAs (lncRNAs).
Figure 2.
Cluster analysis (heat maps) of differentially expressed profiles of mRNAs, microRNAs (miRNAs), and long noncoding RNAs (lncRNAs) in metastatic melanoma compared with non-metastatic primary melanoma. (A) Red represents high expression and green represents low expression of mRNAs. (B) Red represents high expression and green represents low expression of microRNAs (miRNAs). (C) Red represents high expression and green represents low expression of long noncoding RNAs (lncRNAs).
Table 1.
Differentially expressed genes (DEGs) in metastatic melanoma.
| mRNA | LncRNA | miRNA | ||||||
|---|---|---|---|---|---|---|---|---|
| mRNA name | logFC | FDC | LncRNA name | logFC | FDC | miRNA name | logFC | FDC |
| Up | ||||||||
| C7 | 3.839934154 | 5.78E-30 | LINC01235 | 2.352846131 | 6.81E-31 | hsa-mir-675 | 2.12051588 | 8.36E-16 |
| CR1 | 2.594788352 | 5.56E-28 | LINC00824 | 5.582496738 | 5.01E-18 | hsa-mir-153-2 | 2.067727688 | 9.13E-13 |
| LIFR | 3.106396676 | 4.93E-26 | AC243960.1 | 2.19105239 | 2.60E-17 | hsa-mir-326 | 1.052678783 | 1.32E-09 |
| SFTPB | 8.285962923 | 2.96E-25 | CHRM3-AS2 | 3.067286894 | 3.94E-17 | hsa-mir-1224 | 2.978304855 | 2.82E-09 |
| TNFSF11 | 3.079321797 | 3.62E-25 | MEOX2-AS1 | 3.814202792 | 5.94E-17 | hsa-mir-29c | 1.104617239 | 4.49E-09 |
| ADAMTSL3 | 2.026041603 | 8.45E-25 | LINC00861 | 2.391722421 | 1.10E-16 | hsa-mir-150 | 1.484746085 | 4.52E-08 |
| SHISA3 | 4.042034643 | 1.66E-23 | AL365361.1 | 2.082374044 | 1.37E-16 | hsa-mir-216a | 2.127136119 | 5.20E-08 |
| NRK | 4.871179386 | 3.87E-22 | LINC01624 | 2.099473577 | 2.80E-16 | hsa-mir-3130-1 | 1.033150931 | 5.99E-08 |
| SFRP4 | 2.997930898 | 4.06E-22 | LINC01215 | 2.817443132 | 1.24E-15 | hsa-mir-3681 | 2.48345131 | 2.20E-07 |
| PIK3CG | 2.093839749 | 5.11E-22 | LINC01857 | 2.077410061 | 8.96E-14 | hsa-mir-1274b | 1.030287529 | 1.81E-06 |
| Down | ||||||||
| CNFN | −5.699600094 | 1.09E-171 | AL512274.1 | −4.224611928 | 7.11E-87 | hsa-mir-944 | −3.27857278 | 1.62E-47 |
| TGM1 | −5.791845402 | 1.47E-164 | AC012313.4 | −4.946658392 | 1.93E-72 | hsa-mir-122 | −5.410911046 | 1.62E-47 |
| S100A9 | −5.16290397 | 9.14E-146 | FAM83A-AS1 | −4.604234392 | 1.94E-60 | hsa-mir-200c | −2.958796522 | 1.40E-41 |
| ASPRV1 | −5.048838334 | 5.73E-136 | LINC01214 | −5.090711236 | 2.95E-57 | hsa-mir-203 | −4.065568357 | 1.61E-41 |
| CYSRT1 | −3.497019094 | 6.09E-136 | FAM41C | −4.932962752 | 5.74E-55 | hsa-mir-200a | −2.372170721 | 1.35E-32 |
| S100A8 | −5.699554589 | 7.47E-131 | NCF4-AS1 | −4.674385861 | 5.52E-49 | hsa-mir-141 | −2.643606753 | 1.73E-32 |
| CSTA | −4.514244463 | 3.23E-129 | LINC01527 | −6.606796942 | 4.98E-45 | hsa-mir-200b | −2.485504395 | 5.88E-32 |
| LYPD3 | −5.118944118 | 6.77E-129 | LINC02159 | −3.891147861 | 4.87E-41 | hsa-mir-205 | −4.46957192 | 8.11E-31 |
| C19orf33 | −5.118319104 | 1.22E-127 | C7orf71 | −3.944681738 | 3.01E-39 | hsa-mir-224 | −1.513424825 | 1.90E-25 |
| S100A2 | −4.940472399 | 5.41E-124 | AC083841.1 | −3.352562554 | 1.74E-34 | hsa-mir-891a | −2.050685361 | 1.54E-12 |
mRNA Gene Ontology (GO) and Kyoto Encyclopedia of Genes and Genomes (KEGG) pathway analysis in metastatic melanoma
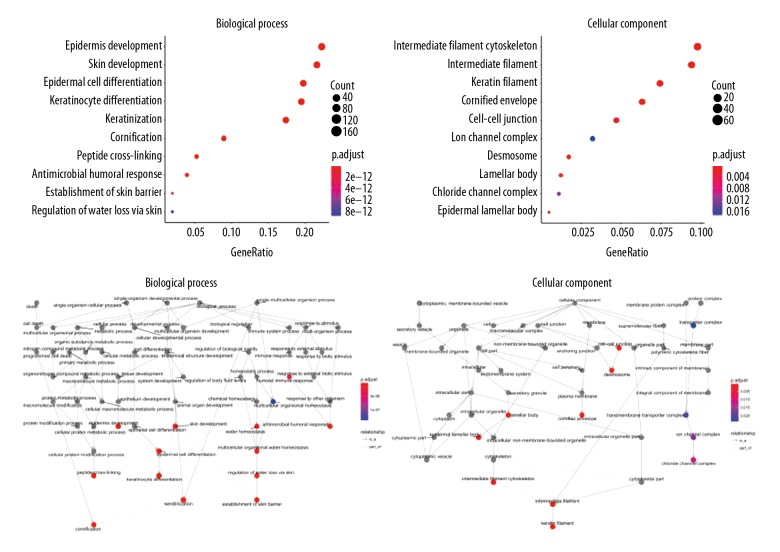
The Gene Ontology (GO) database offered structured or controlled vocabularies and classifications concerning many molecular and cellular domains. In total, 856 differentially expressed genes were analyzed with the GO database. There were 74 differentially enrichment terms involved in biological processes, including 19 in the cellular component. The ten main terms are shown in Table 2 and Figure 3. In the Kyoto Encyclopedia of Genes and Genomes (KEGG) database, 13 KEGG pathways of the differentially expressed mRNA were identified. The ten main pathways are shown in Table 3 and Figure 4.
Table 2.
mRNA GO analysis in metastatic melanoma.
| Biological process | Cellular component | ||||||
|---|---|---|---|---|---|---|---|
| GOID | GO name | Diff/count | FDR | GOID | GO name | Diff/count | FDR |
| GO: 0030216 | Keratinocyte differentiation | 147/752 | 2.81E-117 | GO: 0001533 | Cornified envelope | 51/807 | 2.98E-55 |
| GO: 0031424 | Keratinization | 131/752 | 5.73E-117 | GO: 0045095 | Keratin filament | 60/807 | 1.12E-54 |
| GO: 0043588 | Skin development | 163/752 | 5.84E-113 | GO: 0005882 | Intermediate filament | 76/807 | 9.18E-50 |
| GO: 0008544 | Epidermis development | 168/752 | 9.59E-111 | GO: 0045111 | Intermediate filament cytoskeleton | 79/807 | 6.20E-47 |
| GO: 0009913 | Epidermal cell differentiation | 149/752 | 1.75E-108 | GO: 0030057 | Desmosome | 14/807 | 2.03E-11 |
| GO: 0070268 | Cornification | 67/752 | 3.69E-59 | GO: 0042599 | Lamellar body | 10/807 | 1.12E-07 |
| GO: 0018149 | Peptide cross-linking | 39/752 | 2.35E-36 | GO: 0097209 | Epidermal lamellar body | 4/807 | 0.00022698 |
| GO: 0019730 | Antimicrobial humoral response | 29/752 | 3.21E-13 | GO: 0005911 | Cell-cell junction | 38/807 | 0.001175796 |
| GO: 0061436 | Establishment of skin barrier | 14/752 | 1.31E-12 | GO: 0034707 | Chloride channel complex | 9/807 | 0.011451671 |
| GO: 0033561 | Regulation of water loss via skin | 14/752 | 8.98E-12 | GO: 0034702 | Ion channel complex | 26/807 | 0.016861797 |
Figure 3.
The ten main Gene Ontology (GO) database enrichment terms for differentially expressed intersection mRNAs
Table 3.
mRNA pathway analysis in metastatic melanoma.
| Path ID | Pathway name | Diff/count | FDR | Path ID | Pathway name | Diff/count | FDR |
|---|---|---|---|---|---|---|---|
| 00830 | Retinol metabolism | 15 | 2.72E-06 | 05204 | Chemical carcinogenesis | 12 | 0.001542268 |
| 04970 | Salivary secretion | 16 | 1.30E-05 | 00982 | Drug metabolism – cytochrome P450 | 11 | 0.001542268 |
| 00140 | Steroid hormone biosynthesis | 13 | 1.30E-05 | 00980 | Metabolism of xenobiotics by cytochrome P450 | 11 | 0.002284669 |
| 00591 | Linoleic acid metabolism | 9 | 3.55E-05 | 04080 | Neuroactive ligand-receptor interaction | 24 | 0.002420363 |
| 00590 | Arachidonic acid metabolism | 11 | 0.000660459 | 00592 | alpha-Linolenic acid metabolism | 6 | 0.005599798 |
Figure 4.
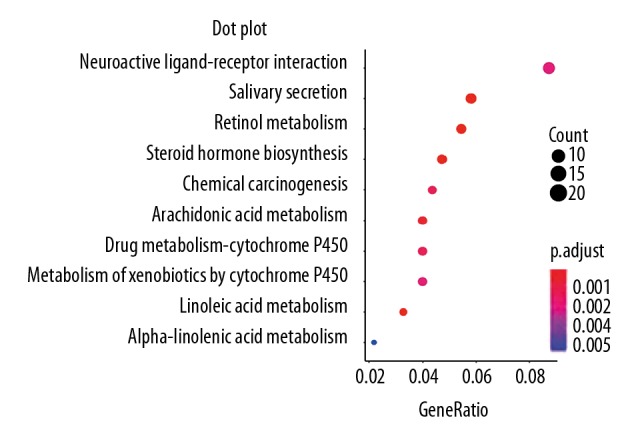
The ten main pathway enrichment terms for differentially expressed intersection mRNAs.
Interactions between miRNAs and mRNAs and between IncRNAs and miRNAs
In total, 1591 pairs of miRNA-mRNA interactions were predicted by miRDB, miRTarBase, and TargetScan databases, and 57 pairs of IncRNA-miRNA interactions were predicted using the miRcode database.
Competing endogenous RNA (ceRNA) network analysis
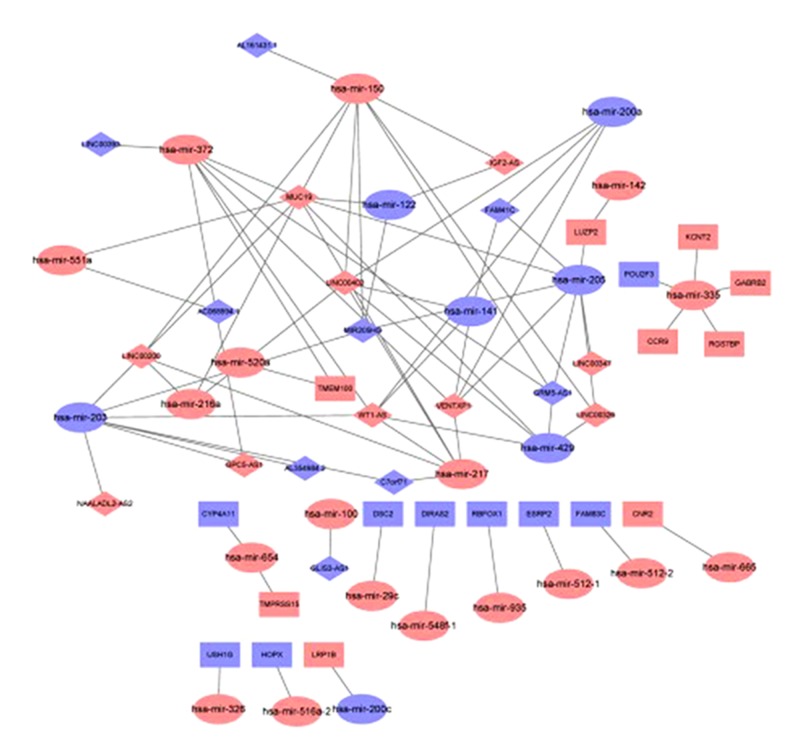
The construction of the competing endogenous RNA (ceRNA) network was visualized using Cytoscape. There were 77 pairs of interactive relationships identified, but only two mRNAs, TMEM100 and LUZP2, were involved in the miRNA-IncRNA interaction. In total, 16 pairs of miRNA-mRNA interactions and one pair of miRNA-IncRNA interaction were found. The mRNA, lncRNA, and miRNA network is shown in Figure 5.
Figure 5.
The mRNA, long noncoding RNA (lncRNA), and microRNA (miRNA) network. Red and blue represent upregulated and downregulated RNAs, respectively. Ellipses, rectangles, and rhomboids represent microRNAs (miRNAs), mRNAs and long noncoding RNAs (lncRNAs), respectively.
Survival curve analysis
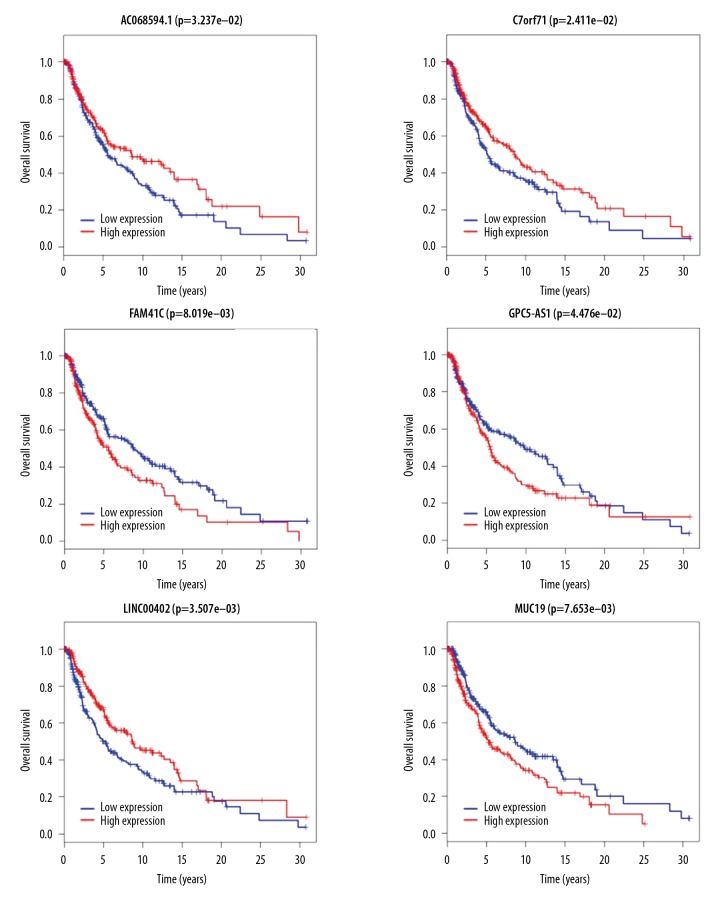
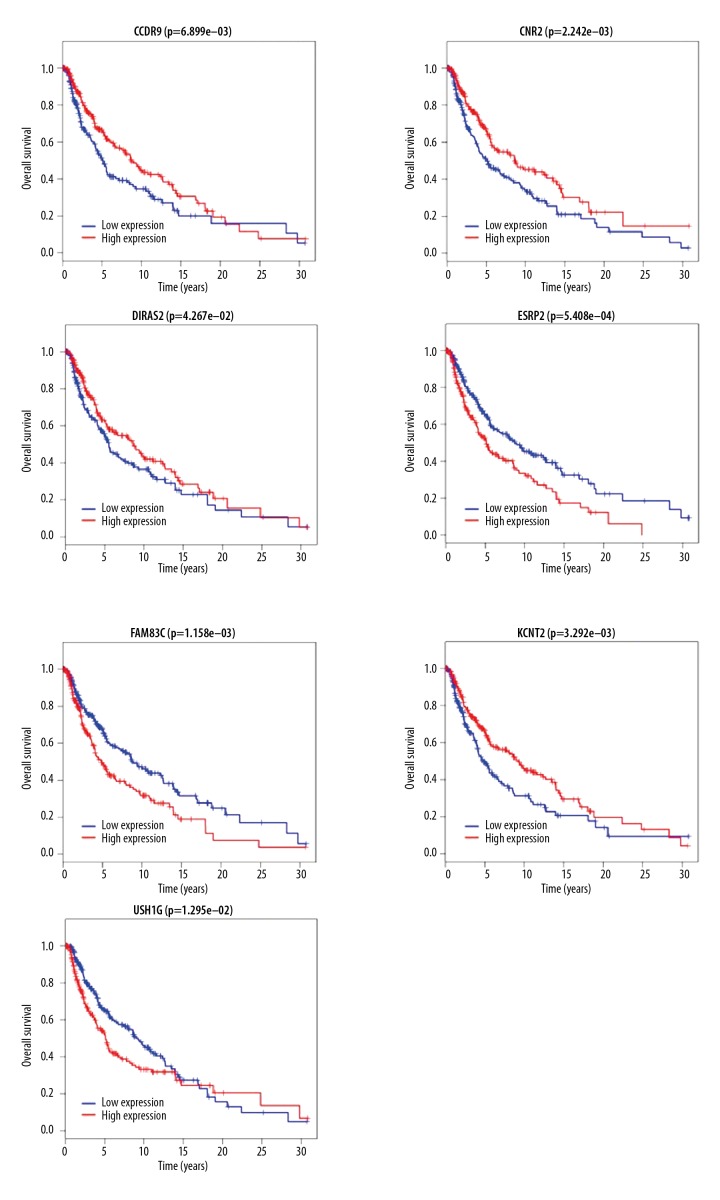
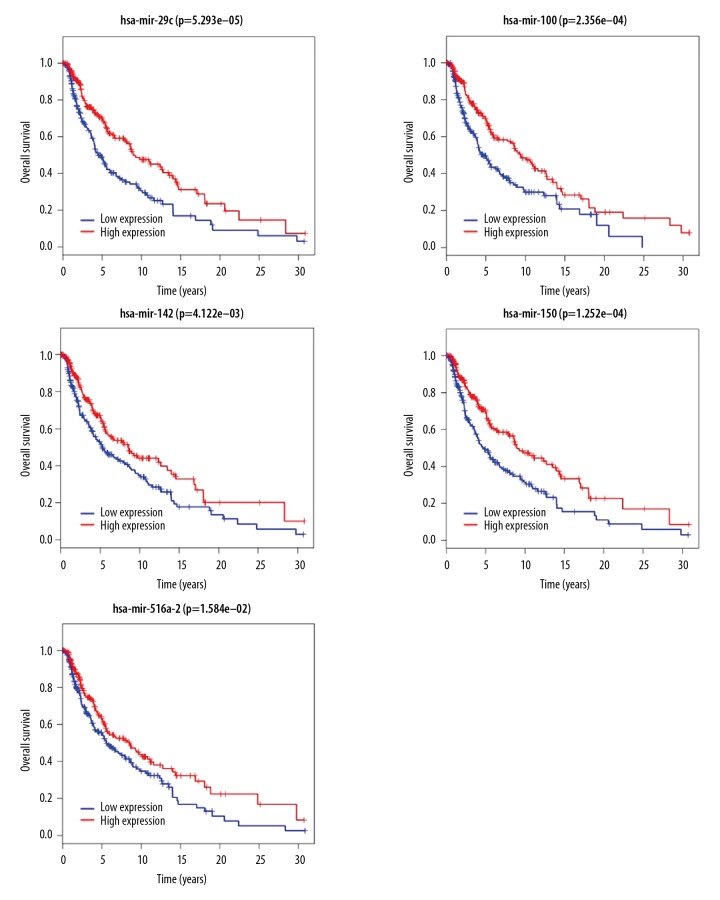
The differential expression of 58 IncRNAs, 221 mRNAs, and eight miRNAs were correlated with the patient survival time. Survival analysis identified seven differentially expressed mRNAs, five differentially expressed miRNAs (miRNA-29c, miRNA-100, miR-142-3p, miR-150, and miR-516a-2), and six differentially expressed lncRNAs (AC068594.1, C7orf71, FAM41C, GPC5-AS1, MUC19, and LINC00402) that were correlated with reduced survival time in patients with metastatic melanoma. The patient survival curves of the relationships between IncRNAs, mRNAs, and miRNAs are shown in Figures 6–8, respectively.
Figure 6.
Survival curves for the six long noncoding RNA (lncRNA) associated with overall survival (OS).
Figure 7.
Survival curves for the seven mRNAs associated with overall survival (OS).
Figure 8.
Survival curves for the five microRNAs (miRNAs) associated with overall survival (OS).
Discussion
Several large epidemiological studies of the incidence and mortality rates from melanoma have shown that the incidence of metastatic melanoma has steadily increased over the past 50 years [12]. During the study period from 1993 to 2012, the overall incidence per 100,000 persons rose from 0.11 to 0.19. In 2012, there were 232,000 new cases of melanoma in the world with 55,000 deaths [13]. The clinical management of melanoma results in a large health and economic burden, which includes the requirement to develop new chemotherapy agents, surgical procedures, and patient care [14]. The long-term survival rate can be improved if early-stage or non-metastatic primary melanoma can be correctly diagnosed and completely surgically excised. The long-term survival rate after the occurrence of metastasis remains very low [15].
Advances in gene sequencing techniques and the development of bioinformatics databases have allowed analytical research using these public databases for secondary data integration and analysis. The present study used bioinformatics data to undertake the integrative analysis of long noncoding RNA (lncRNA), microRNA (miRNA) and mRNA expression to construct a competing endogenous RNA (ceRNA) network in metastatic melanoma. Data from the Cancer Genome Atlas (TCGA), the Gene Ontology (GO) database, and Kyoto Encyclopedia of Genes and Genomes (KEGG) pathway were analyzed. The three types of differentially expressed RNAs involved in the regulation of the ceRNA network in metastatic melanoma underwent survival analysis, and patient prognosis was found to be associated with abnormal expression of six IncRNAs, seven mRNAs and five miRNAs.
In the present study, seven differentially expressed mRNAs were identified. CCR9 belongs to the beta chemokine receptor family [16] and its expression has previously been shown to be involved in the intestinal metastasis of melanoma cells [17]. The findings of the present study showed high expression levels of CCR9 in metastatic melanoma, and survival analysis showed that patients with increased CCR9 expression had increased survival times. This finding might be related to the complex immune responses that occur in vivo and also to epigenetic modification in metastatic melanoma. The findings of the present study showed high expression levels of CNR2 in metastatic melanoma. CNR2 is a G protein-coupled receptor (GPCR) for endocannabinoid 2-arachidonoylglycerol that mediates the inhibition of adenylate cyclase and may be active in inflammatory reactions, nociceptive transmission, and bone homeostasis. CNR2 can bind with GPCRs and CXCR4 to form a nonfunctional heterodimer, which anchors tumor cell membranes and inhibits the migration of tumor cells [18]. Bioinformatics analysis also showed that high CNR2 expression was positively correlated with the survival time in patients with metastatic melanoma, indicating that CNR2 might an inhibitory factor during the progression of melanoma. The findings of the present study showed low expression levels of DIRAS2 in metastatic melanoma. DIRAS2 has previously been shown to act as an anti-oncogene that inhibited the growth, migration, and proliferation of ovarian cancer cells in vitro [19]. The results of the present study showed that although DIRAS2 was expressed at lower levels in metastatic melanoma tissues, DIRAS2 expression was positively correlated with survival time. Therefore, studying the regulatory mechanism of DIRAS2 genes might contribute to further understanding of the pathogenesis of metastatic melanoma, as DIRAS2 may a tumor suppressor [20]. The findings of the present study showed low expression levels of ESRP2 in metastatic melanoma. ESRP2, which belongs to the hnRNP family of RNA-binding proteins, modulates alternative splicing events associated with epithelial phenotypes [21]. In this study, although ESRP2 was expressed at lower levels in metastatic melanoma tissues, patients with low ESRP2 expression had increased overall survival, which might be explained by the dual roles of ESRP2 [21].
In the present study, five differentially expressed miRNAs were all upregulated in metastatic melanoma tissues, including miRNA-29c, miRNA-100, miR-142-3p, miR-150, miR-516a-2, and the upregulation of each differential miRNA was positively correlated with patient survival time, indicating that these five miRNAs might be inhibitory factors of melanoma metastasis. In previous studies, miRNA-29c has been shown to be downregulated in prostate cancer and non-small cell lung cancer (NSCLC) [22,23]. Also, miRNA-100 [24], miR-142-3p [25] and miR-150 [26] have previously been reported to inhibit the proliferation of gastric cancer cells, liver cell cancer cells and melanoma cells in vitro, through the targeted suppression of the CXCR7, LDHA, and MYB genes, respectively. However, the effects of miR-516a-2 have not been previously reported.
In the present study, six differentially expressed lncRNAs, AC068594.1, C7orf71, FAM41C, GPC5-AS1, MUC19, and LINC00402, were identified in patients with metastatic melanoma. High expression levels of the lncRNAs, C068594.1 and C7orf71, which were downregulated in metastatic melanoma, were positively correlated with survival time, and patients with lower expression levels of the lncRNA, FAM41C, had increased survival times. Lower expression of GPC5-AS1 and MUC19, which were upregulated in metastatic melanoma, and increased expression of LINC00402 were all associated with increased patient survival time. However, these lncRNAs have not been previously reported.
In the present study, cancer-specific miRNAs, lncRNAs and mRNAs in metastatic melanoma were identified by bioinformatics analysis of large numbers of patients with a confirmed tissue diagnosis. Constructing the ceRNA network in metastatic melanoma may identify potential diagnostic or therapeutic targets for melanoma or other types of malignancy. This study has highlighted new approaches to investigate the functions and mechanisms of ceRNAs in human cancers through the use of publicly available genomic data.
Conclusions
Bioinformatics data and integrative analysis methods using a large patient sample size identified long noncoding RNA (lncRNA), microRNA (miRNA) and mRNA expression to construct a competing endogenous RNA (ceRNA) and patient survival network in metastatic melanoma. These findings support the need for further studies on the mechanisms involved in the regulation of metastatic melanoma by ceRNAs. The use of public genomic data might identify potential therapeutic targets and provide new ways to investigate the functions and mechanisms of ceRNAs in melanoma and other malignant tumors.
Footnotes
Conflict of interest
None.
Source of support: Departmetnal sources
References
- 1.Sitenga JL, Aird G, Ahmed A, et al. Socioeconomic status and survival for patients with melanoma in the United States: An NCDB analysis. Int J Dermatol. 2018;57(10):1149–56. doi: 10.1111/ijd.14026. [DOI] [PubMed] [Google Scholar]
- 2.Park JJ, Diefenbach RJ, Joshua AM, et al. Oncogenic signaling in uveal melanoma. Pigment Cell Melanoma Res. 2018;31(6):661–72. doi: 10.1111/pcmr.12708. [DOI] [PubMed] [Google Scholar]
- 3.Fischer GM, Vashisht Gopal YN, McQuade JL, et al. Metabolic strategies of melanoma cells: Mechanisms, interactions with the tumor microenvironment, and therapeutic implications. Pigment Cell Melanoma Res. 2018;31:11–30. doi: 10.1111/pcmr.12661. [DOI] [PMC free article] [PubMed] [Google Scholar]
- 4.Adler NR, Haydon A, McLean CA, et al. Metastatic pathways in patients with cutaneous melanoma. Pigment Cell Melanoma Res. 2017;30:13–27. doi: 10.1111/pcmr.12544. [DOI] [PubMed] [Google Scholar]
- 5.Leucci E, Coe EA, Marine JC, Vance KW. The emerging role of long non-coding RNAs in cutaneous melanoma. Pigment Cell Melanoma Res. 2016;29:619–26. doi: 10.1111/pcmr.12537. [DOI] [PubMed] [Google Scholar]
- 6.Ross CL, Kaushik S, Valdesrodriguez R, Anvekar R. MicroRNAs in cutaneous melanoma: Role as diagnostic and prognostic biomarkers. J Cell Physiol. 2018;233(7):5133–41. doi: 10.1002/jcp.26395. [DOI] [PubMed] [Google Scholar]
- 7.Romano G, Kwong LN. miRNAs, melanoma and microenvironment: An intricate network. Int J Mol Sci. 2017;18(11) doi: 10.3390/ijms18112354. pii: E2354. [DOI] [PMC free article] [PubMed] [Google Scholar]
- 8.Hulstaert E, Brochez L, Volders PJ, Vandesompele J, Mestdagh P. Long noncoding RNAs in cutaneous melanoma: Clinical perspectives. Oncotarget. 2017;8:43470–80. doi: 10.18632/oncotarget.16478. [DOI] [PMC free article] [PubMed] [Google Scholar]
- 9.Chen L, Ma G, Cao X, et al. MicroRNA-331 inhibits proliferation and invasion of melanoma cells by targeting astrocyte-elevated gene-1. Oncol Res. 2018 doi: 10.3727/096504018X15186047251584. [Epub ahead of print] [DOI] [PMC free article] [PubMed] [Google Scholar]
- 10.Wilusz JE, Sunwoo H, Spector DL. Long noncoding RNAs: Functional surprises from the RNA world. Genes Dev. 2009;23:1494–504. doi: 10.1101/gad.1800909. [DOI] [PMC free article] [PubMed] [Google Scholar]
- 11.Miladinovic B, Kumar A, Mhaskar R, et al. A flexible alternative to the Cox proportional hazards model for assessing the prognostic accuracy of hospice patient survival. PLoS One. 2012;7(10):e47804. doi: 10.1371/journal.pone.0047804. [DOI] [PMC free article] [PubMed] [Google Scholar]
- 12.Rigel DS, Carucci JA. Malignant melanoma: Prevention, early detection, and treatment in the 21st century. Cancer J Clin. 2000;50:215–36. doi: 10.3322/canjclin.50.4.215. [DOI] [PubMed] [Google Scholar]
- 13.Ferlay J, Soerjomataram I, Dikshit R, et al. Cancer incidence and mortality worldwide: sources, methods and major patterns in GLOBOCAN 2012. Int J Cancer. 2015;136:E359–86. doi: 10.1002/ijc.29210. [DOI] [PubMed] [Google Scholar]
- 14.Meng Y, Hertel N, Ellis J, et al. The cost-effectiveness of nivolumab monotherapy for the treatment of advanced melanoma patients in England. Eur J Health Econ. 2018;19(8):1163–72. doi: 10.1007/s10198-018-0964-4. [DOI] [PubMed] [Google Scholar]
- 15.Filippi AR, Fava P, Badellino S, et al. Radiotherapy and immune checkpoints inhibitors for advanced melanoma. Radiother Oncol. 2016;120:1–12. doi: 10.1016/j.radonc.2016.06.003. [DOI] [PubMed] [Google Scholar]
- 16.Norment AM, Bogatzki LY, Gantner BN, Bevan MJ. Murine CCR9, a chemokine receptor for thymus-expressed chemokine that is upregulated following pre-TCR signaling. J Immunol. 2000;164:639–48. doi: 10.4049/jimmunol.164.2.639. [DOI] [PubMed] [Google Scholar]
- 17.Amersi FF, Terando AM, Goto Y, et al. Activation of CCR9/CCL25 in cutaneous melanoma mediates preferential metastasis to the small intestine. Clin Cancer Res. 2008;14:638–45. doi: 10.1158/1078-0432.CCR-07-2025. [DOI] [PMC free article] [PubMed] [Google Scholar]
- 18.Scarlett KA, White EZ, Coke CJ, et al. Agonist-induced CXCR4 and CB2 heterodimerization inhibits Galpha13/RhoA-mediated migration. Mol Cancer Res. 2018;16:728–39. doi: 10.1158/1541-7786.MCR-16-0481. [DOI] [PMC free article] [PubMed] [Google Scholar]
- 19.Sutton MN, Lu Z, Bast RC. Abstract A43: DIRAS1 and DIRAS2 are tumor suppressor candidates that inhibit cell growth, motility, and proliferation while regulating autophagy in ovarian cancer. Clin Cancer Res. 2016;22:A43. [Google Scholar]
- 20.Mizutani A, Koinuma D, Seimiya H, Miyazono K. The Arkadia-ESRP2 axis suppresses tumor progression: analyses in clear-cell renal cell carcinoma. Oncogene. 2016;35:3514–23. doi: 10.1038/onc.2015.412. [DOI] [PMC free article] [PubMed] [Google Scholar]
- 21.Hayakawa A, Saitoh M, Miyazawa K. Dual roles for epithelial splicing regulatory proteins 1 (ESRP1) and 2 (ESRP2) in cancer progression. Adv Exp Med Biol. 2017;925:33–40. doi: 10.1007/5584_2016_50. [DOI] [PubMed] [Google Scholar]
- 22.Zhan S, Wang C, Yin F. MicroRNA-29c inhibits proliferation and promotes apoptosis in non-small cell lung cancer cells by targeting VEGFA. Mol Med Rep. 2018;17:6705–10. doi: 10.3892/mmr.2018.8678. [DOI] [PubMed] [Google Scholar]
- 23.Li J, Fu F, Wan X, et al. Upregulated miR-29c inhibits cell proliferation and glycolysis by inhibiting SLC2A3 expression in prostate cancer. Gene. 2018;665:26–34. doi: 10.1016/j.gene.2018.04.086. [DOI] [PubMed] [Google Scholar]
- 24.Cao Y, Song J, Ge J, et al. MicroRNA-100 suppresses human gastric cancer cell proliferation by targeting CXCR7. Oncol Lett. 2018;15:453–58. doi: 10.3892/ol.2017.7305. [DOI] [PMC free article] [PubMed] [Google Scholar]
- 25.Hua S, Liu C, Liu L, Wu D. miR-142-3p inhibits aerobic glycolysis and cell proliferation in hepatocellular carcinoma via targeting LDHA. Biochem Biophys Res Commun. 2018;496:947–54. doi: 10.1016/j.bbrc.2018.01.112. [DOI] [PubMed] [Google Scholar]
- 26.Sun X, Zhang C, Cao Y, Liu E. MiR-150 suppresses tumor growth in melanoma through downregulation of MYB. Oncol Res. 2018 doi: 10.3727/096504018X15228863026239. [Epub ahead of print] [DOI] [PMC free article] [PubMed] [Google Scholar]


