

Abstract
Aims
There are regional differences in the patient characteristics, management, and outcomes of hospitalized patients with heart failure (HF). The aim of this study was to evaluate the clinical characteristics and outcomes of Japanese patients who are hospitalized with HF on the basis of the left ventricular ejection fraction (LVEF) stratum.
Methods and results
We retrospectively conducted a multicentre cohort study of 1245 hospitalized patients with decompensated HF between 2013 and 2014. Of these patients, 36% had an LVEF < 40% [HF with reduced ejection fraction (HFrEF), median age 72 years, 71% male], 21% had an LVEF 40–49% [HF with mid‐range EF (HFmrEF), 77 years, 56% male], and 43% had an LVEF ≥ 50% [HF with preserved EF (HFpEF), 81 years, 44% male]. The primary outcome was death from any cause, and the secondary outcomes were cardiac death and re‐hospitalization due to worsened HF after hospital discharge. There were high proportions of non‐ischaemic cardiomyopathy (32%) in HFrEF patients, coronary artery disease (44%) in HFmrEF patients, and valvular disease (39%) in HFpEF patients. The frequencies of intravenous diuretic and natriuretic peptide administration during hospitalization were 66% and 30%, respectively. The median hospital stay for the overall population was 19 days, and the length of stay was >7 days for >90% of patients. In‐hospital mortality was 7%, but was not different among the LVEF groups (HFrEF 7%, HFmrEF 6%, and HFpEF 8%). After a median follow‐up of 19 months (range, 3–26 months), 192 (17%) of the 1156 patients who were discharged alive died, and 534 (46%) were re‐hospitalized after hospital discharge. There were no significant differences in mortality after hospital discharge among the three LVEF groups (HFrEF 18%, HFmrEF 16%, and HFpEF 16%). There were no differences in cardiac death or re‐hospitalization due to worsened HF after hospital discharge among the LVEF groups (cardiac death: HFrEF 8%, HFmrEF 7%, and HFpEF 7%; re‐hospitalization due to worsened HF: HFrEF 19%, HFmrEF 16%, and HFpEF 17%). Multivariable‐adjusted analyses showed that the HFmrEF and HFrEF groups, compared with the HFpEF group, were not associated with an increased risk for in‐hospital death or death after hospital discharge. Non‐cardiac causes of death and re‐hospitalization after hospital discharge accounted for 35% and 38%, respectively.
Conclusions
Our results revealed different clinical characteristics but similar mortality rates in the HFrEF, HFmrEF, and HFpEF groups. The most common cause of death and re‐hospitalization after hospital discharge was HF, but non‐cardiac causes also contributed to their prognosis. Integrated management approaches will be required for HF patients.
Keywords: Heart failure, Hospitalization, Japanese, Left ventricular ejection fraction, Mortality
Introduction
Heart failure (HF) is a global public health problem that affects 26 million people worldwide.1, 2 In Japan, it is estimated that 1.0 million individuals have HF or left ventricular dysfunction.3, 4, 5 The Japan Patient Survey 2014 of the Ministry of Health, Labour and Welfare reported that the estimated number of patients receiving medical treatment for HF was >300 000.6 Data from the Japanese Registry of All Cardiac and Vascular Disease revealed that 215 548 patients were admitted to 1573 cardiovascular specialty hospitals for HF and that 17 543 (8.1%) patients experienced in‐hospital death in 2016.7 The number of patients hospitalized for HF increases by 10 000 per year as a result of the growing elderly population, and the economic burden has concomitantly increased.
HF is categorized on the basis of the left ventricular ejection fraction (LVEF). The outcomes of HF patients with a reduced EF (HFrEF), which is defined as a clinical diagnosis of HF and an LVEF ≤ 40%, have improved with advancements in evidence‐based medical therapies and device therapies. However, half of patients hospitalized for HF have a preserved EF (HFpEF), and the proportion of hospitalizations for HFpEF is increasing. A meta‐analysis reported that patients with HFpEF had a lower risk of death than had patients with HFrEF, but their absolute mortality was high.8 There remains a lack of evidence regarding the management of HFpEF. Furthermore, the optimal cut‐off for defining a preserved or reduced EF remains unclear (40% or 50%), and how to classify patients who are in the ‘grey zone’ (40–49%) remains controversial.9, 10 The European Society of Cardiology (ESC) has proposed mid‐range EF (HFmrEF) as a new category of HF that includes patients with an LVEF of 40–49%.11 However, the characteristics, management, and outcomes of these grey zone patients have yet to be established.
There are regional differences in the patient characteristics, management, and outcomes of hospitalized HF patients.12 Japanese cohorts in the 2000s, compared with cohorts from the USA and Europe, revealed different clinical characteristics and medical treatments for hospitalized HF patients.3, 13, 14, 15, 16 Over the past decade, the use of evidence‐based pharmacotherapies and device therapies, including implantable cardioverter‐defibrillators (ICDs) and cardiac resynchronization therapy, has increased in Japan. Therefore, we evaluated the clinical characteristics and outcomes of Japanese patients who were hospitalized for HF on the basis of their LVEF.
Methods
The Heart Institute of Japan Heart Failure II (HIJ‐HF II) is a retrospective, multicentre cohort study using a Diagnosis Procedure Combination (DPC) database and including 10 participating DPC hospitals in Japan.
Patients
We retrospectively conducted a multicentre cohort study of consecutive hospitalized patients with decompensated HF from 10 DPC hospitals in six Japanese prefectures (Miyagi, Chiba, Saitama, Tokyo, Kanagawa, and Shizuoka) between 1 April 2013 and 31 March 2014. To identify patients, we first searched the DPC database of each hospital for all consecutive hospitalized patients whose highest medical cost diagnosis was HF. We then reviewed these patients using medical charts and enrolled consecutive patients who were admitted for decompensated HF. Decompensated HF included de novo HF (if there was no prior history of HF) and worsening HF (if previous decompensation or hospitalization for HF was documented). Decompensated HF was defined as (i) new or progressive symptoms and signs of decompensated HF, such as significant weight gain, dyspnoea, fatigue, pulmonary rales, hepatic congestion, and lower extremity oedema; (ii) a plasma brain natriuretic peptide (BNP) level ≥ 200 pg/mL at admission17; and (iii) unplanned addition of oral or intravenous loop diuretic drugs, dose‐up of oral loop diuretics, addition of a thiazide diuretic drug to loop diuretics, or the need for treatment with intravenous vasodilators, intravenous inotropes, or intra‐aortic balloon pumping.
Finally, we included a total of 1245 consecutive hospitalized patients with acute decompensated HF. The protocol was approved by the institutional review boards of Tokyo Women's Medical University and the other participating hospitals.
Cardiovascular disease
Coronary artery disease was defined as positive stress test findings, coronary angiography demonstrating at least 75% stenosis or coronary spastic angina documented by the acetylcholine provocation test, a history of prior myocardial infarction or electrocardiographic (ECG) findings of Q‐wave myocardial infarction, or a history of revascularization procedures. Valvular and congenital heart diseases were diagnosed by angiographic, haemodynamic, or echocardiographic tests or a history of valvular or congenital cardiac surgery. Aortic and mitral regurgitation was defined as valvular disease with at least moderate regurgitation by colour‐flow Doppler echocardiography. Non‐ischaemic cardiomyopathies were defined as ventricular myocardial abnormalities in the absence of coronary artery disease or valvular, pericardial, or congenital heart disease. Hypertensive heart disease was defined as a clinical history of hypertension and LV hypertrophy determined from echocardiographic or ECG findings, but without a diagnosis of hypertrophic cardiomyopathy. Aortic disease, peripheral artery disease, and other vascular diseases were diagnosed by angiographic or echocardiographic findings or by a history of vascular surgery or intervention. Hypertension was defined as a systolic blood pressure ≥ 140 mmHg, a diastolic blood pressure ≥ 90 mmHg, or a history of treatment for hypertension.
LVEF was obtained by echocardiography, left ventriculography, or radionuclide angiography during hospitalization. If the LVEF could not be obtained during the index administration, we accepted data concerning the LVEF from either a few months before admission or within 6 months after discharge.
A history of hypertension, dyslipidaemia, or diabetes mellitus was recorded if documented by the physician in the admitting notes or if the clinical diagnoses and criteria conformed to the World Health Organization standards. Impaired renal function was defined as a serum creatinine level ≥ 1.5 mg/dL. Anaemia was defined as a haemoglobin level < 12 g/dL.
Clinical outcomes
The primary outcome was death from any cause, and the secondary outcomes were cardiac death and re‐hospitalization due to worsened HF after hospital discharge. Cardiac death was defined as death due to HF, myocardial infarction, cardiogenic shock, sudden cardiac death (SCD), or other cardiac causes. SCD was defined as a non‐traumatic, unexpected death occurring within 1 h of the onset of symptoms or within 24 h after last having been seen alive if death is not witnessed.18 Worsened HF was defined on the basis of symptoms and signs, such as dyspnoea, rales, and ankle oedema, and the need for treatment with diuretics, vasodilators, positive inotropic drugs, or an intra‐aortic balloon pump. Patients were followed up until 31 January 2016.
Assessment of quality of life
We assessed quality of life (QOL) using the European Quality of Life‐5 Dimensions scale (EQ‐5D) at hospital discharge only for the patients who were discharged alive. In general, for patients who could not complete the self‐reported QOL scale, alternative sources, such as proxy measures, were used.19 The proxy EQ‐5D measured by physicians or home care staff is likely to be an acceptable alternative to the self‐reported EQ‐5D for estimating the summary scores of the EQ index and quality‐adjusted life year, although it does not have sufficient agreement at the domain level.20, 21 For acutely ill patients, retrospective proxy estimation patient QOL using the EQ‐5D is also acceptable at a level that does not pose clinical problems.22 In this study, physicians, nurses, and research associates retrospectively completed (as proxies) the EQ‐5D according to each patient's physical and psychological status when the patient was discharged.
Data analysis
Data are presented as numbers and as medians and inter‐quartile ranges for continuous and categorical data, respectively. We specified three groups on the basis of LVEF: (i) HFrEF (LVEF < 40%), (ii) HFmrEF (LVEF 40–49%), and (iii) HFpEF (LVEF ≥ 50%). The baseline clinical data were compared between groups using analysis of variance. The cumulative event‐free rates were calculated using the Kaplan–Meier method. Differences in event‐free rates were compared using the log‐rank test. The hazard ratios for outcomes, in‐hospital death, and death after discharge were compared among the categories of LVEF, with LVEF ≥ 50% as the referent group. We estimated age‐adjusted and sex‐adjusted and multivariable‐adjusted proportional hazards models for each outcome. A P value of <0.05 was considered significant. Data analyses were performed with SPSS statistical software (Version 11.01, SPSS Inc., Chicago, Illinois, USA).
Results
Baseline characteristics
The baseline patient characteristics are shown in Table 1. Of the 1245 hospitalized HF patients, 444 (36%) had HFrEF, 263 (21%) had HFmrEF, and 538 had HFpEF (43%). Age and the proportion of women were higher in patients with HFpEF than in those with HFrEF. Patients with HFpEF had higher systolic blood pressures on admission and higher incidence of anaemia. Regarding underlying heart disease, coronary artery disease had the highest incidence in patients with HFmrEF; non‐ischaemic cardiomyopathy had the highest incidence in patients with HFrEF; and valvular heart disease had the highest incidence in patients with HFpEF. The highest rate of ICD implantation on admission was seen in patients with HFrEF. The highest proportions of hypertension and dyslipidaemia were seen in patients with HFmrEF. The QRS complex duration was the longest in patients with HFrEF, followed by that in HFmrEF and HFpEF patients. The plasma BNP levels were the highest in patients with HFrEF.
Table 1.
Patients' characteristics
| Variable | Overall (n = 1245) | HFrEF (n = 444) | HFmrEF (n = 263) | HFpEF (n = 538) | P value |
|---|---|---|---|---|---|
| Age (years) | 77 [65–85] | 72 [60–81] | 77 [65–84] | 81 [72–87] | <0.001 |
| Female gender | 547 (44) | 131 (30) | 116 (44) | 300 (56) | <0.001 |
| Body mass index | 22 [20–25] | 22 [20–25] | 22 [20–25] | 22 [19–25] | 0.028 |
| Blood pressure (mmHg) | |||||
| Systolic | 130 [110–152] | 125 [106–145] | 130 [110–150] | 132 [114–157] | <0.001 |
| Diastolic | 71 [60–87] | 72 [60–89] | 73 [60–87] | 70 [60–84] | 0.187 |
| Heart rate (b.p.m.) | 84 [70–102] | 90 [71–110] | 82 [72–100] | 81 [66–98] | <0.001 |
| LVEF (%) | 45 [34–58] | 30 [23–35] | 45 [41–46] | 60 [54–64] | <0.001 |
| NYHA class III/IV on admission | 928 (75) | 339 (76) | 203 (77) | 386 (72) | 0.139 |
| Underlying heart disease | <0.001 | ||||
| Coronary artery disease | 425 (34) | 171 (38) | 117 (44) | 137 (25) | |
| Cardiomyopathy | 214 (17) | 140 (32) | 31 (12) | 43 (8) | |
| Valvular disease | 368 (30) | 82 (18) | 77 (29) | 209 (39) | |
| Hypertensive heart disease | 89 (7) | 30 (7) | 17 (6) | 42 (8) | |
| Congenital heart disease | 13 (1) | 3 (1) | 3 (1) | 7 (1) | |
| Others | 136 (11) | 18 (4) | 18 (7) | 100 (19) | |
| Atrial fibrillation | 318 (26) | 105 (24) | 73 (28) | 140 (26) | 0.454 |
| Sustained VT/VF | 62 (5) | 41 (9) | 12 (5) | 9 (2) | <0.001 |
| Hypertension | 681 (55) | 216 (49) | 169 (64) | 296 (55) | <0.001 |
| Diabetes mellitus | 383 (31) | 154 (35) | 79 (30) | 150 (28) | 0.068 |
| Dyslipidaemia | 375 (30) | 148 (33) | 93 (35) | 134 (25) | 0.002 |
| Hyperuricaemia | 175 (14) | 87 (20) | 38 (14) | 50 (9) | <0.001 |
| COPD | 62 (5) | 15 (3) | 19 (7) | 28 (5) | 0.072 |
| Impaired renal functiona | 675 (54) | 230 (52) | 146 (56) | 299 (56) | 0.444 |
| Haemodialysis | 69 (6) | 27 (6) | 19 (7) | 23 (4) | 0.190 |
| Anaemiab | 616 (50) | 159 (36) | 131 (50) | 326 (61) | <0.001 |
| ICD | 94 (8) | 68 (15) | 12 (5) | 14 (3) | <0.001 |
| Laboratory data on admission | |||||
| White blood cell count (×103/μL) | 6.8 [5.2–9.0] | 6.9 [5.3–8.8] | 6.7 [5.2–9.2] | 6.8 [5.1–9.1] | 0.984 |
| Haemoglobin (g/dL) | 12 [10–14] | 12.9 [11.2–14.6] | 12.1 [10.4–13.8] | 11.3 [9.7–12.9] | <0.001 |
| Haematocrit (%) | 36 [31–41] | 39 [34–44] | 36 [31–41] | 34 [30–39] | <0.001 |
| Platelet count (×104/μL) | 18 [14–22] | 18 [14–22] | 18 [14–23] | 18 [14–22] | 0.482 |
| Albumin (g/dL) | 3.7 [3.3–4.0] | 3.7 [3.3–4.0] | 3.7 [3.3–4.0] | 3.6 [3.2–4.0] | 0.215 |
| Total bilirubin (mg/dL) | 0.8 [0.5–1.1] | 0.8 [0.6–1.2] | 0.8 [0.5–1.0] | 0.7 [0.5–1.0] | <0.001 |
| BUN (mg/dL) | 24 [17–36] | 23 [17–35] | 25 [18–38] | 25 [17–36] | 0.687 |
| Creatinine (mg/dL) | 1.2 [0.8–1.7] | 1.2 [0.9–1.7] | 1.2 [0.9–1.9] | 1.1 [0.8–1.7] | 0.218 |
| Glucose (mg/dL) | 121 [101–163] | 123 [102–169] | 120 [101–159] | 119 [101–159] | 0.295 |
| Sodium (mEq/L) | 140 [137–142] | 139 [137–142] | 140 [137–142] | 140 [137–142] | 0.294 |
| Potassium (mEq/L) | 4.3 [3.9–4.7] | 4.3 [3.9–4.7] | 4.2 [4.0–4.8] | 4.3 [3.9–4.7] | 0.819 |
| C‐reactive protein (mg/dL) | 0.5 [0.2–1.7] | 0.4 [0.2–1.5] | 0.4 [0.2–1.3] | 0.5 [0.2–2.1] | 0.133 |
| Plasma BNP (pg/mL) | 567 [280–1098] | 822 [400–1520] | 512 [265–987] | 450 [225–812] | <0.001 |
| Electrocardiographic finding | (n = 1234) | (n = 439) | (n = 261) | (n = 534) | |
| Sinus rhythm | 787 (64) | 298 (68) | 161 (62) | 328 (61) | 0.082 |
| Atrial fibrillation | 409 (33) | 129 (29) | 91 (35) | 189 (35) | 0.109 |
| Other rhythm | 38 (3) | 12 (3) | 9 (3) | 17 (3) | |
| QRS complex duration (ms) | 100 [80–122] | 110 [90–140] | 100 [80–125] | 94 [80–110] | <0.001 |
| <120 | 827 (67) | 248 (56) | 172 (66) | 407 (76) | <0.001 |
| 120–149 | 241 (20) | 94 (21) | 62 (24) | 85 (16) | 0.014 |
| ≥150 | 166 (13) | 97 (22) | 27 (10) | 42 (8) | <0.001 |
| RBBB | 137 (11) | 37 (8) | 33 (13) | 67 (13) | 0.081 |
| LBBB | 66 (5) | 38 (9) | 20 (8) | 8 (1) | <0.001 |
| Ventricular pacing | 108 (9) | 62 (14) | 19 (7) | 27 (5) | <0.001 |
| Medications on admission | |||||
| ACE inhibitors | 326 (26) | 161 (36) | 71 (27) | 94 (17) | <0.001 |
| ARBs | 565 (45) | 188 (42) | 134 (51) | 243 (45) | 0.084 |
| Beta‐blockers | 754 (61) | 324 (73) | 174 (66) | 256 (48) | <0.001 |
| Loop diuretics | 894 (71) | 339 (76) | 194 (74) | 361 (67) | 0.004 |
| Thiazide | 219 (18) | 74 (17) | 54 (21) | 91 (17) | 0.368 |
| MRAs | 558 (45) | 264 (59) | 107 (41) | 187 (35) | <0.001 |
| Digoxin | 168 (14) | 85 (19) | 34 (13) | 49 (9) | <0.001 |
| Nitrates | 204 (16) | 70 (16) | 49 (19) | 85 (16) | 0.541 |
| Calcium antagonists | 443 (36) | 100 (23) | 107 (41) | 236 (44) | <0.001 |
| Statins | 400 (32) | 143 (32) | 118 (45) | 139 (26) | <0.001 |
| Antiplatelets | 481 (39) | 179 (40) | 131 (50) | 171 (32) | <0.001 |
| Oral anticoagulants | 523 (42) | 198 (45) | 117 (44) | 208 (39) | 0.113 |
| Amiodarone | 158 (13) | 94 (21) | 34 (13) | 30 (6) | <0.001 |
| Other antiarrhythmics | 22 (2) | 10 (2) | 4 (2) | 8 (1) | 0.645 |
| Erythropoietin | 127 (10) | 39 (9) | 39 (15) | 49 (9) | 0.020 |
ACE, angiotensin‐converting enzyme; ARB, angiotensin II receptor blocker; BNP, brain natriuretic peptide; BUN, blood urea nitrogen; COPD, chronic obstructive pulmonary disease; ICD, implantable cardioverter‐defibrillator; LBBB, left bundle branch block; LVEF, left ventricular ejection fraction; MRA, mineralocorticoid receptor antagonist; NYHA, New York Heart Association; RBBB, right bundle branch block; VF, ventricular fibrillation; VT, ventricular tachycardia.
Values are n (%) or median [inter‐quartile range].
Impaired renal function was defined as a serum creatinine level ≥ 1.5 mg/dL.
Anaemia was defined as a haemoglobin level < 12 g/dL.
Regarding medications at admission, patients with HFrEF were more likely to be treated with angiotensin‐converting enzyme inhibitors, beta‐blockers, loop diuretics, mineralocorticoid receptor antagonists, digoxin, and amiodarone. Patients with HFmrEF and HFpEF were more likely to be treated with calcium antagonists. There were higher rates of statin use, antiplatelet use, and erythropoietin use in patients with HFmrEF than in those with HFrEF and HFpEF.
In‐hospital management and outcomes
During hospitalization, 66% of patients received intravenous diuretics; and 30% of patients, particularly those with HFrEF, received intravenous carperitide, a human atrial natriuretic peptide. There was a higher rate of intravenous inotrope use, especially dobutamine in patients with HFrEF. The incidence of percutaneous coronary intervention was the highest in patients with HFmrEF (Table 2).
Table 2.
Treatment for decompensated heart failure during hospitalization
| Variable | Overall (n = 1245) | HFrEF (n = 444) | HFmrEF (n = 263) | HFpEF (n = 538) | P value |
|---|---|---|---|---|---|
| Intravenous loop diuretics | 823 (66) | 305 (69) | 156 (59) | 362 (67) | 0.031 |
| Intravenous nitrates | 352 (28) | 114 (26) | 91 (35) | 147 (27) | 0.034 |
| Intravenous carperitide | 371 (30) | 164 (37) | 78 (30) | 129 (24) | <0.0001 |
| Intravenous inotropes | 213 (17) | 102 (23) | 47 (18) | 64 (12) | <0.0001 |
| Noradrenaline | 91 (7) | 39 (9) | 23 (9) | 29 (5) | 0.068 |
| Dobutamine | 136 (11) | 71 (16) | 30 (11) | 35 (7) | <0.0001 |
| Dopamine | 72 (6) | 21 (5) | 15 (6) | 36 (7) | 0.426 |
| PDE III inhibitors | 20 (2) | 11 (2) | 5 (2) | 4 (1) | 0.069 |
| Intravenous amiodarone | 36 (3) | 18 (4) | 8 (3) | 10 (2) | 0.122 |
| Intravenous nifekalant | 7 (1) | 5 (1) | 2 (1) | 0 (0) | 0.026 |
| Intravenous heparin | 136 (11) | 42 (9) | 23 (9) | 71 (13) | 0.058 |
| Intravenous opioid | 30 (2) | 10 (2) | 7 (3) | 13 (2) | 0.943 |
| NPPV | 6 (1) | 5 (1) | 0 (0) | 1 (0.2) | 0.070 |
| Respirators | 276 (22) | 108 (24) | 64 (24) | 104 (19) | 0.106 |
| IABP | 30 (2) | 14 (3) | 6 (2) | 10 (2) | 0.420 |
| PCPS | 4 (0.3) | 2 (0.5) | 1 (0.4) | 1 (0.2) | 0.688 |
| PCI | 80 (6) | 33 (7) | 26 (10) | 21 (4) | 0.002 |
IABP, intra‐aortic balloon pumping; NPPV, non‐invasive positive pressure ventilation; PCI, percutaneous coronary intervention; PCPS, percutaneous cardiopulmonary support; PDE, phosphodiesterase.
Values are n (%).
The median hospital stay for the overall population was 19 days, and the length of stay was >7 days for >90% of patients. The hospital stay was the longest for HFrEF patients, followed by that for HFmrEF and HFpEF patients (Table 3).
Table 3.
Summary of hospital length and in‐hospital outcomes
| Variable | Overall (n = 1245) | HFrEF (n = 444) | HFmrEF (n = 263) | HFpEF (n = 538) | P value |
|---|---|---|---|---|---|
| Length of stay (days) | |||||
| Median | 19 | 21 | 19 | 17 | <0.001 |
| Minimum | 1 | 1 | 1 | 1 | |
| Maximum | 391 | 391 | 205 | 113 | |
| Length of stay > 7 days | 1148 (92) | 416 (93) | 244 (93) | 488 (91) | 0.209 |
| In‐hospital death | 89 (7) | 32 (7) | 15 (6) | 42 (8) | 0.554 |
| Cause of in‐hospital death | 0.193 | ||||
| Heart failure | 67 (75) | 22 (69) | 11 (73) | 34 (17) | |
| Myocardial infarction | 2 (2) | 0 (0) | 1 (7) | 1 (2) | |
| Pulmonary embolism | 1 (1) | 0 (0) | 1 (7) | 0 (0) | |
| Aortic dissection | 2 (2) | 2 (6) | 0 (0) | 0 (0) | |
| Infection | 10 (11) | 6 (19) | 1 (7) | 3 (7) | |
| Renal failure | 1 (1) | 0 (0) | 0 (0) | 1 (2) | |
| Malignancy | 2 (2) | 2 (6) | 0 (0) | 0 (0) | |
| Other non‐cardiac causes | 4 (4) | 0 (0) | 1 (7) | 3 (7) |
Values are days and n (%).
In‐hospital death was observed in 89 (7%) of the 1245 hospitalized HF patients, and its frequency did not differ among the groups (Table 3). HF was the most common cause of in‐hospital death, followed by infection (Table 3).
Hospital discharge and subsequent prognosis
Of the 1245 hospitalized HF patients, 1156 (93%) patients were discharged alive from the cardiology department. The age of these survivors at discharge was younger than that of all hospitalized patients upon admission, but it was the highest in the HFpEF group, followed by that in the HFmrEF and HFrEF groups. The blood pressure and heart rate of patients who were discharged alive were lower than those of patients upon admission in each group, and >85% of patients who were discharged alive were categorized as New York Heart Association function class I or II. The plasma BNP level was also lower at discharge than upon admission but was the highest in the HFrEF group, followed by that in the HFmrEF and HFpEF groups. Regarding medications at discharge, the frequencies of each medicine used did not change from those upon admission for any group. The discharge destination was home for 61% of patients and a nursing home for 13%; the other patients were transferred to other wards or hospitals. The EQ‐5D score at discharge did not differ between groups (Table 4).
Table 4.
Patient status at discharge
| Variable | Overall (n = 1156) | HFrEF (n = 412) | HFmrEF (n = 248) | HFpEF (n = 496) | P value |
|---|---|---|---|---|---|
| Age (years) | 76 [65–84] | 70 [59–80] | 76 [65–84] | 80 [71–86] | <0.001 |
| Female gender | 503 (44) | 120 (29) | 107 (43) | 276 (56) | <0.001 |
| Blood pressure (mmHg) | |||||
| Systolic | 112 [102–126] | 108 [98–120] | 112 [102–126] | 118 [104–131] | <0.001 |
| Diastolic | 62 [55–70] | 62 [54–71] | 60 [54–68] | 62 [56–71] | 0.264 |
| Heart rate (b.p.m.) | 70 [61–78] | 70 [63–78] | 70 [62–76] | 68 [60–77] | 0.090 |
| NYHA class I/II/III/IV | 131/879/141/5 (11/76/12/1) | 38/318/53/3 (9/77/13/1) | 28/187/33/0 (11/75/13/0) | 65/374/55/2 (13/75/11/1) | 0.432 |
| ICD | 118 (10) | 83 (20) | 17 (7) | 18 (4) | <0.001 |
| Laboratory data | |||||
| White blood cell count (×103/μL) | 5.6 [4.4–6.8] | 5.6 [4.5–6.9] | 5.5 [4.5–6.6] | 5.5 [4.4–6.8] | 0.544 |
| Haemoglobin (g/dL) | 12 [10–14] | 13 [11–14] | 12 [10–13] | 11 [10–13] | <0.001 |
| Haematocrit (%) | 36 [32–40] | 38 [33–42] | 35 [32–40] | 34 [31–38] | <0.001 |
| Platelet count (×104/μL) | 19 [15–24] | 18 [15–23] | 19 [15–24] | 19 [15–25] | 0.733 |
| Albumin (g/dL) | 3.6 [3.2–4.0] | 3.6 [3.3–4.0] | 3.6 [3.2–4.0] | 3.5 [3.2–3.9] | 0.066 |
| Total bilirubin (mg/dL) | 0.6 [0.5–0.9] | 0.7 [0.5–0.9] | 0.6 [0.4–0.9] | 0.6 [0.4–0.9] | 0.084 |
| BUN (mg/dL) | 25 [17–37] | 24 [17–37] | 26 [18–37] | 25 [17–37] | 0.601 |
| Creatinine (mg/dL) | 1.1 [0.8–1.7] | 1.2 [0.9–1.6] | 1.2 [0.9–1.9] | 1.1 [0.8–1.7] | 0.261 |
| Glucose (mg/dL) | 110 [93–137] | 117 [97–141] | 104 [93–125] | 107 [92–140] | 0.270 |
| Sodium (mEq/L) | 139 [136–141] | 139 [136–141] | 139 [137–141] | 139 [136–141] | 0.614 |
| Potassium (mEq/L) | 4.4 [4.1–4.7] | 4.4 [4.1–4.7] | 4.4 [4.0–4.7] | 4.4 [4.0–4.7] | 0.295 |
| C‐reactive protein (mg/dL) | 0.3 [0.1–1.0] | 0.3 [0.1–0.9] | 0.3 [0.1–1.1] | 0.3 [0.1–1.1] | 0.654 |
| Plasma BNP (pg/mL) | 245 [114–496] | 284 [153–566] | 250 [117–517] | 194[83–392] | <0.001 |
| Medications | |||||
| ACE inhibitors | 312 (27) | 154 (37) | 66 (27) | 92 (19) | <0.001 |
| ARBs | 545 (47) | 181 (44) | 128 (52) | 236 (48) | 0.145 |
| Beta‐blockers | 724 (63) | 308 (75) | 166 (67) | 250 (50) | <0.001 |
| Loop diuretics | 850 (73) | 319 (77) | 185 (75) | 346 (70) | 0.030 |
| Thiazide | 206 (18) | 69 (17) | 50 (20) | 87 (18) | 0.537 |
| MRAs | 528 (46) | 245 (59) | 102 (41) | 181 (36) | <0.001 |
| Digoxin | 161 (14) | 82 (20) | 31 (13) | 48 (10) | <0.001 |
| Nitrates | 183 (16) | 61 (15) | 46 (19) | 76 (15) | 0.409 |
| Calcium antagonists | 421 (36) | 94 (23) | 100 (40) | 227 (46) | <0.001 |
| Statins | 386 (33) | 137 (33) | 114 (46) | 135 (27) | <0.001 |
| Antiplatelets | 455 (39) | 166 (40) | 124 (50) | 165 (33) | <0.001 |
| Oral anticoagulants | 499 (43) | 186 (45) | 111 (45) | 202 (41) | 0.365 |
| Amiodarone | 147 (13) | 86 (21) | 32 (13) | 29 (6) | <0.001 |
| Other antiarrhythmics | 21 (2) | 9 (2) | 4 (2) | 8 (2) | 0.784 |
| Erythropoietin | 122 (11) | 36 (9) | 38 (15) | 48 (11) | 0.026 |
| Discharge destination | |||||
| Home | 703 (61) | 279 (68) | 135 (54) | 289 (58) | 0.001 |
| Other ward | 74 (6) | 18 (4) | 20 (8) | 36 (7) | 0.101 |
| Other hospital | 224 (19) | 70 (17) | 47 (19) | 107 (22) | 0.216 |
| Nursing home | 155 (13) | 45 (11) | 46 (19) | 64 (13) | 0.019 |
| ED‐5D score | 79 [70–80] | 80 [70–80] | 77 [70–80] | 78 [70–80] | 0.304 |
ACE, angiotensin‐converting enzyme; ARB, angiotensin II receptor blocker; BNP, brain natriuretic peptide; BUN, blood urea nitrogen; COPD, chronic obstructive pulmonary disease; ED‐5D, European Quality of Life‐5 Dimensions; ICD, implantable cardioverter‐defibrillator; LVEF, left ventricular ejection fraction; MRA, mineralocorticoid receptor antagonist; NYHA, New York Heart Association.
Values are n (%) or median [inter‐quartile range].
After a median follow‐up of 19 months (range, 3–26 months), 192 (17%) patients died and 534 (46%) patients readmitted. Kaplan–Meier curves for all‐cause mortality in the LVEF groups are shown in Figure 1 . There were no significant differences in mortality among the three LVEF groups. Of the patients who died, cardiac causes of death accounted for 56% of deaths and non‐cardiac causes of death for 35%, and the cause of death remained unknown or undetermined in 8% of cases (Table 5). The most common reason for re‐hospitalization was worsening HF (Table 5). Kaplan–Meier curves for cardiac death and re‐hospitalization due to worsening HF are shown in Figure 2 . There were no significant differences in cardiac death or re‐hospitalization due to worsening HF among the three LVEF groups.
Figure 1.
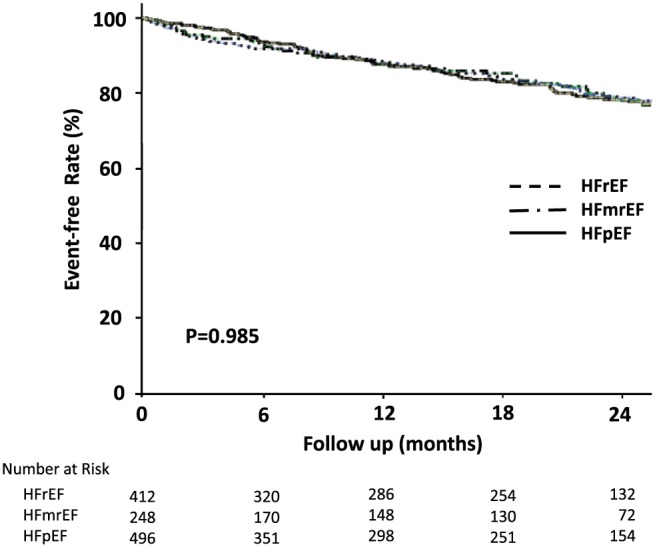
Kaplan–Meier curves for mortality in patients with HFrEF, HFmrEF, and HFpEF.
Table 5.
Summary of outcomes after discharge
| Variable | Overall (n = 1156) | HFrEF (n = 412) | HFmrEF (n = 248) | HFpEF (n = 496) | P value |
|---|---|---|---|---|---|
| Death | 192 (17) | 73 (18) | 40 (16) | 79 (16) | 0.740 |
| Cause of death | |||||
| Cardiac cause | 108 (56) | 41 (56) | 21 (53) | 46 (58) | 0.731 |
| Heart failure | 76 (40) | 28 (38) | 13 (33) | 35 (44) | |
| Sudden cardiac death | 30 (16) | 13 (18) | 7 (18) | 10 (13) | |
| Myocardial infarction | 2 (1) | 0 (0) | 1 (3) | 1 (1) | |
| Non‐cardiac cause | 68 (35) | 26 (36) | 14 (35) | 28 (35) | |
| Stroke | 3 (2) | 1 (1) | 2 (5) | 0 (0) | |
| Infection | 31 (16) | 14 (19) | 8 (20) | 9 (11) | |
| Malignancy | 9 (5) | 4 (5) | 1 (3) | 4 (5) | |
| Gastrointestinal disease (except malignancy) | 7 (4) | 1 (1) | 1 (3) | 5 (6) | |
| Renal failure | 2 (1) | 0 (0) | 0 (0) | 2 (3) | |
| Multiple organ failure | 2 (1) | 1 (1) | 0 (0) | 1 (1) | |
| Other non‐cardiac causes | 14 (7) | 5 (7) | 2 (5) | 7 (9) | |
| Unknown/undetermined | 16 (8) | 6 (8) | 5 (13) | 5 (6) | |
| Re‐hospitalization | 534 (46) | 196 (48) | 108 (44) | 230 (46) | 0.740 |
| Cause of hospitalization | 0.646 | ||||
| Heart failure | 205 (38) | 79 (40) | 40 (37) | 86 (37) | |
| Other cardiac cause | 124 (23) | 50 (26) | 27 (25) | 47 (20) | |
| Non‐cardiac cause | 205 (38) | 67 (34) | 41 (38) | 97 (42) |
Values are n (%).
Figure 2.
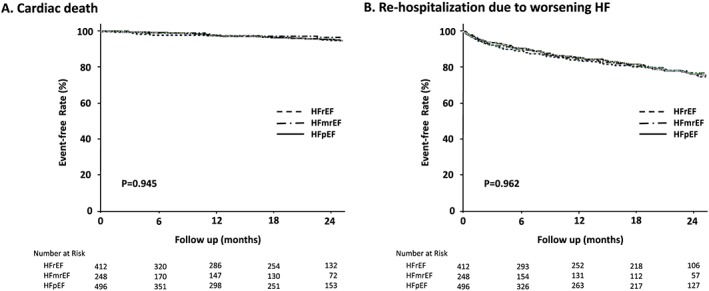
Kaplan–Meier curves for cardiac death (A) and re‐hospitalization due to worsening HF (B) in patients with HFrEF, HFmrEF, and HFpEF.
Risk of mortality according to the categorized left ventricular ejection fraction
In multivariable‐adjusted analyses, the HFmrEF and HFrEF groups, compared with the HFpEF group, were not associated with an increase in the risk of in‐hospital death. For all‐cause death after discharge, the HFmrEF and HFrEF groups, compared with the HFpEF group, were also not associated with an increase in the risk of death after discharge (Table 6).
Table 6.
Hazard ratios for all‐cause death by categorical left ventricular ejection fraction
| Model 1 | Model 2 | Model 3 | Model 4 | |||||
|---|---|---|---|---|---|---|---|---|
| HR (95% CI) | P value | HR (95% CI) | P value | HR (95% CI) | P value | HR (95% CI) | P value | |
| In‐hospital death | ||||||||
| HFpEF | Reference | Reference | Reference | Reference | ||||
| HFmrEF | 0.73 (0.39–1.35) | 0.314 | 0.97 (0.46–2.04) | 0.935 | 0.92 (0.43–1.94) | 0.823 | 0.80 (0.36–1.75) | 0.570 |
| HFrEF | 1.08 (0.66–1.76) | 0.765 | 1.49 (0.82–2.71) | 0.194 | 1.41 (0.77–2.59) | 0.262 | 1.10 (0.57–2.12) | 0.768 |
| Death after discharge | ||||||||
| HFpEF | Reference | Reference | Reference | Reference | ||||
| HFmrEF | 1.20 (0.82–1.77) | 0.348 | 1.09 (0.72–1.65) | 0.683 | 1.11 (0.73–1.69) | 0.611 | 1.17 (0.76–1.79) | 0.476 |
| HFrEF | 1.25 (0.89–1.74) | 0.202 | 1.12 (0.78–1.61) | 0.551 | 1.11 (0.77–1.60) | 0.573 | 1.12 (0.84–1.75) | 0.307 |
CI, confidence interval; HR, hazard ratio.
Model 1: adjusted for age and sex. Model 2: adjusted for age, sex, and body mass index. Model 3: adjusted for age, sex, body mass index, and baseline cardiovascular disease. Model 4: adjusted for age, baseline cardiovascular disease, hypertension, diabetes, dyslipidaemia, hyperuricaemia, chronic obstructive pulmonary disease, impaired renal function, anaemia, and systolic blood pressure.
Discussion
Our results support the following conclusions. (i) Of the Japanese hospitalized HF patients, 36% had HFrEF, 21% had HFmrEF, and 43% had HFpEF. (ii) Age and the proportion of women were highest in HFpEF patients, followed by HFmrEF and HFrEF patients. (iii) Regarding underlying heart disease, there were high proportions of cardiomyopathy in HFrEF patients, coronary artery disease in HFmrEF patients, and valvular disease in HFpEF patients. (iv) The plasma BNP values upon admission were the highest and QRS widths were the longest in HFrEF patients, followed by HFmrEF and HFpEF patients. (v) During hospitalization, intravenous carperitide was commonly used. (vi) In‐hospital mortality was recorded in 7% of patients, and there were no differences in in‐hospital deaths among the LVEF groups. (vii) There were no differences in mortality or re‐hospitalization due to HF for patients discharged alive among the three groups.
Clinical characteristics of the different heart failure groups
Among hospitalized patients with worsening HF, the ratio of HFrEF, HFmrEF, and HFpEF was 2:1:2, comparable with the results of other cohorts of hospitalized HF patients in Japan.23, 24 Age and the proportion of women were the highest in the HFpEF group, followed by those in the HFmrEF and HFrEF groups; these results are comparable with reports from the USA and Europe.25, 26 Older age and female sex are risk factors for HFpEF,27, 28 and our results are consistent with previous reports. In general, coronary artery disease is a major type of underlying heart disease in HF patients in the USA and Europe (~50%).2 However, our results showed that only 30% of HF patients had coronary artery disease. In recent Japanese cohorts, the proportion of coronary artery disease was ~30% among hospitalized HF patients.23, 24 However, the Chronic Heart Failure Analysis and Registry in the Tohoku District (CHART)‐2 reported that coronary artery disease was found in nearly 50% of HF patients.29 This difference may be due to patient characteristics: 80% of the subjects included in CHART‐2 were outpatients, and >50% had coronary artery disease without HF or had stage B HF.30 In our study, of the different HF groups, the HFmrEF group had the highest frequency of coronary artery disease. This result is consistent with other cohort studies from Japan.23, 24 Japanese patients with HFmrEF have a relatively high proportion of underlying coronary artery disease, and there is a possibility that the LVEF may improve with the subsequent treatment of ischaemia (including revascularization). Our findings may support that HFmrEF is a condition that represents a transition between HFrEF and HFpEF.26
Of our HFpEF patients, ~40% had valvular disease. In valvular disease, mechanistic variables, such as the capacity load, afterload, and mechanical obstruction of LV filling, lead to HF rather than impaired LV contraction. However, the increase in valvular disease in Japanese HF patients is interesting because the incidence of rheumatic valvular disease has diminished. The causes of valvular disease in our patients showed high frequencies of mitral valve regurgitation and tricuspid regurgitation (mitral valve regurgitation, 47%; tricuspid valve regurgitation, 35%; aortic valve regurgitation, 15%; aortic stenosis, 14%; and mitral stenosis, 3%). Valvular disorders were also common in the EuroHeart Failure Survey II (EHFS II), and mitral valve regurgitation occurred the most frequently, followed in prevalence by tricuspid valve regurgitation and aortic valve regurgitation.31 Age‐related changes in the mitral and aortic valves and an age‐related increase in the pulmonary artery pressure, which is associated with an increased left heart diastolic pressure and systemic vascular stiffening, play roles in the increases in these valvular diseases.32, 33
The difference between Japanese HF patients and Western HF patients is the considerably lower rate of ischaemic aetiology among Japanese patients with HFrEF than among Western patients with HFrEF.25 In our study, the incidence of non‐ischaemic cardiomyopathy, such as dilated cardiomyopathy, was relatively high. Race and ethnic variations might account for the differences in the causes of HF. Furthermore, the differences may be related to the lower frequency of surviving Japanese myocardial infarction patients than Western patients with a low LVEF in the primary percutaneous intervention era.34 The overall plasma BNP values upon admission were higher for HFrEF patients, followed by those for HFmrEF and HFpEF patients, which were comparable with the results of previous reports.35, 36 Although the BNP level was a predictor of prognosis for individual HF patients despite the LVEF,35, 36 the differences in the contributing factors to the BNP values, such as age, renal function, and obesity, may be related to the distribution of the BNP values in the LVEF groups. The higher proportions of lethal arrhythmias and ICD implantation among patients with HFrEF were related to a low LVEF as a risk of SCD.
Hospital treatment and prognosis
In our study, the frequencies of intravenous diuretic use and intravenous vasodilator use were high during hospitalization. Because intravenous diuretics are the first‐line therapy for acute decompensated HF,11 the frequency of intravenous diuretic use is high among cohorts of hospitalized HF patients.14, 31, 37, 38 The frequency of intravenous vasodilators, such as nitrates, in our study was similar to that reported by the EHFS II.31 However, natriuretic peptides are used much more often in Japan than in Western countries.37, 38 The usage rates of natriuretic peptides were 30% in our study, 34% in the Japanese Cardiac Registry of Heart Failure in Cardiology (JCARE‐CARD), and up to 69% in the Acute Decompensated Heart Failure Syndromes (ATTEND) registry.14, 38 Carperitide, a natriuretic peptide that is only approved in Japan, has been evaluated as a treatment for acute decompensated HF in only a few trials that have assessed mortality.39 Furthermore, the superior cost‐effectiveness of carperitide has not been demonstrated.40 The use of carperitide for HF treatment may need to be reconsidered.
In‐hospital mortality did not differ among the HF groups, and HF was the most frequent cause of death; however, non‐cardiac death was also not uncommon. These results may be due to the older age, many co‐morbidities, and concomitant illnesses, such as infections, in HF patients in clinical settings.
The median length of in‐hospital stays was 19 days in our study. This length was shorter than that in previous Japanese reports from the 2000s14, 38 but was longer than that in reports from the USA and Europe (4–9 days).31, 37 During hospitalization for a prolonged period, evaluation of the underlying disease, co‐morbidities, and treatment, including cardiac rehabilitation, is available for patients with HF. However, whether the longer in‐hospital stay improves their prognosis and re‐hospitalization is not clear.
Prognosis after hospital discharge
For drug treatment at discharge, the frequency of beta‐blocker use increased compared with that in the 2000s13; in the HFrEF group, 75% of patients received beta‐blockers. The increased frequencies of statin, anticoagulant, amiodarone, and erythropoietin use compared with those in the 2000s13 may be due to evidence‐based treatment or guidelines.
In our study, there were no differences in QOL, later mortality, or re‐hospitalization due to HF among the LVEF groups (for patients who were discharged alive), although in the only available follow‐up echocardiographic data after hospital discharge (n = 363), 36% of patients with HFrEF showed an increased LVEF (21% in the HFmrEF category and 15% in the HFpEF category) and 38% of patients with HFmrEF showed an increased LVEF (the HFpEF category) during the follow‐up period. However, 16% of patients with HFmrEF showed a decreased LVEF (the HFrEF category) and 22% of patients with HFpEF showed a decreased LVEF (3% in the HFrEF category and 19% in the HFmrEF category) during the follow‐up period. These LVEF transitions might partially account for the lack of differences in the prognosis after discharge between LVEF groups at admission.
In our study, only 60% of discharged patients returned home. Older age, deterioration of living ability, and the many co‐morbidities among HF patients might contribute more than LVEF to their prognosis. The most common cause of death was HF, followed by SCD and infection. SCD is an important cause of cardiac death in HF patients and accounted for 28% of the cardiac causes of death in our study. The ESC‐HF Pilot survey reported that SCD accounted for 40% of the cardiac causes of death.41 Infection including pneumonia was the leading cause of non‐cardiac death, followed by malignancy in HF patients. Non‐cardiac diseases such as respiratory and gastrointestinal disease and malignancy make a significant contribution to death and re‐hospitalization in HF patients.42 Several complications and co‐morbid conditions in HF patients may have contributed to their prognosis. In the future, integrated management approaches will be required for HF patients.
Study limitations
There were some limitations to this study. First, this study was designed as a retrospective observational study to investigate all consecutive hospitalized HF patients. Therefore, patients with HF were ultimately identified from medical records. The LVEF could not be obtained for all patients from the data recorded during hospitalization. Furthermore, we could not collect detailed information about changes in medication and the LVEF after hospital discharge for all patients who were discharged alive. We could not exclude the influences of these factors, which might affect the prognosis, from our results. Some patients were lost to follow‐up. The cause of death after discharge could not be determined in detail. The retrospective nature of this study also meant that we had to assess QOL using proxy EQ‐5D measurements, not self‐reported EQ‐5D measurements. Second, data concerning the clinical conditions when clinical events occurred were not available. In addition, there was a treatment bias. Third, the number of subjects was relatively small. Therefore, subgroup analyses were not feasible.
Conclusions
This study showed that the proportions of HFrEF, HFmrEF, and HFpEF occurrences among Japanese hospitalized HF patients were 36%, 21%, and 43%, respectively; the clinical characteristics of these patients were different, but their prognosis was not. The most common cause of death and re‐hospitalization after hospital discharge was HF, but non‐cardiac causes also contributed to their prognosis. Integrated management approaches will be required for HF patients.
Conflict of Interest
Dr Shiga received lecture fees from Eisai, Toa Eiyo, Bayer, and Daiichi‐Sankyo. Dr Hagiwara received research funding from Eisai, Nippon Boehringer Ingelheim, and Daiichi‐Sankyo and received lecture fees from Nippon Boehringer Ingelheim and Bristol‐Myers Squibb. The other authors have nothing to disclose.
Funding
This work was supported by the Japan Agency for Medical Research and Development under Grant Number JP15ek0210009.
Acknowledgements
We thank Ms Emi Sawada for her assistance in project management and Ms Satsuki Sato for her assistance in data management. We also thank Medical Data Vision Co. Ltd (Tokyo, Japan) for analysing the DPC data.
Appendix A.
The following investigators participated in the HIJ‐HF II.
Cardiovascular Center of Sendai: Katsuhiro Yagi, Shinya Fujii, Kazuki Tanaka, Bun Yashiro, Mayui Nakazawa, Takahiro Yamada, and Masahiro Watarai
Saiseikai Kurihashi Hospital: Yoshimi Ota, Yusuke Inagaki, Eiji Shibahashi, and Tonre Ri
Tokyo Women's Medical University Yachiyo Medical Center: Shoji Haruta, Yuichiro Yamada, and Koichiro Miura
Shinmatsudo Central General Hospital: Joji Katoh
Tokyo Metropolitan Tama Medical Center: Hiroyuki Tanaka and Ayano Yoshida
Tama‐Hokubu Medical Center: Satoshi Murasaki and Yuichiro Yamada
JCHO Sagamino Hospital: Takao Yamauchi
National Yokohama Medical Center: Kazunori Iwade, Fumiaki Mori, and Takashi Saito
Seirei Hamamatsu General Hospital: Toshiaki Oka and Naomi Kawakatsu
Tokyo Women's Medical University Hospital: Atsushi Suzuki, Tsuyoshi Suzuki, Erisa Watanabe, Noriko Kikuchi, Hidetoshi Hattori, Tomohito Kogure, Arata Nomura, Shintaro Haruki, Kensuke Shimazaki, Kimiko Nagara, Ryosuke Itani, Tasturo Iida, Naoki Iizuka, and Yuta Morioka
Shiga, T. , Suzuki, A. , Haruta, S. , Mori, F. , Ota, Y. , Yagi, M. , Oka, T. , Tanaka, H. , Murasaki, S. , Yamauchi, T. , Katoh, J. , Hattori, H. , Kikuchi, N. , Watanabe, E. , Yamada, Y. , Haruki, S. , Kogure, T. , Suzuki, T. , Uetsuka, Y. , Hagiwara, N. , and the HIJ‐HF II Investigators (2019) Clinical characteristics of hospitalized heart failure patients with preserved, mid‐range, and reduced ejection fractions in Japan . ESC Heart Failure, 6: 475–486. 10.1002/ehf2.12418.
References
- 1. Ambrosy AP, Fonarow GC, Butler J, Chioncel O, Greene SJ, Vaduganathan M, Nodari S, Lam CSP, Sato N, Shah AN, Gheorghiade M. The global health and economic burden of hospitalizations for heart failure: lessons learned from hospitalized heart failure registries. J Am Coll Cardiol 2014; 63: 1123–1133. [DOI] [PubMed] [Google Scholar]
- 2. Roger VL. Epidemiology of heart failure. Circ Res 2013; 113: 646–659. [DOI] [PMC free article] [PubMed] [Google Scholar]
- 3. Sakata Y, Shimokawa H. Epidemiology of heart failure in Asia. Circ J 2013; 77: 2209–2217. [DOI] [PubMed] [Google Scholar]
- 4. Okamoto H, Kitabatake A. The epidemiology of heart failure in Japan. Nihon Rinsho 2003; 61: 709–714 (in Japanese). [PubMed] [Google Scholar]
- 5. Okura Y, Ramadan MM, Ohno Y, Mitsuma W, Tanaka K, Ito M, Suzuki K, Tanabe N, Kodama M, Aizawa Y. Impending epidemic: future projection of heart failure in Japan to the year 2055. Circ J 2008; 72: 489–491. [DOI] [PubMed] [Google Scholar]
- 6. The Japan Patient Survey 2014 of the Ministry of Health, Labour and Welfare (in Japanese). http://www.mhlw.go.jp/file/05‐Shingikai‐10901000‐Kenkoukyoku‐Soumuka/251.pdf (11 February 2018).
- 7. The Japanese Registry of All Cardiac and Vascular Disease report (2016) (in Japanese). http://www.j‐circ.or.jp/jittai_chosa/jittai_chosa2015web.pdf (11 February 2018).
- 8. Meta‐analysis Global Group in Chronic Heart Failure (MAGGIC) . The survival of patients with heart failure with preserved or reduced left ventricular ejection fraction: an individual patient data meta‐analysis. Eur Heart J 2012; 33: 1750–1757. [DOI] [PubMed] [Google Scholar]
- 9. Yancy CW, Jessup M, Bozkurt B, Butler J, Casey DE Jr, Drazner MH, Fonarow GC, Geraci SA, Horwich T, Januzzi JL, Johnson MR, Kasper EK, Levy WC, Masoudi FA, McBride PE, McMurray JJ, Mitchell JE, Peterson PN, Riegel B, Sam F, Stevenson LW, Tang WH, Tsai EJ, Wilkoff BL, American College of Cardiology Foundation/American Heart Association Task Force on Practice Guidelines . 2013 ACCF/AHA guideline for the management of heart failure: a report of the American College of Cardiology Foundation/American Heart Association Task Force on practice guidelines. Circulation 2013; 128: e240–e327. [DOI] [PubMed] [Google Scholar]
- 10. Komajda M, Lam CS. Heart failure with preserved ejection fraction: a clinical dilemma. Eur Heart J 2014; 35: 1022–1032. [DOI] [PubMed] [Google Scholar]
- 11. Ponikowski P, Voors AA, Anker SD, Bueno H, Cleland JG, Coats AJ, Falk V, González‐Juanatey JR, Harjola VP, Jankowska EA, Jessup M, Linde C, Nihoyannopoulos P, Parissis JT, Pieske B, Riley JP, Rosano GMC, Ruilope LM, Ruschitzka F, Rutten FH, van der Meer P, ESC Scientific Document Group . 2016 ESC Guidelines for the diagnosis and treatment of acute and chronic heart failure: The Task Force for the diagnosis and treatment of acute and chronic heart failure of the European Society of Cardiology (ESC) Developed with the special contribution of the Heart Failure Association (HFA) of the ESC. Eur Heart J 2016; 37: 2129–2200. [DOI] [PubMed] [Google Scholar]
- 12. Blair JE, Zannad F, Konstam MA, Cook T, Traver B, Burnett JC Jr, Grinfeld L, Krasa H, Maggioni AP, Orlandi C, Swedberg K, Udelson JE, Zimmer C. Continental differences in clinical characteristics, management, and outcomes in patients hospitalized with worsening heart failure results from the EVEREST (Efficacy of Vasopressin Antagonism in Heart Failure: Outcome Study with Tolvaptan) program. J Am Coll Cardiol 2008; 52: 1640–1648. [DOI] [PubMed] [Google Scholar]
- 13. Kawashiro N, Kasanuki H, Ogawa H, Matsuda N, Hagiwara N, Heart Institute of Japan‐Department of Cardiology (HIJC) Investigators . Clinical characteristics and outcome of hospitalized patients with congestive heart failure. Circ J 2008; 72: 2015–2520. [DOI] [PubMed] [Google Scholar]
- 14. Sato N, Kajimoto K, Asai K, Mizuno M, Minami Y, Nagashima M, Murai K, Muanakata R, Yumino D, Meguro T, Kawana M, Nejima J, Satoh T, Mizuno K, Tanaka K, Kasanuki H, Takano T, ATTEND Investigators . Acute decompensated heart failure syndromes (ATTEND) registry. A prospective observational multicenter cohort study: rationale, design, and preliminary data. Am Heart J 2010; 159: 949–955 e1. [DOI] [PubMed] [Google Scholar]
- 15. Tsuchihashi‐Makaya M, Hamaguchi S, Kinugawa S, Yokota T, Goto D, Yokoshiki H, Kato N, Takeshita A, Tsutsui H, JCARE‐CARD Investigators . Characteristics and outcomes of hospitalized patients with heart failure and reduced vs preserved ejection fraction. Report from the Japanese Cardiac Registry of Heart Failure in Cardiology (JCARE‐CARD). Circ J 2009; 73: 1893–1900. [DOI] [PubMed] [Google Scholar]
- 16. Shimokawa H, Miura M, Nochioka K, Sakata Y. Heart failure as a general pandemic in Asia. Eur J Heart Fail 2015; 17: 884–892. [DOI] [PubMed] [Google Scholar]
- 17. Japanese Heart Failure Society Committee of Prevention . Points of Attention in the Treatment of Heart Failure Using BNP and NT‐ProBNP Assays (in Japanese). (accessed February 11, 2018)
- 18. Priori SG, Blomström‐Lundqvist C, Mazzanti A, Blom N, Borggrefe M, Camm J, Elliott PM, Fitzsimons D, Hatala R, Hindricks G, Kirchhof P, Kjeldsen K, Kuck KH, Hernandez‐Madrid A, Nikolaou N, Norekvål TM, Spaulding C, Van Veldhuisen DJ, ESC Scientific Document Group . 2015 ESC Guidelines for the management of patients with ventricular arrhythmias and the prevention of sudden cardiac death: The Task Force for the Management of Patients with Ventricular Arrhythmias and the Prevention of Sudden Cardiac Death of the European Society of Cardiology (ESC). Endorsed by: Association for European Paediatric and Congenital Cardiology (AEPC). Eur Heart J 2015; 36: 2793–2867. [DOI] [PubMed] [Google Scholar]
- 19. Bryan S, Hardyman W, Bentham P, Buckley A, Laight A. Proxy completion of EQ‐5D in patients with dementia. Qual Life Res 2005; 14: 107–118. [DOI] [PubMed] [Google Scholar]
- 20. Pickard AS, Johnson JA, Feeny DH, Shuaib A, Carriere KC, Nasser AM. Agreement between patient and proxy assessments of health‐related quality of life after stroke using the EQ‐5D and Health Utilities Index. Stroke 2004; 35: 607–612. [DOI] [PubMed] [Google Scholar]
- 21. Devine A, Taylor SJ, Spencer A, Diaz‐Ordaz K, Eldridge S, Underwood M. The agreement between proxy and self‐completed EQ‐5D for care home residents was better for index scores than individual domains. J Clin Epidemiol 2014; 67: 1035–1043. [DOI] [PMC free article] [PubMed] [Google Scholar]
- 22. Dinglas VD, Gifford JM, Husain N, Colantuoni E, Needham DM. Quality of life before intensive care using EQ‐5D: patient versus proxy responses. Crit Care Med 2013; 41: 9–14. [DOI] [PMC free article] [PubMed] [Google Scholar]
- 23. Sato T, Yoshihisa A, Kanno Y, Suzuki S, Yamaki T, Sugimoto K, Kunii H, Nakazato K, Suzuki H, Saitoh SI, Ishida T, Takeishi Y. Cardiopulmonary exercise testing as prognostic indicators: comparisons among heart failure patients with reduced, mid‐range and preserved ejection fraction. Eur J Prev Cardiol 2017; 24: 1979–1987. [DOI] [PubMed] [Google Scholar]
- 24. Hamatani Y, Nagai T, Shiraishi Y, Kohsaka S, Nakai M, Nishimura K, Kohno T, Nagatomo Y, Asaumi Y, Goda A, Mizuno A, Yasuda S, Ogawa H, Yoshikawa T, Anzai T, Investigators for the WET‐NaDEF Collaboration Project . Long‐term prognostic significance of plasma B‐type natriuretic peptide level in patients with acute heart failure with reduced, mid‐range, and preserved ejection fractions. Am J Cardiol 2018; 121: 731–738. [DOI] [PubMed] [Google Scholar]
- 25. Kapoor JR, Kapoor R, Ju C, Heidenreich PA, Eapen ZJ, Hernandez AF, Butler J, Yancy CW, Fonarow GC. Precipitating clinical factors, heart failure characterization, and outcomes in patients hospitalized with heart failure with reduced, borderline, and preserved ejection fraction. JACC Heart Fail 2016; 4: 464–472. [DOI] [PubMed] [Google Scholar]
- 26. Hsu JJ, Ziaeian B, Fonarow GC. Heart failure with mid‐range (borderline) ejection fraction: clinical implications and future directions. JACC Heart Fail 2017; 5: 763–771. [DOI] [PMC free article] [PubMed] [Google Scholar]
- 27. Lee DS, Gona P, Vasan RS, Larson MG, Benjamin EJ, Wang TJ, Tu JV, Levy D. Relation of disease pathogenesis and risk factors to heart failure with preserved or reduced ejection fraction: insights from the Framingham Heart Study of the National Heart, Lung, and Blood Institute. Circulation 2009; 119: 3070–3077. [DOI] [PMC free article] [PubMed] [Google Scholar]
- 28. Ho JE, Lyass A, Lee DS, Vasan RS, Kannel WB, Larson MG, Levy D. Predictors of new‐onset heart failure: differences in preserved versus reduced ejection fraction. Circ Heart Fail 2013; 6: 279–286. [DOI] [PMC free article] [PubMed] [Google Scholar]
- 29. Tsuji K, Sakata Y, Nochioka K, Miura M, Yamauchi T, Onose T, Abe R, Oikawa T, Kasahara S, Sato M, Shiroto T, Takahashi J, Miyata S, Shimokawa H, CHART‐2 Investigators . Characterization of heart failure patients with mid‐range left ventricular ejection fraction‐a report from the CHART‐2 Study. Eur J Heart Fail 2017; 19: 1258–1269. [DOI] [PubMed] [Google Scholar]
- 30. Shiba N, Nochioka K, Miura M, Kohno H, Shimokawa H. CHART‐2 Investigators. Trend of westernization of etiology and clinical characteristics of heart failure patients in Japan—first report from the CHART‐2 study. Circ J 2011; 75: 823–833. [DOI] [PubMed] [Google Scholar]
- 31. Nieminen MS, Brutsaert D, Dickstein K, Drexler H, Follath F, Harjola VP, Hochadel M, Komajda M, Lassus J, Lopez‐Sendon JL, Ponikowski P, Tavazzi L, EuroHeart Survey Investigators; Heart Failure Association, European Society of Cardiology . EuroHeart Failure Survey II (EHFS II): a survey on hospitalized acute heart failure patients: description of population. Eur Heart J 2006; 27: 2725–2736. [DOI] [PubMed] [Google Scholar]
- 32. Butany J, Ahluwalia MS, Feindel C. Age‐related morphological changes in cardiac valves. Geriatrics Aging 2003; 6: 49–54. [Google Scholar]
- 33. Lam CS, Borlaug BA, Kane GC, Enders FT, Rodeheffer RJ, Redfield MM. Age‐associated increases in pulmonary artery systolic pressure in the general population. Circulation 2009; 119: 2663–2670. [DOI] [PMC free article] [PubMed] [Google Scholar]
- 34. Shiga T, Hagiwara N, Ogawa H, Takagi A, Nagashima M, Yamauchi T, Tsurumi Y, Koyanagi R, Kasanuki H, Heart Institute of Japan Acute Myocardial Infarction‐II (HIJAMI‐II) Investigators . Sudden cardiac death and left ventricular ejection fraction during long‐term follow‐up after acute myocardial infarction in the primary percutaneous coronary intervention era: results from the HIJAMI‐II registry. Heart 2009; 95: 216–220. [DOI] [PubMed] [Google Scholar]
- 35. van Veldhuisen DJ, Linssen GC, Jaarsma T, van Gilst WH, Hoes AW, Tijssen JG, Paulus WJ, Voors AA, Hillege HL. B‐type natriuretic peptide and prognosis in heart failure patients with preserved and reduced ejection fraction. J Am Coll Cardiol 2013; 61: 1498–1506. [DOI] [PubMed] [Google Scholar]
- 36. Kasahara S, Sakata Y, Nochioka K, Yamauchi T, Onose T, Tsuji K, Abe R, Oikawa T, Sato M, Aoyanagi H, Miura M, Shiroto T, Takahashi J, Miyata S, Shimokawa H. CHART‐2 Investigators. Comparable prognostic impact of BNP levels among HFpEF, borderline HFpEF and HFrEF: a report from the CHART‐2 Study. Heart Vessels 2018; 22: 997–1007. [DOI] [PubMed] [Google Scholar]
- 37. Gheorghiade M, Abraham WT, Albert NM, Greenberg BH, O'Connor CM, She L, Stough WG, Yancy CW, Young JB, Fonarow GC, OPTIMIZE‐HF Investigators and Coordinators . Systolic blood pressure at admission, clinical characteristics, and outcomes in patients hospitalized with acute heart failure. JAMA 2006; 296: 2217–2226. [DOI] [PubMed] [Google Scholar]
- 38. Hamaguchi S, Kinugawa S, Tsuchihashi‐Makaya M, Goto D, Yamada S, Yokoshiki H, Tsutsui H. Characteristics, management, and outcomes for patients during hospitalization due to worsening heart failure—a report from the Japanese Cardiac Registry of Heart Failure in Cardiology (JCARE‐CARD). J Cardiol 2013; 62: 95–101. [DOI] [PubMed] [Google Scholar]
- 39. Travessa AM, Menezes FL. Vasodilators in acute heart failure—evidence based on new studies. Eur J Intern Med 2018; 51: 1–10. [DOI] [PubMed] [Google Scholar]
- 40. Mizuno A, Iguchi H, Sawada Y, Hurley M, Nomura H, Hayashi K, Tokuda Y, Watanabe S, Yoshikawa A. The impact of carperitide usage on the cost of hospitalization and outcome in patients with acute heart failure: high value care vs. low value care campaign in Japan. Int J Cardiol 2017; 241: 243–248. [DOI] [PubMed] [Google Scholar]
- 41. Maggioni AP, Dahlström U, Filippatos G, Chioncel O, Crespo Leiro M, Drozdz J, Fruhwald F, Gullestad L, Logeart D, Fabbri G, Urso R, Metra M, Parissis J, Persson H, Ponikowski P, Rauchhaus M, Voors AA, Nielsen OW, Zannad F, Tavazzi L, Heart Failure Association of the European Society of Cardiology (HFA) . EURObservational Research Programme: regional differences and 1‐year follow‐up results of the Heart Failure Pilot Survey (ESC‐HF Pilot). Eur J Heart Fail 2013; 15: 808–817. [DOI] [PubMed] [Google Scholar]
- 42. Khand AU, Gemmell I, Rankin AC, Cleland JG. Clinical events leading to the progression of heart failure: insights from a national database of hospital discharges. Eur Heart J 2001; 22: 153–164. [DOI] [PubMed] [Google Scholar]