

Abstract
Excessive consumption of beverages sweetened with high-fructose corn syrup (HFCS) is associated with obesity and with an increased risk of colorectal cancer. Whether HFCS contributes directly to tumorigenesis is unclear. We investigated the effects of daily oral administration of HFCS in adenomatous polyposis coli (APC) mutant mice, which are predisposed to develop intestinal tumors. The HFCS-treated mice showed a substantial increase in tumor size and tumor grade in the absence of obesity and metabolic syndrome. HFCS increased the concentrations of fructose and glucose in the intestinal lumen and serum, respectively, and the tumors transported both sugars. Within the tumors, fructose was converted to fructose-1-phosphate, leading to activation of glycolysis and increased synthesis of fatty acids that support tumor growth. These mouse studies support the hypothesis that the combination of dietary glucose and fructose, even at a moderate dose, can enhance tumorigenesis.
The increased consumption of sugar-sweetened beverages (SSBs) has been paralleled by an epidemic of obesity around the world, starting in the 1980s (1–4). During this same time period, the rate of colorectal cancer (CRC) incidence also increased among young and middle-aged adults, suggesting a potential link between SSBs, obesity, and CRC development (5–7). Indeed, studies have shown that excessive consumption of SSBs causes obesity and that being obese increases the risk of CRC, especially in men (8, 9). However, whether SSBs contribute directly to tumorigenesis is unclear. Two important confounders are obesity and metabolic syndrome, which can indirectly affect tumor development by changing a myriad of physiologic and endocrine systems in multiple organs (10).
To untangle the link between sugar consumption, obesity, and cancer, we mimicked SSB consumption in a genetically engineered mouse model of intestinal tumorigenesis. In this model, the adenomatous polyposis coli (APC) gene is deleted in Lgr5+ intestinal stem cells upon systemic tamoxifen injection (Lgr5-EGFP-CreERT2; APCflox/flox, hereafter APC−/− mice) (11, 12). APC, a negative regulator of Wnt signaling, is a tumor suppressor that is frequently mutated (75 to 80%) in the early stages of CRC development (13). SSBs are primarily sweetened with high-fructose corn syrup (HFCS), which consists of glucose and fructose in a 45:55 ratio (14). We first determined the physiological effects of HFCS administered to APC−/− and wild-type (WT) mice through ad libitum delivery in their drinking water (25% HFCS in water; referred to hereafter as the “water bottle” or WB group). The consumption of HFCS in this manner led to obesity in both WT and APC−/− mice (fig. S1), and to metabolic dysfunction in WT mice (fig. S2) over an 8-week period.
To uncouple the metabolic effects caused directly by HFCS from those caused by HFCS-induced obesity, we treated APC−/− mice with a restricted amount (400 μl of 25% HFCS) of HFCS daily via oral gavage starting the day after tamoxifen injection (referred to as the HFCS group). This modest amount of HFCS (~3% of total daily caloric intake) is calorically equivalent to human consumption of less than 12 ounces of SSB (~20 g of HFCS) per day. Chronic treatment of HFCS using this strategy did not induce obesity or metabolic dysfunction in APC−/− mice (Fig. 1, A and B, and fig S2). Although the total number of tumors was similar (fig. S3, A and B), HFCS treatment significantly increased the number of large adenomas (>3 mm in diameter) and high-grade tumors in the HFCS group compared to the Con group (Fig. 1, C to F, and fig. S3C). We observed similar results in a study of another mouse model, CDX2P-CreERT2; APCflox/flox (fig. S3, D to H), where intestinal tumors develop mainly in the colon instead of the small intestine (15). These results suggest that the chronic intake of modest amounts of HFCS in liquid form facilitates tumor growth in the setting of APC deficiency independent of obesity and the metabolic syndrome.
Fig. 1. HFCS enhances intestinal tumor growth in APC-deficient mice independent of obesity.
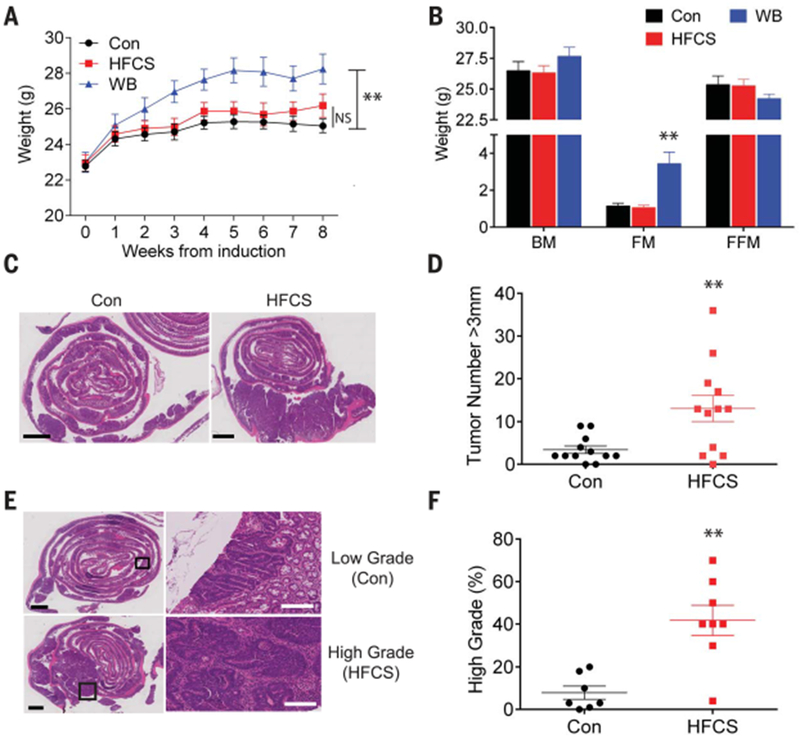
(A) Mean weight of untreated APC−/− mice (Con), APC−/− mice treated with a daily oral gavage of HFCS, and APC−/− mice fed with unlimited HFCS in drinking water bottle (WB) following the induction of intestinal tumors. n = 12. (B) Body composition of APC−/− mice in Con (n = 8), HFCS (n = 6), and WB (n = 9) groups were measured after 8 weeks of treatment using magnetic resonance. BM, body mass; FM, fat mass; FFM, fat-free mass. (C) H&E (hematoxylin and eosin) staining of the distal small intestine from APC−/− mice treated with Con or HFCS via daily oral gavage for 8 weeks. Black bar indicates 2 mm. (D) The size of each tumor (diameter) in the intestine was determined in whole-mount tissue after methylene blue staining, using a dissecting microscope. Data represent the number of tumors over 3 mm in diameter in Con and HFCS-treated APC−/− mice. n = 12. (E) Representative pathologic grading of intestinal sections from Con and HFCS-treated APC−/− mice. Black bar indicates 2 mm. White bar indicates 200 μm. (F) Percentage of high-grade lesions from Con (n = 7) and HFCS-treated (n = 8) APC−/− mice. (A) and (B): Two-way analysis of variance (ANOVA) followed by Holm-Sidak post-test for multiple comparisons; (D) and (F): Student’s t test; NS: not significant. **P<0.01. All data represent means ± SEM.
Glucose is efficiently transported by the intestinal epithelial cells (IECs) in the small intestine via sodium-coupled glucose transporters (SGLTs) (16). By contrast, fructose transport is mediated by a passive transporter (GLUT5) in IECs (16). The consumption of as little as 5 g of fructose can lead to the saturation of GLUT5 in the small intestine (i.e., malabsorption), resulting in an increased concentration of fructose in the lumen of the colon (large intestine) of healthy humans (17–19). Relatedly, a recent study in mice showed that fructose doses greater than 1 g/kg (~1% of daily calorie intake) overwhelm fructose absorption in the small intestine, resulting in a higher concentration of fructose in the colon (20). Indeed, we found that fructose concentration was significantly increased in the colonic lumen (4.4 mM at peak 30 min) in WT mice alter an oral bolus of HFCS (fig. S4A), consistent with impaired fructose uptake in the small intestine. Given these findings, we hypothesized that fructose in the intestinal lumen might be efficiently transported and metabolized by tumors located in the distal small intestine and colon. Using glucose or fructose radiolabeled with 14C, we confirmed that APC−/− tumors efficiently transported both fructose and glucose following a bolus of HFCS (fig. S4B). Furthermore, the amount of fructose reaching the liver and serum was reduced in tumor-bearing APC−/− mice compared to WT mice (Fig. 2A), implying that fructose is trapped by the tumors instead of being transported to the liver and blood. Further supporting our hypothesis, we found that GLUT5 was expressed at higher levels in APC−/− tumors as compared to IECs (fig. S5A), and in human colon tumors as compared to adjacent normal IECs, on a tumor tissue microarray containing 25 cases of human colon tumors ranging from early-stage adenomas to metastatic carcinoma (fig. S5B) (21). Similar results have been reported for other fructose-metabolizing enzymes, ketohexokinase (KHK) and aldolase B in human colon tumors (22, 23). In aggregate, these results indicate that intestinal tumors can transport fructose directly from the intestinal lumen, where the fructose concentration is high after oral administration of HFCS.
Fig. 2. Intestinal tumors from APC-deficient mice facilitate glycolysis by using both glucose and fructose.
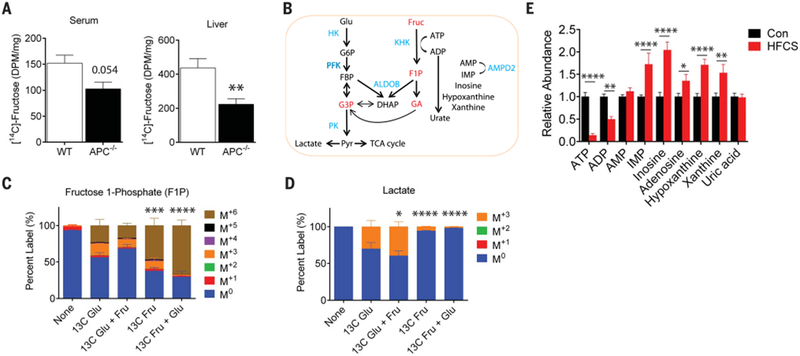
(A) The amount of radioactivity in the serum (left) and liver (right) 20 min after an oral bolus of HFCS that contained U-[14C]-fructose tracer in wild-type (WT) (n = 4) and tumor-bearing APC−/− mice (n = 6). Radioactivity amount is presented as disintegrations per minute (DPM) per microliter (serum) or per microgram of protein input (liver). WT and APC−/− compared by Student’s t test, **P < 0.01. (B) Schematic depicting key enzymes and metabolites in glycolysis, fructolysis, and purine salvage pathways. Red indicates key fructose metabolites; blue indicates enzymes. Glu, glucose; Fruc, fructose; G6P, glucose 6-phosphate; FBP, fructose 1,6-bisphosphate; G3P, glyceraldehyde 3-phosphate; Pyr, pyruvate; F1P, fructose 1-phosphate; GA, glyceraldehyde; DHAP, dihydroxyacetone phosphate; ATP, adenosine triphosphate; ADP, adenosine diphosphate; AMP, adenosine monophosphate; IMP, inosine monophosphate; HK, hexokinase; PFK, phosphofructokinase; PK, pyruvate kinase; ALDOB, aldolase B; KHK, ketohexokinase; AMPD2, AMP deaminase 2. (C) Percent labeling of fructose 1-phosphate and (D) lactate following a 10-min ex vivo incubation with 10 mM U-[13C]-glucose, 10 mM U-[13C]-glucose with 10 mM fructose, 10 mM U-[13C]-fructose, and 10 mM U-[13C]-fructose with 10 mM glucose. The isotopic labeling of each metabolite is indicated by the M+# designation indicated in the legend where the # represents how many [12C] were replaced with [13C]. For example, the M+3 species for fructose 1-phosphate has the chemical formula 13C312C3H13O9P. n = 3 to 4 per group. Two-way ANOVA with Holm-Sidak post-test compared to the U-[13C]-glucose condition. *P < 0.05, ***P < 0.001, ****P < 0.0001, 13C Glu, U-[13C]-glucose; 13C Fru, U-[13C]-fructose. (E) Relative abundance of key metabolites in the adenine purine salvage pathway. Con (n = 14), HFCS (n = 9). Two-way ANOVA with Holm-Sidak post-test *P < 0.05, **P < 0.01, ***P < 0.001, ****P < 0.0001. All data represent means ± SEM.
Glucose and fructose have the same caloric value and similar chemical structures; however, these two sugars are metabolized differently in both the liver and in IECs (Fig. 2B) (24, 25). The most notable difference begins with the initial phosphorylation step following absorption. Whereas glucose is phosphorylated by hexokinases (HKs), generating glucose-6-phosphate (G6P), fructose is phosphorylated on the 1-position by KHK (also known as fructokinase), producing fructose 1-phosphate (F1P). The activity of HKs is tightly regulated by the concentration of G6P (product inhibition), whereas the activity of KHK is not subject to feedback inhibition. In the liver, this results in a rapid accumulation of F1P, coupled with a pronounced depletion of adenosine 5′-triphosphate (ATP) following fructose consumption. F1P can then be cleaved into three carbon units by aldolase B, bypassing phosphofructokinase (PFK). Despite the relatively well-studied pathway of fructose metabolism in the liver and in the small intestine, the role of fructose metabolism in tumors is mostly unknown.
Given that APC−/− tumors can efficiently transport both glucose and fructose, we sought to determine the metabolic fate of glucose and fructose using 13C isotopic tracing. We isolated tumors from APC−/− mice and exposed them to four different labeling conditions for 10 min ex vivo: 13C-glucose (labeled at all six carbons), 13C-fructose (labeled at all six carbons), 13C-glucose + unlabeled fructose, and 13C-fructose + unlabeled glucose. The labeling pattern of metabolic intermediates from glucose and fructose was then determined using liquid chromatography with tandem mass spectrometry (LC-MS/MS). As expected, F1P was predominantly 13C-labeled at all six positions (M+6) in tumors treated with 13C-fructose or 13C-fructose + unlabeled glucose (47.1 and 67.1%, respectively), as assessed by the percentage of labeling (Fig. 2C); these findings confirm the activity and presence of KHK in the tumors. Notably, there was almost no labeling of downstream metabolites of F1P from 13C-fructose when unlabeled glucose was added to the medium (Fig. 2D and fig. S6A), suggesting that the presence of glucose saturates aldolase and prevents fructose from being cleaved into three carbon units in this time frame. Because KHK produces F1P much faster than aldolase cleaves it, F1P accumulates (fig. S6B). This results in an acute drop in cytosolic ATP in tumors from APC−/− mice that had received HFCS as compared to Con tumors following a bolus (and Fig. 2E).
In the liver, the activity of the purine degradation pathway increases during fructose ingestion because AMP deaminase (AMPD2) is stimulated by the depletion of inorganic phosphate (Pi) that occurs in response to the high rate of glycolysis (26, 27). In agreement with this mechanistic link between fructose and purine metabolism, we found that the abundance of downstream metabolites of AMPD2 was higher in tumors from HFCS-treated APC−/− mice than in tumors from control APC−/− mice (Fig. 2E). PFK is the most critical regulatory enzyme in glycolysis, and it is inhibited by ATP (28). Thus, we hypothesized that fructose-induced ATP depletion might result in the activation of PFK, thereby facilitating the metabolism of glucose via glycolysis in APC−/− tumors. Indeed, we found that tumors exposed to 13C-glucose + unlabeled fructose contained a higher percentage of fully labeled glycolytic metabolites than tumors exposed to 13C-glucose alone (e.g., 39.6% versus 30.2% for lactate, the end product of glycolysis) (Fig. 2D). We also confirmed that in vivo lactate production in tumors was enhanced in APC−/− mice treated with an oral bolus of 13C-glucose + unlabeled fructose as compared to mice treated with a bolus of 13C-glucose alone (fig. S6D). Together, these results suggest that fructose enhances glucose metabolism by depleting ATP levels, thereby activating PFK, an important glycolytic enzyme, in APC−/− tumors.
We next explored the mechanism by which increased glycolysis enhances tumor growth in HFCS-treated APC−/− mice. In addition to generating ATP, glycolysis serves as a carbon source for de novo fatty acid synthesis. Cancer cells rely heavily on fatty acid synthesis (also known as “de novo lipogenesis”) for cellular membrane formation, energy generation and storage, and intracellular signaling (29, 30). Using next-generation RNA sequencing (RNA-seq), we found that the expression levels of all lipogenic enzymes, including acetyl-CoA (coenzyme A) carboxylase alpha (ACACA) and fatty acid synthase (FASN), were markedly increased in APC−/− tumors in comparison to IECs (Fig. 3A and fig. S7A). Accordingly, APC−/− tumors had an increased abundance of long-chain fatty acids, as measured by a LC-MS/MS analysis (fig. S7B), and demonstrated increased incorporation of 14C-glucose into intracellular lipids as compared to the IECs following an oral bolus of HFCS (radiolabeled 14C-glucose together with unlabeled fructose) (fig. S7C).
Fig. 3. HFCS treatment accelerates de novo fatty acid synthesis in intestinal tumors from APCdeficient mice.
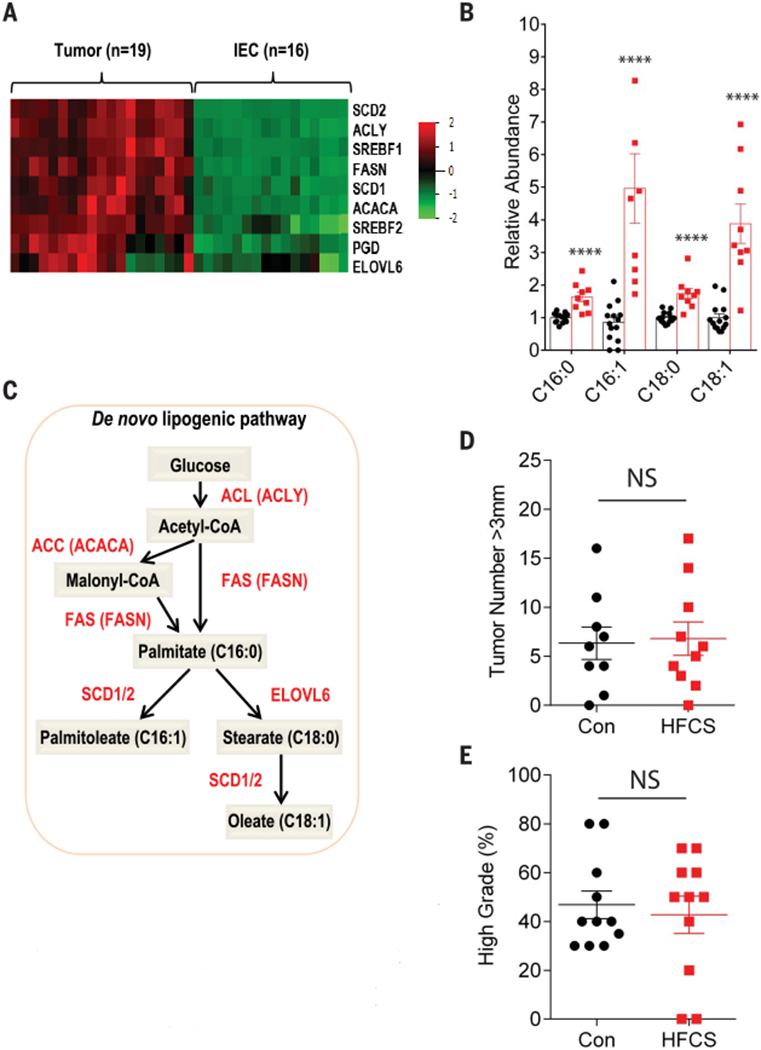
(A) Heatmap depicting the relative expression of the indicated genes involved in fatty acid synthesis from APC−/− tumors (n = 16) and intestinal epithelial cells (IECs, n = 16) using RNA-seq data. (B) Relative abundance of saturated and unsaturated 16- and 18-carbon fatty acid species in APC−/− tumors treated daily with water (Con, n = 14) or HFCS (n = 9). Groups compared by Student’s t test with correction for multiple comparisons using the Holm-Sidak method. ****P < 0.0001. (C) Schematic depicting key enzymes, genes, and metabolites in the de novo lipogenesis pathway. Red, enzyme name; red in parentheses, gene name. (D) APC−/−; FASN−/− mice were treated with a daily oral gavage containing water (Con, n = 9) or HFCS (n = 10) starting the day after tamoxifen injection and killed at 8 weeks. The size of each tumor (diameter) in the intestine was determined in whole-mount tissue after methylene blue staining, using a dissecting microscope. Data represent the number of tumors >3 mm in diameter in Con and HFCS-treated mice. Groups compared by Student’s t test. NS, not significant. (E) Percentage of high-grade tumors (n = 11 per group) from Con and HFCS-treated APC−/−; FASN−/− mice. Student’s t test. NS, not significant. All data represent means ± SEM.
The above findings suggest that tumors in HFCS-treated APC−/− mice rewire their metabolic pathways in favor of fatty acid synthesis. We postulated that chronic treatment of mice with HFCS would accelerate glycolysis and further increase the levels of fatty acids in tumors as compared to tumors from the Con group. To investigate this hypothesis, we assessed the level of citrate, a key intermediate between glucose metabolism and fatty acid synthesis, in tumors by measuring its fractional labeling from 13C-glucose after tumors were exposed to either 13C-glucose or 13C-glucose + unlabeled fructose. As expected, the proportion of two-carbon-labeled (M+2) citrate derived from glucose was significantly increased when fructose was added to the medium (fig. S7D). Using a global metabolomics strategy, we confirmed that the lipid metabolic pathway was one of the most enriched pathways in tumors from the HFCS-treated mice group compared to control group (fig. S7, E and F). Notably, the levels of all four major long-chain fatty acids—palmitic acid, palmitoleic acid, stearic acid, and oleic acid—were increased in tumors from HFCS-treated mice compared to tumors from water-treated mice (Fig. 3B and fig. S7G). In addition, many genes related to the production of eicosanoids from fatty acid precursors showed increased expression in APC−/− tumors as compared to IECs (fig. S7H), and several eicosanoids increased in abundance in mice receiving chronic HFCS treatment (fig. S7I). FASN encodes an enzyme that catalyzes the synthesis of palmitic acid from acetyl-CoA and malonyl-CoA, a critical step for de novo lipogenesis (Fig. 3C). To determine if de novo lipogenesis is necessary for enhancement of tumor growth by HFCS, we generated APC−/−; FASN−/− mice by breeding APCfLox/fox mice with FASNfLox/fLox mice (31) and treated them with daily oral HFCS for 8 weeks. Indeed, the loss of FASN in APC−/− tumors abolished the ability of HFCS to enhance tumor growth (Fig. 3D and fig. S8A) as well as its effects on tumor grade (Fig. 3E), suggesting that the increased fatty acid synthesis caused by HFCF treatment contributes to the tumorigenesis.
Lastly, we investigated whether the increased tumor growth in the HFCS group was dependent on fructose metabolism. We created APC−/−; KHK−/− mice by crossing the APCfLox/fLox mice with mice deficient in KHK (32,33) and treated them chronically by daily oral gavage with the modest amount of HFCS (3% of total daily caloric intake) for 8 weeks. The absence of KHK abolished HFCS enhancement of tumor growth and grade in APC−/− mice (Fig. 4, A and B, and fig. S8B). There was also a trend toward a reduction in overall tumor number (fig. S8C). In contrast to the APC−/− tumors, the APC−/−; KHK−/− tumors did not show changes in the abundance of ATP, PFK activity, or rate of glycolysis (as measured by lactate production) after HFCS treatment (Fig. 4, C to E). Finally, HFCS-treated APC−/−; KHK−/− tumors had reduced levels of long-chain fatty acids relative to HFCS-treated APC−/− tumors (fig. S8D), suggesting that KHK activity is essential for the increased fatty acid synthesis following HFCS treatment.
Fig. 4. KHK deletion abolishes tumor phenotypes in APC-deficient mice treated with HFCS.
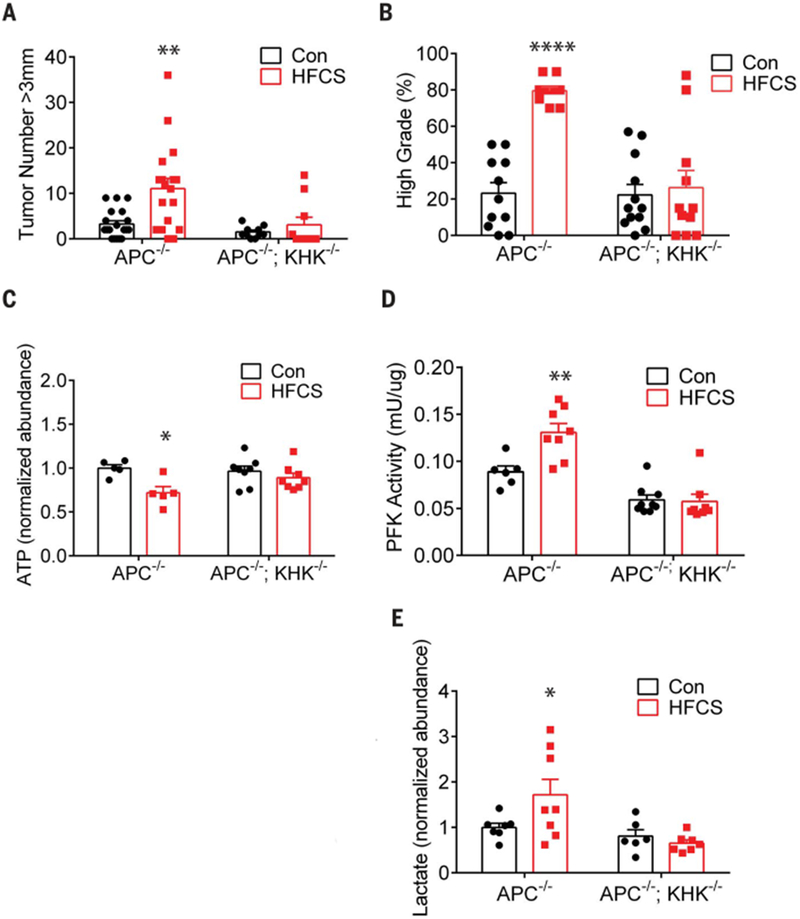
(A) The size of each tumor (diameter) in the intestine was determined in wholemount tissue after methylene blue staining, using a dissecting microscope. Data represent the number of tumors >3 mm in diameter in Con (n = 19) and HFCS-treated (n = 18) APC−/− and APC−/−; KHK−/− mice (n = 10 per group). Groups compared by two-way ANOVA with Holm-Sidak post-test. **P < 0.01. (B) Percentage of high-grade tumors from Con (n = 11) and HFCS-treated (n = 10) APC−/− and APC−/−;KHK−/− mice (Con n = 12, HFCS n = 11). Groups compared by two-way ANOVA with Holm-Sidak post-test. ****P < 0.0001. (C) Normalized abundance of ATP in tumors from APC−/− (n = 5 per group) and APC−/−; KHK−/− (n = 8 per group) mice treated ex vivo with and without 10 mM HFCS for 10 min. Two-way ANOVA with Holm-Sidak post-test. *P < 0.05. (D) Normalized phosphofructokinase (PFK) activity (mU/μg) in tumors from APC−/− (Con n = 6, HFCS n = 8) and APC−/−; KHK−/− (Con n = 9, HFCS n = 8) mice treated for 8 weeks. Two-way ANOVA with Holm-Sidak post-test. **P < 0.01. (E) Normalized abundance of lactate in tumors from APC−/− (Con n = 7, HFCS n = 8) and APC−/−; KHK−/− (Con n = 6, HFCS n = 7) mice treated ex vivo with and without 10 mM HFCS for 10 min. Two-way ANOVA with Holm-Sidak post-test. *P < 0.05. All data represent means ± SEM.
In this study, we have found that HFCS, the primary sweetener used in SSBs, contributes to intestinal tumorigenesis in mice by accelerating glycolysis and de novo lipogenesis. These effects are independent of obesity and metabolic syndrome. HFCS in liquid form rapidly increases the levels of fructose and glucose in the intestinal lumen and serum, respectively, which allows intestinal tumors to take up these sugars for their growth. Our results also identify KHK as a key accelerator of tumor growth. When tumors are exposed to both glucose and fructose, KHK consumes fructose, rapidly depleting ATP, which in turn accelerates glycolysis and de novo lipogenesis. This reduction in ATP accelerates the flux of glucose through glycolysis by activating PFK. We speculate that this increased rate of glycolysis depletes Pi [at the step of glyceraldehyde 3-phosphate dehydrogenase (GAPDH)] and results in activation of AMPD2, which degrades all forms of adenine nucleotides and further reduces cytosolic ATP in APC−/− tumors. Because fructose is not essential for the survival and growth of normal cells (34, 35), inhibitors of GLUT5 or KHK may selectively impede the growth of CRC cells. This result agrees with and broadens the scope of a recent study where KHK was identified as a synthetic lethal target for KRAS-mutant colorectal cancers using a CRISPR screen in xenografts (36). Together these findings suggest that therapeutic targeting of fructose metabolism may merit investigation as a strategy for slowing the progression of CRC. Our study also provides important preclinical evidence that the combination of dietary glucose and fructose, even at moderate dose, can enhance intestinal tumor growth. Whether these findings can be extrapolated to humans requires further investigation.
Supplementary Material
ACKNOWLEDGMENTS
We thank S.A. Lee, B. Ngo, M. Paddock, J. Johnson, J. Wong, D. Montros, G. Zhang, J. Xiang, S. Wang, S. Mohamed, E. Liu, I. Rischie, and Y. Yan for technical assistance and helpful discussion. We also thank J. A. Koutcher for use of MRI equipment. KHK knockout mice were kindly provided by D. T. Bonthron and R. J. Johnson. FASNflox/flox mice were generously provided by C. F. Semenkovich.
Funding: This work was supported by NIH R35 CA197588 (L.C.C.), SU2C-AACR-DT22-17 (L.C.C.), NIH CTSC KL2 scholar awards (J.Y.), CPRIT RR170039 (J.Y.), and NCI 1K22CA216036 (J.Y.), NIH K08 CA230318 (M.D.G.), NIH P01 HD067244 (S.S.G.), and NIH R01 NS093872 (S.S.G.).
Competing interests: M.D.G. has received a speaker honorarium from Pfizer, Inc., and his laboratory receives financial support from Myos Rens Technology, Inc. L.C.C. is a founder of and member of the senior advisory boards of Agios Pharmaceuticals and of Petra Pharmaceuticals, which are developing therapies for cancer. LCC’s laboratory also receives financial support from Petra Pharmaceuticals. All other authors report no competing interests.
Footnotes
Data and materials availability: All data are available in the main text or the supplementary materials. The materials that support the findings of this study are available from the corresponding author upon reasonable request. Data from this paper have been deposited in the Gene Expression Omnibus (GEO) database, https://www.ncbi.nlm.nih.gov/geo (accession no. GSE126858).
SUPPLEMENTARY MATERIALS
www.sciencemag.org/content/363/6433/1345/suppl/DC1
Materials and Methods
Figs. S1 to S8
References (37–52)
SUPPLEMENTARY MATERIALS http://science.sciencemag.org/content/suppl/2019/03/20/363.6433.1345.DC1
REFERENCES AND NOTES
- 1.Malik VS, Schulze MB, Hu FB, Am. J. Clin. Nutr 84, 274–288 (2006). [DOI] [PMC free article] [PubMed] [Google Scholar]
- 2.Hodge AM, Bassett JK, Milne RL, English DR, Giles GG, Public Health Nutr. 21, 1618–1626 (2018). [DOI] [PMC free article] [PubMed] [Google Scholar]
- 3.Tappy L, Lê KA, Physiol. Rev 90, 23–46 (2010). [DOI] [PubMed] [Google Scholar]
- 4.Singh GM et al. , PLOS ONE 10, e0124845 (2015). [DOI] [PMC free article] [PubMed] [Google Scholar]
- 5.Siegel RL, Miller KD, Jemal A, JAMA 318, 572–574 (2017). [DOI] [PMC free article] [PubMed] [Google Scholar]
- 6.Araghi M et al. , Int. J. Cancer ijc.32055 (2018). [Google Scholar]
- 7.Sung H, Siegel RL, Rosenberg PS, Jemal A, Lancet Public Health S2468-2667(18)30267–6 (2019). [DOI] [PubMed] [Google Scholar]
- 8.Fuchs MA et al. , PLOS ONE 9, e99816 (2014). [DOI] [PMC free article] [PubMed] [Google Scholar]
- 9.Bardou M, Barkun AN, Martel M, Gut 62, 933–947 (2013). [DOI] [PubMed] [Google Scholar]
- 10.Hopkins BD, Goncalves MD, Cantley LC, J. Clin. Oncol 34, 4277–4283 (2016). [DOI] [PMC free article] [PubMed] [Google Scholar]
- 11.Yun J et al. , Science 350, 1391–1396 (2015). [DOI] [PMC free article] [PubMed] [Google Scholar]
- 12.Barker N et al. , Nature 457, 608–611 (2009). [DOI] [PubMed] [Google Scholar]
- 13.Fearon ER, Vogelstein B, Cell 61, 759–767 (1990). [DOI] [PubMed] [Google Scholar]
- 14.Fulgoni V 3rd, Am. J. Clin. Nutr 88, 1715S (2008). [DOI] [PubMed] [Google Scholar]
- 15.Feng Y et al. , Am. J. Pathol 183, 493–503 (2013). [DOI] [PMC free article] [PubMed] [Google Scholar]
- 16.Drozdowski LA, Thomson ABR, World J Gastroenterol. 12, 1657–1670 (2006). [DOI] [PMC free article] [PubMed] [Google Scholar]
- 17.Ravich WJ, Bayless TM, Thomas M, Gastroenterology 84, 26–29 (1983). [PubMed] [Google Scholar]
- 18.Rumessen JJ, Gudmand-Høyer E, Gut 27, 1161–1168 (1986). [DOI] [PMC free article] [PubMed] [Google Scholar]
- 19.Beyer PL, Caviar EM, McCallum RW, J. Am. Diet. Assoc 105, 1559–1566 (2005). [DOI] [PubMed] [Google Scholar]
- 20.Jang C et al. , Cell Metab. 27, 351–361.e3 (2018). [DOI] [PMC free article] [PubMed] [Google Scholar]
- 21.Godoy A et al. , J. Cell. Physiol 207, 614–627 (2006). [DOI] [PubMed] [Google Scholar]
- 22.Li Q et al. , Cell. Physiol. Biochem 42, 397–406 (2017). [DOI] [PubMed] [Google Scholar]
- 23.Uzozie A et al. , Mol. Cell. Proteomics 13, 1198–1218 (2014). [DOI] [PMC free article] [PubMed] [Google Scholar]
- 24.Jensen T et al. , J. Hepatol 68, 1063–1075 (2018). [DOI] [PMC free article] [PubMed] [Google Scholar]
- 25.Hannou SA, Haslam DE, McKeown NM, Herman MA, J. Clin. Invest 128, 545–555 (2018). [DOI] [PMC free article] [PubMed] [Google Scholar]
- 26.Van den Berghe G, Prog. Biochem. Pharmacol 21, 1–32 (1986). [PubMed] [Google Scholar]
- 27.Morris RC Jr., Nigon K, Reed EB, J. Clin. Invest 61, 209–220 (1978). [DOI] [PMC free article] [PubMed] [Google Scholar]
- 28.Kemp RG, Foe LG, Mol. Cell. Biochem 57, 147–154 (1983). [DOI] [PubMed] [Google Scholar]
- 29.Currie E, Schulze A, Zechner R, Walther TC, Farese RV Jr., Cell Metab. 18, 153–161 (2013). [DOI] [PMC free article] [PubMed] [Google Scholar]
- 30.Menendez JA, Lupu R, Nat. Rev. Cancer 7, 763–777 (2007). [DOI] [PubMed] [Google Scholar]
- 31.Lodhi IJ et al. , Cell Metab. 16, 189–201 (2012). [DOI] [PMC free article] [PubMed] [Google Scholar]
- 32.Ishimoto T et al. , Proc. Natl. Acad. Sci. U.S.A 109, 4320–4325 (2012). [DOI] [PMC free article] [PubMed] [Google Scholar]
- 33.Diggle CP et al. , J. Histochem. Cytochem 57, 763–774 (2009). [DOI] [PMC free article] [PubMed] [Google Scholar]
- 34.Feinman RD, Fine EJ, Nutr. Metab. (Lond.) 10, 45 (2013). [DOI] [PMC free article] [PubMed] [Google Scholar]
- 35.Livesey G, Nutr J. 139, 1246S–1252S (2009). [DOI] [PubMed] [Google Scholar]
- 36.Yau EH et al. , Cancer Res. 77, 6330–6339 (2017). [DOI] [PMC free article] [PubMed] [Google Scholar]
Associated Data
This section collects any data citations, data availability statements, or supplementary materials included in this article.