

Abstract
Key points
Training with blood flow restriction (BFR) is a well‐recognized strategy for promoting muscle hypertrophy and strength. However, its potential to enhance muscle function during sustained, intense exercise remains largely unexplored.
In the present study, we report that interval training with BFR augments improvements in performance and reduces net K+ release from contracting muscles during high‐intensity exercise in active men.
A better K+ regulation after BFR‐training is associated with an elevated blood flow to exercising muscles and altered muscle anti‐oxidant function, as indicated by a higher reduced to oxidized glutathione (GSH:GSSG) ratio, compared to control, as well as an increased thigh net K+ release during intense exercise with concomitant anti‐oxidant infusion.
Training with BFR also invoked fibre type‐specific adaptations in the abundance of Na+,K+‐ATPase isoforms (α1, β1, phospholemman/FXYD1).
Thus, BFR‐training enhances performance and K+ regulation during intense exercise, which may be a result of adaptations in anti‐oxidant function, blood flow and Na+,K+‐ATPase‐isoform abundance at the fibre‐type level.
Abstract
We examined whether blood flow restriction (BFR) augments training‐induced improvements in K+ regulation and performance during intense exercise in men, and also whether these adaptations are associated with an altered muscle anti‐oxidant function, blood flow and/or with fibre type‐dependent changes in Na+,K+‐ATPase‐isoform abundance. Ten recreationally‐active men (25 ± 4 years, 49.7 ± 5.3 mL kg−1 min−1) performed 6 weeks of interval cycling, where one leg trained without BFR (control; CON‐leg) and the other trained with BFR (BFR‐leg, pressure: ∼180 mmHg). Before and after training, femoral arterial and venous K+ concentrations and artery blood flow were measured during single‐leg knee‐extensor exercise at 25% (Ex1) and 90% of thigh incremental peak power (Ex2) with i.v. infusion of N‐acetylcysteine (NAC) or placebo (saline) and a resting muscle biopsy was collected. After training, performance increased more in BFR‐leg (23%) than in CON‐leg (12%, P < 0.05), whereas K+ release during Ex2 was attenuated only from BFR‐leg (P < 0.05). The muscle GSH:GSSG ratio at rest and blood flow during exercise was higher in BFR‐leg than in CON‐leg after training (P < 0.05). After training, NAC increased resting muscle GSH concentration and thigh net K+ release during Ex2 only in BFR‐leg (P < 0.05), whereas the abundance of Na+,K+‐ATPase‐isoform α1 in type II (51%), β1 in type I (33%), and FXYD1 in type I (108%) and type II (60%) fibres was higher in BFR‐leg than in CON‐leg (P < 0.05). Thus, training with BFR elicited greater improvements in performance and reduced thigh K+ release during intense exercise, which were associated with adaptations in muscle anti‐oxidant function, blood flow and Na+,K+‐ATPase‐isoform abundance at the fibre‐type level.
Keywords: Blood flow restriction training; human muscle; antioxidant; reactive oxygen species; N‐acetylcysteine; fibre type; single fibre; Na+,K+‐ATPase; ion transport
Key points
Training with blood flow restriction (BFR) is a well‐recognized strategy for promoting muscle hypertrophy and strength. However, its potential to enhance muscle function during sustained, intense exercise remains largely unexplored.
In the present study, we report that interval training with BFR augments improvements in performance and reduces net K+ release from contracting muscles during high‐intensity exercise in active men.
A better K+ regulation after BFR‐training is associated with an elevated blood flow to exercising muscles and altered muscle anti‐oxidant function, as indicated by a higher reduced to oxidized glutathione (GSH:GSSG) ratio, compared to control, as well as an increased thigh net K+ release during intense exercise with concomitant anti‐oxidant infusion.
Training with BFR also invoked fibre type‐specific adaptations in the abundance of Na+,K+‐ATPase isoforms (α1, β1, phospholemman/FXYD1).
Thus, BFR‐training enhances performance and K+ regulation during intense exercise, which may be a result of adaptations in anti‐oxidant function, blood flow and Na+,K+‐ATPase‐isoform abundance at the fibre‐type level.
Introduction
Training with blood flow restriction (BFR) has become a well‐recognized strategy for facilitating muscle hypertrophy and strength (Pearson & Hussain, 2015) and there is some indication that BFR may augment training adaptations in muscle oxidative capacity (Sundberg et al. 1993; Paton et al. 2017; Christiansen et al. 2018b) and exercise performance (Sundberg et al. 1993; Manimmanakorn et al. 2013). BFR is often achieved by inflation of an occlusion cuff around the exercising limb(s), resulting in a severely hypoxic muscular environment and an increased rate of anaerobic glycolytic flux (Corvino et al. 2017; Christiansen et al. 2018b). Subsequent deflation of the cuff raises muscle oxygen delivery (Gundermann et al. 2012). Taken together, these mechanisms create favourable conditions for reactive oxygen species (ROS) production (Clanton, 2007; Stoner et al. 2007) and ionic (K+ and Ca2+) perturbations (Shimoda & Polak, 2011), both of which are potent stimuli for increasing the expression of K+ regulatory systems, such as the Na+,K+‐ATPase (Murphy et al. 2006; Silva & Soares‐da‐Silva, 2007). Thus, training with BFR may be a potent strategy for promoting adaptations in skeletal muscle K+ regulation.
Studies in intact muscle fibres have demonstrated that ROS generated during muscle contractions, or exogenously administered, modulate muscle force production in both a time‐ and dose‐dependent manner (Reid et al. 1993). At high concentrations, ROS retard muscle force development, which has been partially ascribed to the disruption of myocellular K+ homeostasis (Cerbai et al. 1991). This is consistent with observations that Na+,K+‐ATPase activity is depressed by ROS exposure in animals (Glynn, 1963; Boldyrev & Kurella, 1996) or elevated during exercise by anti‐oxidant treatment in humans (McKenna et al. 2006).
Anti‐oxidant treatment has been shown to attenuate the rise in arterialized‐venous plasma K+ concentrations during submaximal exercise (McKenna et al. 2006), suggesting ROS may perturb whole‐body K+ homeostasis. However, systemic K+ levels may inaccurately reflect locomotor muscle K+ homeostasis (Nielsen et al. 2004; Gunnarsson et al. 2013), indicating the need to directly assess K+ efflux from exercising musculature to clarify the role of ROS and anti‐oxidant function with respect to regulating K+ homeostasis in human skeletal muscle. In humans, intense training enhances K+ regulation (Nielsen et al. 2004) and modulates ROS defence in skeletal muscle (Hellsten et al. 1996; Leeuwenburgh et al. 1997). Based on these findings and the in vitro studies described above, it might be assumed that training‐induced improvements in muscle K+ regulation are associated with an altered anti‐oxidant function. However, this has not been examined in humans.
In rats, excitation‐induced fatigue manifests earlier in fast‐twitch than in slow‐twitch muscle, which has been linked with the faster accumulation of extracellular K+ and resultant inexcitability (Clausen et al. 2004). These differences have partly been ascribed to a different expression of Na+,K+‐ATPase isoforms (α1, α2, β1) between fibre types (Fowles et al. 2004). Thus, recent observations in humans show that Na+,K+‐ATPase isoforms are expressed in a fibre type‐specific manner and that their content is differently altered by training (Thomassen et al. 2013; Wyckelsma et al. 2015; Christiansen, 2018; Christiansen et al. 2018a). Despite these observations, it remains unresolved how training‐induced improvements in muscle K+ regulation are associated with the modulation of Na+,K+‐ATPase‐isoform content at the fibre‐type level in humans. Furthermore, in myocytes, raising FXYD content counteracts Na+,K+‐ATPase dysfunction induced by oxidative damage (Bibert et al. 2011), whereas elevated FXYD1 phosphorylation increases Na+ affinity and ouabain‐sensitive activity of the Na+,K+‐ATPase (Reis et al. 2005; Ingwersen et al. 2011). Therefore, improvements in muscle K+ regulation may also be obtained by increasing FXYD1 abundance, phosphorylation or both. However, to our knowledge, no studies in humans have explored the effects of training on the relationship between FXYD1 content/phosphorylation and muscle K+ regulation during exercise. Because FXYD1 has been shown to be either expressed or phosphorylated in a fibre type‐specific manner in sedentary rats (Reis et al. 2005; Juel, 2009; Thomassen et al. 2011) and recreationally active humans (Thomassen et al. 2013; Christiansen, 2018; Christiansen et al. 2018a), this relationship should be studied at the fibre‐type level.
Thus, the primary aims of the present study were to examine the effects of training with BFR on performance and leg K+ regulation during exercise in men, and to clarify the muscular mechanisms involved. The hypotheses tested were: (i) training with BFR elicits greater improvements in exercise performance and attenuates thigh K+ release during exercise compared to training without BFR; (ii) anti‐oxidant infusion counteracts an increase in thigh K+ release during exercise; (iii) training with BFR alters the effect of anti‐oxidant infusion on thigh K+ release during exercise; and (iv) improvements in leg K+ regulation are associated with fibre type‐dependent modulation of Na+,K+‐ATPase isoform (α1, α2, β1, FXYD1) abundance and FXYD1 phosphorylation.
Methods
Ethical approval
Participants were informed about the requirements, benefits and potential risks of the study before providing their written informed consent to participate. The experimental procedures adhered to the standards in the latest revision of the Declaration of Helsinki and were approved by the Human Research Ethics Committee of the Capital Region of Denmark (approval no. H‐16000377).
Participants
Thirteen recreationally‐active men (mean ± SD: age: 25 ± 4 years; height: 183 ± 6 cm; body mass: 83.6 ± 14 kg; : 49.7 ± 5.3 mL kg−1 min−1) volunteered to participate in the present study. They were non‐smokers, free of medication and engaged in regular physical activity (i.e. soccer, fitness/gym, swimming or running) one to three times per week. The participants did not use anti‐inflammatory drugs or supplements and were asked to maintain their routine physical activity throughout the study. Two participants withdrew after the first experimental day as a result of the invasive nature of the experiment, whereas one participant dropped out 2 weeks into the familiarization period as a result of loss of motivation. Thus, 10 men completed the study.
Experimental design
The study used an intra‐subject design. The legs of participants were randomly assigned in a counterbalanced fashion to a 6 week training intervention consisting of interval cycling with BFR for one leg (BFR‐leg) and without BFR for the other leg (CON‐leg). Randomization took into account the dominant (i.e. preferred kicking) leg and was performed using a random‐number generator in Excel, version 2013 (Microsoft Corp., Redmond, WA, USA). The legs were trained simultaneously and their force output was matched during every training session.
Before and after the training period, the performance of each leg was assessed during incremental knee‐extensor exercise to exhaustion in a Krogh ergometer, allowing isolated work with the quadriceps muscles (Andersen & Saltin, 1985). After at least 48 h, participants completed an experimental day (as detailed below) on which femoral arterial and venous blood K+ concentrations were measured, and femoral arterial blood flow assessed, in each leg to determine thigh K+ release during exercise at various intensities under i.v. infusion of anti‐oxidant [N‐acetylcysteine (NAC)] or placebo (saline). A resting muscle biopsy was also obtained from each leg to determine Na+,K+‐ATPase‐isoform abundance and FXYD1 phosphorylation in type I and II fibres. In addition, participants performed an incremental exercise test to exhaustion on a bike ergometer to determine training intensity and maximal oxygen consumption (). To minimize any placebo effect, participants were not informed about which intervention was hypothesized to be the most beneficial for their performance and muscle response. All tests were performed under standard laboratory conditions (∼23 °C, ∼33% relative humidity) in the Department of Nutrition, Exercise and Sport (University of Copenhagen, Denmark). Participants were asked to abstain from alcohol, caffeine and strenuous physical activity for 24 h prior to each laboratory visit and recorded their dietary pattern in this period. They were asked to replicate this pattern before each visit.
Incremental knee‐extensor exercise test
On the day of the first incremental, single‐leg knee‐extensor exercise test, participants were instructed to consume a light meal 3 h prior to the start of the test and to replicate this dietary pattern prior to each subsequent non‐invasive test (i.e. without sampling of blood and muscle tissue). In the 3 h before and during these tests, only water was allowed ad libitum. Upon arrival at the laboratory, the participants changed clothes, were asked about their sleep, food and liquid intake, and their body mass was recorded. Next, a 5 min warm‐up was performed at 100 W (75 r.p.m.) on a cycle ergometer (Monark Exercise, AB, Vansbro, Sweden). The participants were then placed in the knee‐extensor model. After 15 min of rest, the participants carried out the test when they were sitting upright with a hip angle of ∼120°. The test commenced with 5 min at 24 W, followed by an increase in workload of 6 W min–1 until volitional exhaustion, defined as an inability to sustain the required workload at a kicking frequency of 60 rpm. Each leg was tested separately in a randomized order interspersed by at least 30 min of rest. This order was kept the same for each participant before and after the training period. The power output attained at task failure [incremental peak power output (iPPO)] was calculated as the sum of the power output at the last completed stage plus the increment (6 W) multiplied by the fractional time spend at the last (incomplete) stage. The first execution of the test before the familiarization was used to establish an exercise intensity that would elicit task failure after 3–9 min. This relative intensity was used in Ex2 on the experimental day. To enable calculation of the workload to be used in Ex1, this test was always executed prior to the experimental day before and after the training period.
Incremental bike ergometer test
Participants performed the incremental cycling test on a bike ergometer (Monark Exercise, AB) using cycling shoes with cleats. Before the test, participants were instrumented with a facemask covering the mouth and nose, which was connected to an online gas‐analysing system (Oxycon Pro, Jaeger, Germany) to measure (breath‐by‐breath) inspired and expired gasses. The test comprised repeated 4 min cycling bouts interspersed by 1 min of rest. The first bout commenced at 90 W, after which the workload was increased by 30 W at the onset of each subsequent bout until volitional exhaustion, defined as an inability to maintain the required workload. After 5 min of additional rest, the participants commenced exercising for 1 min at the workload of the last completed bout, after which the workload was increased by 10 W min–1 until exhaustion to ascertain a plateau in . was determined as the maximum 15 s plateau in oxygen uptake during the test. The maximum workload (W max) was calculated as the sum of the workload of the last completed bout plus the increment (30 W) multiplied by the fractional time spend on the last (incomplete) bout.
Training
Training sessions took place indoor on a Tomahawk IC7 cycle ergometer (Indoor Cycling Group, Nürnberg, Germany) at a local gym (fitnessdk Adelgade, Copenhagen, Denmark). Prior to the training period, participants underwent 4 weeks of training to become familiarized with the training protocol and to be accustomed to maintaining their preferred cadence (range 75–85 r.p.m.) and to adjusting their workloads. In this period, they completed (mean ± SD) 8 ± 3 training sessions similar to those in the training period, with sessions separated by at least 48 h. During the intervention period, the participants trained three times per week, amounting to a total of 17 ± 1 (mean ± SD) training sessions. Each training session commenced with a 5 min warm‐up at 30% of maximum workload (W max), determined from the graded exercise test, followed by 2 min of rest. Next, three periods of 3 × 2 min cycling bouts were performed separated by 1 min and each period by 2 min of active recovery (i.e. pedalling freely without workload). The target intensity of the first, second and third period was 60%, 70% and 80% W max, respectively. The intensity and cuff pressure was noted and the participants reported their overall rating of perceived exertion (RPE) on the 6–20 BORG‐scale (Borg, 1982). During the intervention period, the training intensity was (mean ± SD) 61 ± 3%, 72 ± 4% and 81 ± 10% W max in first, second and third period, respectively. RPE was 13 ± 1, 16 ± 2 and 19 ± 1, respectively. An investigator provided verbal encouragement to the participants throughout each session.
Matching of leg force during training
The participants performed each training session with force sensor insoles (Novel GmbH, Munich, Germany) in their cycling shoes to measure the force generated during every pedal rotation. The force output was wirelessly transmitted via Bluetooth to an iPad Mini 2 (Apple Inc., Cupertino, CA, USA) using Pedoped software (Pedoped Expert; Novel GmbH). The iPad was mounted on the handlebar to enable visual feedback in real‐time about the force generated by each leg. Before use, every insole was validated against the same force plate (Kistler, Winterthur, Switzerland). The coefficient of variation for the insole signal, relative to the force plate, was ≤5%. Throughout each session, the participants were reminded repeatedly by the investigators to maintain the same peak force between the legs. After each session, the force data was stored on the iPads and later exported to a laptop for further analysis in Excel, version 2013 (Microsoft Corp.). During the intervention period, the force (mean ± SD) generated during each pedal rotation by the CON‐leg and BFR‐leg was 102 ± 10 and 104 ± 8 N in the first period, 107 ± 9 and 109 ± 11 N in the second period, and 123 ± 15 and 121 ± 13 N in the third period, respectively. There was no difference in force output between the CON‐leg and BFR‐leg at any intensity (P > 0.05).
BFR during training
In the BFR‐leg, the femoral arterial blood flow was reduced during each cycling bout by inflation of a 13 cm wide nylon cuff (Riester, Jungingen, Germany). The cuff was placed around the most proximal part of the leg and was loosely kept in place by an elastic bandage throughout each training session. The cuff was inflated ∼10 s prior to and deflated immediately after every exercise bout to induce repeated reductions in muscle blood perfusion during exercise followed by reperfusion recovery, in line with the method used previously (Christiansen et al. 2018b). The cuff pressure during training was (mean ± SD) 178 ± 10 mmHg and varied from 155 ± 7 mmHg in the relaxed state to 200 ± 12 mmHg in the contracting state of the quadriceps muscles.
Assessment of blood flow perturbations induced by BFR
To determine the effects of BFR on femoral arterial blood flow during training, five participants completed an additional experiment during the familiarization period. In this experiment, they performed two identical knee‐extensor exercise bouts at moderate intensity (12 W) with one leg to simulate the training stimulus invoked on the knee‐extensor muscle group during the intervention period. One bout was performed without (CON) and the other with an occlusion cuff around the leg inflated to ∼178 mmHg (as during the intervention period). The bouts were separated by 1 h and their order randomized. The leg used for the experiment was randomly chosen based on knowledge about the dominant (preferred kicking) leg. During the experiment, femoral arterial blood flow was measured by ultrasound Doppler at rest before and after BFR, at 20 s, 40 s, 1 min, 2 min and 2.5 min during exercise, and at 20 s, 40 s, 1 min, 2 min and 3 min in recovery.
Experimental day
Participants arrived at the laboratory at 08.00 h after consuming a standardized, self‐chosen breakfast (e.g. 140 g of oats, one banana, 50 g of raisins, 350 mL of skim milk and 0.75 L of water) ∼2 h prior to arrival. After 15 min of rest in the supine position, catheters (20 gauge) were inserted into the femoral artery and vein of both legs under local anaesthesia (lidocaine, 20 mg mL–1) with use of ultrasound Doppler. After 15 min of rest, the participants were seated in the knee‐extensor model, where they rested for another 15–25 min, before commencing the exercise protocol (Fig. 1). The protocol comprised two sets of single‐leg exercise with each leg in the knee‐extensor model. Each set consisted of exercise at an intensity of 25% iPPO for 10 min (Ex1), followed by 25 min of rest and an intense exercise bout at 90% iPPO to exhaustion (Ex2), which was defined as an inability to sustain the required workload at ≥50 r.p.m. If the participants were able to sustain exercise longer than 4 min, the workload was increased by 6 W min–1 after 4 min until exhaustion. Exercise was always started by passive movement of the leg for 10 s (by investigator's rotation of the flywheel) to reach a cadence of 60 r.p.m. In the 15 min before and during the first set, saline (placebo; 20 mg mL–1) was infused at a constant rate (1 mL h–1) in the femoral vein of the resting leg. Twenty minutes prior to the second set, infusion of the anti‐oxidant NAC was commenced at a rate of 125 mg kg–1 h–1 for 15 min to reach a plateau in the plasma NAC concentration, followed by constant infusion at 25 mg kg–1 h–1 for the remainder of the second set, in line with the NAC infusion protocol used previously (Medved et al. 2003). In this set, Ex2 was terminated at the point of exhaustion reached during the first set with placebo infusion, if the participants did not terminate exercise prior to this time point. Infusions of placebo and NAC were separated by ∼45 min of rest. Within the first 10 min of this resting period, participants consumed two pieces of fruit (i.e. an apple, a banana and/or an orange). Except for this meal, only water was allowed ad libitum throughout the day. Participants were blinded to the infusions and reported no adverse effects of infusions. The exercise order of the legs was randomized, whereas the order for each participant was the same after relative to before the intervention period. After training, Ex2 was stopped at the time of exhaustion reached in Ex2 before the intervention. Blood was sampled from the femoral artery and vein of the working leg, and femoral arterial blood flow was measured by ultrasound Doppler over the same leg, at rest before and after infusions and at 20 s, 1 min, 3 min and 8 min of Ex1, and 20 s, 1 min and 3 min of Ex2, and after 20 s 1 min, 2 min and 3 min of recovery from each exercise bout. To correct for the mean transit time from artery to vein, venous blood was collected 5 s after each arterial sample (Bangsbo et al. 2000). Leg blood flow was measured continuously during blood sampling. In addition, a muscle biopsy was obtained ∼10 min prior to Ex2. The mean ± SD workload in Ex1 for CON‐leg and BFR‐leg was 17 ± 4 and 16 ± 4 W before the intervention period, and 18 ± 3 and 20 ± 3 W after the intervention period, respectively. The mean ± SD duration of Ex2 for CON‐leg and BFR‐leg was 4:52 ± 1:35 and 4:44 ± 1:07 min with placebo, and 4:37 ± 1:30 and 4:29 ± 1:16 min with NAC infusion at Pre, and 4:50 ± 1:34 and 4:43 ± 1:07 with placebo and 4:37 ± 1:29 and 4:29 ± 1:15 min with NAC infusion at Post, respectively. The workload was the same for placebo vs. NAC infusion.
Figure 1. Illustration of the experimental day.
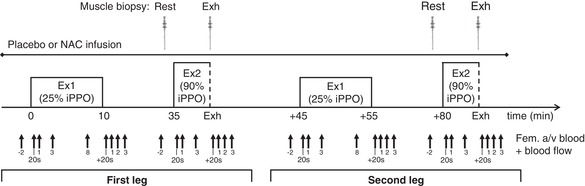
Participants performed two exercise sets with each leg in the knee‐extensor exercise model in a randomized order. Each set consisted of a 10 min exercise bout at 25% iPPO (Ex1), followed by an exhaustive bout at 90% of pre‐training iPPO (Ex2). During the first set, saline (placebo) was i.v. infused, whereas the anti‐oxidant NAC was infused during the second set after 45 min of rest. Blood was sampled from the femoral artery and vein (Fem. a/v blood) of the active leg and femoral arterial blood flow was measured over the same leg at the time points indicated. A muscle biopsy was obtained at rest (Rest) and at exhaustion from Ex2 (Exh) from each leg before and after the intervention. Only resting samples were used for analysis in the present study.
Measurement of leg blood flow
Femoral arterial blood flow was measured by ultrasound Doppler (Logic E9; GE Healthcare, Pittsburg, PA, USA) equipped with a linear probe operating at an image frequency of 9 MHz and a Doppler frequency of 3.1 MHz. Blood velocity was measured in the femoral artery distal to the inguinal ligament but above the bifurcation into the superficial and profound femoral branch. During all measurements, the insonation angle was kept as low as possible and was always below 60°. Sample volume was adjusted to include the entire vessel lumen, at the same time as avoiding vessel walls. A low‐velocity filter (velocities <1.8 m s–1) removed noise caused by turbulence at the vascular wall. Doppler tracings and B‐mode images were recorded continuously, and Doppler tracings were averaged over 10–16 s at the time of blood sampling. Vessel diameter was determined for each measurement. Artery diameter was measured during systole at rest, as well as upon peak vessel expansion during exercise and recovery. Diameter was evaluated as the average of three measurements taken perpendicular to the vessel wall at the site of blood velocity measurements.
Blood sampling
Approximately 2 mL of blood was drawn per sample with a heparinized syringe. Samples were immediately stored on ice before being analysed for K+ concentration on an ABL 800 Flex (Radiometer, Copenhagen, Denmark). To ensure collection of circulating blood, 2 mL of blood was withdrawn prior to each sample and reintroduced into the venous circulation after recovery.
Muscle biopsy
All biopsies were obtained from the vastus lateralis muscle using the Bergström needle biopsy technique with suction. In preparation, a small incision was made through the skin and muscle fascia under local anaesthesia (2 mL of 1% xylocaine). Incisions were separated by ∼1–2 cm. Immediately after collection, samples were frozen in liquid nitrogen and later stored at –80°C before being analysed. The incisions were covered with sterile Band‐Aid strips (Johnson & Johnson, New Brunswick, NJ, USA) and a Tegaderm film‐dressing (3M, Maplewood, MN, USA).
Muscle glutathione
The concentration of reduced (GSH) and oxidized glutathione (GSSG) was measured in a portion of each resting muscle sample (∼20 mg wet weight) using a high‐sensitive GSH/GSSG ratio detection kit (#ab13881; Abcam, Cambridge, UK) in accordance with the manufacturer's instructions. All samples from each participant, along with a seven‐point standard curve of both GSH and GSSG, and blanks (i.e. assay buffer and dd‐H2O), were analysed fluorometrically (excitation/emmission = 490/520 nm) in duplicate on the same 96‐well plate. To determine GSH concentration, absorbance readings of samples were normalized to the standard curve, divided by the sample volume added to each reaction well, and multiplied by the sample dilution factor. GSSG was calculated by subtracting the concentration of GSH from total glutathione (GSH + GSSG) and dividing by 2. The sample size was n = 10 (post) and n = 9 (pre) for GSH, n = 9 (post), n = 8 (pre, BFR‐leg) and n = 7 (pre, CON‐leg) for GSSG, and n = 8 (pre), n = 7 (post, BFR‐leg) and n = 8 (post, CON‐leg) for the GSH:GSSG ratio. Data points >6 SD from the mean (or unavailable as a result of a lack of muscle tissue) were excluded.
Dissection and fibre typing of muscle fibre segments
Approximately 15 mg wet weight muscle per sample was freeze‐dried for 48 h, after which a minimum of 30 single‐fibre segments per sample (range 30–60; total, n = 2670 fibres) were isolated under a stereo microscope using fine jeweller's forceps at standard environmental conditions (22°C, <30% humidity). After dissection, segments were incubated for 1 h at room temperature in 10 μL of denaturing buffer (0.125 m Tris‐HCl, 10% glycerol, 4% sodium dodecyl sulphate, 4 m urea, 10% mercaptoethanol and 0.001% bromophenol blue, pH 6.8) before being stored at –80°C until further analysis.
The fibre type of each fibre segment was determined using a novel dot blotting method described elsewhere (D. Christiansen, M. J. MacInnis, E. Zacharewicz, B. P. Frankish, H. Xu, R. M. Murphy, Accepted method paper, Scientific Reports, Nature Publishing Group). Two 0.45 μm polyvinylidene fluoride (PVDF) membranes were activated for 15 s in 96% ethanol and equilibrated for 2 min in transfer buffer (25 mm Tris, 192 mm glycine, 0.015% SDS, 96% ethanol, pH 8.3). A 1.5 μL aliquot of denatured sample was spotted onto each membrane. The membranes were then placed at room temperature on a dry piece of filter paper to dry completely for 10–20 min. The membranes were reactivated in ethanol and re‐equilibrated in transfer buffer, and then quickly rinsed in Tris‐buffered saline‐Tween (TBST), after which they were blocked for 5–45 min in 5% skim milk in TBST (blocking buffer). Next, one membrane was incubated (1:200) with myosin heavy chain I (MHCI) antibody, whereas the other membrane was probed (1:200) with myosin heavy chain IIa (MHCIIa) antibody, for 2–3 h at room temperature with gentle rocking. Antibody details are provided in Table 1. After two quick washes in blocking buffer, the membranes were incubated (1:5.000) for 1 h at room temperature with different HRP‐conjugated secondary antibodies (MHCI: goat anti‐mouse IgM, #62‐6820; and MHCIIa: goat anti‐mouse IgG, #PIE31430; both Thermo Fisher Scientific). After two 2‐min washes in TBST, the membranes were incubated with Clarity enhanced chemiluminescence reagent (Bio‐Rad, Hercules, CA, USA). Imaging was performed on a ChemiDoc MP (Bio‐Rad). The remainder of each denatured segment (7 μL) was organized into one of two groups of fibres (type I and II) per sample according to MHC expression. The number of segments included in each group of fibres per sample ranged from 5 to 27 for type I and from 6 to 23 for type II. Hybrid fibres (expressing both MHC isoforms) and blank fibres (i.e. no protein present or a clean type IIx fibre) were excluded from the analysis.
Table 1.
Primary antibodies used for dot blotting and western blotting
| Protein | Primary antibody and supplier | Host species and isotype (antibody type) | Concentration | Molecular mass (kDa) |
|---|---|---|---|---|
| Na+,K+‐ATPase α1 |
Developmental Studies Hybridoma Bank (DSHB), University of Iowa (#a6F‐s; lot #7/23/15) |
Mouse, IgG (monoclonal) |
1:500 | ∼100 |
| Na+,K+‐ATPase α2 |
Merck Millipore (#07‐674; lot #2716192) |
Rabbit, IgG (polyclonal) |
1:500 | ∼100 |
| Na+,K+‐ATPase β1 |
Thermo Fisher Scientific (#MA3‐930; lot #RA224651) |
Mouse, IgG (monoclonal) |
1:1.000 | ∼50 |
| FXYD1 |
United BioResearch (Proteintech) (#13721‐1‐AP) |
Rabbit, IgG (polyclonal) |
1:5000 | ∼12 |
| AB_FXYD1 (C2) | Donated by Dr J. Randall Moorman (University of Virginia, USA) |
Rabbit, IgG (polyclonal) |
1:5000 | ∼12 |
| MHC I | Developmental Studies Hybridoma Bank, University of Iowa (#A4.840) | Mouse, IgM (monoclonal) | 1:200 | ∼200 |
| MHC IIa | Developmental Studies Hybridoma Bank, University of Iowa (#A4.74) | Mouse, IgG (monoclonal) | 1:200 | ∼200 |
AB_FXYD1 was diluted in 2% skim milk. All other antibodies were diluted in 3% BSA in Tris‐buffered saline with 0.025% Tween
Immunoblotting
Protein abundance and phosphorylation were determined by western blotting. Approximately 1 μg protein per type I and type II fibre sample were loaded in each well on a 4–15% Criterion TGX stain‐free gel (Bio‐Rad). All samples from each participant were loaded onto the same gel, along with two 4‐point calibration curves consisting of mixed‐fibre human muscle lysate with a known protein concentration (0.25–3.00 μg protein) and two protein ladders (Precision Plus Protein All Blue, #1610373; Bio‐Rad). Proteins were separated by electrophoresis (45 min at 200 V), after which the gels were UV‐activated for 5 min (ChemiDoc; Bio‐Rad) to enable stain‐free quantification of total protein. Proteins were semi‐dried transferred to a 0.45 μm PVDF‐membrane for 45 min at 14 V (Amersham TE 70; GE Healthcare) using transfer buffer (25 mm Tris, 190 mm glycine and 20% methanol). Membranes were blocked for 1 h at room temperature in blocking buffer using gentle rocking. To allow multiple proteins to be quantified on the same membrane, membranes were cut horizontally at the required molecular weights using the two protein ladders as markers before probing with primary antibodies overnight at 4°C with constant, gentle rocking. Antibody details are provided in Table 1. Primary antibodies were diluted in 3% BSA in TBST. After incubation, the membranes were washed in TBST and probed with HRP‐conjugated secondary antibody (goat anti‐mouse or goat‐anti‐rabbit immunoglobulins) for 1 h with rocking at room temperature. Protein bands were visualized using enhanced chemiluminescence (SuperSignal West Femto; Pierce, Rockford, IL, USA) on a ChemiDoc MP imaging system (Bio‐Rad). Quantification of bands was performed in Image Lab, version 5.2.1 (Bio‐Rad). Protein abundance and phosphorylation in each sample was determined by normalizing the density for a given sample to that of the slope of the calibration curve, as well as to the total protein amount in each lane on the stain‐free gel image. To improve reliability, the mean of the duplicate readings of a given protein amount from the two calibration curves on the same membrane was used for the analysis. The linearity (r 2) of calibration curves for total protein and blots was ≥0.98. Furthermore, only first probes were used for analysis. The same blinded researcher was responsible for analysing all western blots included in the study. Based on agreement between two independent researchers, who conducted visual inspections of the blots, fibre pools and points on calibration curves were excluded if their band was unable to be validly quantified as a result of noise on the image caused by artefacts or if they were too faint or were saturated. This resulted in n = 9 for Na+,K+‐ATPase α1, n = 3 for α2, n = 10 for β1, n = 9 for FXYD1 and n = 6 for FXYD1 phosphorylation (FXYD1/AB_FXYD1).
Calculations
The plasma K+ venous–arterial concentration difference (KVA, mm) was calculated by adjusting for changes in the plasma fraction based on haematocrit measurements:
KVA = Kv – Ka × (1 – Hcta)/(1 – Hctv), where Kv is venous plasma K+ concentration, Ka is arterial plasma K+ concentration, Hctv is venous haematocrit and Hcta is arterial haematocrit.
The net release of K+ from the leg (leg K+ release, mmol min−1) was also calculated by adjusting for changes in plasma fraction based on haematocrit measurements:
Net leg K+ release = × [Kv × (1 – Hctv) – Ka × (1 – Hcta)], where is femoral arterial blood flow in L min−1.
Statistical analysis
Data were assessed for normality using graphical model control of histograms. Data that violated normality were log‐transformed prior to subsequent analyses. Paired Student's t tests were used to test for an effect of training (Pre vs. Post) on performance, and to assess differences between legs (CON‐leg vs. BFR‐leg) for the change in performance using the individual changes from Pre to Post. For leg blood flow, blood K+ concentrations, venous–arterial K+ difference and leg net K+ release, a two‐way ANOVA with repeated measures (RM) was used to test for an effect of training in each leg at either exercise intensity in separation using time (Pre/Post) and sample (Rest, 20 s, 1 min, 3 min, etc.) as factors. The same test was used to test for differences in the same variables between legs for the effect of training using the individual changes, with leg and sample as factors. A two‐way RM ANOVA was used to test for an effect of NAC infusion at each intensity before and after training for either leg, using infusion (NAC vs. placebo) and sample as factors. The same test was used to assess differences between legs for the effect of NAC at each intensity before and after training using leg and sample as factors. For protein data, a two‐way RM ANOVA was used to test for effects of training and differences between legs within each fibre type using time and leg as factors, as well as to assess the effect of fibre type in each leg before and after training using fibre type and time as factors. A two‐way RM ANOVA was also used to test for an effect of infusion on concentrations of GSH and GSSG and on the GSH:GSSG‐ratio in each leg before and after training, with infusion and time as factors. The same test was used to test for differences between legs in these variables for infusions before and after training using leg and infusion as factors. In addition, paired Student's t tests were used to assess differences between legs with training in these variables using the individual changes from Pre to Post. Post hoc analyses were conducted using Tukey's test. As a result of supraphysiological K+ values in samples from two individuals caused by late analysis (>5 h) after test termination, n = 8 for venous–arterial K+ difference and leg K+ release. Effect size (d) was interpreted based on Cohen's conventions, where <0.2, 0.2–0.5, >0.5–0.8 and >0.8 were considered as a trivial, small, moderate and large effect, respectively (Cohen, 1988). Data are expressed as the mean ± 95% confidence interval (CI). The α‐level was set at P ≤ 0.05. Statistical analyses were performed in Sigma Plot, version 11.0 (Systat Software Inc., Chicago, IL, USA). Illustrations were created using Prism, version 6 (GraphPad Software Inc., San Diego, CA, USA).
Results
Effect of BFR on femoral arterial blood flow
In CON‐leg, femoral arterial blood flow increased after onset of exercise (20s; P < 0.001; d = 1.8) (Fig. 2), remained higher during exercise (P < 0.001 vs. rest; d ≥ 1.7) and returned to resting level after 40 s of recovery (P = 0.082; d = 1.8), after which it remained unchanged (P ≥ 0.842; d = 0.7–1.6). In BFR‐leg, blood flow increased after 40 s of exercise (P = 0.024 vs. rest; d = 1.7) and remained higher during exercise (P ≤ 0.002; d ≥ 1.8) and throughout the recovery compared to rest (P < 0.001; d ≥ 1.8). Blood flow in BFR‐leg at rest without (0.04 ± 0.07 L min−1; d = 0.0; P = 0.984) or with the cuff inflated (–0.10 ± 0.09 L min−1; d = 0.8; P = 0.336) was not different from blood flow at rest in CON‐leg. Compared to CON‐leg, blood flow in BFR‐leg was on average 52 ± 13% lower during exercise (–1.28 ± 0.68 L min−1; d = 1.6; P < 0.001) and 308 ± 113% higher in recovery (1.89 ± 1.05 L min−1; d = 1.7; P < 0.001).
Figure 2. Acute effects of BFR on thigh blood flow.
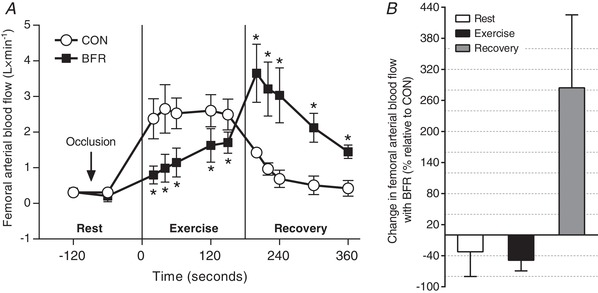
A, femoral arterial blood flow at rest, as well as during exercise and in recovery, without (CON, white symbols) or with (BFR, red symbols) a cuff inflated to ∼178 mmHg around the most proximal part of the leg (n = 5). * P < 0.001, different from CON. B, percentage change in flow induced by BFR compared to CON. Data are expressed as the mean ± 95% CI.
Performance
Knee‐extensor exercise performance (iPPO) increased with the training period by 11 ± 7% in CON‐leg (P = 0.043; d = 0.5) and by 23 ± 9% in BFR‐leg (P < 0.001; d = 0.9), with the increase being 12 ± 6% greater in BFR‐leg compared to CON‐leg (d = 0.9; P = 0.001) (Fig. 3 A). Changes in performance of each leg, represented by the same symbol for each individual, are shown in Fig. 3 B.
Figure 3. Effect of training with BFR on performance during single‐leg exercise.
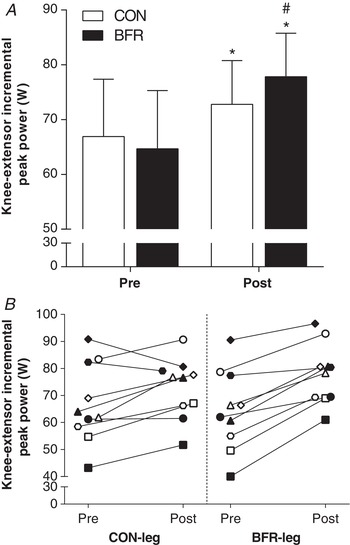
A, knee‐extensor incremental peak aerobic power output (iPPO) for the control (CON; n = 10) and BFR‐trained leg (BFR; n = 10) before (Pre, white bars) and after (Post, black bars) training. B, individual changes in iPPO for CON and BFR, with each symbol representing the same individual. * P < 0.05, different from Pre. # P < 0.05, different from CON for the change from Pre to Post. Data are expressed as the mean ± 95% CI (A) or absolute values (B).
Femoral arterial blood flow
Blood flow at rest, as well as during and in recovery from Ex1, did not change with the training period in CON‐leg (–0.03 ± 0.66 L min−1; d = 0.1; P = 0.637) (Fig. 4 A) but was higher during Ex1 in BFR‐leg after the training period compared to before (20 s, 1 min, 3 min and 8 min: 0.46 ± 0.35 L min−1; d = 0.8; P ≤ 0.003) (Fig. 4 B). The increase with training in blood flow in BFR‐leg was higher than the corresponding change in CON‐leg during Ex1 (20 s, 1 min, 3 min and 8 min: 0.38 ± 0.30 L min−1; d = 0.8; P = 0.011) and 20 s into recovery from Ex1 (0.37 ± 0.27 L min−1; d = 0.9; P = 0.028). After the training period, blood flow was higher in CON‐leg 20 s into recovery from Ex2 (0.80 ± 1.01 L min−1; d = 0.5; P = 0.004) (Fig. 4 C) and in BFR‐leg at 1 min of Ex2 (0.77 ± 0.47 L min−1; d = 1.0; P = 0.013) (Fig. 4 D), compared to before the training period.
Figure 4. Effect of training with BFR on thigh blood flow during exercise.
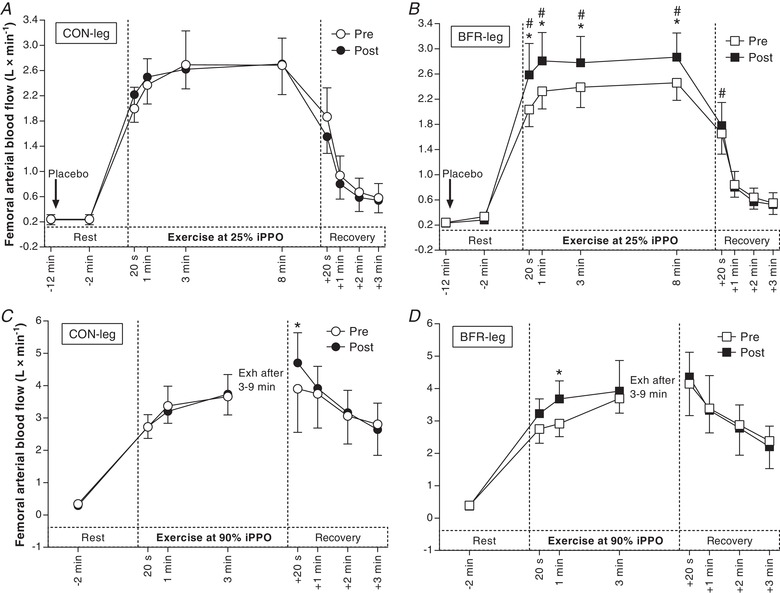
A, blood flow in the leg that trained without BFR (CON‐leg, circles) during exercise at 25% iPPO before (Pre, white symbols) and after (Post, black symbols) training. B, blood flow in the leg that trained with BFR (BFR‐leg, squares) during exercise at the same intensity. C, blood flow in CON‐leg during exercise at 90% iPPO to exhaustion (Exh). D, blood flow in BFR‐leg during exercise at the same intensity (n = 10). The arrow indicates the start of infusion. * P < 0.05, different from Pre. #P < 0.05, greater increase from Pre to Post compared to CON‐leg. Data are expressed as the mean ± 95% CI.
Venous and arterial blood K+ concentrations
Mean femoral arterial and venous K+ concentrations (mm) at rest, as well as during and in recovery from Ex1, before and after the training period in CON‐leg and BFR‐leg are shown in Table 2. The same values for Ex2 are presented in Table 3.
Table 2.
Mean femoral arterial and venous K+ concentration (mm) at rest, as well as during and in recovery, from single‐leg, knee‐extensor exercise at 25% of iPPO before (Pre) and after (Post) 6 weeks of cycling without (CON) or with BFR in men
| Rest | 20 s | 1 min | 3 min | 8 min | +20 s | +1 min | +2 min | +3 min | |
|---|---|---|---|---|---|---|---|---|---|
| CON Pre | |||||||||
| Arterial | 3.9 ± 0.2 | 3.9 ± 0.2 | 4.0 ± 0.2 | 4.2 ± 0.2 | 4.2 ± 0.2 | 4.1 ± 0.2 | 4.1 ± 0.2 | 4.2 ± 0.2 | 4.2 ± 0.2 |
| Venous | 3.8 ± 0.2 | 4.4 ± 0.2 | 4.6 ± 0.2 | 4.5 ± 0.2 | 4.1 ± 0.2 | 3.8 ± 0.2 | 3.8 ± 0.2 | 3.7 ± 0.2 | 3.9 ± 0.2 |
| CON Post | |||||||||
| Arterial | 3.8 ± 0.2 | 3.9 ± 0.2 | 4.1 ± 0.2 | 4.2 ± 0.1 | 4.1 ± 0.1 | 4.0 ± 0.2 | 4.4 ± 0.6 | 4.1 ± 0.2 | 4.0 ± 0.2 |
| Venous | 3.8 ± 0.2 | 4.4 ± 0.2 | 4.4 ± 0.2(*) | 4.2 ± 0.2* | 4.2 ± 0.2 | 3.7 ± 0.2 | 3.6 ± 0.2 | 3.7 ± 0.2 | 3.7 ± 0.2 |
| BFR Pre | |||||||||
| Arterial | 3.8 ± 0.2 | 4.0 ± 0.2 | 4.3 ± 0.2 | 4.3 ± 0.2 | 4.2 ± 0.2 | 4.2 ± 0.2 | 4.3 ± 0.2 | 4.3 ± 0.2 | 4.3 ± 0.4 |
| Venous | 3.9 ± 0.2 | 4.6 ± 0.4 | 4.7 ± 0.4 | 4.6 ± 0.4 | 4.3 ± 0.4 | 4.0 ± 0.2 | 3.9 ± 0.4 | 4.1 ± 0.2 | 4.1 ± 0.2 |
| BFR Post | |||||||||
| Arterial | 3.9 ± 0.2 | 4.0 ± 0.2 | 4.2 ± 0.1 | 4.2 ± 0.2 | 4.2 ± 0.2 | 4.1 ± 0.2 | 4.2 ± 0.1 | 4.1 ± 0.1 | 4.1 ± 0.2 |
| Venous | 3.8 ± 0.2 | 4.4 ± 0.2 | 4.5 ± 0.2(*) | 4.3 ± 0.2* | 4.2 ± 0.2 | 3.8 ± 0.2 | 3.7 ± 0.2 | 3.8 ± 0.2* | 3.9 ± 0.2*,# |
Data are the mean ± 95% CI; n = 8. * P < 0.05, different from Pre. (*)P < 0.1, tendency to be different from Pre. #P < 0.05, difference between CON and BFR in change from Pre to Post. (#)P < 0.1, tendency for a difference between CON and BFR for the change from Pre to Post. Two two‐way RM ANOVAs were performed with sample and time (using raw values), or condition and time (using delta‐sample data, i.e. Post–Pre) as factors.
Table 3.
Mean femoral arterial and venous K+ concentration (mm) at rest, as well as during and in recovery, from single‐leg, knee‐extensor exercise at 90% of iPPO before (Pre) and after (Post) 6 weeks of cycling without (CON) or with BFR in men
| Rest | 20 s | 1 min | 3 min | +20 s | +1 min | +2 min | +3 min | |
|---|---|---|---|---|---|---|---|---|
| CON Pre | ||||||||
| Arterial | 3.9 ± 0.2 | 4.2 ± 0.2 | 4.5 ± 0.2 | 5.2 ± 0.4 | 4.9 ± 0.4 | 4.3 ± 0.2 | 4.0 ± 0.1 | 3.9 ± 0.1 |
| Venous | 3.8 ± 0.2 | 4.8 ± 0.2 | 5.2 ± 0.4 | 5.8 ± 0.4 | 4.4 ± 0.4 | 3.9 ± 0.2 | 3.6 ± 0.2 | 3.6 ± 0.2 |
| CON Post | ||||||||
| Arterial | 3.8 ± 0.2 | 4.1 ± 0.2 | 4.4 ± 0.2 | 4.9 ± 0.4* | 4.7 ± 0.2 | 4.2 ± 0.2 | 4.0 ± 0.2 | 3.9 ± 0.2 |
| Venous | 3.7 ± 0.2 | 4.7 ± 0.2 | 5.1 ± 0.2 | 5.4 ± 0.4*** | 4.3 ± 0.2 | 3.8 ± 0.2 | 3.7 ± 0.2 | 3.6 ± 0.2 |
| BFR Pre | ||||||||
| Arterial | 4.1 ± 0.4 | 4.3 ± 0.4 | 4.8 ± 0.4 | 5.2 ± 0.4 | 5.1 ± 0.2 | 4.6 ± 0.4 | 4.5 ± 0.4 | 4.2 ± 0.4 |
| Venous | 3.9 ± 0.4 | 5.1 ± 0.4 | 5.5 ± 0.4 | 5.9 ± 0.4 | 4.8 ± 0.2 | 4.4 ± 0.4 | 4.2 ± 0.4 | 4.1 ± 0.6 |
| BFR Post | ||||||||
| Arterial | 3.9 ± 0.2 | 4.1 ± 0.2 | 4.5 ± 0.2(*) | 4.8 ± 0.4* | 4.6 ± 0.2**,(#) | 4.3 ± 0.2* | 4.0 ± 0.2*,(#) | 4.0 ± 0.2 |
| Venous | 3.7 ± 0.2 | 4.7 ± 0.2(*) | 5.1 ± 0.2* | 5.1 ± 0.4***,# | 4.2 ± 0.2***,## | 3.8 ± 0.2**,## | 3.7 ± 0.2**,## | 3.7 ± 0.2*,(#) |
Data are the mean ± 95% CI; n = 8. * P < 0.05, ** P < 0.01, *** P < 0.001, different from Pre. (*)P < 0.1, tendency to be different from Pre. #P < 0.05, ##P < 0.01, difference between CON and BFR for change from Pre to Post. (#)P < 0.1, tendency to be different between CON and BFR for change from Pre to Post. Two two‐way RM ANOVAs were performed with sample and time (using raw values), or condition and time (using delta‐sample data, i.e. Post‐Pre) as factors.
Venous–arterial K+ difference (KVA)
KVA did not change with the training period in CON‐leg either during Ex1 (–0.08 ± 0.27 mm; d = 0.2; P = 0.885) (Fig. 5 A) or Ex2 (–0.01 ± 0.45 mm; d = 0.0; P = 0.965) (Fig. 5 C). By contrast, KVA was lower in BFR‐leg after the training period, both during Ex1 (20s: –0.23 ± 0.24 mm, d = 0.6, P = 0.037; 3 min: –0.20 ± 0.20 mm, d = 0.6, P = 0.065) (Fig. 5 B) and Ex2 (1 min: –0.28 ± 0.21 mm, d = 0.9; P = 0.050; 3 min: –0.65 ± 0.40 mm, d = 1.0; P < 0.001) and in recovery from Ex2 (–0.41 ± 0.25 mm, d = 1.0; P ≤ 0.029) (Fig. 5 D). The decline in KVA with training in BFR‐leg at 3 min of Ex2 (–0.41 ± 0.36 mm, d = 0.7; P = 0.014) and 3 min after Ex2 (–0.87 ± 0.71 mm, d = 0.8; P < 0.001) was larger than the corresponding change in CON‐leg during the training period (Fig. 5 D).
Figure 5. Effect of training with BFR on venous–arterial (v–a) K+ difference during exercise.
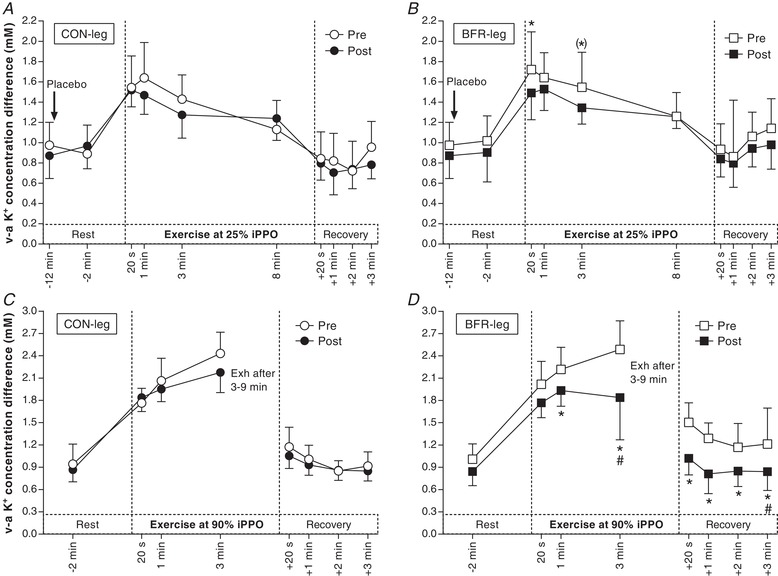
A, v–a K+ difference in the leg that trained without BFR (CON‐leg, circles) during exercise at 25% iPPO before (Pre, white symbols) and after (Post, black symbols) training. B, v–a K+ difference in the leg that trained with BFR (BFR‐leg, squares) during exercise at the same intensity. C, v–a K+ difference in CON‐leg during exercise at 90% iPPO to exhaustion (Exh). D, v–a K+ difference in BFR‐leg during exercise at the same intensity (n = 8). The arrow indicates the start of the infusion. * P < 0.05, different from Pre. (*)P = 0.065, different from Pre. #P < 0.05, greater decrease from Pre to Post compared to CON‐leg. Data are expressed as the mean ± 95% CI.
Thigh K+ release
In Ex1, net K+ release did not change with the training period in either leg (CON‐leg: –0.03 ± 0.21 mmol min−1, d = 0.1; BFR‐leg: –0.15 ± 0.23 mmol min−1, d = 0.4; P ≥ 0.597) (Fig. 6), with no differences between legs (0.20 ± 0.25 mmol min−1; d ≤ 0.5; P ≥ 0.933). In Ex2, net K+ release did not change with the training period in CON‐leg (0.02 ± 0.56 mmol min−1; d = 0.1; P = 0.589) but was reduced at 3 min in BFR‐leg after compared to before the training period (–0.84 ± 0.62 mmol min−1; d = 0.8; P = 0.007), with the decrease being larger than in CON‐leg (–1.00 ± 0.75 mmol min−1; d = 0.8; P = 0.012).
Figure 6. Effect of training with BFR on thigh net K+ release during exercise.
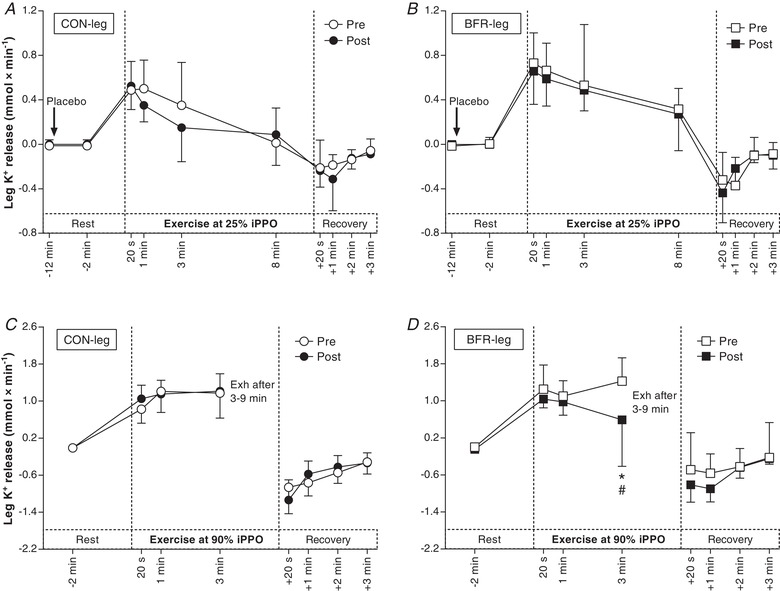
A, K+ release from the leg that trained without BFR (CON‐leg, circles) during exercise at 25% iPPO before (Pre, white symbols) and after (Post, black symbols) training. B, K+ release from the leg that trained with BFR (BFR‐leg, squares) during exercise at the same intensity. C, K+ release from the CON‐leg during exercise at 90% iPPO to exhaustion (Exh). D, K+ release from BFR‐leg during exercise at the same intensity (n = 8). The arrow indicates the start of the infusion of saline. * P < 0.05, different from Pre. # P < 0.05, greater decrease from Pre to Post compared to CON‐leg. Data are expressed as the mean ± 95% CI.
Effects of NAC infusion on femoral arterial blood flow during exercise at 25% iPPO
Before the training period, NAC decreased blood flow in CON‐leg compared to placebo/saline (PLA) in recovery from Ex1 (+20 s: –0.43 ± 0.37 L min−1, d = 0.7; P < 0.001; +1 min: –0.28 ± 0.25 L min−1; d = 0.7; P = 0.008). In BFR‐leg, NAC increased blood flow compared to PLA during Ex1 (20 s: 0.35 ± 0.42 L min−1; d = 0.5; P = 0.010; 3 min: 0.28 ± 0.35 L min−1; d = 0.5; P = 0.032; 8 min: 0.37 ± 0.36 L min−1; d = 0.6; P = 0.006) (Fig. 7 B). Before the training period, the effect of NAC was not different between legs during Ex1 (0.18 ± 0.26 L min−1; d = 0.4; P = 0.077).
Figure 7. Effect of anti‐oxidant infusion on thigh blood flow, venous–arterial (v–a) K+ difference and net K+ release during exercise at 25% iPPO before and after training with BFR.
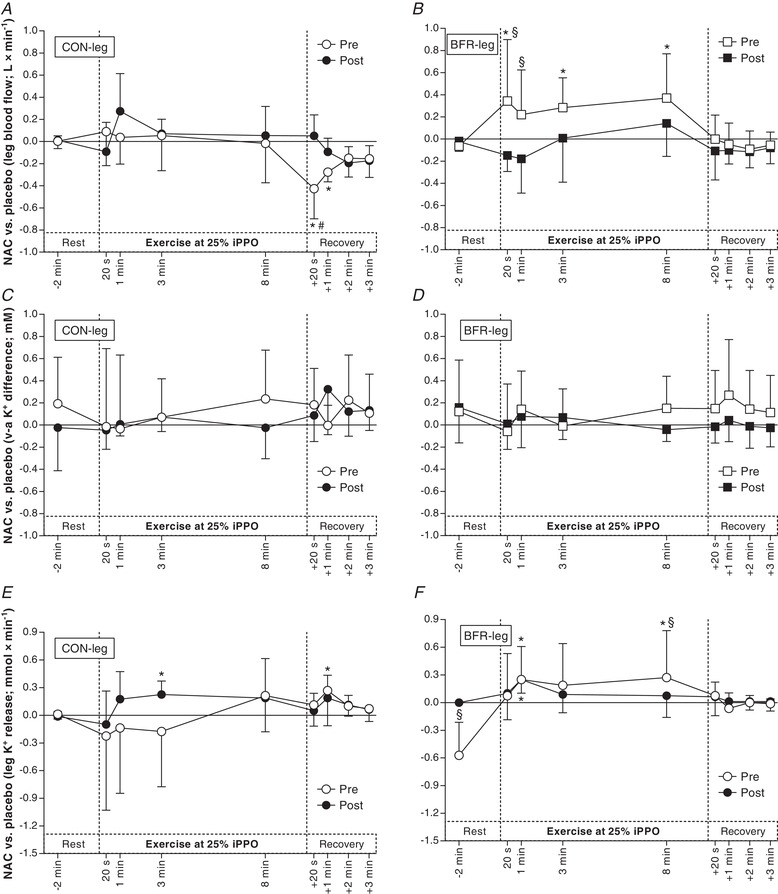
Difference between NAC and saline (placebo) infusion in femoral arterial blood flow (A + B; n = 10), v–a K+ difference (C + D; n = 8) and thigh K+ release (E + F; n = 8) before (Pre, white) and after (Post, black) cycling without (CON‐leg, circles) or with BFR (BFR‐leg, squares). * P < 0.05, different from placebo. # P < 0.05, different from CON‐leg. § P < 0.05, different from Pre. Data are expressed as the mean ± 95% CI.
After the training period, NAC did not change blood flow in CON‐leg compared to PLA during Ex1 (0.08 ± 0.35 L min−1, d = 0.1; P = 0.856) (Fig. 7 A). In CON‐leg, the effect of NAC on blood flow after 20 s of recovery from Ex1 was lower after compared to before the training period (0.48 ± 0.28 L min−1; d = 1.2; P < 0.001) (Fig. 7 A). In BFR‐leg, NAC did not change blood flow during Ex1 compared to PLA after the training period (–0.35 ± 0.33 L min−1, d = 0.7; P = 0.282) (Fig. 7 B). In BFR‐leg, the effect of NAC on blood flow was higher before compared to after the training period after 20 s (0.49 ± 0.38 L min−1; d = 0.8; P = 0.005) and 1 min of Ex1 (0.49 ± 0.38 L min−1; d = 0.8; P = 0.020) (Fig. 7 B). After the training period, the effect of NAC on blood flow was not different between the legs during Ex1 (–0.06 ± 0.19 L min−1; d = 0.2; P = 0.779).
Effects of NAC infusion on femoral arterial blood flow during exercise at 90% iPPO
Before the training period, NAC did not change blood flow in CON‐leg during Ex2 compared to PLA (0.07 ± 1.00 L·min−1; d = 0.0; P = 0.408) (Fig. 8 A). In BFR‐leg, NAC increased blood flow compared to PLA after 20 s (0.48 ± 0.52 L·min−1; d = 0.6; P = 0.001) and 1 min of Ex2 (0.77 ± 0.48 L min−1; d = 1.0; P = 0.001) and after 20 s (0.50 ± 0.88 L·min−1; d = 0.4; P = 0.028) and 1 min of recovery from Ex2 (0.57 ± 0.84 L min−1; d = 0.4; P = 0.012) (Fig. 8 B). Before the training period, the effect of NAC on blood flow was greater in BFR‐leg than in CON‐leg at 1 min of Ex2 (0.82 ± 0.47 L·min−1; d = 1.1; P = 0.022) and after 1 min of recovery from Ex2 (0.42 ± 0.51 L min−1; d = 0.5; P = 0.011) (Fig. 8 B).
Figure 8. Effect of anti‐oxidant infusion on thigh blood flow, venous–arterial (v–a) K+ difference and net K+ release during exercise at 90% iPPO to exhaustion (Exh) before and after training with BFR.
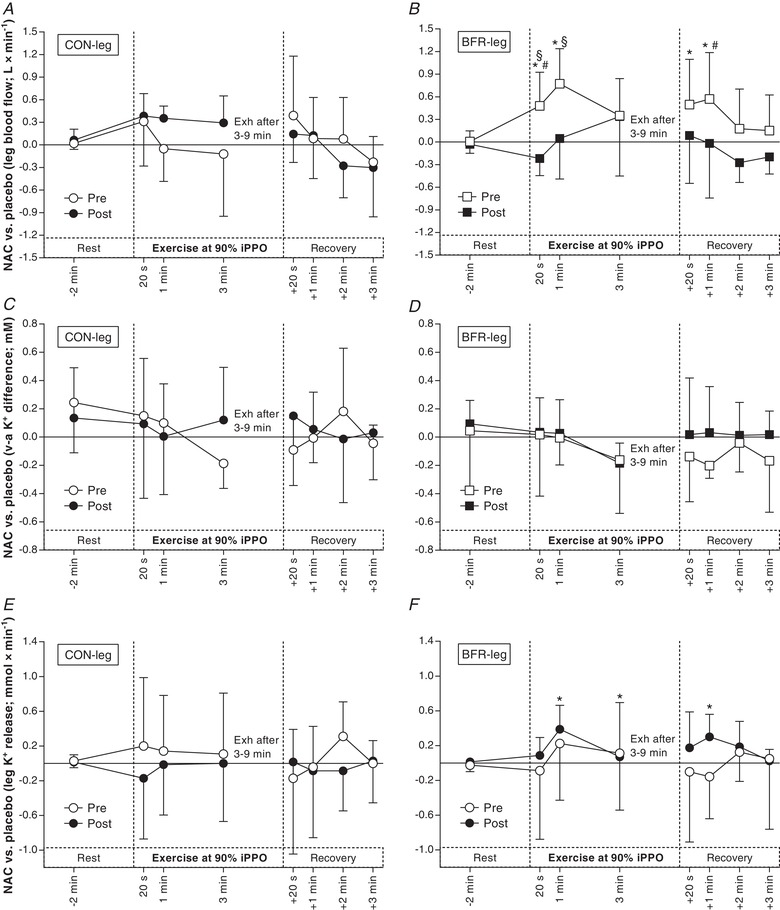
Difference between NAC and saline (placebo) infusion in femoral arterial blood flow (A + B; n = 10), v–a K+ difference (C + D; n = 8) and K+ release (E + F; n = 8) before (Pre, white) and after (Post, black) cycling without (CON‐leg, circles) or with BFR (BFR‐leg, squares). * P < 0.05, different from placebo. # P < 0.05, different from CON‐leg. § P < 0.05, different from Pre. Data are expressed as the mean ± 95% CI.
After the training period, NAC did not affect blood flow in CON‐leg during Ex2 compared to PLA (0.34 ± 0.49 L·min−1; d = 0.4; P = 0.558). In CON‐leg, the effect of NAC on blood flow in Ex2 was not different after compared to before the training period (0.26 ± 0.31 L min−1; d = 0.5; P = 0.428). After the training period, NAC did not change blood flow in BFR‐leg during Ex2 compared to PLA (0.06 ± 0.54 L min−1; d = 0.1; P = 0.743) (Fig. 8 B). In BFR‐leg, the effect of NAC on blood flow was lower after compared to before the training period after 20 s (–0.70 ± 0.37 L min−1; d = 1.2; P = 0.036) and 1 min of Ex2 (0.73 ± 0.48 L min−1; d = 0.9; P = 0.030). After the training period, the effect of NAC on blood flow during Ex2 was not different between legs (–0.11 ± 0.39 L min−1; d = 0.2; P = 0.595).
Effects of NAC infusion on venous–arterial K+ difference, KVA
Before the training period, NAC did not change KVA in CON‐leg compared to PLA during either Ex1 (0.17 ± 0.36 mm; d = 0.3; P = 0.334) (Fig. 7 C) or Ex2 (–0.37 ± 0.73 mm; d = 0.3; P = 0.627) (Fig. 8 C). Similarly, NAC did not affect KVA in BFR‐leg during either Ex1 (0.12 ± 0.29 mm; d = 0.3; P = 0.628) (Fig. 7 D) or Ex2 (–0.15 ± 0.47 mm; d = 0.2; P = 0.732) (Fig. 8 D). Before the training period, the effect of NAC on KVA was not different between legs during either Ex1 (–0.08 ± 0.38 mm; d = 0.1; P = 0.190) or Ex2 (0.19 ± 0.75 mm; d = 0.2; P = 0.680).
After the training period, NAC did not affect KVA in CON‐leg compared to PLA during either Ex1 (0.00 ± 0.17 mm; d = 0.0; P = 0.355) (Fig. 7 C) or Ex2 (–0.13 ± 0.27 mm; d = 0.3; P = 0.343) (Fig. 8 C). The effect of NAC on KVA in CON‐leg was not different after compared to before the training period during either Ex1 (–0.06 ± 0.30 mm; d = 0.1; P = 0.387) or Ex2 (0.12 ± 0.85 mm; d = 0.1; P = 0.659). Similarly, after the training period, NAC did not change KVA in BFR‐leg during either Ex1 (0.03 ± 0.15 mm; d = 0.1; P = 0.207) (Fig. 7 D) or Ex2 (0.06 ± 0.22 mm; d = 0.2; P = 0.252) (Fig. 8 D). The effect of NAC on KVA in BFR‐leg was not different after compared to before the training period in Ex1 (–0.03 ± 0.21 mm; d = 0.1; P = 0.824) and Ex2 (0.01 ± 0.21 mm; d = 0.1; P = 0.194). After the training period, the effect of NAC was not different between legs during either Ex1 (–0.03 ± 0.16 mm; d = 0.1; P = 0.348) or Ex2 (0.10 ± 0.31 mm; d = 0.2; P = 0.233).
Effects of NAC infusion on thigh K+ release
Before the training period, NAC did not affect net K+ release in CON‐leg compared to PLA infusion in either Ex1 (0.02 ± 0.25 mmol min−1; d = 0.1; P = 0.815) (Fig. 7 E) or Ex2 (0.09 ± 0.58 mmol min−1; d = 0.1; P = 0.440) (Fig. 8 E). In BFR‐leg, NAC increased net K+ release compared to PLA after 1 min (0.26 ± 0.27 mmol min−1; d = 0.6; P = 0.036) and 8 min of Ex1 (0.32 ± 0.24 mmol min−1; d = 0.8; P = 0.001) (Fig. 7 F). In the same leg, NAC did not affect net K+ release compared to PLA in Ex2 (0.05 ± 0.60 mmol min−1; d = 0.1; P = 0.830) (Fig. 8 F). Before the training period, the effect of NAC on net K+ release was not different between legs in either Ex1 (–0.01 ± 0.31 mmol min−1; d = 0.0; P = 0.966) or Ex2 (–0.03 ± 0.40 mmol min−1; d = 0.0; P = 0.820).
After the training period, NAC increased net K+ release in CON‐leg compared to PLA after 3 min of Ex1 (0.17 ± 0.27 mmol min−1; d = 0.4; P = 0.009) and after 1 min of recovery from Ex1 (0.28 ± 0.21 mmol min−1; d = 0.8; P = 0.050) (Fig. 7 E) but NAC did not affect K+ release in Ex2 in the same leg (0.09 ± 0.58 mmol min−1; d = 0.1; P = 0.709) (Fig. 8 E). In CON‐leg, the effect of NAC on net K+ release was not different after compared to before the training period in either Ex1 (0.20 ± 0.37 mmol min−1; d = 0.3; P = 0.406) or Ex2 (–0.37 ± 0.52 mmol min−1; d = 0.4; P = 0.438). After the training period, NAC increased net K+ release in BFR‐leg compared to PLA after 1 min of Ex1 (0.26 ± 0.15 mmol min−1; d = 1.0; P < 0.001) (Fig. 7 F) and after 1 min (0.26 ± 0.15 mmol min−1; d = 1.0; P = 0.011) and 3 min of Ex2 (0.09 ± 0.11 mmol min−1; d = 0.5; P = 0.020), as well as after 1 min of recovery from Ex2 (0.31 ± 0.22 mmol min−1; d = 0.9; P = 0.040) (Fig. 8 F). In BFR‐leg, the effect of NAC on net K+ release was lower at rest after the infusion (–0.67 ± 0.28 mmol min−1; d = 1.5, P < 0.001) but higher after 8 min of Ex1 (0.20 ± 0.27 mmol min−1; d = 0.5, P = 0.009) (Fig. 7 F) after compared to before the training period. In Ex2, the effect of NAC was not different after compared to before the training period in BFR‐leg (0.19 ± 0.45 mmol min−1; d = 0.3; P = 0.474) (Fig. 8 F). After the training period, the effect of NAC on net K+ release was not different between legs either during Ex1 (–0.02 ± 0.16 mmol min−1; d = 0.1; P = 0.677) or Ex2 (0.29 ± 0.39 mmol min−1; d = 0.5; P = 0.237), despite a mean difference between legs during Ex2 of 0.56 ± 0.51 mmol min−1 (d = 0.7 for 20 s, 1 min and 3 min combined).
Effect of training on muscle glutathione
Training did not affect GSH concentration in either CON‐leg (–17329 ± 33106 μmol mg protein−1; d = 0.3; P = 0.104) or BFR‐leg (29580 ± 38669 μmol mg protein−1; d = 0.5; P = 0.260), with no differences between legs for the change with training (46909 ± 35794 μmol mg protein−1; d = 0.9; P = 0.077). Similarly, training did not affect GSSG concentration in either CON‐leg (–6883 ± 8400 μmol mg protein−1; d = 0.6; P = 0.124) or BFR‐leg (–2118 ± 7508 μmol mg protein−1; d = 0.2; P = 0.763), with no differences between legs (4765 ± 7246 μmol mg protein−1; d = 0.4; P = 0.379). Similarly, training did not affect GSH:GSSG ratio in either CON‐leg (–0.1 ± 1.7‐fold; d = 0.4; P = 0.353) or BFR‐leg (0.2 ± 1.5‐fold; d = 0.1; P = 0.568), with no differences between legs (1.2 ± 1.5‐fold; d = 0.5; P = 0.209). However, the GSH:GSSG ratio was higher in BFR‐leg compared to CON‐leg after the training period (1.8 ± 2.0‐fold; d = 0.6; P = 0.025) but not before (0.6 ± 1.1‐fold; d = 0.4; P = 0.769).
Effect of NAC infusion on muscle glutathione
In CON‐leg, NAC did not affect GSH concentration compared to PLA (P = 0.501) either before (9184 ± 33467 μmol mg protein−1; d = 0.2) or after the training period (–3959 ± 31342 μmol mg protein−1; d = 0.1). By contrast, in BFR‐leg, NAC increased GSH concentration compared to PLA after (20914 ± 38669 μmol mg protein−1; d = 0.3; P = 0.050) but not before the training period (5861 ± 37373 μmol mg protein−1; d = 0.1; P = 0.780). GSH concentration was higher with NAC in BFR‐leg compared to CON‐leg after the training period (24872 ± μmol mg protein−1; d = 0.3; P = 0.025) but not before (–3323 ± 30637 μmol mg protein−1; d = 0.1; P = 0.538). The effect of NAC was not different after compared to before the training period in either CON‐leg (–13142 ± 41921 μmol mg protein−1; d = 0.2; P = 0.104) or BFR‐leg (15053 ± 50292 μmol mg protein−1; d = 0.2; P = 0.260).
In CON‐leg, NAC did not affect GSSG concentration compared to PLA (P = 0.091) either before (5185 ± 9317 μmol mg protein−1; d = 0.4) or after the training period (5933 ± 9317 μmol mg protein−1; d = 0.6). Similarly, in BFR‐leg, NAC did not affect GSSG concentration compared to PLA (P = 0.214) either before (–1911 ± 8420 μmol mg protein−1; d = 0.2) or after the training period (4637 ± 8420 μmol mg protein−1; d = 0.3). GSSG concentration was not different with NAC in BFR‐leg compared to CON‐leg either before (–6640 ± 7929 μmol mg protein−1; d = 0.6; P = 0.678) or after the training period (–1296 ± 9341 μmol mg protein−1; d = 0.1; P = 0.204). The effect of NAC on GSSG concentration was not different after compared to before the training period in either CON‐leg (1205 ± 8533 μmol mg protein−1; d = 0.1; P = 0.124) or BFR‐leg (6548 ± 8224 μmol mg protein−1; d = 0.5; P = 0.763).
In CON‐leg, NAC increased GSH:GSSG ratio after (0.9 ± 1.7‐fold; d = 0.4; P = 0.039) but not before the training period (0.9 ± 1.3‐fold; d = 0.5; P = 0.099). In BFR‐leg, NAC increased GSH:GSSG ratio (main effect of infusion: 1.0 ± 1.5‐fold; d = 0.5; P = 0.024), although post hoc analyses revealed no effect of NAC either before (1.0 ± 1.3‐fold; d = 0.5; P = 0.261) or after the training period (1.1 ± 1.8‐fold; d = 0.4; P = 0.268). The GSH:GSSG ratio was not different with NAC in BFR‐leg compared to CON‐leg either before (0.1 ± 1.7‐fold; d = 0.0; P = 0.769) or after the training period (0.2 ± 2.2‐fold; d = 0.1; P = 0.342). The effect of NAC was not different after compared to before the training period in either CON‐leg (0.0 ± 2.0‐fold; d = 0.0; P = 0.387) or BFR‐leg (0.1 ± 1.4‐fold; d = 0.1; P = 0.649).
Na+,K+‐ATPase α‐isoform abundance in type I and II muscle fibres
Representative blots for all proteins are shown in Fig. 10 K.
Figure 10. Effect of training with BFR on Na+,K+‐ATPase‐isoform abundance in type I and II muscle fibres of men.
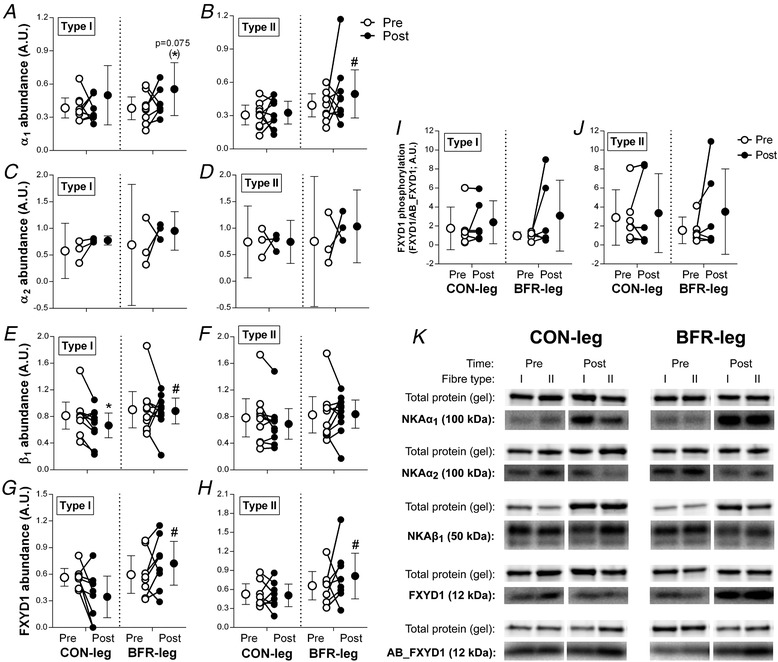
α1 (A + B; n = 9), α2 (C + D; n = 3), β1 (E + F; n = 10) and FXYD1 abundance (G + H; n = 9) and FXYD1 phosphorylation (FXYD1/AB_FXYD1; I + J; n = 6) was determined in type I and II muscle fibres from a leg cycling without (CON‐leg) or with BFR for 6 weeks both before (Pre, white bars) and after (Post, black bars) training. * P ≤ 0.05, different from Pre. # P ≤ 0.05, different from CON‐leg at Post. Data are expressed as the mean ± 95% CI. Individual changes with training are also indicated. Representative western blots for measured proteins are shown in (K). Total protein was determined as total protein content in each lane on the stain‐free gel image, represented here as the actin band.
In CON‐leg, α1 abundance did not change with training in either type I (30 ± 17%, d = 0.5; P = 0.387) (Fig. 10 A) or type II fibres (7 ± 8%, d = 0.2; P = 0.508) (Fig. 10 B). Similarly, in BFR‐leg, α1 abundance did not change in either type I (46 ± 16%, d = 0.7; P = 0.075) (Fig. 10 A) or type II fibres (26 ± 14%, d = 0.5; P = 0.508) (Fig. 10 B). In type I fibres, no difference was detected between legs for α1 abundance either before (1 ± 8%) or after (11 ± 21%) the training period (d ≤ 0.2; P = 0.662). In type II fibres, α1 abundance was higher in BFR‐leg compared to CON‐leg after the training period (51 ± 15%, d = 0.7; P = 0.002). An effect of fibre type was evident for α1 abundance in CON‐leg, with a higher abundance in type I than in type II fibres (29 ± 14%, d = 0.7; P = 0.047), whereas no effect of fibre type was observed in BFR‐leg (5 ± 15%, d = 0.2; P = 0.505).
In CON‐leg, α2 abundance did not change with training in either type I (35 ± 20%, d = 1.2; P = 0.411) (Fig. 10 C) or type II fibres (1 ± 23%, d = 0.02; P = 0.690) (Fig. 10 D). Similarly, in BFR‐leg, α2 abundance did not change in either type I (38 ± 38%, d = 0.8; P = 0.411) (Fig. 10 C) or type II fibres (38 ± 44%, d = 0.7; P = 0.690) (Fig. 10 D). No difference was evident between legs for α2 abundance in either type I (Pre: 21 ± 37%, d = 0.4; Post: 24 ± 16%, d = 1.3; P ≥ 0.301) or type II fibres (Pre: 2 ± 40%, d = 0.0; Post: 39 ± 29%, d = 1.2; P = 0.137). In addition, no effect of fibre type for α2 abundance was detected in either leg (CON‐leg: 10 ± 21, d = 0.3; BFR‐leg: 8 ± 39, d = 0.2; P ≥ 0.370).
Na+,K+‐ATPase β1 and FXYD1 abundance in type I and II muscle fibres
In CON‐leg, β1 abundance decreased with training in type I (–18 ± 17%, d = 0.5; P = 0.022) (Fig. 10 E) but did not change in type II fibres (–12 ± 22%, d = 0.3; P = 0.542) (Fig. 10 F). In BFR‐leg, β1 abundance did not change in either type I (–2 ± 20%, d = 0.1; P = 0.827) (Fig. 10 E) or type II fibres (1 ± 21%, d = 0.03; P = 0.542) (Fig. 10 F). After the training period, β1 abundance in type I fibres was higher in BFR‐leg than in CON‐leg (33 ± 17%, d = 0.8; P = 0.019), whereas no difference between legs was detected in type II fibres (21 ± 19%, d = 0.5; P = 0.084). No effect of fibre type was evident for β1 abundance in either leg (CON‐leg: 0 ± 20, d = 0.0; BFR‐leg: –7 ± 20 vs. type I, d = 0.2; P ≥ 0.359).
In CON‐leg, FXYD1 abundance did not change with training in type I (–18 ± 12%, d = 0.6; P = 0.603) (Fig. 10 G) or type II fibres (–4 ± 14%, d = 0.1; P = 0.603) (Fig. 10 H). Similarly, in BFR‐leg, FXYD1 abundance did not change with training in either type I (21 ± 19%, d = 0.5; P = 0.603) (Fig. 10 G) or type II fibres (24 ± 25%, d = 0.4; P = 0.761) (Fig. 10 H). After the training period, FXYD1 abundance was higher in BFR‐leg than in CON‐leg in both type I (56 ± 20%, d = 0.9; P = 0.025) and type II fibres (60 ± 25%, d = 0.8; P = 0.035). An effect of fibre type was evident in BFR‐leg, with FXYD1 abundance being higher in type II compared to type I fibres (12 ± 22%, d = 0.3; P = 0.017) but no effect of fibre type was observed in CON‐leg (–1 ± 13% vs. type I, d = 0.0; P = 0.233).
FXYD1 phosphorylation in type I and II muscle fibres
In CON‐leg, FXYD1 phosphorylation, as expressed relative to total FXYD1 abundance (FXYD1/AB_FXYD1), did not change with training in either type I (63 ± 182%, d = 0.5; P = 0.166) (Fig. 10 I) or type II fibres (27 ± 272%, d = 0.2; P = 0.402) (Fig. 10 J). Similarly, in BFR‐leg, FXYD1 phosphorylation did not change with training in either type I (217 ± 212%, d = 0.8; P = 0.166) (Fig. 10 I) or type II fibres (127 ± 255%, d = 0.6; P = 0.402) (Fig. 10 J), despite the large mean increases and effect sizes. No difference between legs was detected for FXYD1 phosphorylation in either type I (Pre: 45 ± 122%, d = 0.5; Post: –8 ± 245%, d = 0.1; P = 0.586) or type II fibres (Pre: 45 ± 175%, d = 0.6; Post: 4 ± 327%, d = 0.0; P = 0.502). An effect of fibre type for FXYD1 phosphorylation was observed in BFR‐leg, with a higher abundance in type II than in type I fibres (25 ± 230%, d = 0.2; P = 0.017), whereas no effect of fibre type was evident in CON‐leg (47 ± 231%, d = 0.3; P = 0.250).
Discussion
The novel findings of the present study were that 6 weeks of interval cycling with reduced blood flow to exercising muscles elicited greater improvements in single‐leg exercise performance compared to training without BFR. Furthermore, training with BFR did, in contrast to control, reduce thigh K+ release during near‐maximal exercise. Before training, anti‐oxidant infusion did not affect thigh K+ release during intense (90% iPPO) exercise, whereas, after training, the addition of anti‐oxidant increased net K+ release at this intensity. In the BFR‐trained leg, the concentration of reduced glutathione (GSH) in the muscle was higher during anti‐oxidant infusion at rest compared to placebo. In addition, BFR‐training elevated the ratio of reduced to oxidized glutathione (GSH:GSSG) in the muscle, as well as the abundance of some Na+,K+‐ATPase isoforms in type I (β1: 33%, FXYD1: 108%) and type II (α1: 51%, FXYD1: 60%) muscle fibres, compared to control.
Improvements in performance and thigh K+ regulation by training with BFR
Despite performing the same amount of work, the leg that trained with BFR improved exercise performance substantially more (12%) than the leg training without BFR. Thus, interval cycling with BFR incorporating rest periods with no circulatory restriction is an effective strategy for augmenting training‐induced improvements in exercise tolerance. Similar enhancing effects of BFR have been observed in studies that used other occlusion training modalities. By use of local supra‐atmospheric pressure (+50 mmHg) to reduce (∼16%) blood flow to exercising muscles, Sundberg et al. (1993) found an 11% greater increase in time to exhaustion during single‐leg exercise for a leg training with compared to a leg training without reduced blood flow (25% vs. 14%; 45 min session–1, 4 days week–1 for 4 weeks). In agreement, 15 min of bilateral cycling (40% ) with BFR induced by inflation of a cuff around the legs (pressure: 160–220 mmHg; 3 days week–1 for 8 weeks) increased cycling time to exhaustion by 15%, whereas no performance change was detected in a control group training without BFR, despite this group having a greater (66%) training volume (Abe et al. 2010).
A greater performance of the BFR‐trained leg was associated with a reduced net rate of K+ release from exercising muscles during intense exercise. The lower rate of thigh K+ release may be explained by training‐induced adaptations in the abundance of Na+,K+‐ATPase β1 and FXYD1 in type I and α1 and FXYD1 in type II muscle fibres, which may increase the potential for the assembly of a greater number of Na+,K+‐ATPase units in the sarcolemma and T‐tubuli during exercise, thereby increasing the capacity for K+ re‐uptake (Clausen, 2003). Another adaptation that may have contributed to the reduced net release of K+ from the muscles in the BFR‐trained leg is the faster rise in blood flow to the exercising muscles in the initial phase (1 min) of exercise. This is supported by findings showing that microvascular permeability for K+ is positively related to blood flow (Friedman & DeRose, 1982; Kajimura et al. 1998). Thus, higher flow would lead to faster and/or greater removal of K+ from the interstitial space, thereby facilitating re‐establishment of the transmembrane K+ gradient. Studies have shown that BFR‐training increases muscle capillary density and tissue perfusion (Sundberg, 1994; Kacin & Strazar, 2011) and induces angiogenic factors (Larkin et al. 2012). Accordingly, a greater surface area for diffusion of K+ from the muscle interstitium to the blood stream may be expected after BFR‐training. This is supported by the substantial increase (>3‐fold) in femoral arterial blood flow after cuff deflation (Fig. 2) and resultant high shear stress. However, we observed lower rates of venous and arterial blood K+ accumulation in the BFR‐trained leg (Tables 2 and 3), indicating that K+ re‐uptake was a significant contributor to the attenuated net K+ release from exercising muscles after BFR‐training. In this regard, it should be considered that our intermittent BFR‐training protocol probably caused drastic perturbations in fluid dynamics across muscle intracellular, interstitial and blood compartments, resulting from changes in transmural pressures (Kacin et al. 2015). As such, adaptations in capillary filtration and lymph flow dynamics after BFR‐training (Havas et al. 1997) may have influenced interstitial K+ concentrations and thereby the release of K+ from the exercising musculature.
Role of anti‐oxidant with respect to regulating muscle K+ homeostasis in humans and effects of BFR‐training
Before training, i.v. infusion of the anti‐oxidant NAC increased net K+ release during moderate‐intensity exercise only from the BFR‐leg. Because the release of K+ is calculated as the product of blood flow and venous–arterial K+ difference, this effect may be explained by the higher blood flow with NAC than with placebo compared to the control leg (Fig. 7). After training, NAC raised net K+ release from both legs at this exercise intensity (after 1 min in BFR‐leg and 3 min in CON‐leg). This was associated with a stimulating effect of NAC on muscle anti‐oxidant status, as indicated by an increase in GSH:GSSG ratio in CON‐leg and GSH concentration in BFR‐leg (Fig. 9). Because movement of K+ between the muscle interstitial space and the bloodstream follows the principle of simple diffusion (i.e. down the electrochemical gradient), and because thigh blood flow was unaffected by NAC at this time point in both legs, the increase in thigh net K+ release points to a higher interstitial K+ accumulation by NAC infusion. This observation contrasts with previous findings of decreased systemic (arterialized venous) K+ concentrations during prolonged, moderate‐intensity cycling in response to NAC (Medved et al. 2004; McKenna et al. 2006). Thus, the effect of NAC on K+ homeostasis during moderate‐intensity exercise in relatively untrained humans may vary with exercise type (knee‐extension vs. cycling) and duration (8 vs. 45 min). However, in the present study, the mean difference between legs for the effect of NAC was small and the responses to NAC quite variable. This could be a result of the large differences among participants in the muscle's initial content of glutathione (Fig. 9), for which NAC is a precursor, and thus for the effect of NAC on muscle anti‐oxidant capacity (Paschalis et al. 2017). The results of the present study should therefore be regarded with caution and are subject to replication in subsequent, larger‐cohort studies.
Figure 9. Effect of training with and without BFR and anti‐oxidant infusion on resting skeletal muscle glutathione status in men.
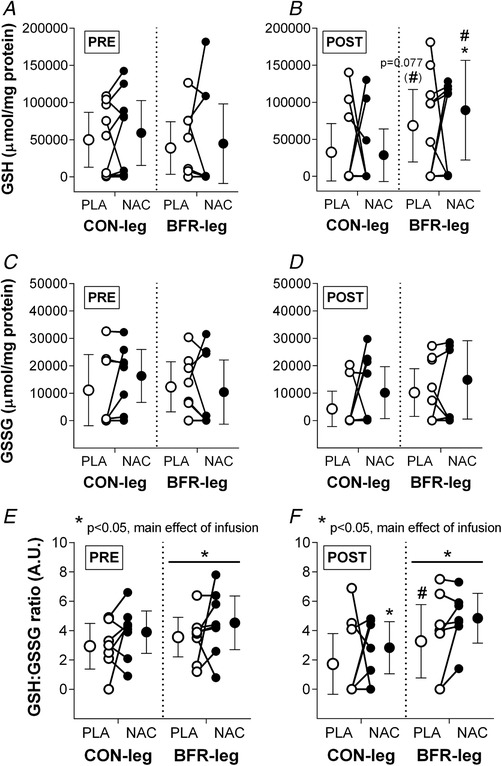
Concentrations of reduced (GSH; A + B; n = 9 Pre and n = 10 Post) and oxidized glutathione (GSSG; C + D; n = 8 Pre and n = 9 Post) and GSH:GSSG ratio (E + F; n = 7 Pre and Post) before (Pre; open circles) and after (Post; solid circles) 6 weeks of cycling without (CON‐leg) or with BFR (BFR‐leg) either without (PLA) or with i.v. infusion of anti‐oxidant (NAC). Data are expressed as the mean ± 95% CI. Individual changes with training are shown. * P < 0.05, NAC different from PLA. # P < 0.05, different from CON‐leg at Post.
To the best of our knowledge, no other study has examined the effect of NAC on K+ release from contracting muscles during high‐intensity exercise in humans. After training, NAC elevated the net release of K+ during intense exercise (90% iPPO) only from the BFR‐trained leg. This may have been the result of an increase in muscle anti‐oxidant capacity, as indicated by the higher muscle GSH:GSSG ratio at rest compared to the leg training without BFR. Accordingly, an increase in glutathione availability alters the potential for protein S‐glutathionylation (Aquilano et al. 2014), a post‐translational modification that is essential in the regulation of Na+,K+‐ATPase function (Juel et al. 2015) and thus K+ re‐uptake by muscles.
Our findings at the muscular level extend previous observations in men indicating that NAC attenuates decreases in plasma GSH concentration and elicits greater increases in plasma K+ concentration relative to the work produced during fatiguing cycling exercise (Medved et al. 2003). An increase in thigh net K+ release with NAC indicates a perturbed K+ homeostasis in the exercising musculature (as explained above). This is supported by observations in humans of a reduced muscle maximal in vitro Na+,K+‐ATPase activity with increased S‐glutathionylation of its β‐subunit (Juel et al. 2015), along with our finding of a higher muscle GSH concentration at rest with NAC than with placebo infusion in the BFR‐trained leg. This allows us to speculate that anti‐oxidant capacity is positively associated with K+ regulation up to a certain point, from where a further increase in this capacity (by NAC infusion) has no additional value. Nevertheless, the data obtained in the present study do not allow us to make robust, definitive inferences about the effect of NAC as a result of the small sample size and large inter‐subject variation in the responses to NAC, and so our observations are subject to verification in future larger, definitive studies. Moreover, it should be considered that altered activity of other K+ regulatory systems, such as the Na+–K+–2CL− exchanger (NKCC1), inward rectifying K+ channel (KIR2.1) and KATP channel (KIR6.2), may alter the effect of NAC, as well as K+ regulation, after training with BFR because these systems are also redox sensitive (Kourie, 1998) and their expression is altered by training in humans (Hostrup & Bangsbo, 2017).
Training‐induced adaptations in Na+,K+‐ATPase isoforms in type I and II fibres
Recent work with different types of training, including sprint‐interval (Wyckelsma et al. 2015; Christiansen et al. 2018a), resistance (Perry et al. 2016) and interval endurance (Wyckelsma et al. 2017) has shown that the abundance of Na+,K+‐ATPase isoforms is altered in a fibre type‐specific manner by training in human skeletal muscle. However, these fibre type‐specific analyses were not performed along with measurement of thigh net K+ release, although this was carried out in the present study. The divergent, fibre type‐specific adaptations elicited by BFR‐training compared to training without BFR (i.e. higher abundance of β1 and FXYD1 in type I and higher α1 and FXYD1 in type II fibres) probably reflect altered modulation of the cellular stressors and signalling pathways that regulate Na+,K+‐ATPase‐isoform expression (Christiansen, 2018). For example, BFR was shown to promote exercise‐induced downstream AMPK signalling and increase markers of oxidative stress, which was associated with a greater mRNA response of FXYD1 in trained men (Christiansen et al. 2018b), indicating that AMPK and reactive oxygen species could be important factors for mediating increases in FXYD1 expression after training with BFR.
Summary
Six weeks of interval cycling with BFR elicited greater gains in single‐leg exercise performance compared to worked‐matched training without BFR, which was associated with a reduced rate of K+ release from the thigh during intense exercise. The enhanced K+ regulation after BFR‐training was associated with (i) an altered anti‐oxidant function, as indicated by a higher net release of K+ during anti‐oxidant infusion and an increased GSH:GSSG ratio in skeletal muscle compared to control and (ii) a higher abundance of Na+,K+‐ATPase isoforms in type I (β1, FXYD1) and type II (α1, FXYD1) muscle fibres compared to control. In addition, an increase in blood flow to exercising muscles might also have contributed to the beneficial effects of training with BFR. Given the small sample size and large inter‐subject variation, the present findings are subject to replication in subsequent experiments. Based on the present results, a visual summary of the proposed key factors underlying the enhanced thigh K+ regulation after BFR‐training is provided in Fig. 11.
Figure 11. Proposed factors underlying improvements in muscle K+ regulation after training with BFR.
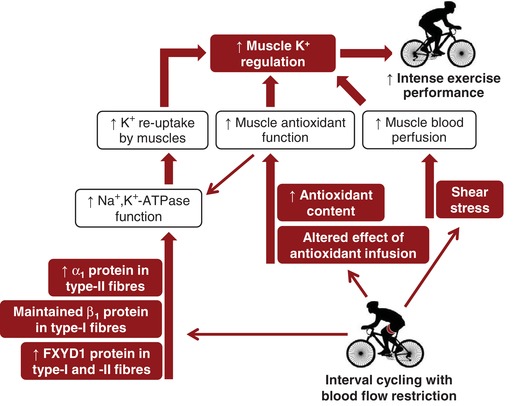
Based on the present outcomes, several factors probably contribute to improve skeletal muscle K+ regulation after training with BFR, including fibre type‐specific adaptations in abundance of Na+,K+‐ATPase isoforms, and changes in muscle anti‐oxidant function and blood flow. [Color figure can be viewed at wileyonlinelibrary.com]
Additional information
Competing interests
The authors declare that they have no competing interests.
Author contributions
Experimental procedures and analyses were performed at the Department of Nutrition, Exercise and Sport (NEXS), University of Copenhagen, Denmark. Training sessions were performed at a local gym (Fitnessdk Adelgade, Copenhagen, Denmark). DC and JB conceived the study. DC, MH and JB designed experiments. DC, KE, VR, HV, MT, MN, TG, CS, ML, DB and MH contributed to data collection and/or analysis. DC drafted the manuscript. DC, MH and JB contributed to critically revising the manuscript. All authors approved the final version of the manuscript submitted for publication.
Funding
The study was supported by The Danish Ministry of Culture (#FPK.2015‐0017) and the Danish Toyota Foundation (#KJ/BG 8876F). DC was supported by an International Postgraduate Research Scholarship from Victoria University, Melbourne, VIC, Australia.
Acknowledgements
We thank Jens Jung Nielsen for excellent technical assistance with experiments and the analysis of glutathione status, as well as Anne K. Lund for the opportunity to train our participants at the training facility. We also thank the participants for their efforts, donation of muscle tissue, and for a great time during training and tests. Finally, we would like to thank Peter Munck Sørensen, Tobias Buk Jørgensen, Daniel Lindsten, Eli Nolsøe Leifsson, Jesper Kirkebjerg and Casper Bjerre Olsen for their efforts during training and the experiments.
Biography
Danny Christiansen is a researcher based in the Section of Integrative Physiology at the Department of Nutrition, Exercise and Sports in Copenhagen. His research focuses on optimizing strategies that aim to enhance human physical performance and health by understanding the molecular factors that drive skeletal muscle adaptation. His work has involved the use of cold‐water immersion, simulated altitude, anti‐oxidant infusion and blood flow restriction in combination with exercise to study the regulation of muscle ion transport, blood flow, oxygenation and glucose metabolism in man.

Edited by: Scott Powers & Paul Greenhaff
This article was first published as a preprint. Christiansen D, Eibye KH, Rasmussen V, Voldbye HM, Thomassen M, Nyberg M, Gunnarsson TGP, Skovgaard C, Lindskrog MS, Bishop DJ, Hostrup M, Bangsbo J. 2018. Cycling with blood flow restriction improves performance and muscle K+ regulation and blunts the effect of antioxidant infusion in humans. bioRxiv. https://doi.org/10.1101/375881.
This is an Editor's Choice article from the 1 May 2019 issue.
References
- Abe T, Fujita S, Nakajima T, Sakamaki M, Ozaki H, Ogasawara R, Sugaya M, Kudo M, Kurano M, Yasuda T, Sato Y, Ohshima H, Mukai C & Ishii N (2010). Effects of low‐intensity cycle training with restricted leg blood flow on thigh muscle volume and VO2MAX in young men. J Sports Sci Med 9, 452–458. [PMC free article] [PubMed] [Google Scholar]
- Andersen P & Saltin B (1985). Maximal perfusion of skeletal muscle in man. J Physiol 366, 233–249. [DOI] [PMC free article] [PubMed] [Google Scholar]
- Aquilano K, Baldelli S & Ciriolo MR (2014). Glutathione: new roles in redox signaling for an old antioxidant. Front Pharmacol 5, 196‐196. [DOI] [PMC free article] [PubMed] [Google Scholar]
- Bangsbo J, Krustrup P, Gonzalez‐Alonso J, Boushel R & Saltin B (2000). Muscle oxygen kinetics at onset of intense dynamic exercise in humans. Am J Physiol Regul Integr Comp Physiol 279, R899–R906. [DOI] [PubMed] [Google Scholar]
- Bibert S, Liu CC, Figtree GA, Garcia A, Hamilton EJ, Marassi FM, Sweadner KJ, Cornelius F, Geering K & Rasmussen HH (2011). FXYD proteins reverse inhibition of the Na+‐K+ pump mediated by glutathionylation of its beta1 subunit. J Biol Chem 286, 18562–18572. [DOI] [PMC free article] [PubMed] [Google Scholar]
- Boldyrev A & Kurella E (1996). Mechanism of oxidative damage of dog kidney Na/K‐ATPase. Biochem Biophys Res Commun 222, 483–487. [DOI] [PubMed] [Google Scholar]
- Borg GA (1982). Psychophysical bases of perceived exertion. Med Sci Sports Exerc 14, 377–381. [PubMed] [Google Scholar]
- Cerbai E, Ambrosio G, Porciatti F, Chiariello M, Giotti A & Mugelli A (1991). Cellular electrophysiological basis for oxygen radical‐induced arrhythmias. A patch‐clamp study in guinea pig ventricular myocytes. Circulation 84, 1773–1782. [DOI] [PubMed] [Google Scholar]
- Christiansen D (2018). Molecular stressors underlying exercise training‐induced improvements in K+ regulation during exercise and Na+,K+‐ATPase adaptation in human skeletal muscle. Acta Physiol (Oxf), 225, e13196. [DOI] [PubMed] [Google Scholar]
- Christiansen D, Bishop DJ, Broatch JR, Bangsbo J, McKenna MJ & Murphy RM (2018a). Cold‐water immersion after training sessions: effects on fiber type‐specific adaptations in muscle K+ transport proteins to sprint‐interval training in men. J Appl Physiol 125, 429–444. [DOI] [PubMed] [Google Scholar]
- Christiansen D, Murphy RM, Bangsbo J, Stathis CG & Bishop DJ (2018b). Increased FXYD1 and PGC‐1alpha mRNA after blood flow‐restricted running is related to fibre type‐specific AMPK signalling and oxidative stress in human muscle. Acta Physiol (Oxf), 223, e13045. [DOI] [PMC free article] [PubMed] [Google Scholar]
- Clanton TL (2007). Hypoxia‐induced reactive oxygen species formation in skeletal muscle. J Appl Physiol 102, 2379–2388. [DOI] [PubMed] [Google Scholar]
- Clausen T (2003). Effects of age and exercise training on Na+‐K+ pumps in skeletal muscle. Am J Physiol Regul Integr Comp Physiol 285, R720–R721. [DOI] [PubMed] [Google Scholar]
- Clausen T, Overgaard K & Nielsen OB (2004). Evidence that the Na+‐K+ leak/pump ratio contributes to the difference in endurance between fast‐ and slow‐twitch muscles. Acta Physiol Scand 180, 209–216. [DOI] [PubMed] [Google Scholar]
- Cohen J (1988). Statistical Power Analysis for the Behavioral Sciences , 2nd edn L. Erlbaum Associates, Hillsdale, New Jersey. [Google Scholar]
- Corvino RB, Rossiter HB, Loch T, Martins JC & Caputo F (2017). Physiological responses to interval endurance exercise at different levels of blood flow restriction. Eur J Appl Physiol 117, 39–52. [DOI] [PubMed] [Google Scholar]
- Fowles JR, Green HJ & Ouyang J (2004). Na+‐K+‐ATPase in rat skeletal muscle: content, isoform, and activity characteristics. J Appl Physiol 96, 316–326. [DOI] [PubMed] [Google Scholar]
- Friedman JJ & DeRose NE (1982). The effects of flow and of hyperosmolal superfusion on the K+ permeability of single capillaries. Microvasc Res 24, 68–76. [DOI] [PubMed] [Google Scholar]
- Glynn IM (1963). ‘Transport adenosinetriphosphatase’ in electric organ. the relation between ion transport and oxidative phosphorylation. J Physiol 169, 452–465. [DOI] [PMC free article] [PubMed] [Google Scholar]
- Gundermann DM, Fry CS, Dickinson JM, Walker DK, Timmerman KL, Drummond MJ, Volpi E & Rasmussen BB (2012). Reactive hyperemia is not responsible for stimulating muscle protein synthesis following blood flow restriction exercise. J Appl Physiol 112, 1520–1528. [DOI] [PMC free article] [PubMed] [Google Scholar]
- Gunnarsson TP, Christensen PM, Thomassen M, Nielsen LR & Bangsbo J (2013). Effect of intensified training on muscle ion kinetics, fatigue development, and repeated short‐term performance in endurance‐trained cyclists. Am J Physiol Regul Integr Comp Physiol 305, R811–R821. [DOI] [PubMed] [Google Scholar]
- Havas E, Parviainen T, Vuorela J, Toivanen J, Nikula T & Vihko V (1997). Lymph flow dynamics in exercising human skeletal muscle as detected by scintography. J Physiol 504, 233–239. [DOI] [PMC free article] [PubMed] [Google Scholar]
- Hellsten Y, Apple FS & Sjodin B (1996). Effect of sprint cycle training on activities of antioxidant enzymes in human skeletal muscle. J Appl Physiol 81, 1484–1487. [DOI] [PubMed] [Google Scholar]
- Hostrup M & Bangsbo J (2017). Limitations in intense exercise performance of athletes ‐ effect of speed endurance training on ion handling and fatigue development. J Physiol 595, 2897–2913. [DOI] [PMC free article] [PubMed] [Google Scholar]
- Ingwersen MS, Kristensen M, Pilegaard H, Wojtaszewski JF, Richter EA & Juel C (2011). Na,K‐ATPase activity in mouse muscle is regulated by AMPK and PGC‐1alpha. J Membr Biol 242, 1–10. [DOI] [PubMed] [Google Scholar]
- Juel C (2009). Na+‐K+‐ATPase in rat skeletal muscle: muscle fiber‐specific differences in exercise‐induced changes in ion affinity and maximal activity. Am J Physiol Regul Integr Comp Physiol 296, R125–R132. [DOI] [PubMed] [Google Scholar]
- Juel C, Hostrup M & Bangsbo J (2015). The effect of exercise and beta2‐adrenergic stimulation on glutathionylation and function of the Na,K‐ATPase in human skeletal muscle. Physiol Rep 3, e12515. [DOI] [PMC free article] [PubMed] [Google Scholar]
- Kacin A, Rosenblatt B, Zargi TG & Biswas A (2015). Safety considerations with blood flow restricted resistance training. Ann Kinesiol 6, 3–26. [Google Scholar]
- Kacin A & Strazar K (2011). Frequent low‐load ischemic resistance exercise to failure enhances muscle oxygen delivery and endurance capacity. Scand J Med Sci Sports 21, e231–e241. [DOI] [PubMed] [Google Scholar]
- Kajimura M, Head SD & Michel CC (1998). The effects of flow on the transport of potassium ions through the walls of single perfused frog mesenteric capillaries. J Physiol 511, 707–718. [DOI] [PMC free article] [PubMed] [Google Scholar]
- Kourie JI (1998). Interaction of reactive oxygen species with ion transport mechanisms. Am J Physiol Cell Physiol 275, C1–C24. [DOI] [PubMed] [Google Scholar]
- Larkin KA, Macneil RG, Dirain M, Sandesara B, Manini TM & Buford TW (2012). Blood flow restriction enhances post‐resistance exercise angiogenic gene expression. Med Sci Sports Exerc 44, 2077–2083. [DOI] [PMC free article] [PubMed] [Google Scholar]
- Leeuwenburgh C, Hollander J, Leichtweis S, Griffiths M, Gore M & Ji LL (1997). Adaptations of glutathione antioxidant system to endurance training are tissue and muscle fiber specific. Am J Physiol Regul Integr Comp Physiol 272, R363–R369. [DOI] [PubMed] [Google Scholar]
- Manimmanakorn A, Hamlin MJ, Ross JJ, Taylor R & Manimmanakorn N (2013). Effects of low‐load resistance training combined with blood flow restriction or hypoxia on muscle function and performance in netball athletes. J Sci Med Sport 16, 337–342. [DOI] [PubMed] [Google Scholar]
- McKenna MJ, Medved I, Goodman CA, Brown MJ, Bjorksten AR, Murphy KT, Petersen AC, Sostaric S & Gong X (2006). N‐acetylcysteine attenuates the decline in muscle Na+,K+‐pump activity and delays fatigue during prolonged exercise in humans. J Physiol 576, 279–288. [DOI] [PMC free article] [PubMed] [Google Scholar]
- Medved I, Brown MJ, Bjorksten AR, Leppik JA, Sostaric S & McKenna MJ (2003). N‐acetylcysteine infusion alters blood redox status but not time to fatigue during intense exercise in humans. J Appl Physiol 94, 1572–1582. [DOI] [PubMed] [Google Scholar]
- Medved I, Brown MJ, Bjorksten AR & McKenna MJ (2004). Effects of intravenous N‐acetylcysteine infusion on time to fatigue and potassium regulation during prolonged cycling exercise. J Appl Physiol 96, 211–217. [DOI] [PubMed] [Google Scholar]
- Murphy KT, Macdonald WA, McKenna MJ & Clausen T (2006). Ionic mechanisms of excitation‐induced regulation of Na+‐K+‐ATPase mRNA expression in isolated rat EDL muscle. Am J Physiol Regul Integr Comp Physiol 290, R1397–R1406. [DOI] [PubMed] [Google Scholar]
- Nielsen JJ, Mohr M, Klarskov C, Kristensen M, Krustrup P, Juel C & Bangsbo J (2004). Effects of high‐intensity intermittent training on potassium kinetics and performance in human skeletal muscle. J Physiol 554, 857–870. [DOI] [PMC free article] [PubMed] [Google Scholar]
- Paschalis V, Theodorou AA, Margaritelis NV, Kyparos A & Nikolaidis MG (2017). N‐acetylcysteine supplementation increases exercise performance and reduces oxidative stress only in individuals with low levels of glutathione. Free Radic Biol Med 115, 288–297. [DOI] [PubMed] [Google Scholar]
- Paton CD, Addis SM & Taylor LA (2017). The effects of muscle blood flow restriction during running training on measures of aerobic capacity and run time to exhaustion. Eur J Appl Physiol 117, 2579–2585. [DOI] [PubMed] [Google Scholar]
- Pearson SJ & Hussain SR (2015). A review on the mechanisms of blood‐flow restriction resistance training‐induced muscle hypertrophy. Sports Med 45, 187–200. [DOI] [PubMed] [Google Scholar]
- Perry BD, Wyckelsma VL, Murphy RM, Steward CH, Anderson M, Levinger I, Petersen AC & McKenna MJ (2016). Dissociation between short‐term unloading and resistance training effects on skeletal muscle Na+,K+‐ATPase, muscle function, and fatigue in humans. J Appl Physiol 121, 1074–1086. [DOI] [PubMed] [Google Scholar]
- Reid MB, Khawli FA & Moody MR (1993). Reactive oxygen in skeletal muscle. III. Contractility of unfatigued muscle. J Appl Physiol 75, 1081–1087. [DOI] [PubMed] [Google Scholar]
- Reis J, Zhang L, Cala S, Jew KN, Mace LC, Chung L, Moore RL & Ng YC (2005). Expression of phospholemman and its association with Na+‐K+‐ATPase in skeletal muscle: effects of aging and exercise training. J Appl Physiol 99, 1508–1515. [DOI] [PubMed] [Google Scholar]
- Shimoda LA & Polak J (2011). Hypoxia. 4. Hypoxia and ion channel function. Am J Physiol Cell Physiol 300, C951–C967. [DOI] [PMC free article] [PubMed] [Google Scholar]
- Silva E & Soares‐da‐Silva P (2007). Reactive oxygen species and the regulation of renal Na+‐K+‐ATPase in opossum kidney cells. Am J Physiol Regul Integr Comp Physiol 293, R1764–R1770. [DOI] [PubMed] [Google Scholar]
- Stoner JD, Clanton TL, Aune SE & Angelos MG (2007). O2 delivery and redox state are determinants of compartment‐specific reactive O2 species in myocardial reperfusion. Am J Physiol Heart Circ Physiol 292, H109–H116. [DOI] [PubMed] [Google Scholar]
- Sundberg CJ (1994). Exercise and training during graded leg ischaemia in healthy man with special reference to effects on skeletal muscle. Acta Physiol Scand Suppl 615, 1–50. [PubMed] [Google Scholar]
- Sundberg CJ, Eiken O, Nygren A & Kaijser L (1993). Effects of ischaemic training on local aerobic muscle performance in man. Acta Physiol Scand 148, 13–19. [DOI] [PubMed] [Google Scholar]
- Thomassen M, Murphy RM & Bangsbo J (2013). Fibre type‐specific change in FXYD1 phosphorylation during acute intense exercise in humans. J Physiol 591, 1523–1533. [DOI] [PMC free article] [PubMed] [Google Scholar]
- Thomassen M, Rose AJ, Jensen TE, Maarbjerg SJ, Bune L, Leitges M, Richter EA, Bangsbo J & Nordsborg NB (2011). Protein kinase Cα activity is important for contraction‐induced FXYD1 phosphorylation in skeletal muscle. Am J Physiol Regul Integr Comp Physiol 301, R1808–R1814. [DOI] [PubMed] [Google Scholar]
- Wyckelsma VL, Levinger I, Murphy RM, Petersen AC, Perry BD, Hedges CP, Anderson MJ & McKenna MJ (2017). Intense interval training in healthy older adults increases skeletal muscle [3H]ouabain‐binding site content and elevates Na+,K+‐ATPase α2 isoform abundance in type II fibers. Physiol Rep 5, e13219. [DOI] [PMC free article] [PubMed] [Google Scholar]
- Wyckelsma VL, McKenna MJ, Serpiello FR, Lamboley CR, Aughey RJ, Stepto NK, Bishop DJ & Murphy RM (2015). Single fiber expression and fiber‐specific adaptability to short‐term intense exercise training of Na+,K+‐ATPase alpha and beta isoforms in human skeletal muscle. J Appl Physiol 118, 699–706. [DOI] [PubMed] [Google Scholar]