

Abstract
Lithium is one of the mainstays for the treatment of bipolar disorder despite its side effects on the endocrine, neurological, and renal systems. Experimentally, lithium has been used as a measure to determine proximal tubule reabsorption based on the assumption that lithium and sodium transport go in parallel in the proximal tubule. However, the exact mechanism by which lithium is reabsorbed remains elusive. The majority of proximal tubule sodium reabsorption is directly or indirectly mediated by the sodium-hydrogen exchanger 3 (NHE3). In addition, sodium-phosphate cotransporters have been implicated in renal lithium reabsorption. In order to better understand the role of sodium-phosphate cotransporters involved in lithium (re)absorption, we studied lithium pharmacokinetics in: i) tubule-specific NHE3 knockout mice (NHE3loxloxPax8Cre), and ii) mice challenged with low or high phosphate diets. Intravenous or oral administration of lithium did not result in differences in lithium bioavailability, half-life, maximum plasma concentrations, area under the curve, lithium clearance, or urinary lithium/creatinine ratios between control and NHE3loxloxPax8Cre mice. After one week of dietary phosphate challenges, lithium bioavailability was ~30% lower on low versus high dietary phosphate, possibly the consequence of a smaller area under the curve after oral administration. This was associated with lower lithium clearance after oral administration and lower urinary lithium/creatinine ratios on low versus high dietary phosphate. Collectively, renal NHE3 does not play a role in lithium pharmacokinetics; however, dietary phosphate could have an indirect effect on lithium bioavailability and lithium disposition.
Keywords: Lithium, kidney, bipolar, proximal tubule, urine, excretion
1. Introduction
Lithium, despite its renal (Poulsen et al., 2017), endocrine (Salata and Klein, 1987) and neurological (Ghadirian and Lehmann, 1980) side effects, is still frequently used for the treatment of bipolar disorder. Lithium has a narrow therapeutic range and is required to have steady-state plasma levels between 0.6 – 1.2 mmol/L for maintenance treatment and 0.8 – 1.5 mmol/L for acute management (Geddes and Miklowitz, 2013). Lithium toxicity occurs when levels are >1.5 mmol/L, and levels >3.5 mmol/L are potentially fatal. In addition to its clinical use in humans, lithium has been used since the seventies as a marker of proximal tubular reabsorption in mice (Huls et al., 2007; Veiras et al., 2017), rats (Miracle et al., 2007; Thomsen and Leyssac, 1986), dogs (Abildgaard et al., 1986; Shalmi et al., 1992), and humans (Petersen et al., 1974; Thomsen and Olesen, 1984). An ideal marker of proximal tubule Na+ reabsorption should fulfill the following criteria: (i) it’s reabsorption should be proportional to Na+ and H2O reabsorption along the proximal tubule, (ii) no reabsorption/secretion further downstream of the proximal tubule should occur, (iii) no impact on glomerular filtration rate, and (iv) be freely filtered. The proximal tubule is responsible for the majority of renal Na+ and H2O reabsorption (60% – 75%) and the Na+/H+ exchanger isoform 3 (NHE3) plays a vital role, both directly and indirectly, in this process (Biemesderfer et al., 1993; Girardi and Di Sole, 2012). Experiments in NHE3 knockout mice identified that proximal tubule Na+ reabsorption was reduced by 63% when studied in vivo and 46% when studied in vitro (Fenton et al., 2017; Ledoussal et al., 2001; Schultheis et al., 1998). Micropuncture studies in rats identified that in the proximal tubule, lithium is transported at the same rate as Na+ and H2O (Hayslett and Kashgarian, 1979). Supporting this are pharmacological studies employing acetazolamide, a proximal tubule carbonic anhydrase inhibitor, which results in a significant increase in fractional lithium clearance (Kersten and Braunlich, 1987; Kirchner, 1987; Steele et al., 1976). However, in addition to the proximal tubule, lithium reabsorption occurs up to 18% in the loop of Henle/thick ascending limb (Atherton et al., 1991; Hayslett and Kashgarian, 1979; Unwin et al., 1994). While there has been functional evidence that in the connecting tubule and collecting duct, lithium transport by the epithelial Na+ channel, ENaC, contributes to the development of nephrogenic diabetes insipidus (Christensen et al., 2011; Vallon et al., 2009), micropuncture studies did not identify significant lithium transport beyond the early distal tubule versus the urine (Hayslett and Kashgarian, 1979). However, Na+ restriction, a condition where ENaC is highly active, in combination with amiloride (ENaC blocker) was able to uncover a contribution of ENaC to lithium reuptake into the body (Kirchner, 1987).
In addition to NHE3, a multitude of other Na+-dependent transport proteins are expressed in the proximal tubule (Zhuo and Li, 2013). The studies evaluating their role for lithium transport are sparse. One of the proteins that has been studied is the Na+-phosphate cotransporter. Initial studies in human erythrocytes identified that the Na+-phosphate cotransporter accepts both Na+ and lithium as substrates (Elmariah and Gunn, 2003). Parathyroid hormone (PTH) is an important regulator of renal phosphate reabsorption (Thomas et al., 2017; Wagner et al., 2014) and because of its effects on NHE3 (Collazo et al., 2000; Fan et al., 1999), proximal tubular Na+ and H2O reabsorption in general. Consistent with this, administration of PTH extract to lithium-loaded humans reduces lithium reabsorption (Steele et al., 1975). In rats, administration of PTH or foscarnet (an antiviral drug that non-selectively inhibits Na+-phosphate cotransport) increased lithium clearance (Uwai et al., 2014; Uwai et al., 2018). Of note, non-selective inhibition of Na+-glucose cotransporters, also highly expressed in the proximal tubules (Gorboulev et al., 2012; Vallon et al., 2011), did not affect lithium clearance (Uwai et al., 2014).
Taken together, the lithium transport protein(s) in the proximal tubule have so far not been identified. Based on the prominent role of NHE3 in the proximal tubule for Na+ and water reabsorption, we hypothesized that lack of NHE3 (tubule-specific NHE3 knockout, NHE3loxloxPax8Cre) results in changes in lithium disposition and/or urinary excretion. In addition, we studied the impact of dietary phosphate, which is well known to regulate the expression of proximal tubule Na+/phosphate cotransporters (Npt2a and Npt2c) (Tenenhouse et al., 2003) and the intestinal Na+/phosphate cotransporter (Npt2b) (Capuano et al., 2005) on lithium disposition in mice. Our data demonstrate comparable pharmacokinetics of lithium in the absence of renal NHE3. However, dietary phosphate has direct impact on (i) lithium bioavailability and (ii) urinary lithium excretion.
2. Materials and methods
2.1. Animals and ethics
All animal experimentation was conducted in accordance with the Guide for Care and Use of Laboratory Animals (National Institutes of Health, Bethesda, MD) and was approved by the local Institutional Animal Care and Use Committee. The generation and phenotype of tubule-specific NHE3 knockout mice using Pax8-Cre transgenic mice has been described previously (Fenton et al., 2015; Fenton et al., 2017). Mice were housed under a 12:12-hour light-dark cycle in isolated ventilated cages with free access to standard rodent chow (TD.2018; Envigo, Madison, WI) and tap water. Age-matched, 3- to 6-month old male and female mice (control, NHE3loxlox) or tubule-specific NHE3 knockout mice (NHE3loxloxPax8Cre) were used for experiments.
2.2. Lithium administration and blood collections
2.2.1. Intravenous administration (IV).
Lithium chloride (LiCl 5 mmol/kg, 2 μl/g body weight, Fisher Scientific, Pittsburgh, PA) (Wraae, 1978), dissolved in sterile water, was administered intravenously under brief isoflurane anesthesia. Blood was collected in 10 μl minicaps (Hirschmann Laborgeräte, Eberstadt Germany) by tail nick immediately before injection (baseline) and at 3, 5, 7, 10, 20, 30 minutes and 1, 2, 4, 6, 8 and 24 hours. Plasma was separated by centrifugation and used for subsequent analysis.
2.2.2. Oral gavage.
Lithium chloride, dissolved in sterile water, was given to mice via oral gavage (5 mmol/kg, 1% of body weight). In oral gavage experiments blood was collected at baseline, 15, 30, 45 minutes and 1, 2, 4, 6, 8 and 24 hours. In both experiments, IV and oral gavage, urine was collected at baseline, where the bladder was emptied, and 30 minutes after lithium administration.
2.3. Low and high dietary phosphate manipulations
Mice were randomized to either low phosphate (<0.01% phosphate; TD.08601, Envigo, USA) or high phosphate diet (1.5% phosphate; TD.140038, Envigo) (Fenton et al., 2014). Apart from phosphate, diets were otherwise identical in composition. After one week on either low or high phosphate diet, mice were anesthetized for blood collection to determine plasma phosphate and calcium levels.
2.4. Analysis of plasma and urine samples
All clinical chemistry was performed using commercially available assays that were modified to work with small volumes (Rieg et al., 2004; Rieg et al., 2005). Lithium concentrations in plasma and urine were determined using Infinity™ Lithium Liquid Stable Reagent (Thermo Fisher Scientific, Middletown, VA, USA; detection limit 0.04 mmol/L), urinary creatinine was determined using Infinity™ Creatinine Liquid Stable Reagent (Thermo Fisher Scientific), phosphate and calcium in plasma and urine were determined using Inorganic Phosphorous Reagent and Calcium Arsenazo III Reagent, respectively (Pointe Scientific, Canton, MI, USA).
2.5. Lithium pharmacokinetics
Pharmacokinetic data analysis was performed using GraphPad Prism (La Jolla, CA). Peak plasma concentration (Cmax) was calculated by Prism from the concentration-time profile data. The area under the curve (AUC) was calculated by the trapezoid rule. The area, therefore, is ΔX*(Y1+Y2)/2 and Prism uses this formula repeatedly for each adjacent pair of points defining the curve. Half-life (T1/2) was calculated using a two-compartment model of two-phase exponential decay. The extent of biological availability (F), defined as the fraction of the oral dose which reaches the systemic circulation, was determined from the AUC after oral gavage and IV administered lithium doses (F = AUC(gavage)/AUC(IV)). The lithium dose administered divided by the AUC gave the mean plasma lithium clearance after IV administration (CL = Dose/AUC); for oral administration the dose was corrected by bioavailability (CL = Dose × F/AUC).
2.6. Statistical analyses
The data are expressed as mean ± SEM. Two-way ANOVA was used for comparison of several experimental curves and procedures followed by Tukey or Bonferroni post-hoc tests (all data analyzed via GraphPad Prism or SigmaPlot, San Jose, CA, USA). Significance was considered at P<0.05.
3. Results and discussion
3.1. Effect of lithium administration on plasma lithium levels and urinary excretion in control and NHE3loxloxPax8Cre mice
In order to determine lithium pharmacokinetics, we studied mice after IV and oral administration of lithium chloride. Before lithium administration, plasma lithium levels were below the detection limit of the used assay. Lithium is a nutritionally essential trace element (Terao, 2015) and consumption with food and water results in plasma lithium levels ~0.3 μmol/L (Bochud et al., 2007), which is a factor of ~10,000 lower compared to the recommended plasma concentrations required for the treatment of psychiatric disorders (0.6 and 1.2 mmol/L). IV injection caused a rapid increase in plasma lithium concentrations in control (Fig 1a) and NHE3loxloxPax8Cre mice (Fig. 1b). Twenty-four hours after injection, plasma lithium returned to baseline levels in both genotypes. Our results are comparable to other studies using comparable lithium doses (Can et al., 2011; Wraae, 1978); however, our more frequent blood collections clearly identified, by employing a 2-compartment model, that lithium pharmacokinetic follows a 2-phase exponential decay with a terminal T1/2 of 6.5±1 hours in control mice and 6.5±1 hours in NHE3loxloxPax8Cre mice (Fig 1a, b). Two-compartment models for lithium disposition have been described before in humans, with erythrocytes being representative for the tissue compartment (Poust et al., 1976). Erythrocytes express the Na+/H+ exchanger isoform 1 (NHE1) (Duhm and Becker, 1977), and expression of human NHE1 in Xenopus leavis oocytes identified that NHE1 mediates Na+/Li+ countertransport (Busch et al., 1995). Our data also confirm a significantly shorter T1/2 in rodents (Giles and Bannigan, 1997; Wood et al., 1986) compared to humans (Timmer and Sands, 1999) and other species (Manuelian et al., 2015; Rosenthal et al., 1986). The AUC0–24h (Fig. 1c) and lithium clearance (Fig. 1d) were not significantly different between control and NHE3loxloxPax8Cre mice. Urine collected at baseline did not show measurable lithium concentrations in either genotype. After 30 minutes, urinary lithium/creatinine ratios were not significantly different between genotypes after IV bolus injection (Fig. 1e). We chose to study urinary lithium/creatinine ratios after 30 minutes when the plasma lithium concentration was still in the distribution phase, and we could successfully obtain urine. Considering that 25% of the cardiac output reaches the kidneys and that the proximal tubule is the major site of lithium reabsorption, we expected that we would see the biggest differences in urinary lithium excretion at this early timepoint (Uwai et al., 2014). Time-concentration curves for lithium after oral gavage are shown in (Fig 2a, b); 24-hours after administration, plasma lithium returned to baseline levels in both genotypes. The terminal T1/2 was 8.3±1 hours in control mice and 6.7±1 hours in NHE3loxloxPax8Cre mice. After oral gavage of lithium, Cmax was reached within 30 minutes independent of genotype (Fig. 2c). The AUC0–24h (Fig. 2d) and lithium clearance (Fig. 2e) were not significantly different between control and NHE3loxloxPax8Cre mice. Of note, one study in rats showed that there was surprisingly no Cmax after oral gavage, an effect that was independent of rats having free access to food or not (Olesen et al., 1976). The reason for this remains elusive. Urinary lithium/creatinine ratios were not significantly different between genotypes (Fig. 2f). Consistent with a significantly smaller AUC0–24h and lithium clearance after oral gavage (see above), urinary lithium/creatinine ratios were significantly lower in the oral gavage groups compared to their respective IV administration (P<0.05), possibly a consequence of lower lithium AUC up to the 30-minute time point. NHE3loxloxPax8Cre mice have absent NHE3 expression in the proximal tubule and >85% reduced NHE3 expression in the thick ascending limb (Fenton et al., 2015; Fenton et al., 2017). Under normal conditions, lithium is highly reabsorbed by the proximal tubule, possibly in parallel with Na+ and H2O, and a reduction in lithium reabsorption would indicate reduced proximal tubular transport. Mice lacking P-glycoprotein exhibit increased amino acid, calcium, protein, and glucose excretion, together indicative of proximal tubular dysfunction (Huls et al., 2007). Consequently, lithium clearance was significantly increased in this model. Based on the prominent role of NHE3 for Na+ and H2O reabsorption, we would have expected that NHE3loxloxPax8Cre mice show a similar phenotype of increased lithium clearance, or possibly an even more pronounced phenotype considering the absence of NHE3 in the thick ascending limb, if NHE3 mediates lithium transport. However, our studies do not indicate a contribution of NHE3 for lithium disposition even though NHE3 is a close family member of NHE1, which transports lithium very well (Busch et al., 1995). Supporting these findings are in vitro data from PS120 fibroblast cells transfected with either NHE1, NHE2 or NHE3. When PS120 cells expressed NHE1 or NHE2, extracellular lithium induced intracellular alkalization; however, this effect was completely absent when cells expressed NHE3 (Kobayashi et al., 2000). Taken together, the importance of NHE3 for renal lithium transport appears to be minimal, if at all.
Figure 1. Lithium pharmacokinetic after intravenous administration in the presence and absence of renal NHE3 (NHE3loxloxPax8Cre).
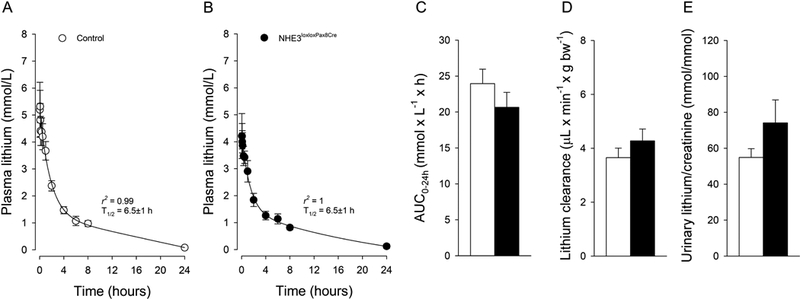
Two compartment 2-phase exponential decay of lithium in control (A) and NHE3loxloxPax8Cre mice (B). Lack of renal NHE3 does not affect (C) area under the curve up to 24 hours (AUC0–24h), (D) lithium clearance or (E) urinary lithium/creatinine ratios determined after 30 minutes. Data are expressed as mean±S.E.M, n=6/genotype.
Figure 2. Lithium pharmacokinetic after oral gavage in the presence and absence of renal NHE3 (NHE3loxloxPax8Cre).

Concentration -time curves of lithium in control (A) and NHE3loxloxPax8Cre mice (B). Lack of renal NHE3 does not affect (C) maximal plasma concentrations (Cmax) after 30 minutes, (D) area under the curve up to 24 hours (AUC0–24h), (E) lithium clearance corrected by lithium bioavailability, (F) urinary lithium/creatinine ratios determined after 30 minutes or (G) lithium bioavailability. Data are expressed as mean±S.E.M. n=6/genotype.
For the first time, to our knowledge, lithium bioavailability was determined in mice by comparing IV and oral routes of administration. High lithium bioavailability (~80%) was observed after oral dosing in mice; however, was not significantly different between genotypes (Fig. 2g). Other studies focused on comparing bioavailability of different lithium preparations, e.g. lithium carbonate versus lithium citrate (Guelen et al., 1992) or extended and immediate release lithium formulations (Arancibia et al., 1986). Estimated bioavailability was calculated to range from 60–90%, depending on formulation (Ware et al., 2016), which is assumed to be equivalent in humans (Grandjean and Aubry, 2009).
3.2. Lithium disposition in mice treated with low and high phosphate diet
In addition to studying the contribution of NHE3 for lithium disposition, we also studied the role of dietary phosphate challenges, and therefore changes in Na+-dependent phosphate cotransporter expression (Fenton et al., 2014; Lanaspa et al., 2013; Tenenhouse et al., 2003), for lithium disposition. We chose this “natural” maneuver because dietary phosphate intake in humans can vary widely depending on meat intake versus a vegetarian diet (Moe et al., 2011) and the amount of phosphate-containing beverages consumed (Calvo and Uribarri, 2013), which would have secondary consequences on lithium pharmacokinetics in humans. In addition, patients with chronic kidney disease usually suffer from hyperphosphatemia and require special dietary restrictions (Cannata-Andia and Martin, 2016). After 10 days of dietary phosphate challenges, plasma phosphate levels (Fig. 3a) and urinary phosphate/creatinine ratios (Fig. 3b) were ~0.9 mmol/L and ~1200-fold higher on high compared to low dietary phosphate (P<0.05). Vice versa, plasma calcium levels (Fig. 3a) and urinary calcium/creatinine ratios (Fig. 3b) were ~0.25 mmol/L and ~33-fold lower on high compared to low dietary phosphate (P<0.05). The lower plasma calcium on high dietary phosphate is possibly a consequence of decreased active vitamin D and reduced intestinal calcium absorption (Portale et al., 1986) as well as calcium/phosphate deposits in soft tissues (Brown and Razzaque, 2015). The lower urinary calcium excretion is possibly a consequence of elevated PTH levels causing significantly increased renal calcium reabsorption (Lau and Bourdeau, 1995).
Figure 3. Responses to dietary phosphate challenges.
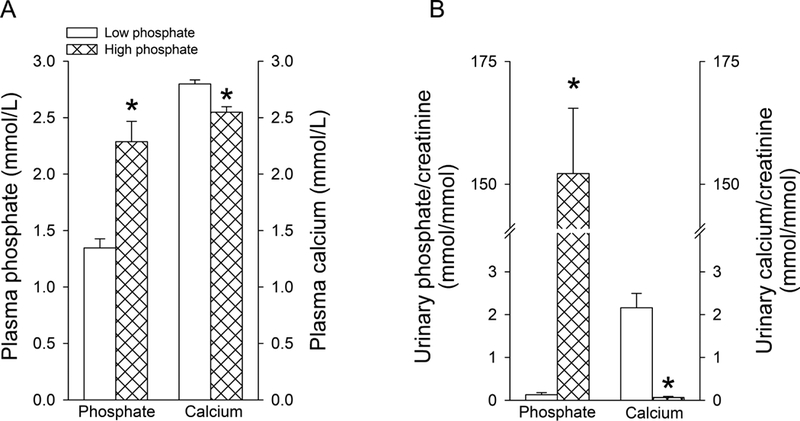
(A) Plasma phosphate and calcium levels after one week of low or high dietary phosphate challenges. (B) Corresponding urinary phosphate/creatinine and calcium/creatinine ratios. Data are expressed as mean±S.E.M. n=6/group. *P<0.05 versus low dietary phosphate.
3.3. Lithium disposition in response to dietary phosphate challenges
Lithium pharmacokinetic after IV administration showed terminal T1/2 of 8.4±2 hours on low phosphate diet and 6.4±1 hours on high phosphate diet (Fig 4a, b). AUC0–24h (Fig. 4c) and lithium clearance (Fig. 4d) were not significantly different between dietary conditions after IV administration. However, dietary phosphate directly impacted urinary lithium/creatinine ratios: low dietary phosphate decreased, and high dietary phosphate increased urinary lithium/creatinine ratios. After oral gavage of lithium, Cmax was reached within 45–60 minutes (Fig. 5a–c). The terminal T1/2 was 9.7±1 hours on low and 10.5±1 hours on high dietary phosphate. The AUC0–24h (Fig. 5d) and lithium clearance (Fig. 5e) were slightly but significantly lower on low compared to high dietary phosphate. Consistent with IV administration, a similar pattern was observed for urinary lithium/creatinine ratios (Fig. 5f). Comparing low and high dietary phosphate intake unraveled a possible contribution of the amount of dietary phosphate on lithium bioavailability. On low dietary phosphate, lithium bioavailability was 30% lower compared to high dietary phosphate (Fig. 5g), indicating for the first time that dietary phosphate could indirectly impact lithium bioavailability. Currently, the mechanism for how lithium enters the systemic circulation after oral administration is unclear. Our data argue against a role of intestinal Npt2b for lithium absorption because Npt2b expression is inversely regulated by dietary phosphate (Capuano et al., 2005; Sabbagh et al., 2011). If lithium would be transported by Npt2b, one would expect the opposite: high lithium bioavailability on low phosphate diet and low bioavailability on high phosphate diet. It remains to be determined which other transport protein(s) and/or paracellular transport contribute to lithium absorption. Of note, data on intestinal lithium uptake by glucose transporters are ambiguous: in hamster small intestine, lithium was shown to stimulate glucose entry (Bihler and Adamic, 1967), while in rat intestinal loops, glucose transport was inhibited in the presence of lithium (Rosensweig et al., 1965).
Figure 4. Role of dietary phosphate on lithium pharmacokinetics after intravenous administration.
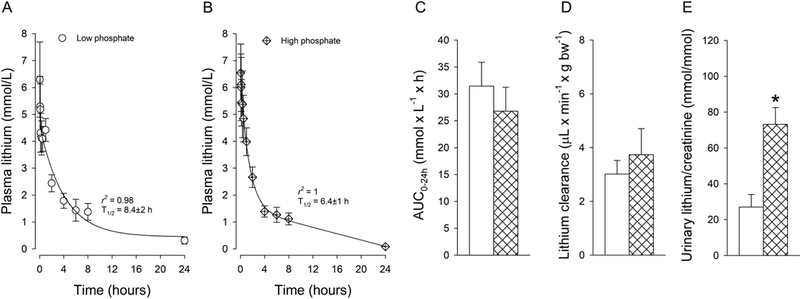
Two compartment 2-phase exponential decay of lithium after mice were challenged for one week with low (A) or high (B) dietary phosphate. No differences were observed in (C) area under the curve up to 24 hours (AUC0–24h) and (D) lithium clearance. Urinary lithium/creatinine ratios determined after 30 minutes (E) show changes that go in parallel with dietary phosphate content. Data are expressed as mean±S.E.M. n=5–7/group. *P<0.05 versus low dietary phosphate.
Figure 5. Role of dietary phosphate on lithium pharmacokinetics after oral gavage.
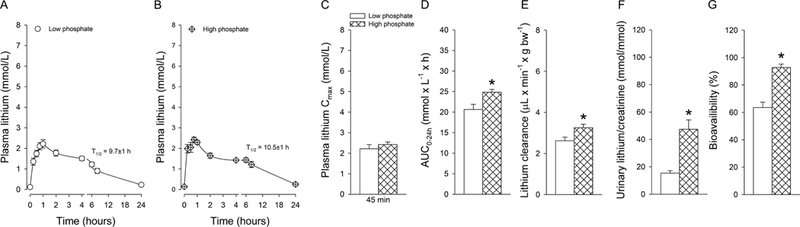
Concentration-time curves of lithium after mice were challenged for one week with low (A) or high (B) dietary phosphate. No differences were observed in (C) maximal plasma concentrations (Cmax) after 45–60 minutes. (D) Area under the curve up to 24 hours (AUC0–24h) and (E) lithium clearance were significantly lower on low compared to high dietary phosphate. Urinary lithium/creatinine ratios (F) determined after 30 minutes show changes that go in parallel with dietary phosphate and (G) lithium bioavailability was significantly lower on low compared to high dietary phosphate. Data are expressed as mean±S.E.M. n=5–7/group. *P<0.05 versus low dietary phosphate.
Approaches to selectively study the contribution of Na+/phosphate cotransporters for renal lithium handling are difficult to interpret. Foscarnet, a pyrophosphate analog, is used for the treatment of viral infections and has been postulated to inhibit Na+/phosphate cotransporters. Only one group has chosen to employ this approach and reported that foscarnet increased renal lithium excretion and lithium clearance (Uwai et al., 2014; Uwai et al., 2016, 2018), an effect that was proposed to be mediated by Npt2a. However, a direct link between foscarnet and Npt2a is lacking. In addition, clinically, foscarnet has been reported to cause hyper- as well as hypophosphatemia, the former incompatible with inhibition of Na+/phosphate cotransporters (Gerard and Salmon-Ceron, 1995). PTH administration was shown to increase lithium clearance (Uwai et al., 2014; Zhang et al., 1999). However, since PTH redistributes Npt2a and NHE3 to lysosomes and the base of the microvilli, respectively (Fenton et al., 2014; Yang et al., 2004), these studies do not allow us to distinguish which of these protein(s) mediate(s) lithium transport. Of note, our studies in NHE3loxloxPax8Cre mice do rule out a contribution of NHE3 since all measured pharmacokinetic parameters were not significantly different from control mice.
Our study is not without limitations. So far, we only have been able to provide indirect evidence about the involved lithium transport protein(s) and/or mechanisms. It is possible that other transport protein(s) are the apical entry pathway of lithium and NHE1 on the basolateral side the exit pathway. NHE1 is expressed in segments that are involved in lithium transport: the proximal tubule (Parker et al., 2015), thick ascending limb (Watts and Good, 1999) and distal tubule (Bobulescu and Moe, 2006). Along those lines, if nephron segments further downstream of the proximal tubule can compensate when fractional lithium delivery out of the proximal tubule is high remains to be determined.
4. Conclusion
In summary, our data indicate that renal NHE3 is not required for lithium disposition, possibly indicating that other transport mechanisms in the proximal tubule/thick ascending limb mediate lithium reabsorption. Modulating the amount of dietary phosphate unraveled a possible contribution of renal Na+-phosphate cotransporters, but not the intestinal phosphate cotransporter Npt2b, for lithium transport. However, the former cannot be responsible for lithium reabsorption in the thick ascending limb. We also provide new evidence that dietary phosphate possibly modulates lithium bioavailability, having direct implications how dietary phosphate consumption in humans could impact lithium plasma levels by possibly affecting lithium bioavailability.
Acknowledgments
Funding
TR is supported by the National Institute of Diabetes and Digestive and Kidney Diseases (1R01DK110621). JX was supported by an American Heart Association Predoctoral Fellowship (18PRE33990236).
Footnotes
Publisher's Disclaimer: This is a PDF file of an unedited manuscript that has been accepted for publication. As a service to our customers we are providing this early version of the manuscript. The manuscript will undergo copyediting, typesetting, and review of the resulting proof before it is published in its final citable form. Please note that during the production process errors may be discovered which could affect the content, and all legal disclaimers that apply to the journal pertain.
Conflict of interest
The authors declare that they have no conflicts of interest.
References
- Abildgaard U, Holstein-Rathlou NH, Leyssac PP, 1986. Effect of renal nerve activity on tubular sodium and water reabsorption in dog kidneys as determined by the lithium clearance method. Acta Physiol Scand 126, 251–257. [DOI] [PubMed] [Google Scholar]
- Arancibia A, Corvalan F, Mella F, Concha L, 1986. Absorption and disposition kinetics of lithium carbonate following administration of conventional and controlled release formulations. Int J Clin Pharmacol Ther Toxicol 24, 240–245. [PubMed] [Google Scholar]
- Atherton JC, Doyle A, Gee A, Green R, Gingell S, Nicholls F, Pempkowiak L, Plange-Rhule J, 1991. Lithium clearance: modification by the loop of Henle in man. J Physiol 437, 377–391. [DOI] [PMC free article] [PubMed] [Google Scholar]
- Biemesderfer D, Pizzonia J, Abu-Alfa A, Exner M, Reilly R, Igarashi P, Aronson PS, 1993. NHE3: a Na+/H+ exchanger isoform of renal brush border. Am J Physiol 265, F736–742. [DOI] [PubMed] [Google Scholar]
- Bihler I, Adamic S, 1967. The effect of lithium on intestinal sugar transport. Biochim Biophys Acta 135, 466–474. [DOI] [PubMed] [Google Scholar]
- Bobulescu IA, Moe OW, 2006. Na+/H+ exchangers in renal regulation of acid-base balance. Semin Nephrol 26, 334–344. [DOI] [PMC free article] [PubMed] [Google Scholar]
- Bochud M, Staessen JA, Woodiwiss A, Norton G, Maillard M, Burnier M, 2007. Context dependency of serum and urinary lithium: implications for measurement of proximal sodium reabsorption. Hypertension 49, e34. [DOI] [PubMed] [Google Scholar]
- Brown RB, Razzaque MS, 2015. Dysregulation of phosphate metabolism and conditions associated with phosphate toxicity. Bonekey Rep 4, 705. [DOI] [PMC free article] [PubMed] [Google Scholar]
- Busch S, Burckhardt BC, Siffert W, 1995. Expression of the human sodium/proton exchanger NHE-1 in Xenopus laevis oocytes enhances sodium/proton exchange activity and establishes sodium/lithium countertransport. Pflugers Arch 429, 859–869. [DOI] [PubMed] [Google Scholar]
- Calvo MS, Uribarri J, 2013. Contributions to total phosphorus intake: all sources considered. Semin Dial 26, 54–61. [DOI] [PubMed] [Google Scholar]
- Can A, Blackwell RA, Piantadosi SC, Dao DT, O’Donnell KC, Gould TD, 2011. Antidepressant-like responses to lithium in genetically diverse mouse strains. Genes Brain Behav 10, 434–443. [DOI] [PMC free article] [PubMed] [Google Scholar]
- Cannata-Andia JB, Martin KJ, 2016. The challenge of controlling phosphorus in chronic kidney disease. Nephrol Dial Transplant 31, 541–547. [DOI] [PubMed] [Google Scholar]
- Capuano P, Radanovic T, Wagner CA, Bacic D, Kato S, Uchiyama Y, St-Arnoud R, Murer H, Biber J, 2005. Intestinal and renal adaptation to a low-Pi diet of type II NaPi cotransporters in vitamin D receptor- and 1alphaOHase-deficient mice. Am J Physiol Cell Physiol 288, C429–434. [DOI] [PubMed] [Google Scholar]
- Christensen BM, Zuber AM, Loffing J, Stehle JC, Deen PM, Rossier BC, Hummler E, 2011. alphaENaC-mediated lithium absorption promotes nephrogenic diabetes insipidus. J Am Soc Nephrol 22, 253–261. [DOI] [PMC free article] [PubMed] [Google Scholar]
- Collazo R, Fan L, Hu MC, Zhao H, Wiederkehr MR, Moe OW, 2000. Acute regulation of Na+/H+ exchanger NHE3 by parathyroid hormone via NHE3 phosphorylation and dynamin-dependent endocytosis. J Biol Chem 275, 31601–31608. [DOI] [PubMed] [Google Scholar]
- Duhm J, Becker BF, 1977. Studies on the lithium transport across the red cell membrane. III. Factors contributing to the intraindividual variability of the in vitro Li+ distribution across the human red cell membrane. Pflugers Arch 368, 203–208. [DOI] [PubMed] [Google Scholar]
- Elmariah S, Gunn RB, 2003. Kinetic evidence that the Na-PO4 cotransporter is the molecular mechanism for Na/Li exchange in human red blood cells. Am J Physiol Cell Physiol 285, C446–456. [DOI] [PubMed] [Google Scholar]
- Fan L, Wiederkehr MR, Collazo R, Wang H, Crowder LA, Moe OW, 1999. Dual mechanisms of regulation of Na/H exchanger NHE-3 by parathyroid hormone in rat kidney. J Biol Chem 274, 11289–11295. [DOI] [PubMed] [Google Scholar]
- Fenton RA, Murray F, Dominguez Rieg JA, Tang T, Levi M, Rieg T, 2014. Renal phosphate wasting in the absence of adenylyl cyclase 6. J Am Soc Nephrol 25, 2822–2834. [DOI] [PMC free article] [PubMed] [Google Scholar]
- Fenton RA, Poulsen SB, de la Mora Chavez S, Soleimani M, Busslinger M, Dominguez Rieg JA, Rieg T, 2015. Caffeine-induced diuresis and natriuresis is independent of renal tubular NHE3. Am J Physiol Renal Physiol 308, F1409–1420. [DOI] [PMC free article] [PubMed] [Google Scholar]
- Fenton RA, Poulsen SB, de la Mora Chavez S, Soleimani M, Dominguez Rieg JA, Rieg T, 2017. Renal tubular NHE3 is required in the maintenance of water and sodium chloride homeostasis. Kidney Int 92, 397–414. [DOI] [PMC free article] [PubMed] [Google Scholar]
- Geddes JR, Miklowitz DJ, 2013. Treatment of bipolar disorder. Lancet 381, 1672–1682. [DOI] [PMC free article] [PubMed] [Google Scholar]
- Gerard L, Salmon-Ceron D, 1995. Pharmacology and clinical use of foscarnet. Int J Antimicrob Agents 5, 209–217. [DOI] [PubMed] [Google Scholar]
- Ghadirian AM, Lehmann HE, 1980. Neurological side effects of lithium: organic brain syndrome, seizures, extrapyramidal side effects, and EEG changes. Compr Psychiatry 21, 327–335. [DOI] [PubMed] [Google Scholar]
- Giles JJ, Bannigan JG, 1997. The effects of lithium on neurulation stage mouse embryos. Arch Toxicol 71, 519–528. [DOI] [PubMed] [Google Scholar]
- Girardi AC, Di Sole F, 2012. Deciphering the mechanisms of the Na+/H+ exchanger-3 regulation in organ dysfunction. Am J Physiol Cell Physiol 302, C1569–1587. [DOI] [PubMed] [Google Scholar]
- Gorboulev V, Schurmann A, Vallon V, Kipp H, Jaschke A, Klessen D, Friedrich A, Scherneck S, Rieg T, Cunard R, Veyhl-Wichmann M, Srinivasan A, Balen D, Breljak D, Rexhepaj R, Parker HE, Gribble FM, Reimann F, Lang F, Wiese S, Sabolic I, Sendtner M, Koepsell H, 2012. Na(+)-D-glucose cotransporter SGLT1 is pivotal for intestinal glucose absorption and glucose-dependent incretin secretion. Diabetes 61, 187–196. [DOI] [PMC free article] [PubMed] [Google Scholar]
- Grandjean EM, Aubry JM, 2009. Lithium: updated human knowledge using an evidence-based approach. Part II: Clinical pharmacology and therapeutic monitoring. CNS Drugs 23, 331–349. [DOI] [PubMed] [Google Scholar]
- Guelen PJ, Janssen TJ, De Witte TC, Vree TB, Benson K, 1992. Bioavailability of lithium from lithium citrate syrup versus conventional lithium carbonate tablets. Biopharm Drug Dispos 13, 503–511. [DOI] [PubMed] [Google Scholar]
- Hayslett JP, Kashgarian M, 1979. A micropuncture study of the renal handling of lithium. Pflugers Arch 380, 159–163. [DOI] [PubMed] [Google Scholar]
- Huls M, Kramers C, Levtchenko EN, Wilmer MJ, Dijkman HB, Kluijtmans LA, van der Hoorn JW, Russel FG, Masereeuw R, 2007. P-glycoprotein-deficient mice have proximal tubule dysfunction but are protected against ischemic renal injury. Kidney Int 72, 1233–1241. [DOI] [PubMed] [Google Scholar]
- Kersten L, Braunlich H, 1987. Influence of diuretics on renal lithium excretion and tissue distribution of some cations in saline loaded young and adult rats. Biomed Biochim Acta 46, 225–236. [PubMed] [Google Scholar]
- Kirchner KA, 1987. Lithium as a marker for proximal tubular delivery during low salt intake and diuretic infusion. Am J Physiol 253, F188–196. [DOI] [PubMed] [Google Scholar]
- Kobayashi Y, Pang T, Iwamoto T, Wakabayashi S, Shigekawa M, 2000. Lithium activates mammalian Na+/H+ exchangers: isoform specificity and inhibition by genistein. Pflugers Arch 439, 455–462. [DOI] [PubMed] [Google Scholar]
- Lanaspa MA, Caldas YA, Breusegem SY, Andres-Hernando A, Cicerchi C, Levi M, Sorribas V, 2013. Inorganic phosphate modulates the expression of the NaPi-2a transporter in the trans-Golgi network and the interaction with PIST in the proximal tubule. Biomed Res Int 2013, 513932. [DOI] [PMC free article] [PubMed] [Google Scholar]
- Lau K, Bourdeau JE, 1995. Parathyroid hormone action in calcium transport in the distal nephron. Curr Opin Nephrol Hypertens 4, 55–63. [DOI] [PubMed] [Google Scholar]
- Ledoussal C, Lorenz JN, Nieman ML, Soleimani M, Schultheis PJ, Shull GE, 2001. Renal salt wasting in mice lacking NHE3 Na+/H+ exchanger but not in mice lacking NHE2. Am J Physiol Renal Physiol 281, F718–727. [DOI] [PubMed] [Google Scholar]
- Manuelian CL, Albanell E, Rovai M, Caja G, Guitart R, 2015. Kinetics of lithium as a lithium chloride dose suitable for conditioned taste aversion in lactating goats and dry sheep. J Anim Sci 93, 562–569. [DOI] [PubMed] [Google Scholar]
- Miracle CM, Rieg T, Blantz RC, Vallon V, Thomson SC, 2007. Combined effects of carbonic anhydrase inhibitor and adenosine A1 receptor antagonist on hemodynamic and tubular function in the kidney. Kidney Blood Press Res 30, 388–399. [DOI] [PMC free article] [PubMed] [Google Scholar]
- Moe SM, Zidehsarai MP, Chambers MA, Jackman LA, Radcliffe JS, Trevino LL, Donahue SE, Asplin JR, 2011. Vegetarian compared with meat dietary protein source and phosphorus homeostasis in chronic kidney disease. Clin J Am Soc Nephrol 6, 257–264. [DOI] [PMC free article] [PubMed] [Google Scholar]
- Olesen OV, Schou M, Thomsen K, 1976. Administration of lithium to rats by different routes. Neuropsychobiology 2, 134–138. [DOI] [PubMed] [Google Scholar]
- Parker MD, Myers EJ, Schelling JR, 2015. Na+-H+ exchanger-1 (NHE1) regulation in kidney proximal tubule. Cell Mol Life Sci 72, 2061–2074. [DOI] [PMC free article] [PubMed] [Google Scholar]
- Petersen V, Hvidt S, Thomsen K, Schou M, 1974. Effect of prolonged thiazide treatment on renal lithium clearance. Br Med J 3, 143–145. [DOI] [PMC free article] [PubMed] [Google Scholar]
- Portale AA, Halloran BP, Murphy MM, Morris RC Jr., 1986. Oral intake of phosphorus can determine the serum concentration of 1,25-dihydroxyvitamin D by determining its production rate in humans. J Clin Invest 77, 7–12. [DOI] [PMC free article] [PubMed] [Google Scholar]
- Poulsen SB, Kristensen TB, Brooks HL, Kohan DE, Rieg T, Fenton RA, 2017. Role of adenylyl cyclase 6 in the development of lithium-induced nephrogenic diabetes insipidus. JCI Insight 2, e91042. [DOI] [PMC free article] [PubMed] [Google Scholar]
- Poust RI, Mallinger AG, Mallinger J, Himmelhoch JM, Hanin I, 1976. Pharmacokinetics of lithium in human plasma and erythrocytes. Psychopharmacol Commun 2, 91–103. [PubMed] [Google Scholar]
- Rieg T, Richter K, Osswald H, Vallon V, 2004. Kidney function in mice: thiobutabarbital versus alpha-chloralose anesthesia. Naunyn Schmiedebergs Arch Pharmacol 370, 320–323. [DOI] [PubMed] [Google Scholar]
- Rieg T, Steigele H, Schnermann J, Richter K, Osswald H, Vallon V, 2005. Requirement of intact adenosine A1 receptors for the diuretic and natriuretic action of the methylxanthines theophylline and caffeine. J Pharmacol Exp Ther 313, 403–409. [DOI] [PubMed] [Google Scholar]
- Rosensweig NS, Cocco AE, Hendrix TR, 1965. A comparison of the effect of sodium and lithium on the absorption of glucose and xylose in vivo. Biochim Biophys Acta 109, 312–313. [DOI] [PubMed] [Google Scholar]
- Rosenthal RC, Koritz GD, Davis LE, 1986. Pharmacokinetics of lithium in the dog. J Vet Pharmacol Ther 9, 81–87. [DOI] [PubMed] [Google Scholar]
- Sabbagh Y, Giral H, Caldas Y, Levi M, Schiavi SC, 2011. Intestinal phosphate transport. Adv Chronic Kidney Dis 18, 85–90. [DOI] [PMC free article] [PubMed] [Google Scholar]
- Salata R, Klein I, 1987. Effects of lithium on the endocrine system: a review. J Lab Clin Med 110, 130–136. [PubMed] [Google Scholar]
- Schultheis PJ, Clarke LL, Meneton P, Miller ML, Soleimani M, Gawenis LR, Riddle TM, Duffy JJ, Doetschman T, Wang T, Giebisch G, Aronson PS, Lorenz JN, Shull GE, 1998. Renal and intestinal absorptive defects in mice lacking the NHE3 Na+/H+ exchanger. Nat Genet 19, 282–285. [DOI] [PubMed] [Google Scholar]
- Shalmi M, Bech Laursen J, Plange-Rhule J, Christensen S, Atherton J, Bie P, 1992. Lithium clearance in dogs: effects of water loading, amiloride and lithium dosage. Clin Sci (Lond) 82, 635–640. [DOI] [PubMed] [Google Scholar]
- Steele TH, Dudgeon KL, Larmore CK, 1976. Pharmacological characterization of lithium reabsorption in the rat. J Pharmacol Exp Ther 196, 188–193. [PubMed] [Google Scholar]
- Steele TH, Manuel MA, Newton M, Boner G, 1975. Renal lithium reabsorption in man: physiologic and pharmacologic determinants. Am J Med Sci 269, 349–363. [DOI] [PubMed] [Google Scholar]
- Tenenhouse HS, Martel J, Gauthier C, Segawa H, Miyamoto K, 2003. Differential effects of Npt2a gene ablation and X-linked Hyp mutation on renal expression of Npt2c. Am J Physiol Renal Physiol 285, F1271–1278. [DOI] [PubMed] [Google Scholar]
- Terao T, 2015. Is lithium potentially a trace element? World J Psychiatry 5, 1–3. [DOI] [PMC free article] [PubMed] [Google Scholar]
- Thomas L, Bettoni C, Knopfel T, Hernando N, Biber J, Wagner CA, 2017. Acute Adaption to Oral or Intravenous Phosphate Requires Parathyroid Hormone. J Am Soc Nephrol 28, 903–914. [DOI] [PMC free article] [PubMed] [Google Scholar]
- Thomsen K, Leyssac PP, 1986. Acute effects of various diuretics on lithium clearance. Studies in rats on medium and low sodium diet. Ren Physiol 9, 1–8. [PubMed] [Google Scholar]
- Thomsen K, Olesen OV, 1984. Renal lithium clearance as a measure of the delivery of water and sodium from the proximal tubule in humans. Am J Med Sci 288, 158–161. [DOI] [PubMed] [Google Scholar]
- Timmer RT, Sands JM, 1999. Lithium intoxication. J Am Soc Nephrol 10, 666–674. [DOI] [PubMed] [Google Scholar]
- Unwin RJ, Walter SJ, Shirley DG, 1994. Lithium reabsorption in perfused loops of Henle: effects of perfusion rate and bumetanide. Am J Physiol 266, F806–812. [DOI] [PubMed] [Google Scholar]
- Uwai Y, Arima R, Takatsu C, Furuta R, Kawasaki T, Nabekura T, 2014. Sodium-phosphate cotransporter mediates reabsorption of lithium in rat kidney. Pharmacol Res 87, 94–98. [DOI] [PubMed] [Google Scholar]
- Uwai Y, Kawasaki T, Nabekura T, 2016. Foscarnet, an inhibitor of the sodium-phosphate cotransporter NaPi-IIa, inhibits phosphorylation of glycogen synthase kinase-3beta by lithium in the rat kidney cortex. Drug Metab Pharmacokinet 31, 256–259. [DOI] [PubMed] [Google Scholar]
- Uwai Y, Kawasaki T, Nabekura T, 2018. Nonlinear disposition of lithium in rats and saturation of its tubular reabsorption by the sodium-phosphate cotransporter as a cause. Biopharm Drug Dispos 39, 83–87. [DOI] [PubMed] [Google Scholar]
- Vallon V, Hummler E, Rieg T, Pochynyuk O, Bugaj V, Schroth J, Dechenes G, Rossier B, Cunard R, Stockand J, 2009. Thiazolidinedione-induced fluid retention is independent of collecting duct alphaENaC activity. J Am Soc Nephrol 20, 721–729. [DOI] [PMC free article] [PubMed] [Google Scholar]
- Vallon V, Platt KA, Cunard R, Schroth J, Whaley J, Thomson SC, Koepsell H, Rieg T, 2011. SGLT2 mediates glucose reabsorption in the early proximal tubule. J Am Soc Nephrol 22, 104–112. [DOI] [PMC free article] [PubMed] [Google Scholar]
- Veiras LC, Girardi ACC, Curry J, Pei L, Ralph DL, Tran A, Castelo-Branco RC, Pastor-Soler N, Arranz CT, Yu ASL, McDonough AA, 2017. Sexual Dimorphic Pattern of Renal Transporters and Electrolyte Homeostasis. J Am Soc Nephrol 28, 3504–3517. [DOI] [PMC free article] [PubMed] [Google Scholar]
- Wagner CA, Hernando N, Forster IC, Biber J, 2014. The SLC34 family of sodium-dependent phosphate transporters. Pflugers Arch 466, 139–153. [DOI] [PubMed] [Google Scholar]
- Ware K, Tillery E, Linder L, 2016. General pharmacokinetic/pharmacodynamic concepts of mood stabilizers in the treatment of bipolar disorder. Ment Health Clin 6, 54–61. [DOI] [PMC free article] [PubMed] [Google Scholar]
- Watts BA 3rd, Good DW, 1999. Hyposmolality stimulates apical membrane Na(+)/H(+) exchange and HCO(3)(−) absorption in renal thick ascending limb. J Clin Invest 104, 1593–1602. [DOI] [PMC free article] [PubMed] [Google Scholar]
- Wood AJ, Goodwin GM, De Souza R, Green AR, 1986. The pharmacokinetic profile of lithium in rat and mouse; an important factor in psychopharmacological investigation of the drug. Neuropharmacology 25, 1285–1288. [DOI] [PubMed] [Google Scholar]
- Wraae O, 1978. The pharmacokinetics of lithium in the brain, cerebrospinal fluid and serum of the rat. Br J Pharmacol 64, 273–279. [DOI] [PMC free article] [PubMed] [Google Scholar]
- Yang LE, Maunsbach AB, Leong PK, McDonough AA, 2004. Differential traffic of proximal tubule Na+ transporters during hypertension or PTH: NHE3 to base of microvilli vs. NaPi2 to endosomes. Am J Physiol Renal Physiol 287, F896–906. [DOI] [PubMed] [Google Scholar]
- Zhang Y, Norian JM, Magyar CE, Holstein-Rathlou NH, Mircheff AK, McDonough AA, 1999. In vivo PTH provokes apical NHE3 and NaPi2 redistribution and Na-K-ATPase inhibition. Am J Physiol 276, F711–719. [DOI] [PubMed] [Google Scholar]
- Zhuo JL, Li XC, 2013. Proximal nephron. Compr Physiol 3, 1079–1123. [DOI] [PMC free article] [PubMed] [Google Scholar]