

Abstract
Background
To improve cure rates for neuroblastoma (NB), it is important and necessary to evaluate therapy response. Our investigation focuses on using plasma cell free DNA (cfDNA) as a biomarker to determine tumor burden and minimal residual disease (MRD) of NB patients during chemotherapy.
Methods
Total 58 NB patients were recruited from July 2016 to December 2017. Therapy regime and risk classification were based on COG standard and BCH‐NB‐2007 protocol. RECIST study was used to judge response to therapy at the end of fourth cycle of chemotherapy (CC4) and maintenance stage (MS) respectively. Serial quantifications of cfDNA, NSE, and LDH were examined at four stages, including newly diagnosed, second and CC4, and maintenance.
Results
During early chemotherapy, 65.5% of NB kids responded well. Consistently, cfDNA, NSE, and LDH levels were down‐regulated in NB patients with partial remission (PR) compared to those with stable disease (SD). In both training and predicting sets, the levels of cfDNA were significantly comparable between PR and SD only at CC4 stage. To predict the insufficient response to early chemotherapy, the optimal AUC value of cfDNA was 0.732 and 0.747 in training and predicting sets respectively, with a sensitivity of 63.2% and 80% specificity at 11.59 ng/ml and a sensitivity of 68.4% and 90% specificity at 10.35 ng/ml. At MS, responded NB patients were slightly increased up to 70%. This evaluation was confirmed by further decrease in cfDNA and NSE levels during intermediate chemotherapy in comparison with early stage.
Conclusion
The dynamic change of cfDNA was considered as a surrogate biomarker to evaluate tumor burden and MRD of NB during early and intermediate therapy periods.
Keywords: dynamic changes, minimal residual disease, neuroblastoma, plasma cell free DNA, therapy response
1. INTRODUCTION
Neuroblastoma (NB) is the most common extracranial solid tumor in children, and is notable for its broad range of clinical behaviors.1 Although progress has also been made in the treatment for high‐risk NB, the outcome for patients with this clinical phenotype still remains poor, with long‐term survival rates of 50%.1, 2, 3 This low survival rate is mainly due to tumor relapse or regrowth caused by the activation of chemoresistant minimal residual disease (MRD).4, 5 To evaluate the therapeutic response and disease status of NB patients, the clinical evaluation of a precise diagnosis of MRD by molecular pathology in NB patients remains to be established.
Plasma cell free DNA (cfDNA) detection has been widely studied in malignant tumors but not popular in pediatric tumors,6, 7, 8, 9 such as NB. It is important and necessary to determine whether plasma cfDNA could serve as a biomarker for NB. Based on others reports, it is feasible to introduce plasma cfDNA to evaluate the tumor burden in NB patients.7, 10, 11 Our previous work has demonstrated that cfDNA levels could be considered as tumor burden biomarker in NB.12 Present investigation will focus on evaluating cfDNA as a biomarker for monitoring NB patients’ response to early stage and intermediate stage of chemotherapy.
2. MATERIALS AND METHODS
2.1. Patients
Fifty‐eight eligible patients with newly diagnosed NB were recruited in the Hematology Oncology Center, Beijing Children's Hospital (BCH) between July 2016 and December 2017. Upon enrollment, all NB kids were diagnosed and mostly classified into high risk (HR) or intermediate risk based on the COG (Children's Oncology Group) standard. In addition, all these NB kids did not receive any treatment. The chemotherapy regime was guided by BCH‐2007‐NB. All newly diagnosed NB children would receive chemotherapy before surgery. The first 4 cycles were early chemotherapy. The fourth cycle of chemotherapy (CC4) stage is the first key time window to evaluate the response to chemotherapy before surgery. According to the evaluation result at CC4 stage, surgery operation would be done in majority of NB patients. After surgery, NB patients with low or medium risk would be treated with 2‐3 cycles of chemotherapy. In addition, some NB patients with medium risk would be prescribed with radiotherapy and retinoic acid in case of poor pathological prognosis. NB patients with high risk would be treated with continued chemotherapy, autologous stem cell transplantation, local radiotherapy, and retinoic acid after surgery. The period from the end of CC4 to the beginning maintenance was called the intermediate stage of chemotherapy. Maintenance stage (MS) is the second key time window to evaluate the response to therapy after surgery and postsurgery chemotherapy. At MS, there were 40 NB children who qualified with data requirement.
Two rounds of RECIST (Response Evaluation Criteria in Solid Tumors) were done at CC4 and MS, respectively. According to RECIST score, NB children were divided into complete remission (CR), partial remission (PR), stable disease (SD), and progressive disease (PD). From enrollment to MS, serial cfDNA levels were measured at newly diagnosed, second cycle of chemotherapy, CC4, and MS respectively. Chronologically, former 19 PR and 10 SD patients recruited into training set, and latter 19 PR and 10 SD patients recruited into predicting set.
This research and the BCH‐NB‐2007 protocol were approved by the Beijing Children's Hospital Institutional Ethics Committee (No. 2016‐65). Informed consent was obtained from the parents or guardians of each patient according to the Declaration of Helsinki.
2.2. Diagnostics and staging systems
Microscopic examinations of bone marrow aspirates and biopsies were performed to determine the presence of NB cells. Serum tumor markers such as lactate dehydrogenase (LDH) and neuron‐specific enolase (NSE) levels were detected for the diagnosis and monitoring of NB. The defining characteristics of HR‐NB include an age of more than 18 months, metastases (International Neuroblastoma Staging System, INSS)‐IV or MYCN gene amplification. The BCH‐NB‐2007‐HR protocol was based on the Hong Kong Pediatric Hematology and Oncology Study Group (HKPHOSG).13 HR‐NB treatment regimens include 5–7 cycles of induction chemotherapy and surgery, consolidation therapy with autologous hematopoietic stem‐cell rescue and irradiation, and maintenance therapy to treat minimal residual disease. The BCH‐NB‐2007‐LR, MR protocol based on European intermediate and low risk NB protocol, includes 4–6 cycles of chemotherapy and surgery, increase in local radiotherapy, and maintenance therapy for some MR‐NB with unfavorable histologic types.
2.3. Quantification of cfDNA
To calculate the absolute cfDNA levels as previous study described,12 plasma samples were separated at 10 000 g for 3 min from venous blood with EDTA before DNA purification. DNA was purified from 200 μl plasma and eluted by 50 μl elution buffer using QIAamp DNA Blood Mini Kits (Qiagen, Valencia, CA) according to the manufacturer's instructions. The total amount of plasma DNA was represented by the qPCR result with LINE‐1 (long interspersed nuclear element 1) 79 bp primers. A serially diluted standardized solution of human genomic DNA (Thermo Fisher Scientific, Waltham, MA) was used to create a reference standard curve. The concentration of cfDNA in each sample was calculated according to the standard curve. The qPCR reactions were performed in triplicate, and mean values of the triplicates were used for further analysis. The qPCR reaction mixture was 10 μl and contained 2 μl of the eluted DNA, 1 μl (final concentration 0.2 μm) of each forward and reverse primer of LINE‐1 79, 5 μl of UltraSYBR Mixture (Cwbiotech, Beijing, China), and 1 μl of double‐distilled water. Cycling conditions were 1 min at 95°C, 35 cycles of 95°C for 8 s and 60°C for 15 s. Each plate contained a plasma DNA sample, a negative control (water template), and seven serially diluted standard DNA solutions (10 ng/ul, 5 ng/ul, 1 ng/ul, 0.5 ng/ul, 0.25 ng/ul, 0.0625 ng/ul, 0.015 ng/ul).
2.4. Statistics
Statistical analysis was performed in R statistical environment (R‐version 3.4.0) and included Mann‐Whitney U tests, Wilcoxon matched‐pairs signed rank test, boxplots, and ROC analysis (Bioconductor ROC package). A P‐value lower than 0.05 was considered as statistically significant.
3. RESULTS
3.1. Clinical characters of NB
From the very beginning, 58 pediatric patients aged 3‐148 months (median, 35 months) with newly diagnosed NB were enrolled. All these NB kids were treated with chemotherapy at least for CC4. As shown in Table 1, children aged from 18 to 60 months accounted for 46.6% of the patients. Male patients were as many as female. Expectedly, 77.6% of primary tumor sites were detected in the retroperitoneal and adrenal region while other locations accounted for only 22.4%, including the thorax and others. In addition, 72.4% NB were classified into HR (high risk) while 10.3% into MR (medium risk), 17.3% into LR (low risk). Approximately, 56.9% of the NB patients had 1 or 2 metastatic sites, while 29.3% had 3 sites. NB with metastasis in more than 3 organs comprised 13.2% of the patients. The most frequent metastatic sites were bone, bone marrow, and distant lymph nodes, which occupied 56.9%, 62.1%, and 43.1%, respectively.
Table 1.
Demographic and clinical features of enrolled NB (N = 58)
| Characteristics | Total cases, N (%) |
|---|---|
| Age (months) | |
| <18 | 20 (34.5) |
| ≥18 and <60 | 27 (46.6) |
| ≥60 | 11 (18.9) |
| Sex | |
| Female | 29 (50.0) |
| Male | 29 (50.0) |
| Primary site | |
| Abdomen | 45 (77.6) |
| Thorax | 8 (13.8) |
| Other | 5 (8.6) |
| Tumor size | |
| ≥8 cm | 29 (50) |
| <8 cm | 29 (50) |
| Tumor stage | |
| II/III | 5 (8.6) |
| IV | 53 (91.4) |
| Risk | |
| HR | 42 (72.4) |
| MR | 6 (10.3) |
| LR | 10 (17.3) |
| MYCN gene | |
| Amplification | 11 (19.0) |
| Nonamplification | 47 (81.0) |
| Total cfDNA | |
| ≥120 ng/ml | 29 (50) |
| <120 ng/ml | 29 (50) |
| NSE (ng/ml) | |
| <370 | 37 (63.8) |
| ≥370 | 21 (36.2) |
| LDH (IU/L) | |
| ≤500 | 27 (46.6) |
| >500 and <1500 | 23 (39.6) |
| ≥1500 | 8 (13.8) |
| Metastatic site | |
| Bone | 33 (56.9) |
| Bone marrow | 36 (62.1) |
| Distant lymph node | 25 (43.1) |
| Liver | 11 (19.0) |
| Central nervous system | 7 (12.1) |
| Number of organs with metastasis | |
| <3 | 33(56.9) |
| =3 | 17(29.3) |
| >3 | 8(13.2) |
| RECIST | |
| PR | 38 (65.5) |
| SD | 20 (34.5) |
NB: neuroblastoma, LDH: lactate dehydrogenase, NSE: neuron‐specific enolase, PR: partial remission, SD: stable disease.
According to the clinical risk assessment, it seemed that the majority of NB was severe in clinic. MYCN copies were amplified in 19% of patients. By calculating maximum diameter, tumor size distribution was from 1.5 to 21.8 cm and the median size was 7.85 cm. These NB patients’ tumor size distributed evenly in the range of less than 8 cm or more than 8 cm. The median of cfDNA levels was 120 ng/ml. According to the clinical serum test, more NB patients showed a NSE level of below 370 ng/ml (63.8%) or a LDH level of lower than 1500 IU/L (46.6%). After CC4, based on the RECIST score, NB patients with PR (partial remission) accounted for 65.5%, and with SD (stable disease) 34.5%, respectively. In other words, around 65.5% NB patients responded well to early chemotherapy.
3.2. cfDNA performance in various response groups of NB during early stage of chemotherapy
During the early stage of chemotherapy, the kinetic cfDNA levels were recorded at three stages, newly diagnosed (ND), chemotherapy cycle 2 (CC2), and CC4. In training set, the significant difference of cfDNA levels was only found at CC4 stage (Table 2). The cfDNA quantification of PR patients (10.6 ng/ml) was significantly lower than that of SD patient (18.2 ng/ml) at CC4 stage (P < 0.05, Table 2). At ND and CC2 stages, cfDNA levels of PR patients were lower than that of SD patients, but no significant difference (P > 0.05, Table 2). Moreover, the decreased percentage of cfDNA did not present significantly at all three stages (P > 0.05, Table 2).
Table 2.
Plasma cfDNA levels in various response groups of NB during early stage of chemotherapy
| Characteristics | Subjects n (PR/SD) | PR (min‐max ng/ml) | SD (min‐max ng/ml) | P‐value a PR vs SD |
|---|---|---|---|---|
| ND | Training (19/10) | 69.9 (2.2 to 731.0) | 372.1 (8.7 to 2068.9) | 0.376 |
| Predicting (19/10) | 115.3 (8.0 to 3550) | 270.5 (9.2 to 1448.6) | 0.150 | |
| CC2 | Training (19/10) | 19.5 (7.0 to 115.0) | 37.0 (10.8 to 202.4) | 0.194 |
| Predicting (19/10) | 14.7 (4.7 to 132.9) | 28.9 (7.9 to 171.1) | 0.228 | |
| CC4 | Training (19/10) | 10.6 (4.6 to 73.4) | 18.2 (8.6 to 119.4) | 0.044 |
| Predicting (19/10) | 8.0 (4.1 to 62.4) | 18.0 (7.8 to 142. 9) | 0.031 | |
| ND‐CC2 decreased % | Training (19/10 | 61.1 (99.6 to 329.9) | 72.5 (99.4 to 614.9) | 0.800 |
| Predicting (19/10) | 80.8 (99.6 to 614.5) | 85.2 (99.5 to 179.0) | 0.665 | |
| ND‐CC4 decreased % | Training (19/10) | 69.9 (99.9 to 221.4) | 92.0 (99.0 to 850.1) | 0.570 |
| Predicting (19/10) | 90.9 (99.9 to 91.6) | 90.1 (99.3 to 16.7) | 0.800 | |
| CC2‐CC4 decreased % | Training (19/10) | 34.9 (94.3 to 6.0) | 2.9 (94.2 to 177.9) | 0.321 |
| Predicting (19/10) | 28.5 (93.5 to 197.1) | 31.8 (94.8 to 112.1). | 0.800 |
P < 0.05 was considered as statistically significant (bold).
presented Mann‐Whitney U Test.
In predicting set, cfDNA level of PR patients (8.0 ng/ml) was significantly lower than that of SD patients (18.0 ng/ml) at CC4 stage (P < 0.05, Table 2). There was no significant difference between PR and SD groups at ND and CC2 stages (P > 0.05, Table 2). In addition, decreased percentage of cfDNA had no significant difference at all three stages (P > 0.05, Table 2). The results of both training and predicting sets indicated that the significant down‐regulation of cfDNA in PR group was associated with well response to present chemotherapeutic regime at CC4 stage (the last stage of early chemotherapy).
3.3. NSE and LDH performance in various response groups of NB during early stage of chemotherapy
In parallel, two serum biomarkers, NSE and LDH, were measured by blood analysis in NB children at ND, CC2 and CC4. In training set, NSE measurement had no significant difference between PR and SD patients at all three stages (P > 0.05, Table 3). The decline of NSE showed no statistical difference at all three stages too (P > 0.05, Table 3). In predicting set, the differences of NSE levels was significantly distinct at CC4 stage between PR and SD patients, 19.1 ng/ml vs 25.9 ng/ml, (P < 0.05, Table 3). No significant differences were presented at ND and CC2 stages (Table 3). Consistently, the percentage of NSE decline was significantly different between PR and SD patients at CC4 stage (35.3% vs 20%, Table 3), but not at ND and CC2 stages.
Table 3.
Serum NSE alternation in various response groups of NB during early stage of chemotherapy
| Characteristics | Subjects n (PR/SD) | PR (min‐max ng/ml) | SD (min‐max ng/ml) | P‐value a PR vs SD |
|---|---|---|---|---|
| ND | Training (19/10) | 233.0 (19.3‐370.0) | 269.5 (62.1‐370.0) | 0.728 |
| Predicting (19/10) | 221.8 (17.9‐370.0) | 370.0 (24.6‐370.0) | 0.313 | |
| CC2 | Training (19/10) | 28.1 (13.8‐107.4) | 28.7(21.6‐258.0) | 0.463 |
| Predicting (19/10) | 26.1 (12.9‐134.9) | 36.2 (10.3‐218.0) | 0.955 | |
| CC4 | Training (19/10) | 22.0 (10.7‐47.9) | 22.4 (13.7‐80.7) | 0.396 |
| Predicting (19/10) | 19.1 (8.7‐45.1) | 25.9 (15.8‐157.0) | 0.046 | |
| ND‐CC2 decreased % | Training (19/10) | 76.7 (28.5‐95.9) | 79.4 (30.3‐94.1) | 0.925 |
| Predicting (19/10) | 77.9 (−45.8‐93.2) | 85.4 (0.0‐97.2) | 0.855 | |
| ND‐CC4 decreased % | Training (19/10) | 87.1 (22.8‐96.3) | 87.5 (51.7‐96.3) | 0.976 |
| Predicting (19/10) | 87.7 (16.8‐96.9) | 85.6 (−7.3‐95.7) | 0.392 | |
| CC2‐CC4 decreased % | Training (19/10) | 31.4 (−27.5‐63.5) | 31.0 (−20.8‐83.5) | 0.977 |
| Predicting (19/10) | 35.3 (−130.1‐85.5) | 20.7 (−169.9‐59.3) | 0.049 |
P < 0.05 was considered as statistically significant (bold).
presented Mann‐Whitney U Test.
Unlike NSE, LDH levels had no significant difference between PR and SD patients at any stages (Table 4). The LDH performance suggested that LDH could not monitor therapy response during early chemotherapy stage.
Table 4.
Serum LDH alternation in various response groups of NB during stage of chemotherapy
| Characteristics | Subjects n (PR/SD) | PR (min‐max IU/L) | SD (min‐max IU/L) | P‐Valuea PR vs SD |
|---|---|---|---|---|
| ND | Training (19/10) | 497 (177‐1893) | 568.5 (301‐5540) | 0.454 |
| Predicting (19/10) | 447 (251‐3738) | 575.5 (254‐2894) | 0.396 | |
| CC2 | Training (19/10) | 335 (163‐524) | 367(186‐1279) | 0.207 |
| Predicting (19/10) | 358 (200‐646) | 359 (171‐663) | 0.925 | |
| CC4 | Training (19/10) | 264 (164‐417 | 332 (169‐440) | 0.282 |
| Predicting (19/10) | 277 (163‐667) | 284.5 (200‐559) | 0.884 | |
| ND‐CC2 decreased % | Training (19/10) | 44.8 (−33.3‐88.0) | 33.0 (−5.3‐94.3) | 0.855 |
| Predicting (19/10) | 33.1 (−154.3‐89.9) | 26.1 (−31.1‐90.0) | 0.732 | |
| ND‐CC4 decreased % | Training (19/10) | 50.0 (−21.6‐89.4) | 45.1 (−22.6‐95.9) | 0.941 |
| Predicting (19/10) | 28.7 (−122.7‐94.2) | 55.5 (6.0‐92.6) | 0.376 | |
| CC2‐CC4 decreased % | Training (19/10) | 9.0 (−49.7‐55.2) | 23.0 (−34.7‐68.3) | 0.329 |
| Predicting (19/10) | 13.0 (−156.4‐61.3) | 21.8 (−43.3‐44.4) | 0.812 |
presented Mann‐Whitney U Test.
3.4. Performance of cfDNA and NSE levels for predicting insufficient response to chemotherapy
The performance of cfDNA at CC4 stage showed consistent difference between PR and SD patients in both training and predicting sets (Tables 2), while NSE examination only performed well at CC4 stage in predicting set (Table 3). Next, ROC (Receiver operation curve) curves were plotted to test whether the two factors had potential to predict insufficient response to chemotherapy during early stage. In training set, the ROC analysis of cfDNA levels at all three stages was able to predict insufficient response (SD) to chemotherapy with a similar sensitivity and specificity (Figure 1A). The optimal AUC (area under ROC curve) of cfDNA was 0.732 with a sensitivity of 63.2% at 80.0% specificity at 11.585 ng/ml at CC4 stages, (Figure 1B). In predicting set, the optimal AUC of cfDNA was 0.747 with a sensitivity of 68.4% at 90.0% specificity at 10.35 ng/ml at CC4 (Figure 1B). As for NSE, the optimal AUC was 0.732 at cutoff value of 21.8 ng/ml with a sensitivity of 68.4% at 80.0% specificity at CC4 stage in predicting set (Figure 1C,D).
Figure 1.
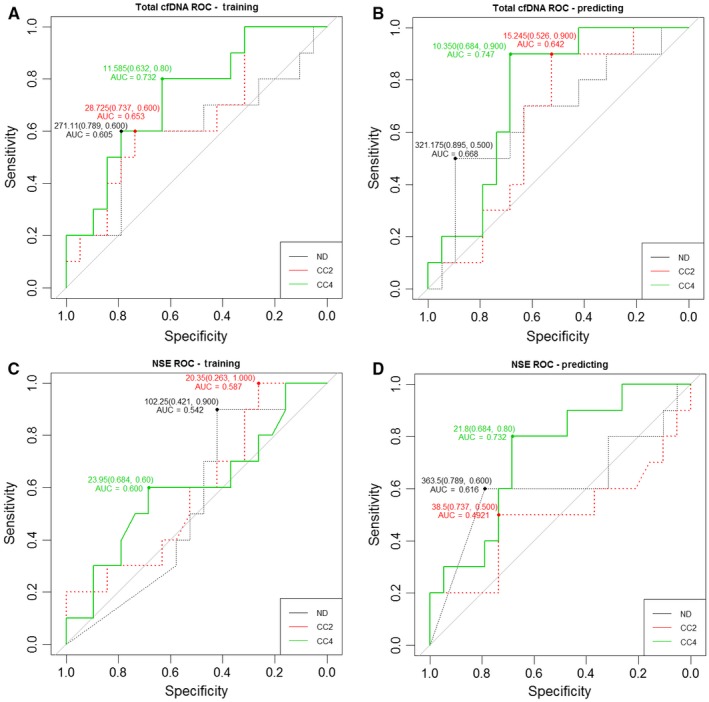
Receiver‐operating curves (ROC) for predicting insufficient response to early chemotherapy in NB patients by cfDNA and NSE levels. The area under the ROC curve (AUC) of total plasma cfDNA was analyzed both in training set (A) and predicting set (B), respectively. The AUC of NSE was analyzed both in training set (C) and predicting set (D), respectively
3.5. cfDNA, NSE, and LDH performance in maintenance stage
To some extent, cfDNA levels could be distinguished from response and insufficient response during the early stage of chemotherapy in NB patients. Furthermore, our study recorded cfDNA levels of NB kids at the MS. At this time window, all NB patients were re‐scored based on RECIST. Very interestingly, the well responded NB patients were 70% (Table 5), a slightly higher than it at CC4 stage. As expected, all three factors, including cfDNA, NSE and LDH, had no significant differences between PR and SD groups (Table 6). Furthermore, the statistical difference of cfDNA levels was analyzed between CC4 and MS. Under expectation, the level of cfDNA in MS (11.25 ng/ml) was significantly lower than it in CC4 (13.80 ng/ml) (P = 0.0246, <0.05, Figure 2). At the same time, NSE level was significantly down‐regulated in MS in comparison to CC4, 21.3 ng/ml vs 24 ng/ml, (P = 0.0116, <0.05), (Figure 3). But LDH level did not show significant changes between NB patients at MS and CC4 stages, 255.5 IU/L vs 272 IU/L, P = 0.1528 (>0.05), (Figure 4).
Table 5.
Demographic and clinical features of patients at maintenance stage (N = 40)
| Characteristics | Total cases, N (%) |
|---|---|
| Age (months) | |
| <18 | 13 (32.5) |
| ≥18 and <60 | 21 (52.5) |
| ≥60 | 6 (15) |
| Sex | |
| Female | 19 (47.5) |
| Male | 21 (52.5) |
| RECIST | |
| PR | 28 (70.0) |
| SD | 12 (30.0) |
Table 6.
Blood biomarkers performance in NB with maintenance stage (N = 40)
| PR | SD | P‐valuea | |
|---|---|---|---|
| Subjects n | 28 | 12 | |
| cfDNA ng/mL | 11.25(1.71‐30.35) | 11.4(3.65‐28.81) | 0.871 |
| CC4‐MS % decrease | 3.45(−206.13‐89.01) | 52.25(−88.13‐88.43) | 0.1361 |
| NSE ng/ml | 20.55(10.4‐46.2) | 21.8(10.0‐25.1) | 0.7231 |
| LDH IU/L | 270(150‐359) | 219.5(162‐416) | 0.262 |
Mann‐Whitney U Test.
Figure 2.
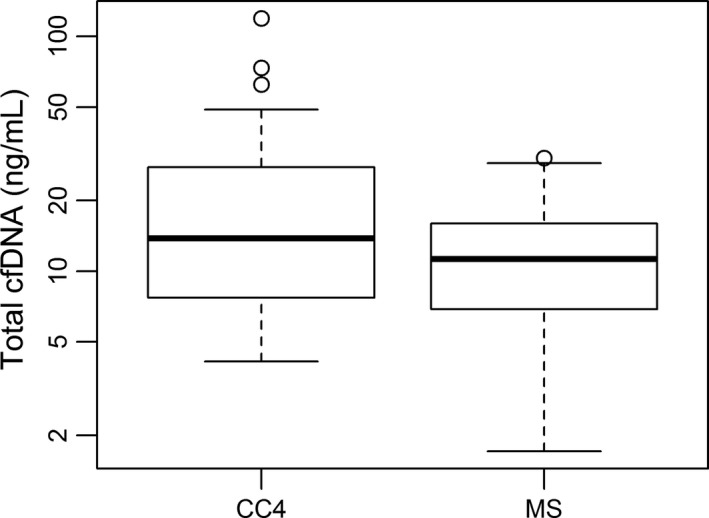
Comparison of cfDNA level between NB patients at CC4 and MS (maintenance stage). Box plots for comparison of cfDNA levels in NB patients between CC4 (13.80 ng/ml) and MS (11.25 ng/ml) was significant (P = 0.02, <0.05). (Wilcoxon matched‐pairs signed rank test)
Figure 3.
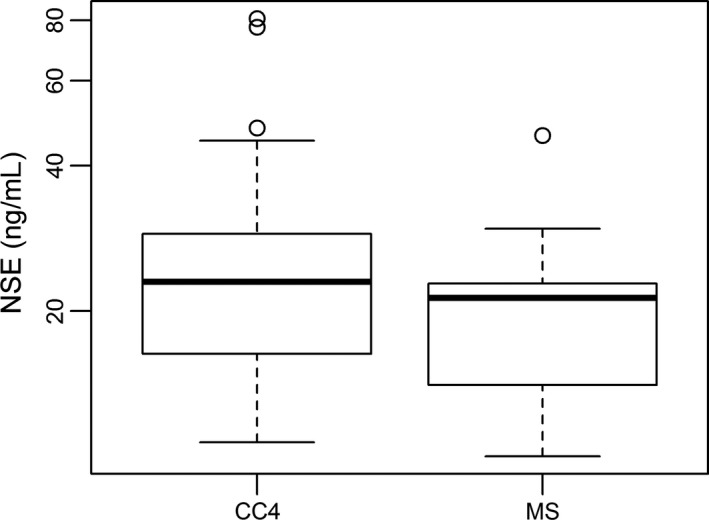
Comparison of NSE level between NB patients at CC4 and MS (maintenance stage). Box plots for comparison of NSE levels in NB patients between CC4 (24.0 ng/ml) and MS (21.30 ng/ml) was significant (P = 0.01, <0.05). (Wilcoxon matched‐pairs signed rank test)
Figure 4.
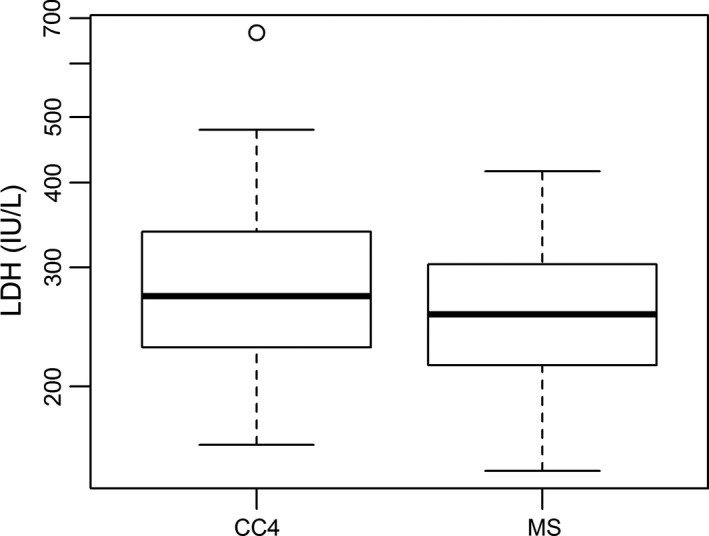
Comparison of LDH level between NB patients at CC4 and MS (maintenance stage). Box plots for comparison of LDH levels in NB patients between CC4 (272.0 IU/L) and MS (255.5 IU/Ll) was not significant (P = 0.11, >0.05). (Wilcoxon matched‐pairs signed rank test)
In addition, to predict the insufficient response to intermediate stage of chemotherapy, the most efficiency of AUC was found in cfDNA levels among cfDNA, NSE, and LDH quantification (Figure 4). The AUC value of cfDNA was 0.68 at cutoff value of 13.4 ng/ml with a sensitivity of 79.2% at 56.2% specificity (Figure 5). The results of cfDNA and NSE matched with clinical characters. At MS, all NB patients had done with the surgery operation. Consequently, all these NB kids suffering from reduced tumor burden or minimal residual disease had lower cfDNA levels at MS stage than it at CC4 or presurgery stage. However, cfDNA levels could not be able to discriminate PR from SD among NB patients (Table 6).
Figure 5.
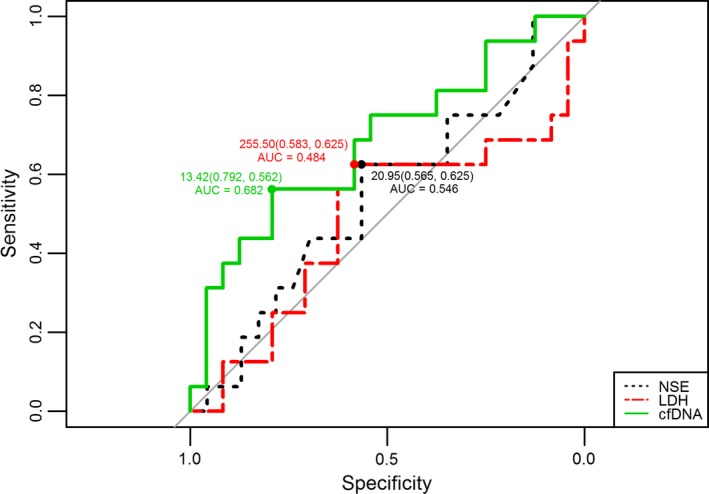
Receiver‐operating curves (ROC) for predicting insufficient response to intermediate chemotherapy in NB patients by cfDNA, NSE, and LDH levels. The area under the ROC curve (AUC) of total plasma cfDNA was 0.682 (with 79.2% sensitivity and 56.2% specificity at 13.42 ng/ml) at maintenance stage (MS), NSE was 0.546 (with 56.5% sensitivity and 62.5% specificity at 20.95 ng/ml), and LDH was 0.484 (with 58.3% sensitivity and 62.5% specificity at 255.50 IU/L, respectively
4. DISCUSSION
To improve cure rates of malignant tumors, such as NB, therapy response is the key factor to be considered.14, 15 Meanwhile, MRD detection plays a more pivotal role in predicting prognosis.2, 14, 15, 16, 17, 18 When it comes to NB, particularly the NB with high risk, their outcomes are usually negative due to tumor relapse or metastasis.1, 2, 14 Although MYCN and MIBG had some advantages to detect MRD for NB,11, 19, 20 disappointedly, none of them were good or sensitive enough to determine MRD. Physicians are eager to find a number of reliable biomarkers which can measure tumor burden or MRD of NB easily and accurately.
Our previous work has demonstrated that cfDNA levels could be considered as one type of promising biomarker of tumor burden in NB.12 Present investigation focused on evaluating cfDNA as a biomarker for monitoring response to early and intermediate stages of chemotherapy in NB. Similar to our previous finding, the cfDNA levels were gradually down‐regulated following therapy process (Table 2, Figure 2). More importantly, cfDNA levels could be used to discriminate PR from SD during early chemotherapeutic stage (Table 2). To some degree, using cfDNA could predict the insufficient response to early chemotherapy in NB (Figure 1A,B). Higher level of cfDNA was found in SD patients (Table 2, Figure 1A,B). In comparison with NSE and LDH performance at both early and intermediate stages of chemotherapy, the performance of cfDNA was most efficient to evaluate therapy response in NB patients (Tables 2, 3, 4, Figures 1, 2, 3, 4, 5). Our data proved that cfDNA levels were sensitively down‐regulated upon treatment, such as surgery or chemotherapy (Tables 2 and 6). This correlation between cfDNA level and tumor burden could facilitate predicting therapy response more efficiently.
However, there were some factors to affect cfDNA's stability and efficiency. For instance, 14 eligible NB patients’ cfDNA levels were too fluctuant to reveal the significant difference between PR and SD groups during early chemotherapy (data not shown). By dissecting the clinical characters, three factors seemed to stimulate cfDNA up‐regulating suddenly, including inflammation fever,22 transfusion,23 and administration of G‐CSF.24 As a result, the suddenly increased cfDNA levels disturbed our investigation. By re‐sampling from the 14 NB kids in case of the three disturbing factors disappearing, the real tumor burden was measured by cfDNA and the real response to therapy was analyzed. Then, it was necessary to avoid the time windows when disturbing factors were involved during detecting cfDNA.
Given that precise tumor burden or MRD could be measured dynamically, it would benefit not only the cancer patients but also the clinicians in clinic. At present, imaging technique is the best and most widely used method to facilitate diagnosis and prognosis for malignant solid tumors.20, 25, 26 However, radiography has some drawbacks, for example it has radiation danger and it is also challenging to detect minimum tumor size.20, 25 Getting this notion, the research of discovering safer and more dynamic biomarkers for malignant tumors are emerging as frontier topic both in basic and clinic studies,6, 7, 10, 11, 16, 17 and this includes cfDNA quantification. Recently, it was demonstrated that the fragment size of cfDNA was reported to improve sensitivity and specificity of various cancers test.27 Actually, our previous work had detected two fragment lengths of cfDNA in NB patients. The smaller fragment size (97 base pairs) of cfDNA had more significant performance than the DNA integrity index (longer over shorter fragments).12 Furthermore, optimizing works would focus on more specific fragment size of cfDNA to evaluate tumor burden of NB.
In conclusion, our investigation revealed that cfDNA levels were gradually down‐regulated in response to early and intermediate stages of chemotherapy in NB. More importantly, dynamic cfDNA changes could be used to monitor and predict therapy response at CC4 and MS stages in NB. If larger samples were available, cfDNA level could be applied in a wider and more accurate scenario to evaluate and predict therapy response as well as follow‐up prognosis in NB.
CONFLICTS OF INTEREST
The authors declare that there are no conflicts of interest.
ACKNOWLEDGMENTS
The authors thank the patients for their participation in this study.
Su Y, Wang L, Wang X, et al. Dynamic alterations of plasma cell free DNA in response to chemotherapy in children with neuroblastoma. Cancer Med. 2019;8:1558–1566. 10.1002/cam4.2045
Yan Su and Lijun Wang contributed equally to this work.
Contributor Information
Yi Liu, Email: liuyi@keyintt.com.
Xiaoli Ma, Email: mxl1123@vip.sina.com.
REFERENCES
- 1. Berthold F, Spix C, Kaatsch P, Lampert F. Incidence, survival, and treatment of localized and metastatic neuroblastoma in Germany 1979–2015. Paediatr Drugs. 2017;19:577‐593. [DOI] [PMC free article] [PubMed] [Google Scholar]
- 2. Dubbers M, Simon T, Berthold F, et al. Retrospective analysis of relapsed abdominal high‐risk neuroblastoma. J Pediatr Surg. 2018;53:558‐566. [DOI] [PubMed] [Google Scholar]
- 3. Irwin MS, Park JR. Neuroblastoma: paradigm for precision medicine. Pediatr Clin North Am. 2015;62:225‐256. [DOI] [PubMed] [Google Scholar]
- 4. London WB, Bagatell R, Weigel BJ, et al. Historical time to disease progression and progression‐free survival in patients with recurrent/refractory neuroblastoma treated in the modern era on Children's Oncology Group early‐phase trials. Cancer. 2017;123:4914‐4923. [DOI] [PMC free article] [PubMed] [Google Scholar]
- 5. Pinto NR, Applebaum MA, Volchenboum SL, et al. Advances in risk classification and treatment strategies for neuroblastoma. J Clin Oncol. 2015;33:3008‐3017. [DOI] [PMC free article] [PubMed] [Google Scholar]
- 6. Cheng J, Holland‐Letz T, Wallwiener M, et al. Circulating free DNA integrity and concentration as independent prognostic markers in metastatic breast cancer. Breast Cancer Res Treat. 2018;169:69‐82. [DOI] [PubMed] [Google Scholar]
- 7. Kurihara S, Ueda Y, Onitake Y, et al. Circulating free DNA as non‐invasive diagnostic biomarker for childhood solid tumors. J Pediatr Surg. 2015;50:2094‐2097. [DOI] [PubMed] [Google Scholar]
- 8. Li BT, Drilon A, Johnson ML, et al. A prospective study of total plasma cell‐free DNA as a predictive biomarker for response to systemic therapy in patients with advanced non‐small‐cell lung cancers. Ann Oncol. 2016;27:154‐159. [DOI] [PMC free article] [PubMed] [Google Scholar]
- 9. van der Drift MA, Hol BE, Klaassen CH, et al. Circulating DNA is a non‐invasive prognostic factor for survival in non‐small cell lung cancer. Lung Cancer. 2010;68:283‐287. [DOI] [PubMed] [Google Scholar]
- 10. Tadeo I, Berbegall AP, Castel V, et al. Extracellular matrix composition defines an ultra‐high‐risk group of neuroblastoma within the high‐risk patient cohort. Br J Cancer. 2016;115:480‐489. [DOI] [PMC free article] [PubMed] [Google Scholar]
- 11. Yamamoto N, Kozaki A, Hartomo TB, et al. Differential expression of minimal residual disease markers in peripheral blood and bone marrow samples from high‐risk neuroblastoma patients. Oncol Lett. 2015;10:3228‐3232. [DOI] [PMC free article] [PubMed] [Google Scholar]
- 12. Wang X, Wang L, Su Y, et al. Plasma cell‐free DNA quantification is highly correlated to tumor burden in children with neuroblastoma. Cancer Med. 2018. [DOI] [PMC free article] [PubMed] [Google Scholar]
- 13. Leung CK. Fifteen years' review of advanced childhood neuroblastoma from a single institution in Hong Kong. Chin Med J (Engl). 1998;111:466‐469. [PubMed] [Google Scholar]
- 14. Ahmed AA, Zhang L, Reddivalla N, Hetherington M. Neuroblastoma in children: update on clinicopathologic and genetic prognostic factors. Pediatr Hematol Oncol. 2017;34:165‐185. [DOI] [PubMed] [Google Scholar]
- 15. Cheung NK, Ostrovnaya I, Kuk D, Cheung IY. Bone marrow minimal residual disease was an early response marker and a consistent independent predictor of survival after anti‐GD2 immunotherapy. J Clin Oncol. 2015;33:755‐763. [DOI] [PMC free article] [PubMed] [Google Scholar]
- 16. Cai J, Pan C, Tang Y, et al. Multivariate analysis of risk factors for patients with stage 4 neuroblastoma who were older than 18 months at diagnosis: a report from a single institute in Shanghai, China. J Cancer Res Clin Oncol. 2017;143:1327‐1335. [DOI] [PMC free article] [PubMed] [Google Scholar]
- 17. Hirase S, Saitoh A, Hartomo TB, et al. Early detection of tumor relapse/regrowth by consecutive minimal residual disease monitoring in high‐risk neuroblastoma patients. Oncol Lett. 2016;12:1119‐1123. [DOI] [PMC free article] [PubMed] [Google Scholar]
- 18. van Wezel EM, Stutterheim J, Vree F, et al. Minimal residual disease detection in autologous stem cell grafts from patients with high risk neuroblastoma. Pediatr Blood Cancer. 2015;62:1368‐1373. [DOI] [PubMed] [Google Scholar]
- 19. Campbell K, Gastier‐Foster JM, Mann M, et al. Association of MYCN copy number with clinical features, tumor biology, and outcomes in neuroblastoma: a report from the Children's Oncology Group. Cancer. 2017;123:4224‐4235. [DOI] [PMC free article] [PubMed] [Google Scholar]
- 20. Liu B, Servaes S, Zhuang H. SPECT/CT MIBG imaging is crucial in the follow‐up of the patients with high‐risk neuroblastoma. Clin Nucl Med. 2018;43:232‐238. [DOI] [PubMed] [Google Scholar]
- 21. Yue ZX, Huang C, Gao C, et al. MYCN amplification predicts poor prognosis based on interphase fluorescence in situ hybridization analysis of bone marrow cells in bone marrow metastases of neuroblastoma. Cancer Cell Int. 2017;17:43. [DOI] [PMC free article] [PubMed] [Google Scholar]
- 22. Tomochika S, Iizuka N, Watanabe Y, et al. Increased serum cell‐free DNA levels in relation to inflammation are predictive of distant metastasis of esophageal squamous cell carcinoma. Exp Ther Med. 2010;1:89‐92. [DOI] [PMC free article] [PubMed] [Google Scholar]
- 23. Oxnard GR, Paweletz CP, Sholl LM. Genomic analysis of plasma cell‐free DNA in patients with cancer. JAMA Oncol. 2017;3:740‐741. [DOI] [PubMed] [Google Scholar]
- 24. Shapira MY, Kaspler P, Samuel S, Shoshan S, Or R. Granulocyte colony stimulating factor does not induce long‐term DNA instability in healthy peripheral blood stem cell donors. Am J Hematol. 2003;73:33‐36. [DOI] [PubMed] [Google Scholar]
- 25. Ishiguchi H, Ito S, Kato K, et al. Diagnostic performance of (18)F‐FDG PET/CT and whole‐body diffusion‐weighted imaging with background body suppression (DWIBS) in detection of lymph node and bone metastases from pediatric neuroblastoma. Ann Nucl Med. 2018;32:348‐362. [DOI] [PMC free article] [PubMed] [Google Scholar]
- 26. Sharp SE, Trout AT, Weiss BD, Gelfand MJ. MIBG in neuroblastoma diagnostic imaging and therapy. Radiographics. 2016;36:258‐278. [DOI] [PubMed] [Google Scholar]
- 27. Mouliere F, Chandrananda D, Piskorz AM, et al. Enhanced detection of circulating tumor DNA by fragment size analysis. Sci Transl Med. 2018;10. [DOI] [PMC free article] [PubMed] [Google Scholar]