

Abstract
The global dimensions and amplitudes of conformational fluctuations of intrinsically disordered proteins are governed, in part, by the linear segregation versus clustering of oppositely charged residues within the primary sequence. Ion mobility-mass spectrometry (IM-MS) affords unique advantages for probing the conformational consequences of the linear patterning of oppositely charged residues because it measures and separates proteins electrosprayed from solution on the basis of charge and shape. Here, we use IM-MS to measure the conformational consequences of charge patterning on the C-terminal intrinsically disordered region (p27 IDR) of the cell cycle inhibitory protein p27Kip1. We report the range of charge states and accompanying collisional cross section distributions for wild-type p27 IDR and two variants with identical amino acid compositions, κ14 and κ56, distinguished by the extent of linear mixing versus segregation of oppositely charged residues. Wild-type p27 IDR (κ31) and κ14, where the oppositely charged residues are more evenly distributed, exhibit a broad distribution of charge states. This is concordant with high degrees of conformational heterogeneity in solution. By contrast, κ56 with linear segregation of oppositely charged residues leads to limited conformational heterogeneity and a narrow distribution of charged states. Gas-phase molecular dynamics simulations demonstrate that the interplay between chain solvation and intrachain interactions (self-solvation) leads to conformational distributions that are modulated by salt concentration, with the wild-type sequence showing the most sensitivity to changes in salt concentration. These results suggest that the charge patterning within the wild-type p27 IDR may be optimized to sample both highly solvated and self-solvated conformational states.
Introduction
Conformational heterogeneity is a defining hallmark of intrinsically disordered proteins (IDPs).1 As autonomous units, IDPs interconvert among disparate conformations under physiological conditions.2,3 The amplitudes of conformational fluctuations and the time scales associated with these fluctuations span a wide range, showing sequence specificity and dependence on solution conditions. IDPs are of interest due to their range of functions and their involvement in a range of diseases, particularly cancers and neurodegenerative disorders.4,5 Bioinformatics and recent proteomics studies indicate that about 25–30% of eukaryotic proteins are mostly disordered,6 that more than half of eukaryotic proteins have long segments of disorder,6,7 and that more than 70% of signaling proteins have long disordered regions.8
Understanding how intrinsically disordered regions (IDRs) mediate the function of a protein requires accurate physical descriptions of their sequence-to-conformation relationships. IDPs and IDRs are often enriched in proline, glutamic acid, lysine, serine, and glutamine, yet depleted in tryptophan, tyrosine, phenylalanine, cysteine, isoleucine, leucine, and asparagine in comparison to folded, globular proteins,8,9 and an emerging theory suggests that the context, or adaptive location of a given residue within a protein allows modulation of different functional conformational ensembles, which govern how that region will interact with a given partner.10 One parameter to define this “context” is the net charge per residue11 (NCPR, defined as NCPR = f+ – f–, where f+ and f– are the fractions of positively and negatively charged residues, respectively, in the amino acid sequence). While the context will alter in the solvation and self-solvation state of the protein, NCPR is useful in predicting whether a polyelectrolytic IDP will form a collapsed globule or a swollen extended coil. While some IDPs are polyelectrolytic (contain either positively or negatively charged residues), a larger fraction are polyampholytic (contain both positively and negatively charged residues); consequently, the NCPR parameter alone, which subsumes the f+ and f– values, is inadequate to describe the sequence-to-conformation relationships of such proteins.
Das and Pappu proposed that a combination of the fraction of charged residues (FCR, defined as FCR = (f+ + f–)) and the linear sequence patterning of oppositely charged residues influence the conformational features of an IDP that include the degree of chain compaction and the amplitude of conformation fluctuations.12 The extent of linear mixing versus segregation of oppositely charged residues was quantified using a parameter κ. The κ values range between 0 and 1, where low values relate to well-mixed sequences of positive and negative residues and at κ-values near 1 oppositely charged residues are completely segregated in the linear sequence.
A recent study probed the effect of altering κ-values on the conformational properties of the intrinsically disordered C-terminal domain of p27Kip1.13 Sequence variants of p2796–198 (referred to hereafter as p27-C) were generated by altering the charge patterning of the sequence between residues 100 and 180 while keeping the amino acid composition fixed. The sequence of the short linear motif (T187–P188–K189–K190) was kept constant since phosphorylation of T187 is the key signaling step that leads to p27 degradation and subsequent activation of Cdk2/cyclin A, which drives progression of the cell division cycle into S-phase.14 Atomistic simulations and solution-phase small-angle X-ray scattering (SAXS) showed a clear inverse correlation between the κ-value and the ensemble-averaged radius of gyration (Rg) of 6 permutants of p27-C.
Native mass spectrometry is a promising technique for the study of IDPs.15−17 The charge state distribution (CSD) following nanoelectrospray ionization (nESI) provides a measure of conformation heterogeneity of a protein in solution. Proteins are observed with discrete net charges, which in positive ionization mode are due to the differentially protonated forms of the protein. A given CSD is governed by the availability of the solvent-accessible ionizable residues within the protein as well as components of the solution. In the majority of cases, proteins that possess high degrees of secondary and tertiary structure in solution display narrow charge state distributions. This is indicative of a finite number of accessible protonation sites. Disordered proteins, however, primarily present broad CSDs that are attributable to heterogeneous ensembles of conformations, ranging from highly compact to highly extended states, with concomitant different numbers of surface exposed, ionizable sites. IM-MS experiments enable separation of these different charge states based on their size and shape and allow the measurement of rotationally averaged collision cross sections (CCSs).
Other MS-based techniques that have proven useful in the analysis of IDPs include hydrogen–deuterium exchange (HDX)-MS and cross-linking-MS. HDX-MS reports on the solvent accessibility of specific residues in a protein, thereby allowing localization of conformational changes to particular regions of the protein, providing the backbone amide hydrogen is differentially protected; depending on the inherent flexibility of the IDP and the time window for analysis, HDX-MS can be highly revealing.18,19 Cross-linking-MS reveals residues that are in close spatial proximity to one another, either from different proteins or within the same protein. This has allowed the characterization of protein–protein interactions involving IDPs, which can be difficult to achieve with traditional structural biology techniques.20
Here, we report results from IM-MS experiments on p27-C as well as two sequence variants engineered to have κ-values of 0.14 and 0.56 (referred to as κ14 and κ56, respectively; wild-type p27-C has a κ-value of 0.31 and is referred to as κ31). The designed variants κ14 and κ56 were predicted, and experimentally verified, to be less and more compact than wild-type p27-C, respectively.13 Analysis of these charge pattern variants using IM-MS reveals differences in charge-patterning encoded conformational properties that are not detectable using conventional solution phase experiments. Additionally, we investigated the impact of salt concentration on the sequence-specific conformational distributions of the variants and compared this to the salt dependence of the conformational distributions of the wild-type p27-C. Our results demonstrate sequence-specific and salt concentration-dependent conformational distributions suggesting that the conformations of each permutant are heavily modulated by the salt content of the solution from which they are sprayed. Further insights into the behavior of the sequence variants are gained by performing gas-phase molecular dynamics (MD) simulations.
Methods
Protein Preparation
p27-C constructs were generated by insertion of synthetic DNA sequences (Integrated DNA Technologies) into a pET28a vector (Novagen). All variants were generated using the QuickChange II XL Site-Directed Mutagenesis Kit (Stratagene). p27 variants were expressed in E. coli, purified by Ni2+ affinity chromatography. His-tags were removed by cleavage with thrombin or TEV and further purified by reverse phase HPLC. p27-C-κ56 has an internal thrombin site, and therefore the His-tag cleavage site was mutated to a TEV site. The purified proteins were buffer exchanged into either 10, 100, or 200 mM ammonium acetate pH 6.8 using Bio-Rad Micro Bio-Spin P6̅ columns (Bio-Rad, Hercules, CA, USA). Samples were subsequently diluted down to 30 μM with an appropriate buffer solution.
Nanoelectrospray Ionization (nESI)
All MS and IM-MS experiments were conducted using nanoelectrospray ionization. Samples were ionized from a thin-walled glass capillary (i.d. 0.9 mm, o.d. 1.2 mm, World Precision Instruments, Stevenage, UK) pulled in-house to nESI tip with a Flaming/Brown micropipette puller (Sutter Instrument Co., Novato, CA, USA). A positive potential of 1.6 kV was applied to the solution via a thin platinum wire (diameter 0.125 mm, Goodfellow, Huntingdon, UK).
Mass Spectrometry
All MS experiments were performed on a Q-ToF Global (Waters, Manchester, UK), with sampling cone voltage set to 60 V, collision voltage of 5 V, source temperature of 80 °C, source pressure of 2.7 mbar and collision cell pressure of 2.3 × 10⁻³ mbar.
Ion Mobility-Mass Spectrometry
IM-MS experiments were carried out on a Waters Q-ToF I instrument that was modified in-house to include a 5.1 cm drift tube, which has been described elsewhere.21 The temperature and pressure of helium in the drift cell were approximately 28 °C and 4 Torr, respectively. Measurements were made at 6 different drift voltages from 60 to 20 V. The precise pressure and temperature were recorded for every drift voltage and used in the calculations of CCSs. Each experiment was performed in triplicate. Ion arrival time distributions were recorded by synchronization of the release of ions into the drift cell with the mass spectral acquisition. The CCS distribution plots are derived from raw arrival time data using eq 1 below.22
| 1 |
where m and mb are the masses of the ion and buffer gas, respectively; z is the ion charge state, e is the elementary charge, kB is the Boltzmann constant, T is the gas temperature, ρ is the buffer gas density, L is the drift tube length, V is the voltage across the drift tube and td is the drift time.
The raw arrival time output (ta) includes the time the ions spend outside of the drift cell but within the mass spectrometer, known as the dead time (t0). The value for t0 is calculated by taking an average value of the intercept from a linear plot of average arrival time versus pressure/temperature and was subtracted from the arrival time to calculate drift time (td):
| 2 |
All MS and IM-MS data were analyzed using Masslynx v4.1 software (Waters, Manchester, UK), ORIGAMI,23 Origin v8.5 (OriginLab Corporation, USA), and Microsoft Excel.
Global Collision Cross Section Distributions
The global CCS distributions were obtained by first interpolating the individual CCS distributions of each charge state so they span identical CCS range (0–3500 Å2 with 50 Å2 spacing) and subsequently summing them together to generate feature-rich distributions. The relative intensity of each charge state is equated to the integrated area of the CCS distribution of each charge state.
Modeling of CCS Framework Boundaries
The procedure of calculating the lower and upper boundaries of the CCS distribution has been described elsewhere.16 In brief, the lower boundary is predicted by assuming that the globular form of the protein is approximately spherical in shape with a density of ρ (0.904 Da/Å3). The volume of the protein sphere can be calculated via V = Mw/ρ, where Mw is the molecular weight of the protein. The radius of the sphere is therefore r = (3V/4π)1/3. The CCS of a sphere of this radius is therefore given by eq 3:
| 3 |
where a scaling factor of 1.19 is then applied for the conversion from geometric size to CCS in helium as previously outlined.24 The upper CCS boundary is assumed for a protein structure that adopts a fully extended, rod-like conformation. In this case, on the basis of Cauchy’s theorem, the average projected area of a convex solid, such as a rod, modeled as a long and thin cylinder, is a quarter of its surface area, where the surface area is defined by eq 4:
| 4 |
Thus, the upper CCS boundary can be calculated using eq 5
| 5 |
where l is the length of the cylinder (the contour length of the chain) defined from the distance between α-carbons in a protein chain 3.63 Å, such that for a given polypeptide chain with n residues l = n(3.63), and r is the radius obtained from the average radius from the volume of each amino acid as shown previously. The same scaling factor is applied to covert from a geometrical shape to a CCSHe value.
These theoretical CCS limits are highly approximate and do not take into consideration proline residues, disulfide bridges, or noncovalent interactions or restrictions. Instead they serve as lower and upper bounds to which experimental results can be compared.
Gas-Phase Desolvation Molecular Dynamics
The starting structures of the p27-C-constructs were obtained from the converged, solution-phase Metropolis Monte Carlo (MC) simulations by Das et al.;13 briefly, these simulations were carried out using the ABSINTH implicit solvation model with explicit representation of Na+ and Cl– ions. Collision cross sections were computed for two results obtained using two simulation temperatures, 298 and 328 K, on three replicate runs.
All MD simulations were performed using the Amber15 molecular dynamics package and Amber ff99SB force fields.25 These are gas-phase simulations where no boundary conditions were imposed, and the nonbonded cutoff was set to 999 Å and 1 fs time step was used. SHAKE algorithm was used for all bonds involving hydrogen atoms.
In order to capture the charge state distribution from experimental results, a charge permutation protocol was developed to generate an ensemble of protein protomers. Two representative structures from each permutant were taken from the MC ensembles to give a broad description of the solution geometries. A total of 5000 protomers were constructed for each structure, resulting in 10 000 protomers for each protein. A new protomer was generated at each iteration of the protocol by randomly neutralizing negative charges while maintaining positive residues protonated. Protomers with identical charge distribution were removed from the ensemble. The employed protonation protocol builds on previous methodology.26 Subsequently, protomers were segregated based on their charge state and each structure was subjected to steepest descent energy minimization and gas-phase equilibration to remove any unfavorable steric clashes. On the basis of the energy of the system, ∼5 most energetically favorable structures were kept for further simulation (less if the number of protomers for particular charge state was <5). The remaining structures were subjected to 10 ns of unrestrained vacuum simulation; however, first they were heated and equilibrated at 300 K. In total, 100, 92, and 99 simulations were carried out for the κ14, κ31, and κ56 permutants, respectively.
Finally, the lowest energy structure was extracted for each p27-C permutant from the [M + 7H]7+ MD simulation ensemble and placed in a water droplet consisting of ∼6000 TIP3P water molecules (radius of 30 Å) and placed in a vacuum. The droplet was then heated and equilibrated at T = 350 K for 1 ns. In order to simulate droplet desolvation, MD simulations were split into 500 ps segments at a constant temperature of 350 K for a period of 42.5 ns. At each interval, water molecules further than 40 Å from the protein surface were removed and the velocity of each atom was reassigned according to the Maxwell–Boltzmann distribution at the preset simulation temperature. The reason for splitting the simulation into smaller segments was 2-fold. (1) Due to the evaporative cooling27,28 that occurs during desolvation, the temperature of the droplet decreases, potentially freezing the system. Reassignment of the velocities ensures the temperature of the system remains constant, simulating Andersen thermostat.29 (2) Removal of excess water reduces the number of particles in the system and significantly reduces the computational time required to simulate the droplet desolvation. In the final stages of the protocol, it was necessary to raise the temperature of the system to 400 K; this was required to remove the last remaining sticky waters. The temperature of 400 K was maintained for 5 ns until all water molecules were evaporated. The desolvation protocol described above broadly follows a previously described methodology.30,31
All simulations were analyzed using Amber15’s cpptraj module. Structural rearrangements, as well as protein desolvation, was monitored using the backbone radius of gyration (Rg), solvent accessible surface area (SASA), and CCS. VMD was used for visualization purposes, and an in-house developed MATLAB script was used to visualize hydrogen bond connectivity maps.
Collision Cross Section Calculations
CCS values were calculated using the exact hard sphere scattering method, as implemented in EHSSrot32 with atom parametrizations of Siu et al.33 The cross sections were calculated every 50 ps during the MD simulations and every 50 frames for Monte Carlo ensembles.
Interactive Figures
A number of main text and Supporting Information figures presented in this article were recreated in an interactive format to enable in-depth interrogation of the presented results. These are deposited online at https://github.com/BarranLab/Beveridge_Migas_p27_2018 and can be viewed with https://beveridge-migas-p27.netlify.com. The interactive figures were created using ORIGAMIANALYZE and require the use of a modern Internet browser and access to the Internet.23
Results
Figure 1 displays information about the biophysical properties of each sequence variant, along with ESI-MS and ESI-IM-MS data in terms of the range of charge states (Δz) and CCS values (ΔCCS). It is immediately obvious that the charge patterning in these proteins has a substantial effect on their mass spectra and on the CCS distributions that they occupy. Previous IM-MS studies have demonstrated how Δz provides information on the extent of structure or disorder in the solution phase.16 For proteins with a molecular mass below 100 kDa, empirical evidence has provided rules to help interpret the ESI-MS data. A protein with minimal dynamics in solution and a tightly configured structure will present with Δz ≤ 5, and if the value for Δz > 5, this indicates a protein that is unfolded, either due to being sprayed from denaturing conditions or due to intrinsic disorder that results in a multiplicity of conformations in solution and a corresponding high number of charging possibilities, and hence a broad CSD. A protein that has regions of both structure and disorder, or that fluctuates among several weakly energetically favorable structures, will present a Δz > 5, with higher occupancy in the lower charge states. The net charge, pI, FCR, and NCPR are parameters are frequently used to distinguish compositional biases of IDPs, and these are shown in Figure 1d. Importantly, all three p27-C sequence variants have identical compositional parameters. Accordingly, to a first approximation, one might expect that all constructs should be characterized by similar conformational distributions. However, results from SAXS measurements show that the permutants exhibit different degrees of compaction.13 While p27-C-κ31 has a solution Rg value of 28.1 Å, the value for p27-C-κ14 is slightly higher at 29.4 Å, which is still within the experimental error. However, the Rg for p27-C-κ56 is significantly lower at 23.3 Å, suggesting that this sequence prefers an ensemble of compact conformations—a feature also reflected in the MS and IM-MS results shown in Figure 1 and discussed below.
Figure 1.

(a) Net charge per residue (NCPR) profiles of each construct along the linear sequence, adapted from Das et al.13,12 Positive charges are shown in blue and negative in red. (b) Mass spectrum of p27-C-κ14, p27-C-κ31, and p27-C-κ56 sprayed from 200 mM ammonium acetate. The κ14 and κ31 permutants display wider charge state distributions ranging from [M + 6H]6+ to [M + 18H]18+, while the κ56 has a narrower distribution in the range of [M + 6H]6+ to [M + 13H]13+. The value of the highest and lowest observed charge states and the most intense peak in the dominant distribution are indicated. (c) CCS distributions of each charge states of the p27-C permutants sprayed from 200 mM ammonium acetate solution. Charge states [M + 17H]17+ and [M + 18H]18+ for κ14 and κ31 and [M + 13H]13+ for κ56 permutant are not displayed due to poor signal-to-noise in the IM-MS spectra. (d) Biophysical information for each of the three C-terminal constructs including a pictorial representation of the amino acid sequence, color-coded to represent the positive (blue), negative (red), polar (green), and hydrophobic regions in the sequence (gray). *Isoelectric point (pI). †Fraction of charged residue (FCPR). ‡Net charge per residue (NCPR). §Radius of gyration (Rg) from ref (13). ●Number of charge states from (b). #Width of the CCS from (c). An interactive version of this figure is available online at https://beveridge-migas-p27.netlify.com/assets/Figure_1b.html (b) and https://beveridge-migas-p27.netlify.com/assets/Figure_1c.html (c).
Mass Spectrometry and Ion Mobility Mass Spectrometry of p27-C Permutants
Das et al.13 proposed that IDPs with different κ-values respond differently to changes in the concentration of solution ions.12 We tested this hypothesis by examining each permutant in solutions with different salt concentrations to investigate the modulation of conformational features and resultant charge state distributions. Solutions of 10, 100, and 200 mM ammonium acetate were used and are referred to as low-, middle-, and high-salt solutions, respectively.
Focusing first on the high-salt solutions, stark differences were observed among the three permutants (Figure 1b,c); the MS profile for p27-C-κ14 is typical of a highly disordered protein with a large charge state range (Δz = 12), ions of significant intensity from [M + 6H]6+ to [M + 18H]18+ (Figure 1b, left), and a distribution that favors high charge states. A significant increase in the relative intensity of [M + 9H]9+ versus [M + 8H]8+ is reflective of distinct conformational differences, also observed in the CCS distribution (Figure 1c, left). Charge states [M + 6H]6+ and [M + 7H]7+ possess very similar CCSs centered at 1100 Å2, whereas for the adjacent ions [M + 8H]8+ and [M + 9H]9+, the CCS increases to 1500 and 1750 Å2, respectively, indicating a lack of stability of compact conformations when the net charge is above 8.
The mass spectrum of p27-C-κ31 (Figure 1b, middle) and IM-MS data (Figure 1c, middle) shows that the majority of this protein resides in the [M + 6H]6+ and [M + 7H]7+ charge states and presents in compact conformations centered around 1000 Å2. The lower intensity [M + 8H]8+ ion has a slightly higher CCS ≥ 1100 Å2. Between [M + 9H]9+ and [M + 14H]14+ the protein presents in broad conformational distributions that increase in size to ∼2500 Å2 at [M + 14H]14+, and this single conformational family is then retained for the charge states to [M + 16H]16+; we propose that at this stage, the protein is present in a highly extended conformation and any addition of protons has a negligible effect on the overall dimensions.
In contrast to the other two permutants, the CSD of p27-C-κ56 (Figure 1b, right) is narrow, with charge states between [M + 6H]6+ and [M + 13H]13+. This is suggestive of a protein with low conformational heterogeneity in solution—a feature that is consistent with the chain compaction observed in SAXS measurements and the lowered amplitudes of conformational fluctuations observed in the atomistic simulations of Das et al.13 The overall observed CCS distribution is much narrower for p27-C-κ56 than the other permutants. The observed ΔCCS is just 1750 Å2 in contrast to 2400 and 2250 Å2 for κ14 and κ31, respectively. However, the CCS range for each individual charge state is remarkably wide even though the increase in CCS with the addition of each proton is very small, indicating a broad ensemble of conformers that present with higher similar net charges.
Reducing the concentration of the ammonium acetate solution from which the proteins were sprayed and desolvated has a limited effect on the Δz from the CSDs, but the relative intensities of individual charge states alter (Figure S1). The most significant differences are found for the κ31 and κ56 permutants. In the case of p27-C-κ31, the dominant ions [M + 6H]6+ and [M + 7H]7+ at high salt diminish when the protein was analyzed from low and medium salt concentrations, where the CSD shifts to higher charge states, namely, [M + 10H]10+ and [M + 11H]11+. In contrast for the κ56 permutant, the relative intensity of the low charge states ([M + 6H]6+ and [M + 7H]7+) increases, especially at the low buffer concentration.
In terms of the IM-MS results (Figure 1c), the p27-C-κ14 protein variant displays a linear increase in CCSs for each successive charge state at 10 mM ammonium acetate (Figure S2a). For the medium and high salt conditions, the intensity of the [M + 8H]8+ ion decreases and the result is a marked jump between compact and extended forms from ∼1200 Å2 at [M + 7H]7+ to 1900 Å2 at [M + 8H]8+ and 2100 Å2 at [M + 9H]9+. The p27-C-κ31 still follows a more even increase in its CCS values with charge; however, the increased relative intensities of the higher charge states led to their broadening. Finally, the p27-C-κ56 permutant retains a wide CCS distribution for each charge state, with the [M + 6H]6+ being the dominant species at low salt concentration (Figure S2c) and [M + 8H]8+ at medium salt concentration (Figure S2f). The conformational diversity of the ions at the medium salt concentration is more pronounced where several conformational families are observed for the intermediate charge states ([M + 8H]8+ to [M + 11H]11+).
Effect of Salt Concentration on Global Conformations
The global CCS distribution of the p27-C variants at each experimental condition (Figure 2) summarizes the overall conformational heterogeneity in terms of CCS. First, the CCS distribution profile of p27-C-κ14 sprayed from the low salt solution (Figure 2a) shows that this construct is free to access almost any shape under these experimental conditions, suggesting that there are small energetic barriers to switching between conformers in solution. The absence of abrupt changes of ion intensity with respect to CCS supports this suggestion. In contrast, the conformational profiles of p27-C-κ14 sprayed from middle- (Figure 2b) and high-ionic (Figure 2c) strength solutions suggest that the protein is stabilized in extended conformational states with CCSs centered around 2000 Å2. A small proportion of molecules are present in more compact conformations with CCS values in the range from 750–1500 Å2. As previously mentioned, a conformational change appears to occur at around 1500 Å2, with conformations of higher surface areas being more highly populated.
Figure 2.

Global CCS distributions of all three permutants sprayed from 10, 100, or 200 mM ammonium acetate. Global CCS distributions are obtained by combining those of individual charge states into a single feature-rich distribution. An interactive version of this figure is available online at https://beveridge-migas-p27.netlify.com/assets/Figure_2.html.
When sprayed from the low-salt solution (Figure 2d), p27-C-κ31 exists in a range of conformations, similar to p27-C-κ14 when sprayed from equivalent conditions. The medium-salt solution (Figure 2e) appears to stabilize extended conformations above 2000 Å2 for p27-C-κ31, which is also similar to what we observe to p27-C-κ14, but here the smaller conformations below 1500 Å2 are more easily accessed. When p27-C-κ31 is sprayed from the high salt solution (Figure 2f), more compact conformations are preferred, indicating a switch between conformational states preferred in 100 mM versus 200 mM salt. The reason for this is not known, but we can speculate that the WT sequence has a patterning of charged residues that enables such behavior, which may relate to its biological function.
When p27-C-κ56 is sprayed from 10 mM ammonium acetate (Figure 2g), the protein adopts compact states, with most of the intensity being around 1000 Å2, displaying significantly less heterogeneity in its CCS than the other permutants. As the salt content is increased to 100 mM (Figure 2h), the protein experiences a slight shift in the conformational landscape; the most intense peak shifts from 1150 to 1600 Å2 indicating that most of the molecules are now in a more extended conformation, and the minima and maxima of the CCS distribution are both now 250 Å2 larger. A high-salt concentration (Figure 2i) causes further depletion the previously dominant conformation around 1250 Å2 and leads to an increase in the intensity of the conformation at 1600 and 2000 Å2.
Effect of Protein Charge on Collision Cross Section Distributions by MD Simulations
Gas-phase MD simulations were employed to gain insight into the behavior of solution-derived structures from the Monte Carlo simulation in the absence of solvent. In order to achieve this, two representative structures from the MC ensembles (one compact and one extended) were selected as seed structures to create an ensemble of charge permutants (protomers) in the charge state range of [M + 5H]5+ to [M + 15H]15+, which spans most of the experimentally measured CSD (Figure 1d). The charge state of the protein was adjusted by selectively neutralizing negatively charged amino acids. On the basis of the number of positively and negatively charge residues of the p27 permutants (15 and 14, respectively), the maximum number of charge combinations covering the charge states between [M + 5H]5+ to [M + 15H]15+ was 15 913. The charge permutation process created 10 000 protomers for each permutant, all of which were energy minimized and ∼100 lowest energy protomers were selected; for each simulated charge state between 2 to 10 protomers were present. It is worth noting that protomers with minimal Coulombic energy might not necessarily have the highest probability to exist experimentally; however, it is likely that highly probable protomers were selected, despite the multitude of charge permutations available for even the smallest proteins.28,34 Simulation of multiple charge states of the protein was motivated by the desire to better represent the heterogeneous nature of the CSD observed experimentally. Normally simulations would be performed on either the net charge of the protein ([M + 1H]1+), which is not observed experimentally, or a single charge state based on the pKa value at selected pH.
Focusing on the p27-C-κ14 permutant first (Figure S4), the extended conformers with charge states between [M + 5H]5+ and [M + 11H]11+ were found to undergo average structural compaction of −3% to 9% when compared to the equilibrated starting structure at t = 0 ns (not taking the equilibration time into account). Simultaneously, the compact conformer only experienced minor structural rearrangement, which caused an expansion of ∼1%. At higher charge states, several protomers of the compact conformer unfolded with a corresponding increase in CCS of 12, 24, and 31% for the [M + 13H]13+, [M + 14H]14+, and [M + 15H]15+ charge states, respectively. In the case of [M + 14H]14+ and [M + 15H]15+, the final configuration was similar in size to that of the extended conformer at the start of the simulations (∼2000 Å2). Next, examining the trajectories of p27-C-κ31 (Figure S5) we observe a similar behavior of compaction of the extended conformers in charge states [M + 6H]6+ (−7%) and [M + 7H]7+ (−4%), and no significant change in the structure of the compact conformer. Charge states between [M + 7H]7+ and [M + 12H]12+ showed small variations in the CCSs throughout the simulation whereas at charge states above [M + 12H]12+, the initially compact conformers reported a small increase in CCSs of +3% and +7% for the [M + 13H]13+ and [M + 14H]14+ charge states, respectively; this is significantly lower for κ14 permutant. Finally, the extended conformers of p27-C-κ56 permutant (Figure S6) experienced the greatest decrease in CCS for the charge states [M + 5H]5+ to [M + 12H]12+. The compact conformers retain their starting structure and only undergo minor rearrangements for the charge states [M + 5H]5+ to [M + 11H]11+; however, for [M + 12H]12+ and above, larger structural fluctuations were observed. The [M + 13H]13+ and [M + 14H]14+ charge states destabilize protein structure and cause overall unfolding, in particular in the compact conformer; however, charges [M + 13H]13+ to [M + 15H]15+ are not observed during the MS and IM-MS experiment. The values corresponding to compaction and unfolding of each permutant for each charge state are shown in Table S1.
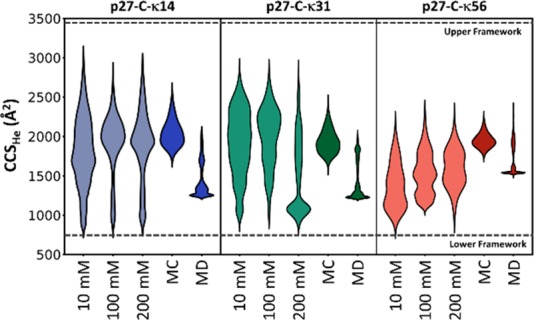
The results from solution-based MC and gas phase MD simulations are summarized in Figure 3. Das et al.13 previously used the structures from MC simulations to accurately represent the solution phase SAXS data; however, these structures were less successful for structural assignment for the gas phase ions. The distribution obtained from the MC ensemble was successful in accounting for the extended conformers, typically associated with higher charge states, while the compact states were inaccessible; this is not surprising since the MC ensembles were generated in the presence of implicit solvent with dielectric constant (ε) of 78, which would weaken any long-range interactions compared to the vacuum of a mass spectrometer (ε = ∼1). In contrast, the gas-phase MD simulations provided better correspondence with the experimental data for more compact structures and this MD methodology accounts for the majority of the experimentally measured CCSs, although still fails to provide exemplar conformational states for the most compact forms we measure. Borysik et al.26 have previously stated that in order to represent the extremely compact conformers of IDPs, it is necessary to first activate solvated structures in a simulated annealing approach to overcome any energy barriers that might prevent conformational collapse; however, this approach was not applicable for high charge states of the protein, as it was found to induce large deformations of the structures.
Figure 3.
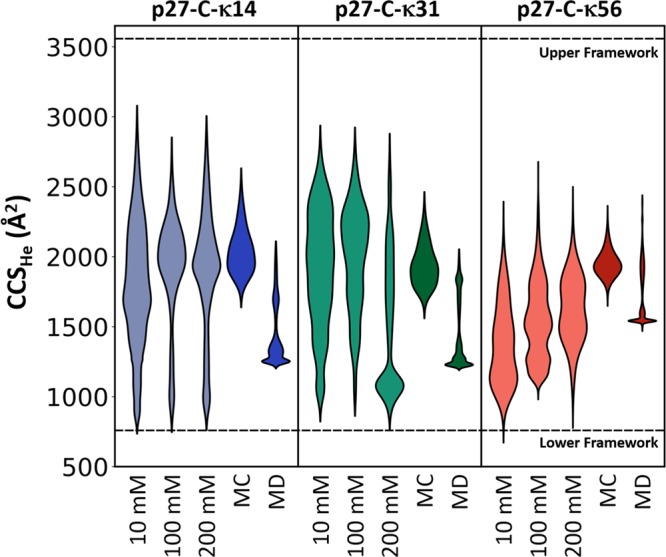
Comparison of the CCS distributions observed from experimental, computational, and predicted data sets. The violin plots show the CCS distributions of each permutant from 10, 100, and 200 mM ammonium acetate and from calculations on the structures from Monte Carlo simulations (MC),13 charge permutation molecular dynamics (MD), and the CCS range predicted using the framework method (marked as horizontal lines).16 The width in the violin plots represents the signal intensity of the experimentally measured distributions and population density of the in silico determined structures. An interactive version of this figure is available online at https://beveridge-migas-p27.netlify.com/assets/Figure_3.html.
Analysis of Protein Desolvation using Molecular Dynamics Simulations
In order to mimic the gradual transfer of the protein from the solution into the gas phase, we performed additional computations where each permutant was immersed in a droplet of water and subjected to stepwise water evaporation. Desolvation was carried out on a [M + 7H]7+ charge state of the κ14, κ31 and κ56 permutants. In each case, the simulation was performed on a compact structure, representative of the protein ensemble. The [M + 7H]7+ ion was selected as it lies below De La Mora’s interpretation of the Rayleigh limit (z = 8.2) and is experimentally present in a compact conformation. The protein is solvated in ∼6000 water molecules without counterions or free-protons, maintaining the starting charge state throughout the evaporation process. Figure 4a–c shows representative snapshots for the desolvation of droplets containing the p27-C permutants, while the time-dependent simulation results are shown in Figure S8. In agreement with previous studies by Consta et al.35,36 and Kim et al.,37 due to the lack of fissile ions such as Na+ or NH4+, as the size of the droplet decreased and the ratio of charge to droplet volume increased, spike-like protrusions developed on the surface of the droplet. In the early stages of the simulation (0–5 ns), the protein structure undergoes minor rearrangement, following loss of favorable protein–water contacts. The structural changes are exemplified by an increased radius of gyration (Rg), solvent accessible surface area (SASA), and CCS. Following the initial conformational changes, the p27-C-κ31 collapsed to a more compact form with CCS of 1295 Å2 (∼6.5% smaller than at t = 0 ns). Similarly, the κ14 permutant followed similar conformational broadening as indicated by an increase in the Rg, SASA, and CCS; however, as the droplet size decreased, the CCS was only reduced by 3% to 1350 Å2 (Figure S7). The κ56 permutant desolvation MD trajectory was started from slightly larger conformation; however, it also exhibited initial conformational expansion and subsequent size reduction (Figure S9). In this case, the CCS was reduced from 1475 Å2 to 1305 Å2, approximately 13% reduction in size, also highlighted by decreases in SASA and Rg.
Figure 4.

Snapshots of the desolvation process at various time points (a–c) and illustration of the hydrogen bonding network following the desolvation protocol at [M + 7H]7+ charge state (d–f). (a,d) p27-C-κ14; (b,e) p27-C-κ31; and (c,f) p27-C-κ56. The thickness of the arcs in d–f represents the number of H-bond contacts during the simulation, while the colors represent the charge of the donor amino acid (positively charged residues, blue; negatively charged residues, red; polar residues, green).
Interestingly, the hydrogen bond network maps shown in Figure 4d–f showcase the number and importance of hydrogen bonds present during the desolvation protocol. In the case of the κ14 variant, a high number of short-distance hydrogen bonds are observed, in particular in the region of 80–105. This is most likely due to the close proximity of the oppositely charged residues within the amino acid sequence, which prevents the formation of a fully collapsed structural form of the protein, as indicated by broad CSD and preference toward higher charge states. In contrast, the κ56 permutant was found to preferentially form hydrogen bonds between the charged patches between residues 30–36, 71–76, and 99–105, which results in the formation of compact conformations. The segregation of oppositely charged residues for the wild-type (κ31) is between that of κ14 and κ56. Accordingly, the hydrogen network consists of numerous short- and long-distance contacts.
Discussion
As evidenced by the large differences in the CCS distributions for the p27-C κ-value permutants (Figures 1 and 2), the patterning of charged residues affects the global conformations of disordered protein chains. The p27-C-κ14 permutant displays well-spaced charged residues in its linear sequence, while the p27-C-κ56 variant exhibits dense clusters of oppositely charged residues. For p27-C-κ56, consequently, there is an increased likelihood of long-range attraction and charged-residue pairing resulting in more compact conformations. Previous SAXS measurements13 support this, as do the experimental findings reported here. IDPs with high fractions of charged residues (FCR ≥ 0.3) and lower κ-values are predicted to have conformational properties similar to self-avoiding random walks due to a counterbalancing of intrachain electrostatic attractions and repulsions.12 This screening of intrachain repulsions by attractions renders sequences of low κ-values to be insensitive to changes in salt concentrations. In contrast, IDPs with higher κ-values are expected to adopt more compact conformations in solvents with low excess salt. This is because of favorable intrachain electrostatic attractions between blocks of oppositely charged residues. Increasing the salt concentration weakens intrachain attractions between blocks of oppositely charged residues, thereby engendering chain expansion.
To understand the success of using ion mobility mass spectrometry to demark the conformational variability of charge segregation in IDPS, and to explain the broad agreement with solvated measurements as well as the additional contributions from highly compact forms, it is critical to consider the transition from solution to the gas phase. The process by which molecules leave the droplet solution and become gaseous ions has long been debated.38−40 The accepted view is that ions with well-defined, globular structures follow the charge residue model (CRM) of desolvation, where it is hypothesized that Rayleigh-charged nanodroplets contain a single molecule of solute that evaporates to dryness; as the droplet shrinks, excess charges are lost via fission events and the remaining charges are transferred to the protein during the final stages of desolvation. Ions produced via this mechanism tend to have lower resultant charge state. An alternative model of desolvation for disordered proteins is the chain ejection model (CEM) proposed by Konermann et al.40 In the CEM, unfolded proteins have larger solvent accessible surface areas exposing their hydrophobic regions; these proteins are likely to migrate to the surface of the droplet and when their terminus is exposed to the gas phase, the remaining part of the structure is pulled with it. In contrast to the CRM, ions produced via the CEM have higher charge states. This model applies if and only if the IDPs are akin to random coils or self-avoiding walks, since IDPs have the ability to sample a broad spectrum of conformations ranging from those that are as compact (or even more so) as folded proteins, they are unlikely to only undergo CEM since ejection of a compact region via CEM would be unfavorable. In light of this we previously proposed that a hybrid of the CRM and the CEM will govern the generation of the intermediate charge states that are present in a multitude of conformational families.18
Considering the observations made from MS and IM-MS results for the three permutants, we propose that the high abundance of high charges states of p27-C-κ31 (WT) at low and medium salt (10 and 100 mM ammonium acetate) is predominantly governed by the CEM.40 By contrast, at high salt (200 mM ammonium acetate) the intensity of the low charge states increases dramatically which could be attributed to alterations of the conformational space of the proteins, modulated by higher salt concentration and consequently resulting in preferential desolvation via the CRM. The CSD of the κ14 permutant indicates higher preference toward higher charge states, irrespective of the buffer environment; hence, the CEM is dominant, although the compact conformations observed for lowest charge states would have been produced via CRM. The maximum number of charges that a spherical conformation of a protein the size of p27-C can hold is 8.2, as determined by De la Mora’s interpretation of the Rayleigh limit,24 which implies that all observed ions above the [M + 8H]8+ are characterized by extended or at least partially extended conformations. Interestingly, a significant change in intensity occurs between charge states [M + 8H]8+ and [M + 9H]9+ for the κ31 and κ14 forms. The threshold at which the apparent conformational switch occurs for the κ56 appears to be lower, between charge states of [M + 7H]7+ and [M + 8H]8+ according to the change in the signal intensity in the mass spectra. Moreover, the [M + 8H]8+ is also the charge state at which a conformational switch occurs ([M + 7H]7+ for κ56), perhaps also indicative of a change in the desolvation mechanism.
The CSD and CCS distributions obtained from MS and IM-MS experiments highlight the conformational diversity of the three permutants when transferred from solution to gas-phase. It appears that during the desolvation process, p27-C ions undergo significant structural rearrangement broadly increasing the conformational space in comparison to the SAXS measurements. This observation is supported by the CCSs obtained for computational models from the SAXS ensemble mentioned above. The CCS distribution of the three permutants spans a wide range of CCSs, yet the Monte Carlo structures were only able to account for the most extended conformational families. The additional pool of structures created during in vacuo MD accessed the intermediate conformations; however, it was still unable to derive models for the highly compact conformations. Finally, using a previously reported IM-MS framework16 to estimate the smallest and largest possible CCS a protein can adopt based purely on its amino acid composition highlights the structural heterogeneity of p27-C as the κ14 and κ31 permutants occupy nearly the entire width of the available CCS range, while the κ56 permutant covers a narrower range (Figure 3). The findings reported herein are in agreement with previous studies26 that highlight how nESI/ESI processes enable creation of low charge states in self-solvated compact states, the extent of which is modulated by the solution conditions, and in our case, distribution of charged residues on the amino acid sequence.
Conclusions
A variety of factors can affect the mass spectra of protein; however, the charge state distribution is predominantly affected by the solution-phase conformation, which is in turn modulated by the solvent composition and in part by the ESI process. Here, we demonstrate how MS and IM-MS methods can be used to investigate the conformational diversity of a set of intrinsically disordered proteins, p27-C and two of its permutants in which the charge patterning within the primary amino acid sequence was altered. The proteins were qualitatively studied, illustrating how small changes to the amino acid sequence can be affected by the ionic buffer strength. Both MS and IM-MS results clearly delineated different permutants and highlighted how IDPs in which charge residues are clustered closely together (high κ-value) form more compact conformations, while those with equal distribution of charged residues on the amino acid sequence demonstrated increased conformational diversity. The experimental results were supplemented by comparison with solution derived and classical MD structures, highlighting the level of compaction occurring once p27-C ions enter the gas phase, while water evaporation MD showed the sequential water loss and structural collapse upon desolvation of the ion, in a process akin to the CRM desolvation model.
Acknowledgments
LGM would like to thank Dr. Massimiliano Porrini for initial guidance on the desolvation protocols. This research was supported by the BBSRC (awards: BB/L015048/1, BB/K017802/1 and BB/H013636/1 and the BBSRC/EPSRC-funded Manchester Synthetic Biology Research Centre, SYNBIOCHEM (BB/M017702/1)). BBSRC, EPSRC, Waters Corp., LGC Ltd. and the Universities of Edinburgh and Manchester are thanked for their support of studentships to RB and LGM. RB acknowledges the Austrian Science Fund for the receipt of a Lise Meitner Postdoctoral Fellowship (project number M2334). RWK acknowledges support from the National Cancer Institute (P30CA21765 to St. Jude Children’s Research Hospital) and ALSAC. This work was supported in part by grant MCB1614766 from the US National Science Foundation (RVP).
Supporting Information Available
The Supporting Information is available free of charge on the ACS Publications website at DOI: 10.1021/jacs.8b13483.
Supporting tables and figures (PDF)
Author Contributions
∥ RB and LGM contributed equally to this work.
The authors declare no competing financial interest.
Notes
The data and all essential metadata that support this study are available from the corresponding author on request and in the interactive data plots as described. A number of figures presented in this article were recreated in an interactive format to enable in-depth interrogation of the presented results. These are deposited online at https://github.com/BarranLab/Beveridge_Migas_p27_2018 and can be viewed with https://beveridge-migas-p27.netlify.com.
Supplementary Material
References
- Tompa P. Unstructural Biology Coming of Age. Curr. Opin. Struct. Biol. 2011, 21 (3), 419–425. 10.1016/j.sbi.2011.03.012. [DOI] [PubMed] [Google Scholar]
- Dunker A. K.; Silman I.; Uversky V. N.; Sussman J. L. Function and Structure of Inherently Disordered Proteins. Curr. Opin. Struct. Biol. 2008, 18 (6), 756–764. 10.1016/j.sbi.2008.10.002. [DOI] [PubMed] [Google Scholar]
- Wright P. E.; Dyson H. J. Intrinsically Unstructured Proteins: Re-Assessing the Protein Structure-Function Paradigm. J. Mol. Biol. 1999, 293 (2), 321–331. 10.1006/jmbi.1999.3110. [DOI] [PubMed] [Google Scholar]
- Iakoucheva L. M.; Brown C. J.; Lawson J. D.; Obradović Z.; Dunker A. K. Intrinsic Disorder in Cell-Signaling and Cancer-Associated Proteins. J. Mol. Biol. 2002, 323 (3), 573–584. 10.1016/S0022-2836(02)00969-5. [DOI] [PubMed] [Google Scholar]
- Uversky V. N.; Oldfield C. J.; Dunker A. K. Intrinsically Disordered Proteins in Human Diseases: Introducing the D2 Concept. Annu. Rev. Biophys. 2008, 37 (1), 215–246. 10.1146/annurev.biophys.37.032807.125924. [DOI] [PubMed] [Google Scholar]
- Oldfield C. J.; Cheng Y.; Cortese M. S.; Brown C. J.; Uversky V. N.; Bunker A. K. Comparing and Combining Predictors of Mostly Disordered Proteins. Biochemistry 2005, 44 (6), 1989–2000. 10.1021/bi047993o. [DOI] [PubMed] [Google Scholar]
- Leuenberger P.; Ganscha S.; Kahraman A.; Cappelletti V.; Boersema P. J.; von Mering C.; Claassen M.; Picotti P. Cell-Wide Analysis of Protein Thermal Unfolding Reveals Determinants of Thermostability. Science (Washington, DC, U. S.) 2017, 355 (6327), eaai7825. 10.1126/science.aai7825. [DOI] [PubMed] [Google Scholar]
- Chen J. Towards the Physical Basis of How Intrinsic Disorder Mediates Protein Function. Arch. Biochem. Biophys. 2012, 524 (2), 123–131. 10.1016/j.abb.2012.04.024. [DOI] [PubMed] [Google Scholar]
- Dunker A. K.; Lawson J. D.; Brown C. J.; Williams R. M.; Romero P.; Oh J. S.; Oldfield C. J.; Campen A. M.; Ratliff C. M.; Hipps K. W.; Ausio J.; Nissen M.; Reeves R.; Kang C.; Kissinger C.; Bailey R.; Griswold M.; Chiu W.; Garner E.; Obradovic Z. Intrinsically Disordered Protein. J. Mol. Graphics Modell. 2001, 19 (1), 26–59. 10.1016/S1093-3263(00)00138-8. [DOI] [PubMed] [Google Scholar]
- Miskei M.; Gregus A.; Sharma R.; Duro N.; Zsolyomi F.; Fuxreiter M. Fuzziness Enables Context Dependence of Protein Interactions. FEBS Lett. 2017, 591 (17), 2682–2695. 10.1002/1873-3468.12762. [DOI] [PubMed] [Google Scholar]
- Mao A. H.; Crick S. L.; Vitalis A.; Chicoine C. L.; Pappu R. V. Net Charge per Residue Modulates Conformational Ensembles of Intrinsically Disordered Proteins. Proc. Natl. Acad. Sci. U. S. A. 2010, 107 (18), 8183–8188. 10.1073/pnas.0911107107. [DOI] [PMC free article] [PubMed] [Google Scholar]
- Das R. K.; Pappu R. V. Conformations of Intrinsically Disordered Proteins Are Influenced by Linear Sequence Distributions of Oppositely Charged Residues. Proc. Natl. Acad. Sci. U. S. A. 2013, 110 (33), 13392–13397. 10.1073/pnas.1304749110. [DOI] [PMC free article] [PubMed] [Google Scholar]
- Das R. K.; Huang Y.; Phillips A. H.; Kriwacki R. W.; Pappu R. V. Cryptic Sequence Features within the Disordered Protein P27Kip1 Regulate Cell Cycle Signaling. Proc. Natl. Acad. Sci. U. S. A. 2016, 113 (20), 5616–5621. 10.1073/pnas.1516277113. [DOI] [PMC free article] [PubMed] [Google Scholar]
- Grimmler M.; Wang Y.; Mund T.; Cilenšek Z.; Keidel E. M.; Waddell M. B.; Jäkel H.; Kullmann M.; Kriwacki R. W.; Hengst L. Cdk-Inhibitory Activity and Stability of P27Kip1 Are Directly Regulated by Oncogenic Tyrosine Kinases. Cell 2007, 128 (2), 269–280. 10.1016/j.cell.2006.11.047. [DOI] [PubMed] [Google Scholar]
- Beveridge R.; Chappuis Q.; Macphee C.; Barran P. Mass Spectrometry Methods for Intrinsically Disordered Proteins. Analyst 2013, 138 (1), 32–42. 10.1039/C2AN35665A. [DOI] [PubMed] [Google Scholar]
- Beveridge R.; Covill S.; Pacholarz K. J.; Kalapothakis J. M. D.; MacPhee C. E.; Barran P. E. A Mass-Spectrometry-Based Framework to Define the Extent of Disorder in Proteins. Anal. Chem. 2014, 86 (22), 10979–10991. 10.1021/ac5027435. [DOI] [PubMed] [Google Scholar]
- Stuchfield D.; Barran P. Unique Insights to Intrinsically Disordered Proteins Provided by Ion Mobility Mass Spectrometry. Curr. Opin. Chem. Biol. 2018, 42, 177. 10.1016/j.cbpa.2018.01.007. [DOI] [PubMed] [Google Scholar]
- Beveridge R.; Phillips A. S.; Denbigh L.; Saleem H. M.; MacPhee C. E.; Barran P. E. Relating Gas Phase to Solution Conformations: Lessons from Disordered Proteins. Proteomics 2015, 15 (16), 2872–2883. 10.1002/pmic.201400605. [DOI] [PMC free article] [PubMed] [Google Scholar]
- Boon P. L. S.; Saw W. G.; Lim X. X.; Raghuvamsi P. V.; Huber R. G.; Marzinek J. K.; Holdbrook D. A.; Anand G. S.; Grüber G.; Bond P. J. Partial Intrinsic Disorder Governs the Dengue Capsid Protein Conformational Ensemble. ACS Chem. Biol. 2018, 13 (6), 1621–1630. 10.1021/acschembio.8b00231. [DOI] [PubMed] [Google Scholar]
- Ivanov M. P.; Ladurner R.; Poser I.; Beveridge R.; Rampler E.; Hudecz O.; Novatchkova M.; Hériché J.; Wutz G.; van der Lelij P.; et al. The Replicative Helicase MCM Recruits Cohesin Acetyltransferase ESCO2 to Mediate Centromeric Sister Chromatid Cohesion. EMBO J. 2018, 37 (15), e97150 10.15252/embj.201797150. [DOI] [PMC free article] [PubMed] [Google Scholar]
- McCullough B. J.; Kalapothakis J. M. D.; Eastwood H.; Kemper P.; MacMillan D.; Taylor K.; Dorin J.; Barran P. E. Development of an Ion Mobility Quadrupole Time of Flight Mass Spectrometer. Anal. Chem. 2008, 80 (16), 6336–6344. 10.1021/ac800651b. [DOI] [PubMed] [Google Scholar]
- Jarrold M. F. Unfolding, Refolding, and Hydration of Proteins in the Gas Phase. Acc. Chem. Res. 1999, 32 (4), 360–367. 10.1021/ar960081x. [DOI] [Google Scholar]
- Migas L. G.; France A. P.; Bellina B.; Barran P. E. ORIGAMI: A Software Suite for Activated Ion Mobility Mass Spectrometry (AIM-MS) Applied to Multimeric Protein Assemblies. Int. J. Mass Spectrom. 2018, 427, 20–28. 10.1016/j.ijms.2017.08.014. [DOI] [Google Scholar]
- Fernandez De La Mora J. Electrospray Ionization of Large Multiply Charged Species Proceeds via Dole’s Charged Residue Mechanism. Anal. Chim. Acta 2000, 406 (1), 93–104. 10.1016/S0003-2670(99)00601-7. [DOI] [Google Scholar]
- Case D. A.; Ben-Shalom I. Y.; Brozell S. R.; Cerutti D. S.; Cheatham T. E. III; Cruzeiro V. W. D.; Darden T. A.; Duke R. E.; Ghoreishi D.; Gilson M. K.; Gohlke H.; Goetz A. W.; Greene D.; Harris R.; Homeyer N.; Izadi S.; Kovalenko A.; Kurtzman T.; Lee T. S.; LeGra S.; York D. M.; Kollman P. A.. AMBER 2018; University of California: San Francisco, 2018.
- Borysik A. J.; Kovacs D.; Guharoy M.; Tompa P. Ensemble Methods Enable a New Definition for the Solution to Gas-Phase Transfer of Intrinsically Disordered Proteins. J. Am. Chem. Soc. 2015, 137 (43), 13807–13817. 10.1021/jacs.5b06027. [DOI] [PubMed] [Google Scholar]
- Gibson S. C.; Feigerle C. S.; Cook K. D. Fluorometric Measurement and Modeling of Droplet Temperature Changes in an Electrospray Plume. Anal. Chem. 2014, 86 (1), 464–472. 10.1021/ac402364g. [DOI] [PubMed] [Google Scholar]
- Patriksson A.; Marklund E.; Van Der Spoel D. Protein Structures under Electrospray Conditions. Biochemistry 2007, 46 (4), 933–945. 10.1021/bi061182y. [DOI] [PubMed] [Google Scholar]
- Andersen H. C. Molecular Dynamics Simulations at Constant Pressure and/or Temperature. J. Chem. Phys. 1980, 72, 2384–2393. 10.1063/1.439486. [DOI] [Google Scholar]
- Konermann L.; Mcallister R. G.; Metwally H. Molecular Dynamics Simulations of the Electrospray Process: Formation of NaCl Clusters via the Charged Residue Mechanism. J. Phys. Chem. B 2014, 118, 12025–12033. 10.1021/jp507635y. [DOI] [PubMed] [Google Scholar]
- Porrini M.; Rosu F.; Rabin C.; Darré L.; Gómez H.; Gabelica V.; Européen I.; Chimie D.; Iecb B. Compaction of Duplex Nucleic Acids upon Native Electrospray Mass Spectrometry. ACS Cent. Sci. 2017, 3 (5), 454–461. 10.1021/acscentsci.7b00084. [DOI] [PMC free article] [PubMed] [Google Scholar]
- Shvartsburg A. a.; Mashkevich S. V.; Baker E. S.; Smith R. D. Optimization of Algorithms for Ion Mobility Calculations. J. Phys. Chem. A 2007, 111 (10), 2002–2010. 10.1021/jp066953m. [DOI] [PubMed] [Google Scholar]
- Siu C. K.; Guo Y.; Saminathan I. S.; Hopkinson A. C.; Siu K. W. M. Optimization of Parameters Used in Algorithms of Ion-Mobility Calculation for Conformational Analyses. J. Phys. Chem. B 2010, 114 (2), 1204–1212. 10.1021/jp910858z. [DOI] [PubMed] [Google Scholar]
- Miteva M.; Demirev P. A.; Karshikoff A. D. Multiply-Protonated Protein Ions in the Gas Phase: Calculation of the Electrostatic Interactions between Charged Sites. J. Phys. Chem. B 1997, 101 (46), 9645–9650. 10.1021/jp972249h. [DOI] [Google Scholar]
- Oh M. I.; Consta S. Stability of a Transient Protein Complex in a Charged Aqueous Droplet with Variable PH. J. Phys. Chem. Lett. 2017, 8 (1), 80–85. 10.1021/acs.jpclett.6b02319. [DOI] [PubMed] [Google Scholar]
- Sharawy M.; Consta S. How Do Non-Covalent Complexes Dissociate in Droplets? A Case Study of the Desolvation of DsDNA from a Charged Aqueous Nanodrop. Phys. Chem. Chem. Phys. 2015, 17 (38), 25550–25562. 10.1039/C5CP04331J. [DOI] [PubMed] [Google Scholar]
- Kim D.; Wagner N.; Wooding K.; Clemmer D. E.; Russell D. H. Ions from Solution to the Gas Phase: A Molecular Dynamics Simulation of the Structural Evolution of Substance P during Desolvation of Charged Nanodroplets Generated by Electrospray Ionization. J. Am. Chem. Soc. 2017, 139 (8), 2981–2988. 10.1021/jacs.6b10731. [DOI] [PubMed] [Google Scholar]
- Dole M.; Mack L. L.; Hines R. L.; Chemistry D. O.; Mobley R. C.; Ferguson L. D.; Alice M. B. Molecular Beams of Macroions. J. Chem. Phys. 1968, 49 (5), 2240–2249. 10.1063/1.1670391. [DOI] [Google Scholar]
- Kebarle P.; Tang L. From Ions in Solution to Ions in the Gas Phase. Anal. Chem. 1993, 65 (22), 972–986. 10.1021/ac00070a001. [DOI] [Google Scholar]
- Konermann L.; Ahadi E.; Rodriguez A. D.; Vahidi S. Unraveling the Mechanism of Electrospray Ionization. Anal. Chem. 2013, 85 (1), 2–9. 10.1021/ac302789c. [DOI] [PubMed] [Google Scholar]
Associated Data
This section collects any data citations, data availability statements, or supplementary materials included in this article.