
Figure 8. Kinetic proofreading at the TCR occurs with a half-life of 8 s.
(A) 20 nM PhyBt(740) was added to GFP-PIFS-TCR cells and a 660 nm pulse of 100% intensity was given for the indicated durations. The calcium influx was quantified over time, indicating that longer pulse durations switch more PhyB OFF molecules to the ON state. Stimuli addition is marked by an arrow and the illumination procedure by a bar above the graph (grey = dark, orange = 660 nm). (B) Experiment as in (A) were performed using 6.3 nM or 20 nM PhyBt and 32% or 100% intensity 660 nm light. The data is shown together with the fit and estimated SD. Results in (A) and (B) show one experiment of n > 3. (C) The estimated half-lives of the PhyB-TCR complex in dependence on the light intensity. (D) The profile likelihood of the KPR time shows that the 95% confidence interval (CI) ranges from 3 s to 19 s, while the best-fit value is 8 s.
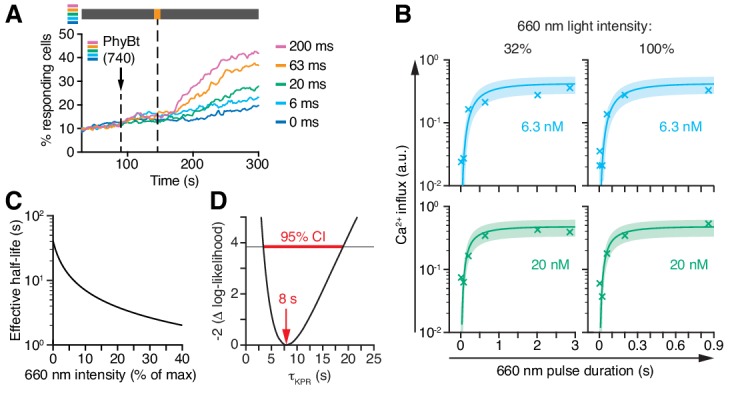
Figure 8—figure supplement 1. All model parameters are identifiable.
