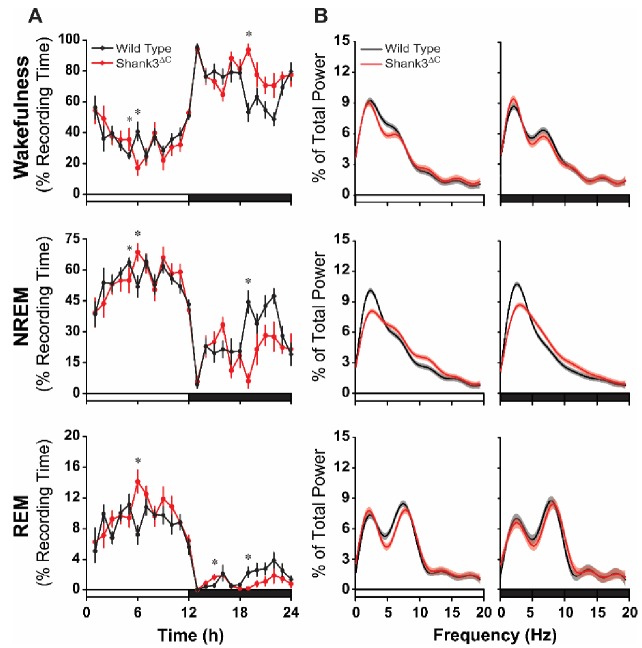
Figure 2. Shank3∆C mice sleep less during the dark period and show altered EEG spectral power under baseline conditions.
The rows represent the vigilance states of wakefulness (top), NREM sleep (middle), and REM sleep (bottom). (A) Time spent in wakefulness and sleep shown as percentage of recording time per hour. Values are means ± SEM. Repeated measures ANOVA with posthoc pairwise comparisons using Sidak correction; *p<0.05, difference from wild type. (B) EEG spectral power normalized as a percentage of the total state-specific EEG power for the light period (left) and dark period (right) fit to smooth curves (solid lines) and expressed with 95% confidence intervals (gray and red shading). Non-overlap of the 95% confidence interval denotes statistically significant differences. The open bars on the x-axis denote the light period and the filled bars denote the dark period of the light:dark cycle. Wild type (n = 10) and Shank3∆C (n = 10) mice.


