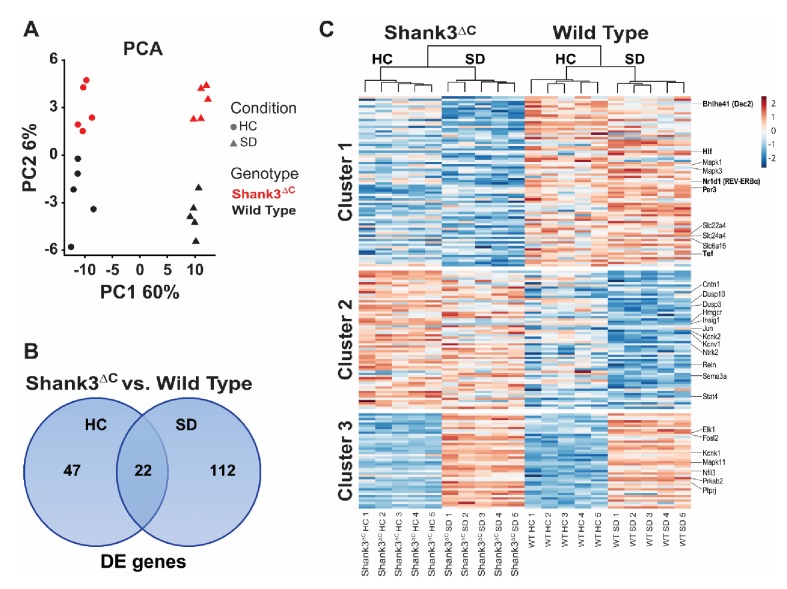
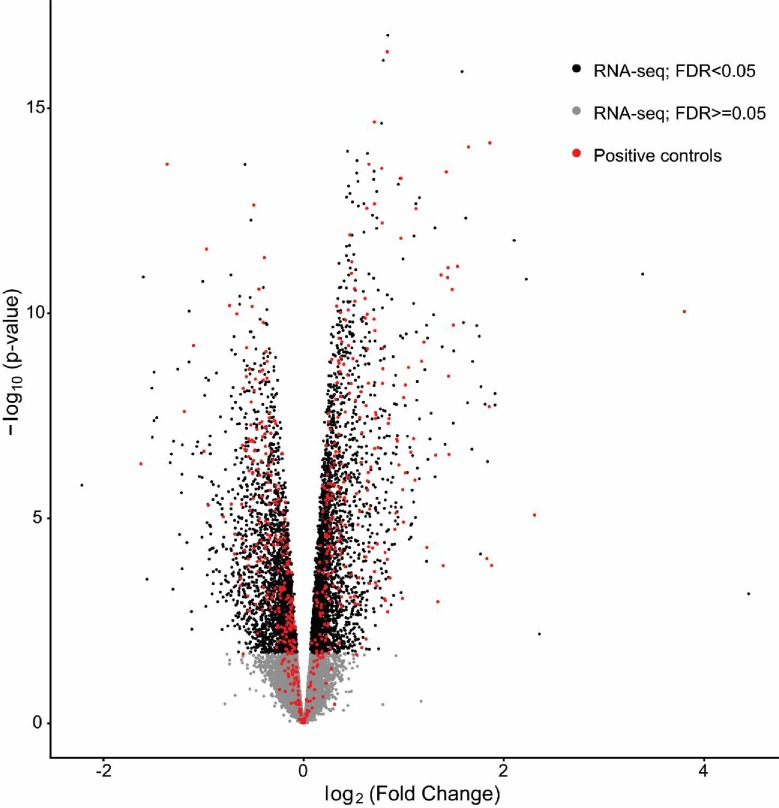
Figure 4. Sleep deprivation induces a two-fold difference in gene expression between Shank3ΔC and wild type mice.
RNA-seq study of gene expression from prefrontal cortex obtained from adult male Shank3ΔC and wild type mice either under control homecage conditions (HC) or following 5 hr of sleep deprivation (SD). N = 5 mice per group. (A) Principal component analysis of normalized RNA-seq data shows that sleep deprivation is the main source of variance in the data (first principal component, PC1) and genotype is the second (second principal component, PC2). Percent variance explained by each PC is shown on each axis. (B) Venn diagram showing the number of genes differentially expressed at FDR < 0.1 between Shank3ΔC and wild type mice in either control HC conditions or after SD. (C) Heat map of average scaled gene expression for all genes in (B). K-means clustering defined three clusters based on differences in gene expression across all comparisons. Genes belonging to the MAPK pathway and involved in circadian rhythms (see Table 2) are highlighted on the right.


