Abstract
During early mammalian development, the chromatin landscape undergoes profound transitions. The Zdbf2 gene—involved in growth control—provides a valuable model to study this window: upon exit from naïve pluripotency and prior to tissue differentiation, it undergoes a switch from a distal to a proximal promoter usage, accompanied by a switch from polycomb to DNA methylation occupancy. Using a mouse embryonic stem cell (ESC) system to mimic this period, we show here that four enhancers contribute to the Zdbf2 promoter switch, concomitantly with dynamic changes in chromatin architecture. In ESCs, the locus is partitioned to facilitate enhancer contacts with the distal Zdbf2 promoter. Relieving the partition enhances proximal Zdbf2 promoter activity, as observed during differentiation or with genetic mutants. Importantly, we show that 3D regulation occurs upstream of the polycomb and DNA methylation pathways. Our study reveals the importance of multi-layered regulatory frameworks to ensure proper spatio-temporal activation of developmentally important genes.
Research organism: Mouse
Introduction
During the early stages of mammalian development, as the embryo implants into uterine wall, the pluripotent cells that will go on to form somatic tissues transition from ‘naïve’ to ‘primed’ for lineage specification (Nichols and Smith, 2009). One hallmark of the naïve pluripotent state is globally low DNA methylation, whereas primed cells are highly DNA methylated (Seisenberger et al., 2012). Incidentally, chromatin architecture and the underlying histone modifications are also dramatically remodeled during this period (Lee et al., 2014; Xu and Xie, 2018). Collectively, this process is referred to as epigenetic reprogramming, and it accompanies dynamic changes to the transcriptional landscape.
Yet, during the naïve-to-primed transition, certain genes must maintain constant expression despite the massively reshaping epigenome underfoot. A well-documented mechanism during this window is the phenomenon of enhancer switching: as cells differentiate, and therefore express a different suite of transcription factors, enhancers specific for the naïve state will cease their activity, and enhancers attuned to the primed state will become active. In this manner, distinct enhancers can regulate the same promoter, thus ensuring continuous expression. Notably, the general regulator of pluripotency Oct4 (also known as Pou5f1) relies on an naïve and primed cell-specific enhancers (Tesar et al., 2007; Yeom et al., 1996), as does the developmental regulator Nodal (Papanayotou et al., 2014). Recently, it was demonstrated that the transcription factor GRHL2 coordinates a large set of these enhancer switches for epithelial genes by activating the primed set of enhancers during differentiation (Chen et al., 2018).
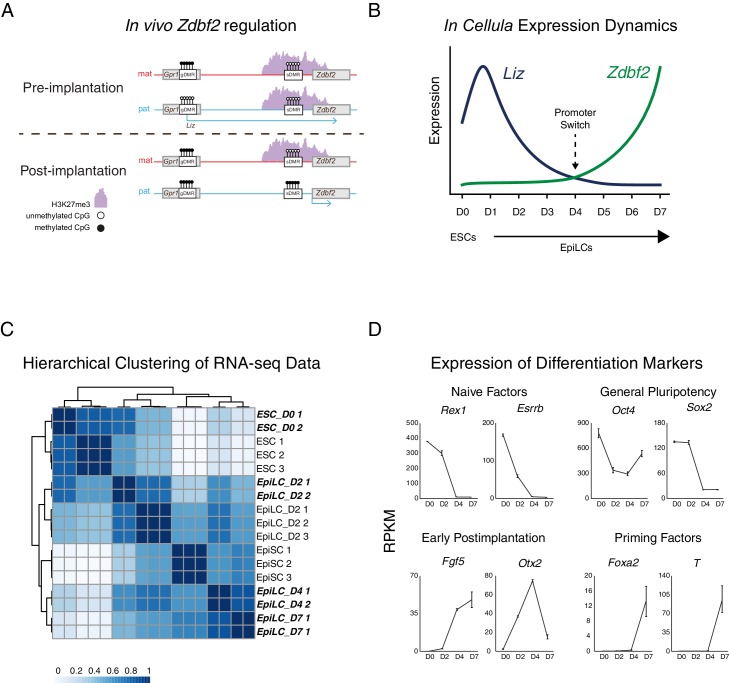
The Zdbf2 locus exhibits an alternative strategy to maintain expression during this cellular transition. In the naïve state, the distal Long isoform of Zdbf2 promoter (pLiz) is active. As cells exit naïve pluripotency, a promoter switch occurs, resulting in activation of the proximal Zdbf2 promoter (pZdbf2), located 73 kilobases (kb) downstream. From the primed state and then throughout life, pZdbf2 is the functional promoter while pLiz is constitutively silenced. It should be noted that despite the genomic distance, there is no change in the message between the Liz and Zdbf2 isoforms, thus the promoter switch does not result in protein diversity. Rather, there is a stratified relationship between the two promoters: pLiz activity is absolutely required for imprinted deposition of DNA methylation at a somatic differentially methylated region (sDMR). The sDMR DNA methylation, in turn, antagonizes a block of polycomb-mediated repression, freeing pZdbf2 (Figure 1—figure supplement 1A) (Duffié et al., 2014; Greenberg et al., 2017). Mice that are deficient for pLiz are never able to activate pZdbf2, and this leads to a substantial growth defect. Thus, the Zdbf2 locus provides a valuable model to dissect how promoter switching occurs in concert with changing chromatin dynamics during cellular differentiation.
We show here using a cell-based approach that several enhancers cooperate to regulate the dynamics activity of the different Zdbf2 promoters. Moreover, CCCTC-BINDING FACTOR (CTCF)-mediated contacts at the locus change dynamically during differentiation, and contribute to the sequential activity of the Zdbf2 promoters. Saliently, 3D organization of the locus appears to exert its effect epistatically with respect to the DNA methylation and polycomb pathways. This implies that there are two layers of chromatin-based control of Zdbf2: one at the level of chromatin marks and the other at the level of chromatin architecture. The highly regulated nature of Zdbf2 underscores the importance of structural chromosome topology occurring in concert with chromatin marks to control proper spatio-temporal expression of developmentally consequential genes.
Results
Two classes of putative enhancers lie in the Zdbf2 locus
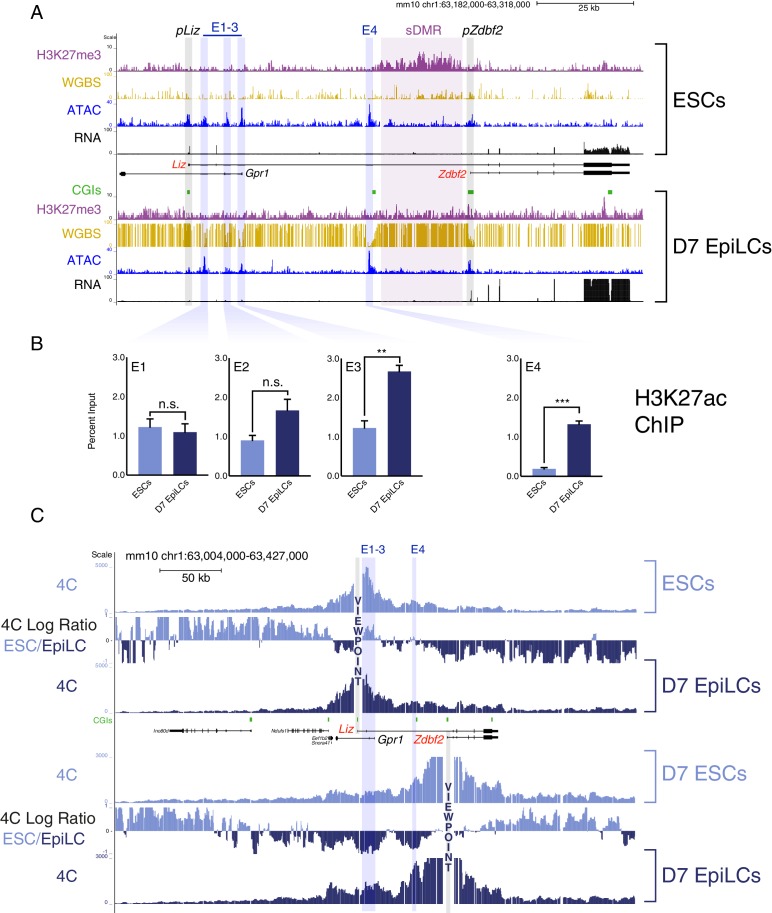
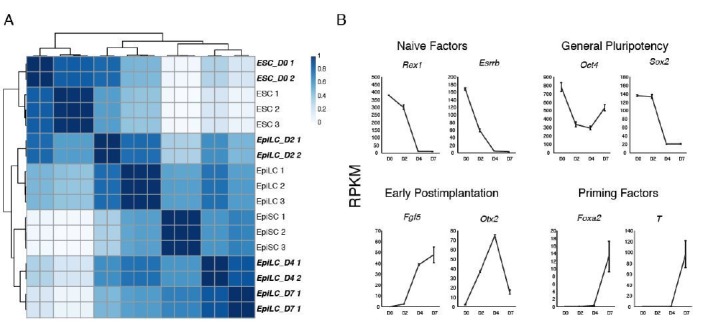
To discover functional genetic elements that regulate Zdbf2 alternative promoter usage during de novo DNA methylation, we performed an assay for transposase-accessible chromatin followed by sequencing (ATAC-Seq) (Buenrostro et al., 2013) on DNA hypomethylated naïve ESCs (cultured in 2i/LIF + vitC) and on primed, highly DNA methylated epiblast-like cells (EpiLCs) at day 7 (D7) of differentiation (Figure 1A). A protracted differentiation protocol is necessary to observe the promoter-switch dynamics (Figure 1—figure supplement 1B) (Greenberg et al., 2017), which distinguishes this protocol from typical short-term EpiLC differentiation methods that generally last two or three days. As such, the transcriptome at later time-points of differentiation is more in line with primed epiblast stem cells (EpiSCs) in culture, as opposed to ‘formative’ EpiLCs (Figure 1—figure supplement 1C,D) (Bao et al., 2018; Kalkan and Smith, 2014). For clarification, we therefore refer to these cells as D7 EpiLCs. In this cellular system, the imprinted status of the locus is lost, but it biallelically recapitulates all events occurring in vivo on the paternal allele, including the pLiz to pZdbf2 promoter usage switch and sDMR methylation (Greenberg et al., 2017). As expected, the ATAC-Seq peak for pLiz diminished as it became repressed and DNA methylated from ESCs to D7 EpiLCs. An ATAC-Seq peak was present at pZdbf2 in ESCs and further enhanced in D7 EpiLCs; this is correlated with our previous data indicating that pZdbf2 is bivalent and poised in ESCs (Greenberg et al., 2017; Mas et al., 2018).
Figure 1. The Zdbf2 locus exhibits dynamic enhancer activity during differentiation.
(A) Chromatin and expression landscape at the Zdbf2 locus in ESCs (top) and D7 EpiLCs (bottom). In hypomethylated naïve ESCs, Zdbf2 initiates from the pLiz promoter while a ~ 25 kb block of H3K27me3 extends through pZdbf2. Upon EpiLC differentiation, the H3K27me3 signal depletes while DNA methylation is gained; the pLiz ATAC-seq peak decreases concomitantly with decreased expression, while pZdbf2 becomes the main promoter. Four prominent ATAC-seq peaks of accessible chromatin (E1 to E4) lie between pLiz and pZdbf2 promoters. WGBS: Whole genome bisulfite sequencing. H3K27me3 ChIP-seq data is from Greenberg et al. (2017). All other genomics data were generated for this study. One representative biological replicate is displayed for each RNA-seq track. (B) H3K27ac ChIP-qPCR shows enrichment for this mark at E1 to E3 in ESCs and D7 EpiLCs, while E4 only becomes enriched in EpiLCs. Data shown as ±s.e.m. from three biological replicates. (C) 4C-seq tracks from the pLiz (top) and pZdbf2 (bottom) viewpoints (VPs) in ESCs and D7 EpiLCs. ESC/EpiLC ratio between 4C-seq signals is indicated. pLiz interactions with E1-3 are more frequent in ESCS, but remain high in EpiLCs, likely due to proximity. pLiz seems less restricted in EpiLCs, with interactions spreading on the ‘right’ side of the locus. pZdbf2 exhibits increased interactions at E1 to E4 in EpiLCs over ESCs. Data from one representative biological replicate (two total). Statistical analyses were performed by two-tailed unpaired t-test: n.s = not significant, **p≤0.01, ***p≤0.001.
Figure 1—figure supplement 1. Zdbf2 expression dynamics during differentiation.
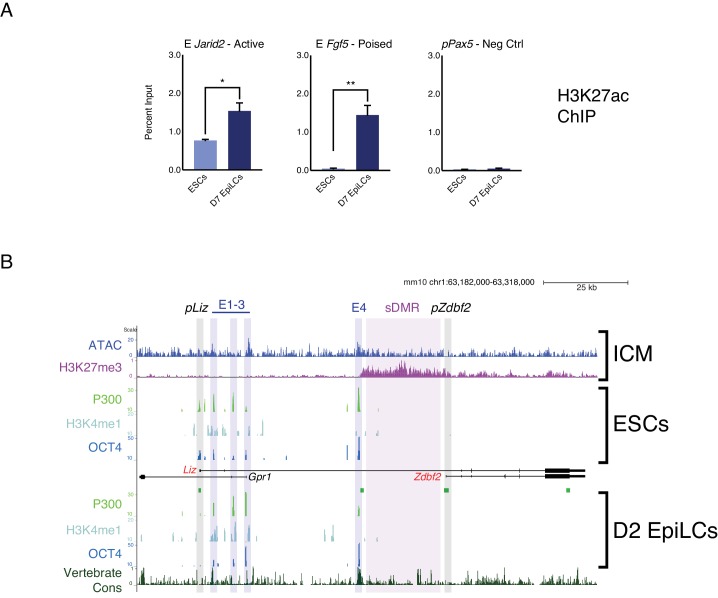
Figure 1—figure supplement 2. Chromatin landscape of the Zdbf2 locus in cellula and in vivo.
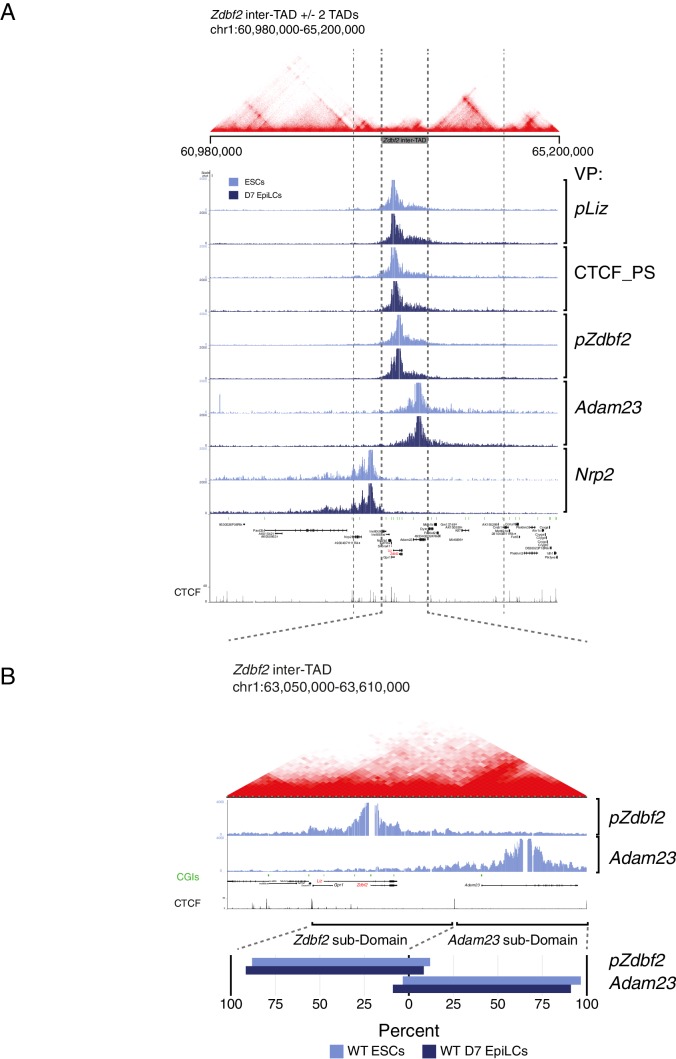
Figure 1—figure supplement 3. Zdbf2 locus interactions restricted within inter-TAD region.
In between the two promoters, four significant peaks were present in both ESCs and D7 EpiLCs, three proximal to pLiz (E1-3), and one adjacent to a CpG island (CGI) that is an apparent border to the polycomb H3K27me3 block in ESCs (E4) (Figure 1A). Given that these regions of accessible chromatin were not lying on obvious active promoters, we reasoned that they were potential enhancer elements and named them E1 to E4, from the closest to the most distal to pLiz. Therefore we assayed for enrichment of H3K27 acetylation (H3K27ac), a mark of active enhancer elements (Creyghton et al., 2010). E1-3 appeared enriched for the H3K27ac mark in both cell types, while E4 was enriched for the mark only in D7 EpiLCs (Figure 1B). Thus, while E1-3 can be classified as active in ESCs and EpiLCs, the chromatin accessibility and H3K27ac dynamics at E4 are reminiscent of so-called ‘poised’ enhancers (Figure 1—figure supplement 2A) (Buecker et al., 2014; Rada-Iglesias et al., 2011). Moreover, publicly available data indicate that E4 is marked by P300 in ESCs and shows high levels of vertebrate conservation (Figure 1—figure supplement 2B), two more features of poised enhancers (Rada-Iglesias et al., 2011). OCT4 is enriched at all of the putative enhancers in both naïve ESCs and D7 EpiLCs (two pluripotent cell types), indicating that both classes of enhancers are likely regulated in a pluripotency-dependent manner (Buecker et al., 2014). Importantly, publicly available in vivo data from the naïve pluripotent inner cell mass (ICM) of the blastocyst exhibit a chromatin accessibility and H3K27me3 pattern akin to what we observed in ESCs for the Zdbf2 locus, suggesting that the in vivo and in cellula regulation are coherent (Figure 1—figure supplement 2B) (Liu et al., 2016; Wu et al., 2016).
High resolution 4C reveals enhancer-promoter dynamic interactions
Given that E1-4 exhibit the chromatin signature of enhancer elements, it is possible that the Liz and Zdbf2 promoters undergo dynamic interactions with these regulatory elements during the ESC to EpiLC transition. To test this, we performed high-resolution circular chromosome conformation capture followed by sequencing (4C-seq) during differentiation (Noordermeer et al., 2011; van de Werken et al., 2012). Mammalian genomes are physically subdivided into ‘regulatory neighborhoods’ known as topologically associated domains (TADs), which average roughly one megabase in size (Dixon et al., 2012; Nora et al., 2012); available Hi-C data from mouse ESCs indicates that the Zdbf2 locus exists within an ‘inter-TAD’ that spans ~650 kb (Figure 1—figure supplement 3A) (Bonev et al., 2017). Our 4C-seq data further allowed us to subdivide this inter-TAD, with intra-Zdbf2 locus and intra-Adam23 locus interactions occurring in relatively mutually exclusive domains (Figure 1—figure supplement 3B).
Using the pLiz as a 4C-seq viewpoint (VP), we did not observe distal looping that occurred at high frequency in either ESCs or D7 EpiLCs (Figure 1C). However, in ESCs, when Liz is expressed, the pLiz promoter did exhibit increased interactions with the E1-3 cluster relative to EpiLCs, all of which are marked by H3K27ac in this cell type (Figure 1B). This is consistent with the possibility that E1-3 contribute to pLiz regulation. Given the close proximity between pLiz and E1-3, interactions remained unsurprisingly high in EpiLCs, when Liz is repressed. No marked looping appeared to occur between pLiz and E4 in either ESCs or D7 EpiLCs.
A clear picture emerged from the analysis for the Zdbf2 promoter (pZdbf2), which is active in D7 EpiLCs while E1-4 are all marked by H3K27ac. Our 4C-seq revealed that pZdbf2 exhibited increased contacts with all four of the putative enhancers in D7 EpiLCs (Figure 1C). This indicates a potential cooperative role for E1-4 in activating pZdbf2.
Determination of enhancer function and regulation
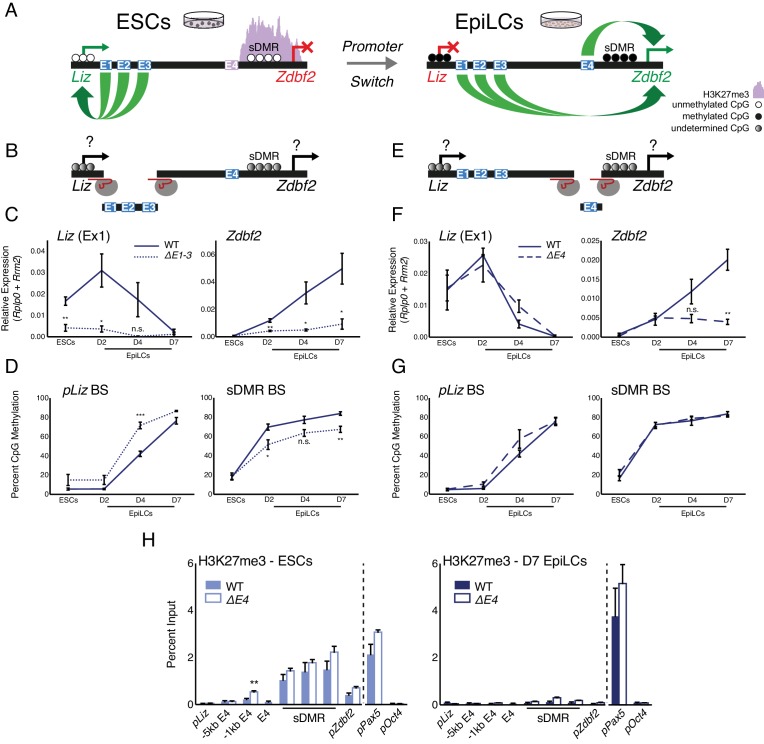
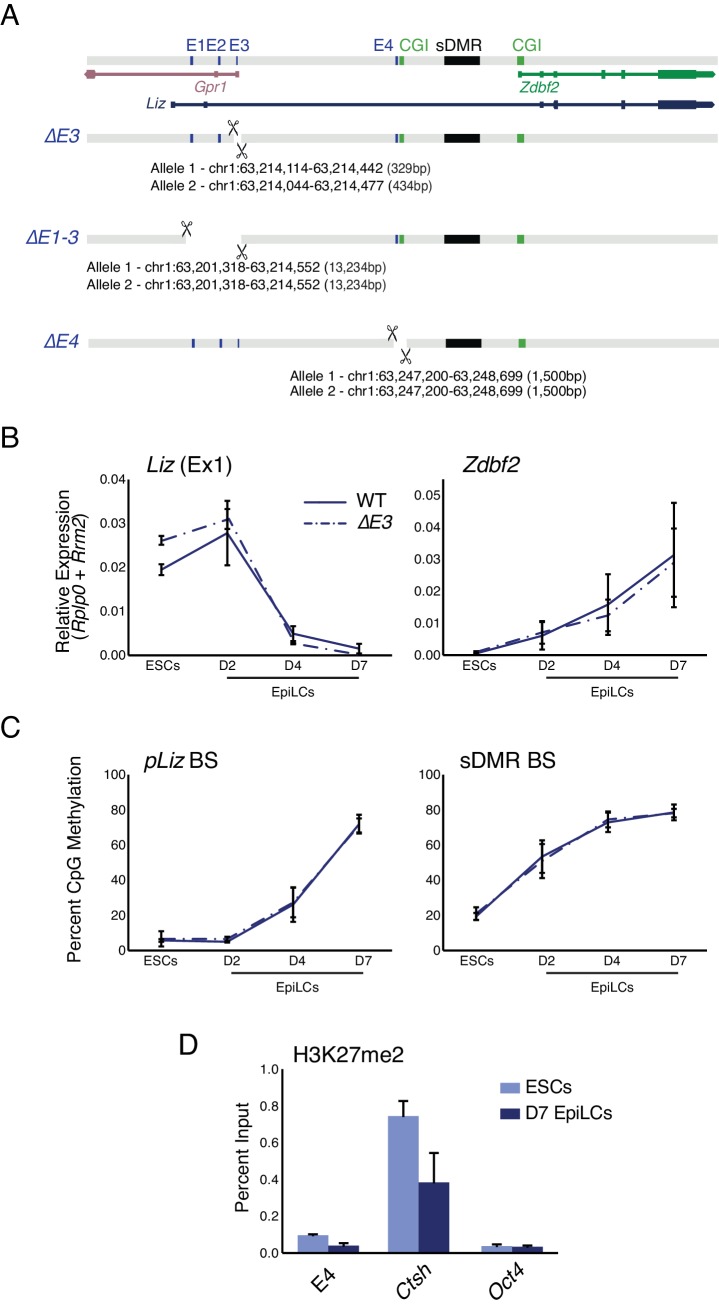
From our 4C-seq analyses we reasoned that E1-3 potentially regulate pLiz in ESCs, while E4 is inactive (Figure 2A). To test this, we generated homozygous deletions of combinations of putative enhancer elements (Figure 2—figure supplement 1A). The E3 element also serves as the promoter of the Gpr1 gene, which is lowly expressed in our system and we previously showed plays no role in Zdbf2 regulation (Greenberg et al., 2017). As such, deleting the element had no impact on expression or DNA methylation at the Zdbf2 locus (Figure 2—figure supplement 1B,C). If E3 is an enhancer element, it may be redundant with E1 and/or E2. Therefore, we generated a ~ 13 kb deletion that encompassed E1-3 (Figure 2B, Figure 2—figure supplement 1A). In the absence of these elements, the Liz transcript was markedly repressed, and the canonical Zdbf2 isoform failed to properly activate (Figure 2C). As Liz transcription is required to activate pZdbf2, it should be noted that this deletion does not confirm E1-3 elements regulate pZdbf2 directly. However, the data provide a strong indication that E1-3 are indeed enhancers of pLiz.
Figure 2. Genetic deletions of enhancer elements impact pLiz/pZdbf2 regulation.
(A) Model for enhancer regulation based on 4C-seq data. (B) Model for deletion of E1-3.. (C) RT-qPCR of Liz (left) and Zdbf2 (right) during EpiLC differentiation in WT and the ∆E1-3 mutant. The ∆E1-3 mutation significantly reduces both transcripts. Data are shown as ±s.e.m. from five and three biological replicates for WT and mutant, respectively. (D) DNA methylation of pLiz (left) and the sDMR (right) during EpiLC differentiation as measured by bisulfite conversion followed by pyrosequencing (BS-pyro) in WT and the ∆E1-3 mutant. When Liz fails to activate, DNA methylation is acquired faster at pLiz, and fails to properly accumulate at the sDMR. Data shown as ±s.e.m. from five and three biological replicates for WT and mutant, respectively. (E) Model for deletion of E4. (F) RT-qPCR of Liz (left) and Zdbf2 (right) during EpiLC differentiation in WT and the ∆E4 mutant. There is no effect on Liz expression dynamics, but Zdbf2 does not properly activate. Data shown as ±s.e.m. from four biological replicates for each genotype. (G) DNA methylation of pLiz (left) and the sDMR (right) during EpiLC differentiation as measured by BS-pyro in WT and the ∆E4 mutant. DNA methylation is unperturbed in the ∆E4 mutant. Data are shown as ±s.e.m. from four biological replicates for each genotype. (H) H3K27me3 ChIP-qPCR in ESCs (left) and EpiLCs (right). There is no significant effect on polycomb dynamics in ∆E4 mutation, except mild ectopic spreading upstream of the sDMR region. pPax5 and pOct4 are positive and negative controls, respectively. Data shown as ±s.e.m. from three biological replicates for each genotype. Statistical analyses were performed by two-tailed unpaired t-test: n.s = not significant, *p≤0.05, **p≤0.01, ***p≤0.001.
Figure 2—figure supplement 1. E3 deletion has minimal effect on locus regulation, E4 is devoid of PRC2 signature.
We previously showed that DNA methylation accumulates at pLiz after Liz transcription ablates (Greenberg et al., 2017). Interestingly, in the absence of E1-3, DNA methylation accumulated faster at pLiz, perhaps indicating less protection from de novo DNA methyltransferases due to reduced transcription factor occupancy (Figure 2D). Liz transcription is required for cis DNA methylation establishment at the sDMR region in cellula and in vivo (Greenberg et al., 2017). In the absence of E1-3, DNA methylation failed to properly accumulate at the sDMR region, reaching 67% by D7 (Figure 2D). This was likely as a consequence of reduced Liz expression, in agreement with the 45% sDMR methylation we previously reported upon complete deletion of pLiz (∆Liz) (Greenberg et al., 2017).
Upon the pLiz-to-pZdbf2 promoter switch, E4 becomes enriched for H3K27ac. We hypothesized that a deletion for E4 would have minimal impact on pLiz, but may affect pZdbf2 activity (Figure 2A,E). Indeed, ∆E4 mutant cells exhibited no alteration of Liz expression, but Zdbf2 transcripts were strongly reduced (Figure 2F). As Liz was unaffected, there was no impact on DNA methylation at the locus (Figure 2G). Moreover, reduced expression of Zdbf2 in ∆E4 EpiLCs did not correlate with maintained polycomb occupancy in the sDMR region and pZdbf2 (Figure 2H). In sum, the enhancer E4 is necessary for pZdbf2 activation, irrespective of the local DNA methylation or polycomb status.
The E4 enhancer element bears the hallmark of a poised enhancer in that it is enriched for P300 in ESCs, but only becomes active in EpiLCs. However, poised enhancers were originally defined as being enriched for H3K27me3 (Rada-Iglesias et al., 2011), whereas E4 is depleted for the mark (Figure 2H). H3K27me2, which like H3K27me3 is deposited by polycomb repressive complex 2 (PRC2), has also been reported to prevent firing of enhancers in ESCs (Ferrari et al., 2014). Yet H3K27me2 ChIP analysis revealed that E4 is relatively depleted for this mark as well (Figure 2—figure supplement 1D). E4 does seem to play a role in preventing ectopic polycomb spreading: deleting E4 resulted in a slight increase of H3K27me3 enrichment 1 kb upstream of the WT polycomb domain, however the signal was identical to WT levels by 5 kb upstream (Figure 2H).
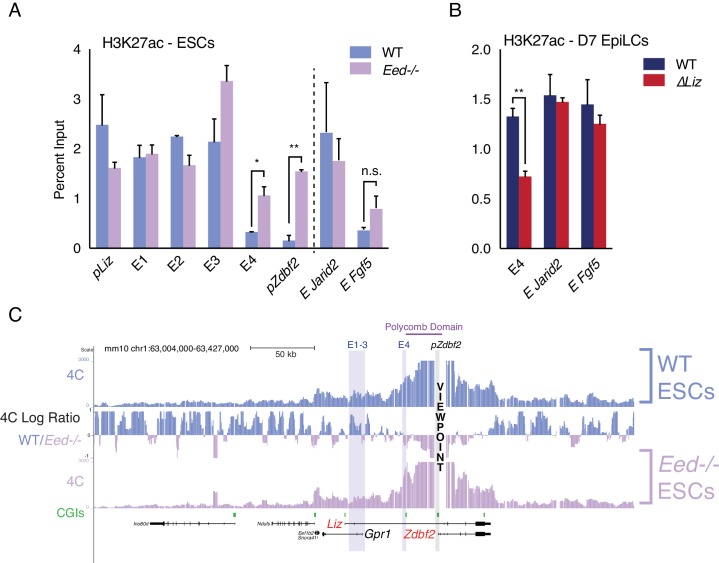
We previously showed that in ESCs containing loss-of-function mutations in the Embryonic ectoderm development (Eed) gene (Schoeftner et al., 2006)—a core component of PRC2—there was precocious activation of pZdbf2 (Greenberg et al., 2017). Therefore, we wanted to observe if a PRC2 mutant would result in a change in the chromatin status of E4. Indeed, both E4 and pZdbf2 became enriched for H3K27ac in the absence of polycomb-mediated repression in ESCs (Figure 3A). Incidentally, pLiz and E1-3, which are already active in ESCs, exhibited no significant change. In ∆Liz mutants, pZdbf2 remains polycomb repressed (Greenberg et al., 2017). As such, in the ∆Liz mutant, the E4 enhancer did not attain complete levels of H3K27ac during EpiLC differentiation (Figure 3B). Thus, while E4 does not display the signatures of direct polycomb regulation, per se, its activity is controlled in a polycomb-dependent manner.
Figure 3. Polycomb regulates E4, but plays minor role in chromosome conformation.
(A) H3K27ac ChIP-qPCR in WT and Eed-/- ESCs. H3K27ac levels are unaffected at pLiz and E1-3, but E4 and pZdbf2 become aberrantly activated in Eed-/- ESCs. Data shown as ±s.e.m. from two biological replicates for both genotypes. (B) H3K27ac ChIP-qPCR in WT and ∆Liz EpiLCs. In ∆Liz mutants, when the sDMR remains enriched for H3K27me3, E4 remains diminished for H3K27ac. Data shown as ±s.e.m. from three biological replicates for both genotypes. (C) 4C-seq tracks from the pZdbf2 VP in WT and Eed-/- ESCs. Ratios between 4C-seq signals is indicated in between the samples. In Eed mutants, pZdbf2 exhibits increased interactions at E4, but not E1-3. Statistical analyses were performed by two-tailed unpaired t-test: n.s = not significant, *p≤0.05, **p≤0.01.
Figure 3—figure supplement 1. Liz exerts minimal effect on chromosome conformation at the Zdbf2 locus 4C-seq tracks from the pZdbf2 VP in ∆Liz ESCs and EpiLCs and WT EpiLCs.
Liz transcription and polycomb play a minor role in 3D organization of the locus
During differentiation, the transcription initiated from pLiz and traversing the locus is required for polycomb-to-DNA methylation switch, and pZdbf2 activation (Greenberg et al., 2017). However, our 4C-seq analysis revealed that in the absence of Liz transcription, there is only a minor effect on the distal interaction landscape of pZdbf2 (Figure 3—figure supplement 1). Moreover, in ∆Liz EpiLCs, pZdbf2 exhibited increased interactions with E1-4, but not to the same extent as WT EpiLCs. It should be noted that the ∆Liz DNA methylation phenotype is only partial in the cell-based system, which may account for the intermediate chromosome conformation phenotype.
The polycomb region that regulates pZdbf2 spans ~ 25 kb, from E4 and into the body of Zdbf2 (Figure 1A). Consistent with previous reports, in ESCs this region forms a tightly packed domain (Kundu et al., 2017) (Figure 1C). We performed 4C-seq in Eed mutant ESCs in order to determine if polycomb impacts the chromosome conformation (Figure 3C). In fact, in a PRC2 mutant, pZdbf2 interacted even more frequently within the domain normally defined by a polycomb block in WT cells. This is likely due to the activation of E4, and increased promoter-enhancer interactions. It has recently been shown that active promoters exhibit increased agitation in the nucleus, leading to a potential increase of promoter-enhancer contacts (Gu et al., 2018). Given that pZdbf2 becomes preciously active in Eed mutant ESCs, logic would dictate that it would interact more frequently with E1-3, which are also active. However, our 4C-seq in the polycomb mutant showed that this was not the case (Figure 3C). To summarize, Liz transcription and the polycomb status play a limited role in the regulation of the pZdbf2 interaction landscape in ESCs, and there must be other mechanisms in place.
CTCF partitions the Zdbf2 locus in ESCs
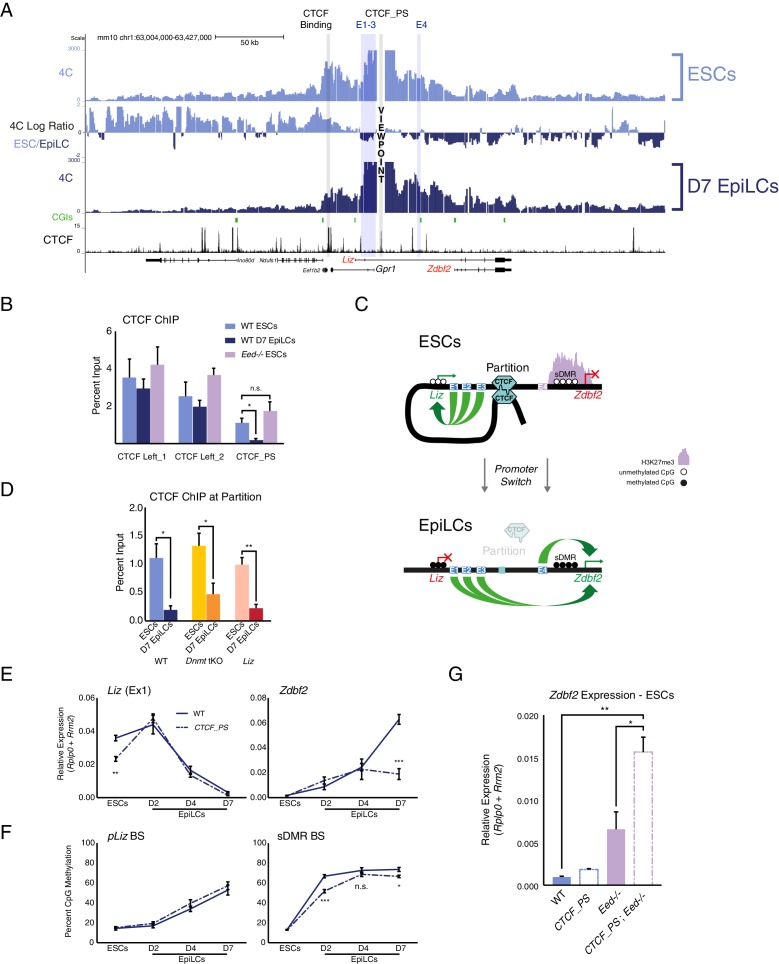
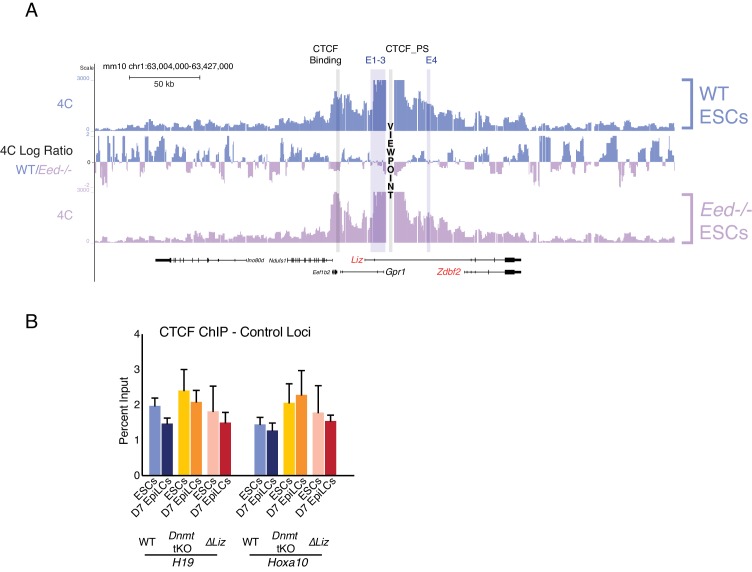
Given that pZdbf2 does not interact with E1-3 in polycomb mutant ESCs, those enhancers must be restricted from forming long-range loops. The most likely candidate to contribute to locus organization is CTCF (Ong and Corces, 2014). We analyzed the 4C-seq patterns of four CTCF binding sites (Stadler et al., 2011) present throughout the locus (data available upon request). In ESCs, a CTCF-binding site proximal to the Gpr1 promoter formed a looping structure with two CTCF sites downstream of the Gpr1 gene (Figure 4A). Incidentally, pLiz and E1-3 co-reside within this genomic segment. During differentiation to EpiLCs, we found that the pLiz/E1-3 interactions are reduced. In accordance, CTCF binding at this site depleted, whereas CTCF remained bound at the sites downstream of Gpr1 (Figure 4B). Therefore, we referred to this binding platform as the ‘CTCF_partition site’ (CTCF_PS), which physically separates the active pLiz/E1-3 region from the silent pZdbf2/E4 region in ESCs (Figure 4C). In EpiLCs, disappearance of CTCF at the partition site would then allow for pZdbf2 to interact with E1-3, while pLiz is silenced.
Figure 4. The Zdbf2 locus is partitioned by CTCF, which instructs expression dynamics.
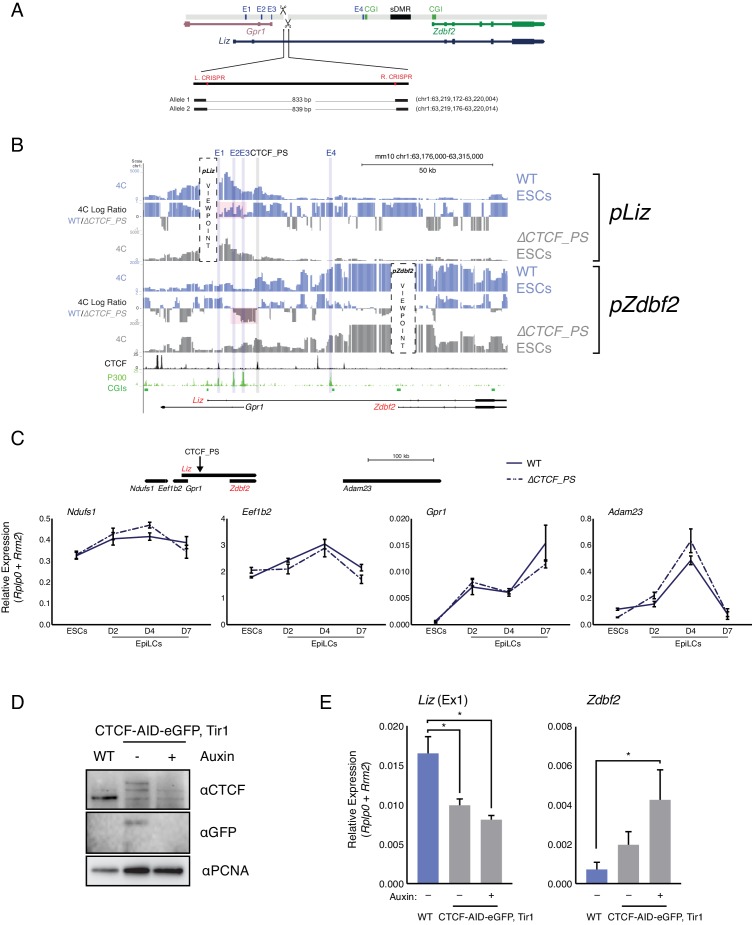
(A) 4C-seq tracks from the CTCF_PS VP in WT ESCs and EpiLCs. Ratios between 4C-seq signals is indicated between the samples, and gene and CTCF binding tracks (Stadler et al., 2011) are below. The CTCF_PS forms a loop with two CTCF sites downstream of the Gpr1 gene. The looping diminishes in EpiLCs. (B) CTCF ChIP-qPCR in WT ESCs and EpiLCs and Eed-/- ESCs. CTCF binding remains unchanged in all conditions on the two sites downstream of Gpr1 (termed CTCF Left_1 and Left_2). At the CTCF_PS, CTCF binding reduces from WT ESCs to EpiLCs, which is correlated with decreased interactions between CTCF_PS and the two upstream CTCF sites. CTCF binding remains enriched in Eed-/- ESCs, consistent with the maintained loop structure. Data shown as ±s.e.m. from three biological replicates. (C) CTCF ChIP-qPCR in WT, Dnmt tKO and ∆Liz ESCs and EpiLCs. CTCF binding is depleted at the CTCF_PS in EpiLCs in all three contexts. Data shown as ±s.e.m. from three biological replicates. (D) Model for CTCF-mediated partitioning of the locus. In ESCs, pLiz and E1-3 are active, and physically separated from the silent E4 and pZdbf2. During differentiation, the partition is diminished, allowing E1-3 to bolster pZdbf2 activation, while pLiz has become silent. (E) RT-qPCR of Liz (left) and Zdbf2 (right) during EpiLC differentiation in WT and the ∆CTCF_PS mutant. Liz is less expressed in mutant ESCs, but reaches WT levels of expression during differentiation. Nevertheless, Zdbf2 does not properly activate in the mutant. Data are shown as ±s.e.m. from four biological replicates for each genotype. (F) DNA methylation of pLiz (left) and the sDMR (right) during EpiLC differentiation as measured by BS-pyro in WT and the ∆ mutant. DNA methylation is unperturbed in the mutant at pLiz, but is reduced at the sDMR. Data shown as ±s.e.m. from four biological replicates for each genotype. (G) RT-qPCR of Zdbf2 in ESCs in absence of CTCF partition and/or PRC2. While Zdbf2 is already upregulated in the Eed mutant, this effect is exacerbated in the absence of the partition, likely because pZdbf2 is less restrained from interacting with E1-3. Data shown as ±s.e.m. from three biological replicates for each genotype. Statistical analyses were performed by two-tailed unpaired t-test: n.s. = not significant, *p≤0.05, **p≤0.01, ***p≤0.001.
Figure 4—figure supplement 1. CTCF dynamics maintained in polycomb, DNA methylation, and Liz mutant background.
Figure 4—figure supplement 2. CTCF_PS deletion impacts locus regulation.
Figure 4—figure supplement 3. Polycomb and 3D organization both impact Zdbf2 activation.
Using the CTCF_PS as a VP in our Eed mutant ESCs, we observed that the partition loop still formed in absence of polycomb (Figure 4—figure supplement 1A). Furthermore, CTCF still remained enriched at the CTCF_PS in PRC2 mutant ESCs (Figure 4B). The continued formation of the partition in the absence of polycomb-mediated regulation would explain why pZdbf2 failed to exhibit increased interactions with E1-3, even though the promoter has adopted an active state.
Given that CTCF is DNA methylation sensitive at a subset of binding sites (Wang et al., 2012), we reasoned that perhaps de novo DNA methylation is required for evicting CTCF from the CTCF_PS during the ESC to EpiLC transition. We tested this by differentiating Dnmt tKO ESCs, which are able to differentiate to a state akin to WT D7 EpiLCs despite a total lack of DNA methylation (Greenberg et al., 2017; Hassan-Zadeh et al., 2017). However, even in the absence of DNA methylation, CTCF depleted at the partition site (Figure 4D, Figure 4—figure supplement 1B). A recent study reported that transcription can disrupt CTCF binding and chromatin architecture (Heinz et al., 2018), yet we observed reduced CTCF enrichment even in the absence of the Liz transcript (Figure 4D, Figure 4—figure supplement 1B). Therefore, the CTCF depletion at the CTCF_PS in EpiLCs is differentiation-dependent, but independent of DNA methylation- or Liz transcription-based regulation.
CTCF partitioning fine-tunes pLiz programming of pZdbf2
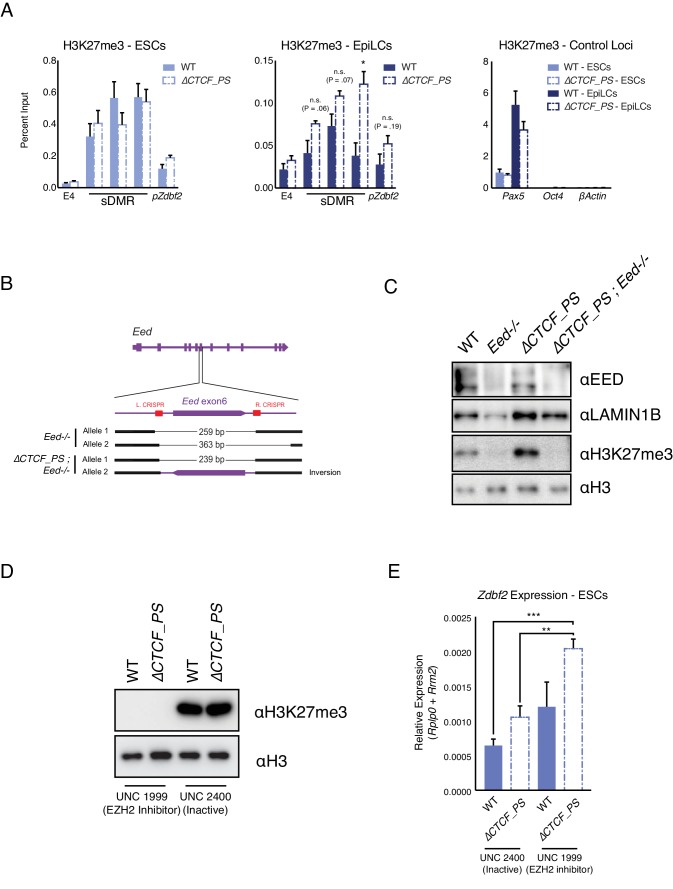
To assess the regulatory impact of CTCF partitioning, we generated a deletion of CTCF_PS (Figure 4—figure supplement 2A). 4C-seq in ∆CTCF_PS cells revealed that pLiz interacts less frequently with E1-3 in ESCs (Figure 4—figure supplement 2B), perhaps as the promoter is less constrained without the CTCF partition. As such, Liz failed to properly express (Figure 4E). In contrast, the deletion did not perturb expression of Gpr1 nor the genes flanking the Zdbf2 locus (Figure 4—figure supplement 2C), suggesting that insulation from neighboring regulatory domains was intact. Consistently, using a CTCF degron line where CTCF is globally depleted (Nora et al., 2017), Liz was also downregulated, although it should be noted that both moderate and complete reduction of CTCF resulted in a comparable reduction of Liz levels (Figure 4—figure supplement 2D,E). During differentiation of the ∆CTCF_PS line, the Liz transcript was still able to attain WT levels, nevertheless Zdbf2 failed to properly activate (Figure 4E). Moreover, while DNA methylation occurred normally at pLiz, the sDMR remained relatively hypomethylated compared to WT (Figure 4F), likely due to the delayed kinetics of Liz upregulation. Furthermore, the relative reduction of DNA methylation at the sDMR in ∆CTCF_PS mutant EpiLCs was correlated with a slight retention of H3K27me3 in comparison with WT, which may contribute to the failure of pZdbf2 to properly activate (Figure 4D, Figure 4—figure supplement 3A).
While pLiz activation was less efficient in ∆CTCF_PS mutant ESCs, pZdbf2 exhibited increased contacts with E2 and E3 (Figure 4—figure supplement 2C). However, Zdbf2 remained repressed, as polycomb enrichment remained unperturbed (Figure 4—figure supplement 3A). It should be noted that upon global depletion of CTCF, Zdbf2 is de-repressed, indicating that independently of the partition site, CTCF does play a role in Zdbf2 regulation in ESCs (Figure 4—figure supplement 2E). Regardless, given that in PRC2 mutant ESCs, Zdbf2 is already partially de-repressed, we reasoned that by generating an Eed mutation in combination with deleting the partition site, we could observe further increase in Zdbf2 expression, as pZdbf2 would be unhindered from interacting with all four enhancers (Figure 4—figure supplement 3B). In parallel, we generated a new Eed mutation, so all cell lines would be in the identical genetic background (Figure 4—figure supplement 3B). We confirmed that the Eed mutant lines failed to exhibit EED protein nor H3K27me3 by western blotting (Figure 4—figure supplement 3C). Indeed, while Zdbf2 was upregulated in absence of Eed alone, the expression was significantly increased in the ∆CTCF-PS; Eed-/- double mutant (Figure 4G). Importantly, these results were confirmed when we subjected WT and ∆CTCF_PS lines to a potent PRC2 inhibitor to induce acute depletion of H3K27me3 (Figure 4—figure supplement 3D,E). Therefore, we concluded that in addition to contributing to proper pLiz activation, the CTCF partition acts as a second level of protection, along with polycomb, to restrain precocious pZdbf2 firing.
Discussion
In this study, we revealed the dynamic chromosome conformation of the Zdbf2 locus that occurs concomitantly with epigenetic programming during differentiation. For proper Zdbf2 activation, it is imperative to properly trigger Liz expression at the time de novo DNA methylation. Here we show that a CTCF-structured loop organization forms at the locus in naïve ESCs. This partition allows for proper regulation of pLiz, which in turn can facilitate a local polycomb-to-DNA methylation switch through Liz transcription. During differentiation, the partitioning is relaxed, as pLiz becomes shut down, thus allowing distal enhancers to bolster pZdbf2 activation. It is conceivable that E1-3 act in a hierarchical manner with respect to E4 and pZdbf2; that is, they are important for activation of the proximal promoter rather than sustaining Zdbf2 expression, although further testing must be performed to formally confirm his possibility. Deleting the CTCF_PS resulted in reduced Liz activation kinetics, but a fairly substantial effect on Zdbf2 expression. This is consistent with our previously published Liz transcriptional interruption, where Liz expression and DNA methylation are only moderately affected, but nonetheless Zdbf2 cannot attain WT levels of activation (Greenberg et al., 2017). Such results underscore the sensitivity of pZdbf2 activity to proper epigenetic programming.
In ∆CTCF_PS ESCs, Zdbf2 transcription did not ectopically occur, even though there were no longer apparent restrictions for pZdbf2 to interact with the active enhancers E1-3. The explanation for this is the polycomb-mediated silencing that persists over pZdbf2 in the absence of CTCF_PS. Thus, there are at least two layers of regulation of Zdbf2 activation that act independently from classical transcription factor control at gene promoters: 1) instructive chromosome conformation allowing for proper pLiz and pZdfb2 activity, and 2) a Liz-dependent epigenetic switch to evict polycomb at pZdbf2. This tiered model, with chromosome conformation acting upstream, emphasizes the exquisite choreography that can occur to program developmentally important genes during the exit from the naïve pluripotent state. Interestingly, global depletion of CTCF leads to upregulation of Zdbf2 in ESCs (Figure 4—figure supplement 2E). Whether this is due to direct CTCF-mediated regulation at other binding sites in the locus, or is simply an indirect effect, remains to be tested.
One outstanding question is what is the cue that releases CTCF from the partition site during differentiation? The obvious candidate was DNA methylation, and while CTCF binding at the site may indeed be DNA methylation-sensitive, we found that CTCF was released during differentiation, whether the methyl mark was present or not. Another likely explanation is that CTCF is bound in combination with pluripotency-associated transcription factors. While CTCF is generally reported to be largely invariant across mammalian cell types (Lee et al., 2012), there are cell type-specific CTCF binding patterns, and roughly 60% occur in a DNA methylation-independent manner (Wang et al., 2012).
Our study presents a rare description of two alternative promoters utilizing a shared set of enhancers, but in a CTCF-guided, developmentally timed manner. In ESCs, CTCF is required to facilitate one promoter’s interactions (pLiz) while restricting the other’s (pZdbf2). Only upon removal of CTCF binding, the opportunity for pZdbf2 is created to contact its enhancers. On the face of it, such a mechanism resembles the imprinted Igf2/H19 locus, where CTCF binding near the H19 gene on the maternal allele restrict interactions between a shared set of enhancers and the more distal Igf2 gene (Murrell et al., 2004). The Igf2/H19 locus behaves differently from the Zdbf2 locus, though, as differential CTCF binding is DNA methylation-dependent and set in the gametes—not dynamically regulated during cellular differentiation. Moreover, Igf2 and H19 are two different genes, not isoforms of the same gene.
CTCF has been previously shown to mediate enhancer switching. For example, at the Hoxd locus in mice, CTCF facilitates the interactions between the same set of gene promoters but different sets of enhancers depending on the context (Andrey et al., 2013). As mentioned, dynamic enhancer switching during the naïve-to-primed differentiation is a common mechanism in mammals to maintain gene expression; however, this phenomenon represents the inverse scenario from Zdbf2 regulation, as during enhancer switching, promoters remain unchanged.
Promoter switching is a widespread and developmentally important phenomenon (Davuluri et al., 2008). Aberrant promoter usage is associated with pathologies, such as cancer (Sarda et al., 2017). CTCF is a likely candidate to organize genic three-dimensional structure and protect from aberrant promoter firing, as it does at Zdbf2. The Zdbf2 locus presents a compelling case, because if pLiz-to-pZdbf2 promoter switch does not occur at the proper developmental time, synchronized with the de novo DNA methylation program, pZdbf2 cannot be activated (Greenberg et al., 2017). Notably, the organization of this locus is conserved between mouse and humans, implying the likelihood of a shared regulatory mechanism (Duffié et al., 2014). Future studies should continue to shed light on the role that CTCF dynamics play in programming developmentally important promoter activity in the crucial window that precedes somatic tissue formation.
Materials and methods
Key resources table.
| Reagent type (species) or resource |
Designation | Source or reference |
Identifier | Additional information |
|---|---|---|---|---|
| Cell Line (M. musculus) |
E14TG2a (WT) | ATCC | CRL-1821 | |
| Cell Line (M. musculus) | E14TG2a_∆Liz | Bourc’his Lab | Greenberg et al., 2017 | |
| Cell Line (M. musculus) | E14TG2a_∆E1 | Bourc’his Lab | Greenberg et al., 2017 | |
| Cell Line (M. musculus) | E14TG2a_∆E1-3 | This study | CRISPR/Cas9 generated mutant, sgRNA oligos are listed in Supplementary file 1 | |
| Cell Line (M. musculus) | E14TG2a_∆E4 | This study | CRISPR/Cas9 generated mutant, sgRNA oligos are listed in Supplementary file 1 | |
| Cell Line (M. musculus) | E14TG2a_CTCF-AID-eGFP, Tir1 | Gift from E Nora | Nora et al., 2017 | |
| Cell Line (M. musculus) | J1 (WT) | ATCC | SCRC-1010 | |
| Cell Line (M. musculus) | J1_Dnmt tKO | Gift from M Okano | Tsumura et al., 2006 | |
| Cell Line (M. musculus) | J1_Eed-/- | This study | CRISPR/Cas9 generated mutant, sgRNA oligos are listed inSupplementary file 1 | |
| Cell Line (M. musculus) | J1_∆CTCF_PS | This study | CRISPR/Cas9 generated mutant, sgRNA oligos are listed in Supplementary file 1 | |
| Cell Line (M. musculus) | J1_Eed-/-; ∆CTCF_PS | This study | CRISPR/Cas9 generated mutant, sgRNA oligos are listed in Supplementary file 1 | |
| Cell Line (M. musculus) | J1 Clone 36 (WT) | Gift from A Wutz | Wutz and Jaenisch, 2000 | |
| Cell Line (M. musculus) | J1 Clone 36_Eed-/- | Gift from A Wutz | Schoeftner et al., 2006 | |
| Antibody | Anti-H3K27me2, mouse monoclonal | Active Motif | 61435 | (1:5000) |
| Antibody | Anti-H3K27me3, rabbit monoclonal | Cell Signaling Technology | C36B11 | (1:5000) |
| Antibody | Anti-H3K27ac, rabbit polyclonal |
Active Motif | 39133 | (1:5000) |
| Antibody | Anti-CTCF, rabbit polyclonal | Millipore | 07–729 | (1:5000) |
| Antibody | Anti-GFP, mix of two mouse monoclonal | Roche | 11814460001 | (1:2000) |
| Antibody | Anti-PCNA, mouse monoclonal | Dako | M0879 | (1:5000) |
| Antibody | Anti-EED, rabbit polyclonal | Other | Gift from R Margueron (1:5000) | |
| Antibody | Anti-Lamin B1, rabbit polyclonal | Abcam | Ab16048 | (1:5000) |
| Antibody | Anti-H3, rabbit polyclonal | Abcam | Ab1791 | (1:10000) |
| Chemical Compound, Drug | L-Absorbic Acid | Sigma | A4544 | |
| Chemical Compound, Drug |
Gsk3 inhibitor | Other | CT-99021 | Gift from E Heard |
| Chemical Compound, Drug | MEK inhibitor | Other | PD0325901 | Gift from E Heard |
| Chemical Compound, Drug | FGF2 | R and D Systems | 233-FB-025/CF | |
| Chemical Compound, Drug | Activin A | R and D Systems | 338-AC-050/CF | |
| Chemical Compound, Drug | EZH2 Inhibitor | Tocris Bioscience | UNC 1999 | |
| Chemical Compound, Drug | EZH2 Inhibitor Negative Control | Tocris Bioscience | UNC 2400 | |
| Chemical Compound, Drug | Indole-3-acetic acid sodium salt (auxin analog) | Sigma | I5148-2G | |
| Recombinant DNA Reagent | pX459 | Addgene | 62988 | |
| Commercial Assay or Kit | EpiTect Bisulfite Kit | Qiagen | 59104 | |
| Software, Algorithm | BWA v0.7.5a | Li and Durbin, 2009 | ||
| Software, Algorithm | Picard v1.130 | Broad Institute | ||
| Software, Algorithm | HOMER v4.7 | Heinz et al., 2010 | ||
| Software, Algorithm | FASTX-Toolkit v0.0.13 | Greg Hannon Lab | ||
| Software, Algorithm | Cutadapt | Martin, 2011 | ||
| Software, Algorithm | Bismark v0.12.5 | Krueger and Andrews, 2011 | ||
| Software, Algorithm | Bowtie2 v2.1.0 | Langmead and Salzberg, 2012 | ||
| Software, Algorithm | STAR v2.5.0a | Dobin et al., 2013 | ||
| Software, Algorithm | Trim Galore v0.4.0 | Babraham Institute | ||
| Software, Algorithm | FourCSeq v1.12.0 | Klein et al., 2015 | ||
| Software, Algorithm | HTSeq v0.9.1 | Anders et al., 2015 |
ESC lines
All cell lines are listed in the Key Resource Table. For all experiments, the parental WT line was used as a control for mutant lines generated in that background (E14 or J1). 4C-Seq was performed using clone 36 Eed-/- cells (J1 background). Therefore, when generating an in-house Eed-/- line, we used the same genetic background for consistency.
Cell culture and differentiation
Feeder-free ESCs were grown on gelatin-coated flasks. Serum culture conditions were as follows: Glasgow medium (Sigma) supplemented with 2 mM L-Glutamine (Gibco), 0.1 mM MEM non-essential amino acids (Gibco), 1 mM sodium pyruvate (Gibco), 15% FBS, 0.1 mM β-mercaptoethanol and 1000 U/ml leukemia inhibitory factor (LIF, Chemicon). Cells were passaged with trypsin replacement enzyme (Gibco) every two days. 2i culture conditions were as follows: N2B27 medium (50% neurobasal medium (Gibco), 50% DMEM/F12 (Gibco), 2 mM L-glutamine (Gibco), 0.1 mM β- mercaptoethanol, NDiff Neuro2 supplement (Millipore), B27 serum-free supplement (Gibco)) supplemented with 1000 U/ml LIF and 2i (3 μM Gsk3 inhibitor CT-99021, 1 μM MEK inhibitor PD0325901). Cells were passaged every 2–4 days with Accutase (Gibco). Vitamin C (Sigma) was added at a final concentration of 100 µg/ml. For EZH2 inhibition experiments, the EZH2 incubator UNC 1999 (or its negative control UNC 2400, Tocris Bioscience) was added to media at a 1 µM final concentration for four days. To induce degradation of CTCF in the E14TG2a_CTCF-AID-eGFP, Tir1 cell line (with Tir1 targeted to the Tigre locus), the auxin analog indole-3-acetic acid (IAA) was added to the media at a final concentration of 500 µM from a 1000x stock, and incubated with the cells for two days.
To induce EpiLC differentiation, cells were gently washed with PBS, dissociated, and replated at a density of 2 × 10⁵ cells/cm2 on Fibronectin (10 µg/ml)-coated plates in N2B27 medium supplemented with 12 ng/ml Fgf2 (R and D) and 20 ng/ml Activin A (R and D). EpiLCs were passaged with Accutase at D4 of differentiation.
Cells were regularly tested for presence of mycoplasma by sending used media to GATC/Eurofins for analysis.
Generation of edited ESCs
All deletions in this study were generated with two CRISPR single guide RNAs (sgRNAs) specific to the target sequences followed by Cas9 nuclease activity and screening for non-homologous end joining. sgRNAs were designed using the online CRISPOR online program (crispor.tefor.net) and cloned into the pX459 plasmid harboring the Cas9 gene. All sgRNA sequences are listed in Supplementary file 1. Around five million WT serum-grown ESCs were transfected with 1–3 μg of plasmid(s) using Amaxa 4d Nucleofector (Lonza) and plated at a low density. Ninety-six individual clones were picked and screened by PCR. Mutated alleles were confirmed by Sanger sequencing of cloned PCR amplicons. In the case of the Eed mutation, loss-of-function was further confirmed by immunoblotting.
DNA methylation analyses
Genomic DNA from cells was isolated using the GenElute Mammalian Genomic DNA Miniprep Kit (Sigma), with RNase treatment. Bisulfite conversion was performed on 500–1000 ng of DNA using the EpiTect Bisulfite Kit (Qiagen). Bisulfite-treated DNA was PCR amplified and analyzed by pyrosequencing. Pyrosequencing was performed on the PyroMark Q24 (Qiagen) according to the manufacturer’s instructions, and results were analyzed with the associated software. All bisulfite primers are listed in Supplementary file 1. Statistical analyses were performed by a two-tailed unpaired t-test using GraphPad Prism6 software.
WGBS data from ESCs were previously generated (Walter et al., 2016) and EpiLCs were prepared from 50 ng of bisulfite-converted genomic DNA using the EpiGnome/Truseq DNA Methylation Kit (Illumina) following the manufacturer instructions. Sequencing was performed in 100pb paired-end reads at a 30X coverage using the Illumina HiSeq2000 platform.
ATAC-seq
ATAC-Seq was performed as described in Buenrostro et al. (2015) with minor modifications. Briefly, 50,000 cells were washed, but not lysed. Cells were transposed using the Nextera DNA library prep kit (Illumina) for 30 min at 37°. DNA was immediately purified using Qiagen MinElute Kit (Qiagen). qPCR was used to determine the optimal cycle number for library amplification. The libraries were sequenced on the Illumina HiSeq2500 platform to obtain 2 × 100 paired-end reads.
Chromatin immunoprecipitation (ChIP)
ChIP was performed exactly as described in Walter et al. (2016). Briefly, cells were cross-linked directly in 15 cm culture plates with 1% formaldehyde. After quenching with 0.125 M glycine, cells were washed in PBS and pelleted. After a three-step lysis, chromatin was sonicated with a Bioruptor (Diagenode) to reach a fragment size averaging 200 bp. Chromatin corresponding to 10 μg of DNA was incubated rotating overnight at 4°C with 3–5 μg of antibody. A fraction of chromatin extracts (5%) were taken aside for inputs. Antibody-bound chromatin was recovered using Protein G Agarose Columns (Active Motif). The antibody-chromatin mix was incubated on column for 4 hr, washed eight times with modified RIPA buffer and chromatin eluted with pre-warmed TE-SDS (50 mM Tris pH 8.0, 10 mM EDTA, 1% SDS). ChIP-enriched and input samples were reverse cross-linked (65°C overnight) and treated with RNase A and proteinase K. DNA was extracted with phenol/chloroform/isoamyl alcohol, precipitated with glycogen in sodium acetate and ethanol and resuspended in tris-buffered water. Enrichment compared to input was analyzed by qPCR (Viia7 thermal cycling system, Applied Biosystems). Primers are listed in Supplementary file 1.
4C-seq
The design of VPs and preparation of 4C-seq libraries was performed as described by Matelot and Noordermeer (2016), with only minor modifications. DpnII or its isoschiszomer MboII (New England Biolabs) were chosen as the primary restriction enzyme, and NlaIII (New England Biolabs) as the secondary restriction enzyme. ESC and EpiLC material were harvested from 150 cm2 culture flasks (TPP Techno Plastic Products AG), which provided ample material for up to four technical replicates presuming cells were healthy and near confluency. To avoid technical artifacts, crosslinking and library preparation were performed in parallel for each experiment. For each VP, approximately 1 µg of library material was amplified using 16 individual PCR reactions with inverse primers containing indexed Illumina TruSeq adapters (primer sequences are listed in Supplementary file 1). PCR products were originally purified using the MinElute PCR purification kit (Qiagen) to remove unincorporated primer, but we found that purification was more efficiently performed using Agencourt AMPure XP beads (Beckman Coulter). Sequencing was performed on the Illumina NextSeq 500 system, using 75 bp single-end reads with up to 14 VPs multiplexed per run.
RNA expression
Total RNA was extracted using Trizol (Life Technologies), then DNase-treated and column purified (Qiagen RNeasy Kit). To generate cDNA, RNA was reverse transcribed with SuperscriptIII (Life Technologies) primed with random hexamers. RT-qPCR was performed using the SYBR Green Master Mix on the Viia7 thermal cycling system (Applied Biosystems). Relative expression levels were normalized to the geometric mean of the Ct for housekeeping genes Rrm2 and Rplp0 with the ΔΔCt method. Primers are listed in Supplementary file 1. Statistical analyses were performed by a two-tailed unpaired t-test using GraphPad Prism6 software.
RNA-seq libraries were prepared from 500 ng of DNase-treated RNA with the TruSeq Stranded mRNA kit (Illumina). Sequencing was performed in 100pb paired-end reads using the Illumina HiSeq2500 platform.
Immunoblotting
Western blots were visualized using the ChemiDoc MP (Biorad). The antibodies are listed in the Key Resource Table.
Quantification and statistical analysis
ATAC-seq analysis
2 × 100 bp paired-end reads were aligned onto the Mouse reference genome (mm10) using Bwa mem v0.7.5a (Li and Durbin, 2009) with default parameters. Duplicate reads were removed using Picard v1.130 (http://broadinstitute.github.io/picard/). Tracks were created using HOMER software v4.7 (Heinz et al., 2010).
WGBS analysis
Whole-genome bisulfite sequencing data were analyzed as described in Walter et al. (2016). Briefly, the first eight base pairs of the reads were trimmed using FASTX-Toolkit v0.0.13:
(http://hannonlab.cshl.edu/fastx_toolkit/index.html). Adapter sequences were removed with Cutadapt v1.3 (Martin, 2011) and reads shorter than 16 bp were discarded. Cleaned sequences were aligned onto the mouse reference genome (mm10) using Bismark v0.12.5 (Krueger and Andrews, 2011) with Bowtie2-2.1.0 (Langmead and Salzberg, 2012) and default parameters. Only reads mapping uniquely on the genome were conserved. Methylation calls were extracted after duplicate removal. Only CG dinucleotides covered by a minimum of 5 reads were conserved.
RNA-seq analysis
2 × 100 bp paired-end reads were mapped onto the mouse reference genome (mm10) using STAR v2.5.0a (Dobin et al., 2013) reporting unique alignments and allowing at most six mismatches per fragment. Tracks were created using HOMER software v4.7 (Heinz et al., 2010). Gene-scaled quantification was performed with HTSeq v0.9.1 (Anders et al., 2015).
4C-seq analysis
Adapters were first trimmed using Trim Galore: v0.4.0, https://www.bioinformatics.babraham.ac.uk/projects/trim_galore/.
Samples were demultiplexed using the script provided with the FourCSeq R package (v1.12.0) (Klein et al., 2015). Inverse primer sequences were removed on the 3' end of the reads using Cutadapt v1.12 (Martin, 2011). Reads shorter than 15 bp were discarded. Cleaned sequences were aligned onto the mouse reference genome (mm10) using Bowtie2 v2.1.0 (Langmead and Salzberg, 2012) allowing one mismatch in the seed (22 bp) and an end-to-end alignment. Subsequent steps were performed using the FourCSeq R package (v1.12.0). The mouse reference genome was in-silico digested using the two restriction enzymes. Restriction fragments that did not contain a cutting site of the second restriction enzyme or are smaller than 20 bp were filtered out. Fragments 2.5 kb up- and downstream from the viewpoint were excluded during the procedure. Intrachromosomal contacts were kept. Valid fragments were quantified. The fragment counts were then normalized per one million reads. Data were smoothed using a running mean function with five informative fragments.
Data resources
Raw and processed sequencing data reported in this paper have been submitted to GEO, accession number GSE121405.
Acknowledgments
We would like to thank members of the Bourc’his laboratory and N Servant for insightful experimental and conceptual input, E Nora and B Bruneau for sharing the CTCF Degron ESC line, R Oakey and D Holoch for reviewing the manuscript and making helpful comments and V Piras for sharing reanalyzed Hi-C matrices. We acknowledge the high-throughput sequencing facility of I2BC for its sequencing and bioinformatics expertise and for its contribution to this study for the 4C-seq (https://www.i2bc.paris-saclay.fr/spip.php?article399). Other NGS approaches were carried out by the ICGex NGS platform of the Institut Curie, supported by grants from the ANR-10-EQPX-03 (Equipex) and ANR-10-INBS-09–08 (France Génomique Consortium) from the Agence Nationale de la Recherche (‘Investissements d’Avenir’ program), the Canceropole Ile-de-France and the SiRIC-Curie program- Grant "INCa-DGOS- 4654. The laboratory of DB is part of the Laboratoire d’Excellence (LABEX) entitled DEEP (11-LBX0044). This research was supported by the ERC (grant ERC-Cog EpiRepro). MVCG was supported by ARC and EMBO (LTF 457–2013) postdoctoral fellowships.
Funding Statement
The funders had no role in study design, data collection and interpretation, or the decision to submit the work for publication.
Contributor Information
Maxim Greenberg, Email: maxim.greenberg@curie.fr.
Deborah Bourc'his, Email: Deborah.Bourchis@curie.fr.
Michael Buszczak, University of Texas Southwestern Medical Center, United States.
Kevin Struhl, Harvard Medical School, United States.
Funding Information
This paper was supported by the following grants:
H2020 European Research Council Cog EpiRepro to Deborah Bourc'his.
European Molecular Biology Organization LTF 457-2013 to Maxim Greenberg.
Fondation ARC pour la Recherche sur le Cancer Post-doc Fellowship to Maxim Greenberg.
Additional information
Competing interests
Reviewing editor, eLife.
No competing interests declared.
Author contributions
Conceptualization, Methodology, Investigation, Writing—original draft, Writing—review and editing.
Formal analysis.
Investigation.
Methodology, Investigation, Writing—review and editing.
Conceptualization, Supervision, Funding acquisition, Methodology, Writing—review and editing.
Additional files
Data availability
Sequencing data have been deposited in GEO under accession code GSE121405.
The following dataset was generated:
Greenberg MVC, Teissandier A, Walter M, Noordermeer D, Bourc'his D. 2019. Sequencing data from Dynamic enhancer partitioning instructs activation of a growth-related gene during exit from naïve pluripotency. NCBI Gene Expression Omnibus. GSE121405
The following previously published datasets were used:
Greenberg MV, Glaser J, Borsos M, Marjou FE. 2017. Liz transcription is required for evicting H3K27me3 marks at the Gpr1/Zdbf2 locus through the deposition of DNA methylation marks. NCBI Gene Expression Omnibus. GSE79549
Walter M, Teissandier A, Pérez-Palacios R, Bourc'his D. 2016. An epigenetic switch ensures transposon repression upon acute loss of DNA methylation in ES cells. NCBI Gene Expression Omnibus. GSE71593
Wu J, Huang B, Chen H, Yin Q. 2016. The landscape of accessible chromatin in mammalian pre-implantation embryos. NCBI Gene Expression Omnibus. GSE66390
Liu X, Wang C, Liu W. 2016. Distinct features in establishing H3K4me3 and H3K27me3 in pre-implantation embryos. NCBI Gene Expression Omnibus. GSE73952
Buecker C, Srinivasan R, Wu Z. 2014. Reorganization of enhancer patterns in transition from naïve to primed pluripotency. NCBI Gene Expression Omnibus. GSE56138
Bao S, Tang WW, Wu B. 2017. Enhancing the Potency of Mouse Embryonic Stem Cells. NCBI Gene Expression Omnibus. GSE99494
References
- Anders S, Pyl PT, Huber W. HTSeq--a Python framework to work with high-throughput sequencing data. Bioinformatics. 2015;31:166–169. doi: 10.1093/bioinformatics/btu638. [DOI] [PMC free article] [PubMed] [Google Scholar]
- Andrey G, Montavon T, Mascrez B, Gonzalez F, Noordermeer D, Leleu M, Trono D, Spitz F, Duboule D. A switch between topological domains underlies HoxD genes collinearity in mouse limbs. Science. 2013;340:1234167. doi: 10.1126/science.1234167. [DOI] [PubMed] [Google Scholar]
- Bao S, Tang WW, Wu B, Kim S, Li J, Li L, Kobayashi T, Lee C, Chen Y, Wei M, Li S, Dietmann S, Tang F, Li X, Surani MA. Derivation of hypermethylated pluripotent embryonic stem cells with high potency. Cell Research. 2018;28:22–34. doi: 10.1038/cr.2017.134. [DOI] [PMC free article] [PubMed] [Google Scholar]
- Bonev B, Mendelson Cohen N, Szabo Q, Fritsch L, Papadopoulos GL, Lubling Y, Xu X, Lv X, Hugnot JP, Tanay A, Cavalli G. Multiscale 3D genome rewiring during mouse neural development. Cell. 2017;171:557–572. doi: 10.1016/j.cell.2017.09.043. [DOI] [PMC free article] [PubMed] [Google Scholar]
- Buecker C, Srinivasan R, Wu Z, Calo E, Acampora D, Faial T, Simeone A, Tan M, Swigut T, Wysocka J. Reorganization of enhancer patterns in transition from naive to primed pluripotency. Cell Stem Cell. 2014;14:838–853. doi: 10.1016/j.stem.2014.04.003. [DOI] [PMC free article] [PubMed] [Google Scholar]
- Buenrostro JD, Giresi PG, Zaba LC, Chang HY, Greenleaf WJ. Transposition of native chromatin for fast and sensitive epigenomic profiling of open chromatin, DNA-binding proteins and nucleosome position. Nature Methods. 2013;10:1213–1218. doi: 10.1038/nmeth.2688. [DOI] [PMC free article] [PubMed] [Google Scholar]
- Buenrostro JD, Wu B, Chang HY, Greenleaf WJ. ATAC-seq: a method for assaying chromatin accessibility Genome-Wide. Current Protocols in Molecular Biology. 2015;109 doi: 10.1002/0471142727.mb2129s109. [DOI] [PMC free article] [PubMed] [Google Scholar]
- Chen AF, Liu AJ, Krishnakumar R, Freimer JW, DeVeale B, Blelloch R. GRHL2-Dependent enhancer switching maintains a pluripotent stem cell transcriptional subnetwork after exit from naive pluripotency. Cell Stem Cell. 2018;23:226–238. doi: 10.1016/j.stem.2018.06.005. [DOI] [PMC free article] [PubMed] [Google Scholar]
- Creyghton MP, Cheng AW, Welstead GG, Kooistra T, Carey BW, Steine EJ, Hanna J, Lodato MA, Frampton GM, Sharp PA, Boyer LA, Young RA, Jaenisch R. Histone H3K27ac separates active from poised enhancers and predicts developmental state. PNAS. 2010;107:21931–21936. doi: 10.1073/pnas.1016071107. [DOI] [PMC free article] [PubMed] [Google Scholar]
- Davuluri RV, Suzuki Y, Sugano S, Plass C, Huang TH. The functional consequences of alternative promoter use in mammalian genomes. Trends in Genetics. 2008;24:167–177. doi: 10.1016/j.tig.2008.01.008. [DOI] [PubMed] [Google Scholar]
- Dixon JR, Selvaraj S, Yue F, Kim A, Li Y, Shen Y, Hu M, Liu JS, Ren B. Topological domains in mammalian genomes identified by analysis of chromatin interactions. Nature. 2012;485:376–380. doi: 10.1038/nature11082. [DOI] [PMC free article] [PubMed] [Google Scholar]
- Dobin A, Davis CA, Schlesinger F, Drenkow J, Zaleski C, Jha S, Batut P, Chaisson M, Gingeras TR. STAR: ultrafast universal RNA-seq aligner. Bioinformatics. 2013;29:15–21. doi: 10.1093/bioinformatics/bts635. [DOI] [PMC free article] [PubMed] [Google Scholar]
- Duffié R, Ajjan S, Greenberg MV, Zamudio N, Escamilla del Arenal M, Iranzo J, Okamoto I, Barbaux S, Fauque P, Bourc'his D. The Gpr1/Zdbf2 locus provides new paradigms for transient and dynamic genomic imprinting in mammals. Genes & Development. 2014;28:463–478. doi: 10.1101/gad.232058.113. [DOI] [PMC free article] [PubMed] [Google Scholar]
- Ferrari KJ, Scelfo A, Jammula S, Cuomo A, Barozzi I, Stützer A, Fischle W, Bonaldi T, Pasini D. Polycomb-dependent H3K27me1 and H3K27me2 regulate active transcription and enhancer fidelity. Molecular Cell. 2014;53:49–62. doi: 10.1016/j.molcel.2013.10.030. [DOI] [PubMed] [Google Scholar]
- Greenberg MV, Glaser J, Borsos M, Marjou FE, Walter M, Teissandier A, Bourc'his D. Transient transcription in the early embryo sets an epigenetic state that programs postnatal growth. Nature Genetics. 2017;49:110–118. doi: 10.1038/ng.3718. [DOI] [PubMed] [Google Scholar]
- Gu B, Swigut T, Spencley A, Bauer MR, Chung M, Meyer T, Wysocka J. Transcription-coupled changes in nuclear mobility of mammalian cis-regulatory elements. Science. 2018;359:1050–1055. doi: 10.1126/science.aao3136. [DOI] [PMC free article] [PubMed] [Google Scholar]
- Hassan-Zadeh V, Rugg-Gunn P, Bazett-Jones DP. DNA methylation is dispensable for changes in global chromatin architecture but required for chromocentre formation in early stem cell differentiation. Chromosoma. 2017;126:605–614. doi: 10.1007/s00412-017-0625-x. [DOI] [PubMed] [Google Scholar]
- Heinz S, Benner C, Spann N, Bertolino E, Lin YC, Laslo P, Cheng JX, Murre C, Singh H, Glass CK. Simple combinations of lineage-determining transcription factors prime cis-regulatory elements required for macrophage and B cell identities. Molecular Cell. 2010;38:576–589. doi: 10.1016/j.molcel.2010.05.004. [DOI] [PMC free article] [PubMed] [Google Scholar]
- Heinz S, Texari L, Hayes MGB, Urbanowski M, Chang MW, Givarkes N, Rialdi A, White KM, Albrecht RA, Pache L, Marazzi I, García-Sastre A, Shaw ML, Benner C. Transcription elongation can affect genome 3D structure. Cell. 2018;174:1522–1536. doi: 10.1016/j.cell.2018.07.047. [DOI] [PMC free article] [PubMed] [Google Scholar]
- Kalkan T, Smith A. Mapping the route from naive pluripotency to lineage specification. Philosophical Transactions of the Royal Society B: Biological Sciences. 2014;369:20130540. doi: 10.1098/rstb.2013.0540. [DOI] [PMC free article] [PubMed] [Google Scholar]
- Klein FA, Pakozdi T, Anders S, Ghavi-Helm Y, Furlong EE, Huber W. FourCSeq: analysis of 4C sequencing data. Bioinformatics. 2015;31:3085–3091. doi: 10.1093/bioinformatics/btv335. [DOI] [PMC free article] [PubMed] [Google Scholar]
- Krueger F, Andrews SR. Bismark: a flexible aligner and methylation caller for Bisulfite-Seq applications. Bioinformatics. 2011;27:1571–1572. doi: 10.1093/bioinformatics/btr167. [DOI] [PMC free article] [PubMed] [Google Scholar]
- Kundu S, Ji F, Sunwoo H, Jain G, Lee JT, Sadreyev RI, Dekker J, Kingston RE. Polycomb repressive complex 1 generates discrete compacted domains that change during differentiation. Molecular Cell. 2017;65:432–446. doi: 10.1016/j.molcel.2017.01.009. [DOI] [PMC free article] [PubMed] [Google Scholar]
- Langmead B, Salzberg SL. Fast gapped-read alignment with bowtie 2. Nature Methods. 2012;9:357–359. doi: 10.1038/nmeth.1923. [DOI] [PMC free article] [PubMed] [Google Scholar]
- Lee BK, Bhinge AA, Battenhouse A, McDaniell RM, Liu Z, Song L, Ni Y, Birney E, Lieb JD, Furey TS, Crawford GE, Iyer VR. Cell-type specific and combinatorial usage of diverse transcription factors revealed by genome-wide binding studies in multiple human cells. Genome Research. 2012;22:9–24. doi: 10.1101/gr.127597.111. [DOI] [PMC free article] [PubMed] [Google Scholar]
- Lee HJ, Hore TA, Reik W. Reprogramming the methylome: erasing memory and creating diversity. Cell Stem Cell. 2014;14:710–719. doi: 10.1016/j.stem.2014.05.008. [DOI] [PMC free article] [PubMed] [Google Scholar]
- Li H, Durbin R. Fast and accurate short read alignment with Burrows-Wheeler transform. Bioinformatics. 2009;25:1754–1760. doi: 10.1093/bioinformatics/btp324. [DOI] [PMC free article] [PubMed] [Google Scholar]
- Liu X, Wang C, Liu W, Li J, Li C, Kou X, Chen J, Zhao Y, Gao H, Wang H, Zhang Y, Gao Y, Gao S. Distinct features of H3K4me3 and H3K27me3 chromatin domains in pre-implantation embryos. Nature. 2016;537:558–562. doi: 10.1038/nature19362. [DOI] [PubMed] [Google Scholar]
- Martin M. Cutadapt removes adapter sequences from high-throughput sequencing reads. EMBnet.journal. 2011;17:10. doi: 10.14806/ej.17.1.200. [DOI] [Google Scholar]
- Mas G, Blanco E, Ballaré C, Sansó M, Spill YG, Hu D, Aoi Y, Le Dily F, Shilatifard A, Marti-Renom MA, Di Croce L. Promoter bivalency favors an open chromatin architecture in embryonic stem cells. Nature Genetics. 2018;50:1452–1462. doi: 10.1038/s41588-018-0218-5. [DOI] [PubMed] [Google Scholar]
- Matelot M, Noordermeer D. Determination of high-resolution 3D chromatin organization using circular chromosome conformation capture (4C-seq) In: Lanzuolo C, Bodega B, editors. Methods in Molecular Biology. New York: Springer; 2016. pp. 223–241. [DOI] [PubMed] [Google Scholar]
- Murrell A, Heeson S, Reik W. Interaction between differentially methylated regions partitions the imprinted genes Igf2 and H19 into parent-specific chromatin loops. Nature Genetics. 2004;36:889–893. doi: 10.1038/ng1402. [DOI] [PubMed] [Google Scholar]
- Nichols J, Smith A. Naive and primed pluripotent states. Cell Stem Cell. 2009;4:487–492. doi: 10.1016/j.stem.2009.05.015. [DOI] [PubMed] [Google Scholar]
- Noordermeer D, Leleu M, Splinter E, Rougemont J, De Laat W, Duboule D. The dynamic architecture of hox gene clusters. Science. 2011;334:222–225. doi: 10.1126/science.1207194. [DOI] [PubMed] [Google Scholar]
- Nora EP, Lajoie BR, Schulz EG, Giorgetti L, Okamoto I, Servant N, Piolot T, van Berkum NL, Meisig J, Sedat J, Gribnau J, Barillot E, Blüthgen N, Dekker J, Heard E. Spatial partitioning of the regulatory landscape of the X-inactivation centre. Nature. 2012;485:381–385. doi: 10.1038/nature11049. [DOI] [PMC free article] [PubMed] [Google Scholar]
- Nora EP, Goloborodko A, Valton AL, Gibcus JH, Uebersohn A, Abdennur N, Dekker J, Mirny LA, Bruneau BG. Targeted degradation of CTCF decouples local insulation of chromosome domains from genomic compartmentalization. Cell. 2017;169:930–944. doi: 10.1016/j.cell.2017.05.004. [DOI] [PMC free article] [PubMed] [Google Scholar]
- Ong CT, Corces VG. CTCF: an architectural protein bridging genome topology and function. Nature Reviews Genetics. 2014;15:234–246. doi: 10.1038/nrg3663. [DOI] [PMC free article] [PubMed] [Google Scholar]
- Papanayotou C, Benhaddou A, Camus A, Perea-Gomez A, Jouneau A, Mezger V, Langa F, Ott S, Sabéran-Djoneidi D, Collignon J. A novel nodal enhancer dependent on pluripotency factors and smad2/3 signaling conditions a regulatory switch during epiblast maturation. PLOS Biology. 2014;12:e1001890. doi: 10.1371/journal.pbio.1001890. [DOI] [PMC free article] [PubMed] [Google Scholar]
- Rada-Iglesias A, Bajpai R, Swigut T, Brugmann SA, Flynn RA, Wysocka J. A unique chromatin signature uncovers early developmental enhancers in humans. Nature. 2011;470:279–283. doi: 10.1038/nature09692. [DOI] [PMC free article] [PubMed] [Google Scholar]
- Sarda S, Das A, Vinson C, Hannenhalli S. Distal CpG islands can serve as alternative promoters to transcribe genes with silenced proximal promoters. Genome Research. 2017;27:553–566. doi: 10.1101/gr.212050.116. [DOI] [PMC free article] [PubMed] [Google Scholar]
- Schoeftner S, Sengupta AK, Kubicek S, Mechtler K, Spahn L, Koseki H, Jenuwein T, Wutz A. Recruitment of PRC1 function at the initiation of X inactivation independent of PRC2 and silencing. The EMBO Journal. 2006;25:3110–3122. doi: 10.1038/sj.emboj.7601187. [DOI] [PMC free article] [PubMed] [Google Scholar]
- Seisenberger S, Andrews S, Krueger F, Arand J, Walter J, Santos F, Popp C, Thienpont B, Dean W, Reik W. The dynamics of genome-wide DNA methylation reprogramming in mouse primordial germ cells. Molecular Cell. 2012;48:849–862. doi: 10.1016/j.molcel.2012.11.001. [DOI] [PMC free article] [PubMed] [Google Scholar]
- Stadler MB, Murr R, Burger L, Ivanek R, Lienert F, Schöler A, van Nimwegen E, Wirbelauer C, Oakeley EJ, Gaidatzis D, Tiwari VK, Schübeler D. DNA-binding factors shape the mouse methylome at distal regulatory regions. Nature. 2011;480:490–495. doi: 10.1038/nature10716. [DOI] [PubMed] [Google Scholar]
- Tesar PJ, Chenoweth JG, Brook FA, Davies TJ, Evans EP, Mack DL, Gardner RL, McKay RD. New cell lines from mouse epiblast share defining features with human embryonic stem cells. Nature. 2007;448:196–199. doi: 10.1038/nature05972. [DOI] [PubMed] [Google Scholar]
- Tsumura A, Hayakawa T, Kumaki Y, Takebayashi S, Sakaue M, Matsuoka C, Shimotohno K, Ishikawa F, Li E, Ueda HR, Nakayama J, Okano M. Maintenance of self-renewal ability of mouse embryonic stem cells in the absence of DNA methyltransferases Dnmt1, Dnmt3a and Dnmt3b. Genes to Cells. 2006;11:805–814. doi: 10.1111/j.1365-2443.2006.00984.x. [DOI] [PubMed] [Google Scholar]
- van de Werken HJ, Landan G, Holwerda SJ, Hoichman M, Klous P, Chachik R, Splinter E, Valdes-Quezada C, Oz Y, Bouwman BA, Verstegen MJ, de Wit E, Tanay A, de Laat W. Robust 4C-seq data analysis to screen for regulatory DNA interactions. Nature Methods. 2012;9:969–972. doi: 10.1038/nmeth.2173. [DOI] [PubMed] [Google Scholar]
- Walter M, Teissandier A, Pérez-Palacios R, Bourc'his D. An epigenetic switch ensures transposon repression upon dynamic loss of DNA methylation in embryonic stem cells. eLife. 2016;5:e11418. doi: 10.7554/eLife.11418. [DOI] [PMC free article] [PubMed] [Google Scholar]
- Wang H, Maurano MT, Qu H, Varley KE, Gertz J, Pauli F, Lee K, Canfield T, Weaver M, Sandstrom R, Thurman RE, Kaul R, Myers RM, Stamatoyannopoulos JA. Widespread plasticity in CTCF occupancy linked to DNA methylation. Genome Research. 2012;22:1680–1688. doi: 10.1101/gr.136101.111. [DOI] [PMC free article] [PubMed] [Google Scholar]
- Wu J, Huang B, Chen H, Yin Q, Liu Y, Xiang Y, Zhang B, Liu B, Wang Q, Xia W, Li W, Li Y, Ma J, Peng X, Zheng H, Ming J, Zhang W, Zhang J, Tian G, Xu F, Chang Z, Na J, Yang X, Xie W. The landscape of accessible chromatin in mammalian preimplantation embryos. Nature. 2016;534:652–657. doi: 10.1038/nature18606. [DOI] [PubMed] [Google Scholar]
- Wutz A, Jaenisch R. A shift from reversible to irreversible X inactivation is triggered during ES cell differentiation. Molecular Cell. 2000;5:695–705. doi: 10.1016/S1097-2765(00)80248-8. [DOI] [PubMed] [Google Scholar]
- Xu Q, Xie W. Epigenome in early mammalian development: inheritance, reprogramming and establishment. Trends in Cell Biology. 2018;28:237–253. doi: 10.1016/j.tcb.2017.10.008. [DOI] [PubMed] [Google Scholar]
- Yeom YI, Fuhrmann G, Ovitt CE, Brehm A, Ohbo K, Gross M, Hübner K, Schöler HR. Germline regulatory element of Oct-4 specific for the totipotent cycle of embryonal cells. Development. 1996;122:881–894. doi: 10.1242/dev.122.3.881. [DOI] [PubMed] [Google Scholar]


