Abstract
The study objectives were to determine the effect of oral hydration therapy and bovine respiratory disease (BRD) on rumination behavior, rumen pH, and rumen temperature. A random subset of high-risk, auction-sourced bulls from 3 truckload blocks (initial BW = 188.9 ± 19.1 kg) were fitted with a collar containing a 3-axis accelerometer to quantify rumination time and activity (n = 58) and administered a rumen pH and temperature data logging bolus (n = 33). At arrival, subset calves (n = 2 per pen) were balanced across treatment pens (n = 15 per treatment; n = 10 animals per pen) and randomized to receive 0.57 L water/45.4 kg BW from a modified oral drenching apparatus (H2O) or no water administration (CON). Standard arrival processing procedures were implemented including surgical castration. Modified-live virus respiratory vaccination was delayed until day 28. Technicians assigned a clinical illness score (CIS) daily; calves with CIS ≥ 2 and rectal temperature ≥ 40 °C were considered a BRD case (RCASE) and treated with an antimicrobial. The fixed effect of BRD cases vs. nontreated cohorts (RCON) was determined retrospectively using data from the accelerometer collar (n = 19 and 29) and rumen bolus (n = 12 and 21, for RCASE and RCON, respectively). Daily means and hourly means across days throughout the 56-d observation period were generated. Fixed effects were analyzed using the mixed model procedure with repeated measures. Daily rumen temperature was altered (P = 0.04) such that peak rumen temperature occurred earlier for H2O, whereas CON had increased (P ≤ 0.01) rumen temperature following delayed vaccination on day 28. Calves diagnosed with BRD had a transiently decreased (P = 0.04) active minutes between days 9 and 32, decreased (P < 0.01) active minutes between 0800 and 2000 h, decreased (P < 0.01) rumination time between 2000 and 0400 h, greater (P < 0.01) rumen temperature until delayed vaccination on day 28, and greater (P < 0.01) hourly rumen temperature between 0900 and 0300, and altered (P < 0.01) rumen pH. Earlier peak rumen temperature observed in H2O may indicate physiological modification enabling a more pronounced inflammatory response. Differences in rumination behavior and activity may be useful for early BRD detection.
Keywords: bovine respiratory disease, cattle, hydration, rumen pH, rumination
Introduction
The cattle marketing process induces stress that may suppress the immune system and predispose cattle to bovine respiratory disease (BRD; Taylor et al., 2010). High-risk calves are often abruptly weaned from their dam and transported to an auction market. There, an order buyer may purchase individually marketed calves and relocate them to another facility for sorting into more uniform groups before finally transporting them to a stocker or feedlot facility. These events expose young calves to novel environments, commingling, and feed and water restriction that may result in a negative energy balance and dehydration.
Step et al. (2008) reported greater feed intake by single-source calves that were weaned 45 d before transport to the feedlot compared with those derived from auction markets, and greater BRD morbidity rates were reported in the auction market-sourced calves. Feeding and drinking frequency of newly received heifers were decreased in those treated for BRD (Buhman et al., 2000). Furthermore, restricted feed access associated with the feeder calf marketing system has been modeled by fasting cattle for 32 (Galyean et al., 1981) and 24 h (Cole and Hutcheson, 1985). These authors reported greater rumen pH following fasting with a subsequent decrease at refeeding. However, these experiments used a single pH measurement either 3 d (Galyean et al., 1981) or 4, 14, 24, 48, and 72 h (Cole and Hutcheson, 1985) after refeeding. Limited data exist continuously recording rumination, activity, rumen pH, and rumen temperature in beef calves throughout a 56-d receiving period.
Provision of an oral drench with water in dehydrated or newly received cattle may promote feed intake and improve performance (Stokes and Goff, 2001; Tomczak et al., 2019); however, the underlying mechanisms behind this response have yet to be elucidated. Therefore, the objective of this study was to quantify rumination time, activity, rumen temperature, and rumen pH in high-risk, newly received beef cattle relative to oral hydration therapy with water and clinical BRD incidence. It was hypothesized that oral hydration therapy would alter pH and increase rumination time. Cattle clinically diagnosed with BRD were hypothesized to have increased rumen temperature and decreased rumination time and activity compared with nontreated cohorts.
MATERIALS AND METHODS
All animal procedures associated with this study were approved by the West Texas A&M University Institutional Animal Care and Use Committee (#02-05-17). There were 3 truckload blocks of high-risk feeder steers and bulls transported 739 km from a central TX order buyer facility to the West Texas A&M University Research Feedlot between June 2017 and September 2017 to evaluate the impact of oral hydration therapy at feedlot arrival on subsequent performance and health (Tomczak et al., 2019). Before arrival, a subset from each block were randomly selected to be fitted with a rumination collar (Allflex Livestock Intelligence, Madison, WI) and a rumen pH and temperature data logging bolus (Well Cow Limited, Roslin, UK). The rumination collar was fitted around the calf’s neck to position the 3-axis accelerometer on the left side of the animal. The collars continuously recorded rumination and active minutes and the data were summarized in 2-h increments. The rumen pH and temperature data logging boluses were administered via intubation. The weighted boluses were designed to settle in the rumen via peristaltic contractions aided by the weight of the bolus. Rumen pH and temperature were logged every 15 min. The subset animals were selected via chute entry order at the order buyer facility, where every fourth bull to enter the chute was fitted with the data recording devices. This randomization method continued until 20 bulls per truckload block were selected and fitted with the devices. Steers and bulls were balanced by sex and stratified to treatment pens by purchase BW (n = 10 bulls or steers per pen). The subset bulls were also balanced across treatment pens (n = 2 subset bulls per pen). For rumination and activity data, 1 animal from each treatment was removed from the data set (1 due to a gastrointestinal blockage and 1 due to lameness), resulting in 29 calves per treatment. The data logging boluses were originally designed for mature dairy cows. Due to the large size of the boluses used in lighter BW cattle, some were not able to pass into the rumen. Successful bolus retention and readability allowed for 19 H2O and 14 CON animals in the final rumen pH and temperature data set.
Cattle were housed in 6.1 m × 26.9 m soil surface pens providing at least 0.61 m per animal of linear bunk space. Initial processing, BRD case definition, diet (Table 1), and feed bunk management are described in Tomczak et al. (2019). It is important to note all bulls were surgically castrated and administered a nonsteroidal anti-inflammatory drug (meloxicam, 1 mg/kg BW) at arrival and a pentavalent modified-live virus (MLV) vaccine (Titanium 5, Elanco, Greenfield, IN) was not administered until day 28. Calves were weighed every 14 d throughout the 56-d receiving period.
Table 1.
Ingredient and nutrient composition of the receiving diet
| Ingredient, % of DM | |
| Steam flaked corn | 13.9 |
| Sweet Bran1 | 56.4 |
| Corn stalks | 19.1 |
| Molasses | 7.3 |
| Supplement2 | 3.3 |
| Nutrient composition3 | |
| DM, % | 66.5 |
| CP, DM% | 16.6 |
| TDN, DM% | 74.0 |
| NEm, Mcal/kg DM | 1.76 |
| NEg, Mcal/kg DM | 1.14 |
1Sweet Bran wet corn gluten feed (Cargill, Inc., Blair, NE).
2Supplement = 68.94% CaCo3, 19.15% NaCl, 5.25% KCl, 2.66% MgO, 2.00% lecithin, 0.57% ZnSO4, 0.30% vitamin A, 0.27% Na2Se03, 0.12% vitamin E, 0.11% CuSO4, 34 g/909.1 kg Rumensin-90.
3Proximate analysis at a commercial laboratory (Servi-tech Laboratories, Amarillo, TX).
Experimental treatments consisted of oral hydration therapy (H2O) or negative control (CON). Oral hydration therapy was administered using a modified drenching apparatus described by Tomczak et al. (2019). The H2O treatment was offered 0.57 L water/45.4 kg of BW during initial processing. The drenching apparatus was placed in an antiseptic solution containing chlorohexidine between each H2O-treated animal.
Data Collection and Statistical Analysis
Raw rumination and active minutes were logged continuously and then summarized in 2-h time blocks starting at midnight (0000) using the Data Flow II program (Allflex Livestock Intelligence). Daily rumination and active minutes were the sum of the twelve 2-h time blocks from 0000 to 2359 within a day. Hourly rumination and active minutes represent minutes spent ruminating or in motion in each 2-h time block across the 56-d receiving period. Rumen temperature and pH were logged every 15 min throughout the 56-d receiving period. These data were rounded to the nearest 15-min interval and averaged by hour using a computer software program (Microsoft Excel 2010, Microsoft, Redmond, WA).
The MIXED procedure of SAS (SAS Inst. Inc., Cary, NC) was used to analyze the fixed effect of oral hydration therapy on daily and hourly rumination minutes, active minutes, rumen pH, and rumen temperature. Pen was the experimental unit for comparison of the experimental treatments. Daily means model included hydration therapy treatment, day, and their interaction as fixed effects. Truckload block, pen, and block by pen interaction were considered random. Day was included as a random effect to test for hourly differences across days. The subject for repeated measures was pen within block.
Cattle treated at least once for BRD (RCASE) were compared with their nontreated cohorts (RCON) to retrospectively evaluate the effect of clinical BRD diagnosis on rumination minutes, active minutes, rumen pH, and rumen temperature. The models used were identical to the oral hydration therapy models except animal was the experimental unit and BRD outcome was a fixed effect. Animal was used as the experimental unit in these models because BRD diagnosis was assessed on an individual animal basis. The BRD diagnosis data were not balanced (19 vs. 39; 12 vs. 21; RCASE vs. RCON; for collar and data logging bolus data, respectively) because calves could not be randomly assigned to BRD diagnosis. If a fixed effect was statistically significant, α ≤ 0.05, then least squares means were separated using the PDIFF option of SAS (P ≤ 0.05). Tendencies were noted when 0.05 < P ≤ 0.10 for a main effect or interaction.
RESULTS AND DISCUSSION
Oral Hydration Therapy
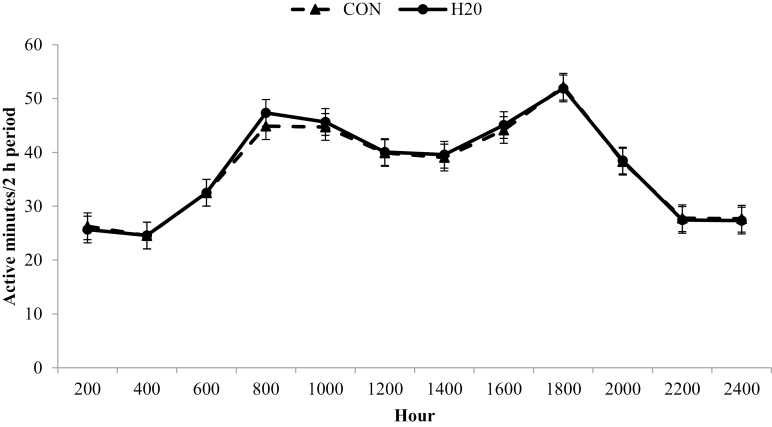
There was no treatment × day interaction for active minutes (P = 0.84), but there was a treatment × hour interaction (P < 0.01; Fig. 1) where H2O had reduced (P = 0.09) active minutes at 0800 h compared with CON. The peak activity hours are representative of the typical eating behavior of ruminants where meals are concentrated around early morning and twilight (Welch and Hooper, 1988). Feed delivery in the current study began at approximately 0730 h, concomitant with the initial peak in activity at 0800 h. The subsequent evening activity peak occurred at 1800 h.
Figure 1.
Hourly activity for calves administered oral hydration therapy with water (H2O) at feedlot arrival and negative control (CON). Active minutes was generated from an accelerometer collar (Allflex Livestock Intelligence, Madison, WI) with 2-h data logging intervals averaged by experimental treatment across the 56 d following feedlot arrival. Effect of treatment, P = 0.82; hour, P < 0.01; and treatment × hour, P < 0.01. *H2O differs from CON within hour (P < 0.05).
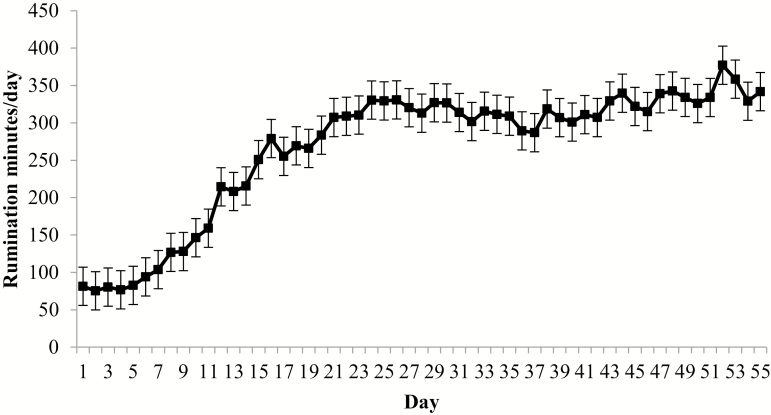
For time spent ruminating, there was no 2-way interaction between day and water treatment (P = 0.30); however, there was a day effect (P < 0.01; Fig. 2). Daily rumination minutes increased markedly through day 25, then smaller increases continued through the remainder of the receiving period. In addition, there was a hydration treatment × hour interaction (P < 0.01), but no treatment differences within hour (P ≥ 0.12) for rumination minutes. Greater intake, and more specifically forage intake, has been correlated with increased time spent ruminating (Gentry et al., 2016). As reported in Tomczak et al. (2019), DMI for these calves increased through day 28 of this 56-d study. Increased DMI probably caused increases in daily rumination minutes.
Figure 2.
Daily rumination minutes in high-risk feeder calves during the first 56 d following feedlot arrival. Rumination time was determined using an accelerometer collar (Allflex Livestock Intelligence, Madison, WI) with daily means averaged from 2-h data logging periods. Effect of BRD, P = 0.81; day, P < 0.01; and BRD × day, P = 0.30.
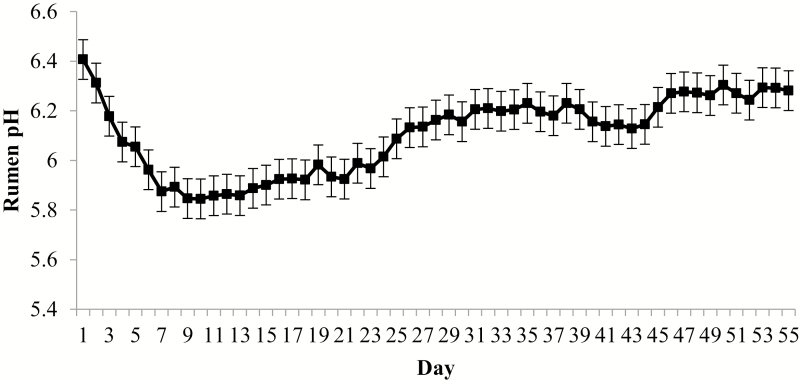
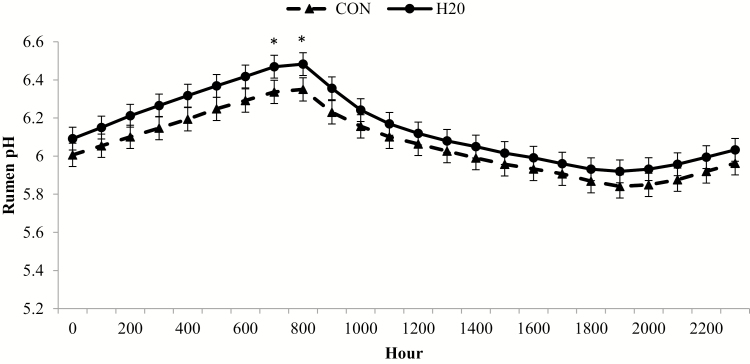
No interaction for daily rumen pH existed (P ≥ 0.23); however, there was a day effect (P < 0.01; Fig. 3). Average daily rumen pH was greatest at arrival, but decreased until day 7 and remained static at a pH of approximately 6.0 through day 24. On day 24 through day 56, pH equilibrated to approximately 6.2. There was a 2-way interaction (P < 0.01) between hour and hydration treatment, where H2O had greater pH at 0700 and 0800 h compared with CON (Fig. 4). Steers were deprived of feed and water for 24 h, refed and watered for 24 h, feed and water deprived for another 24 h and finally refed by Cole and Hutcheson (1985) to alter feed intake levels for 3 d. Total volatile fatty acids was least following the second fasting period but increased by 3 d post-fast. The authors suggested fasting decreased rumen fermentation capacity as indicated by decreased VFA concentrations. Decreased VFA concentrations contribute to increasing pH. In the present study, rumen pH was more acidic on day 3 compared with day 0 and rumen pH continued to decline through day 7, indicating increased rumen fermentation after arrival. The high-risk cattle used in the present study may have required more time to restore rumen fermentative capacity compared with Cole and Hutcheson (1985) as they experienced longer feed and water deprivation and were acclimating to a new environment, feed, and social grouping. Galyean et al. (1981) also reported increased rumen pH and decreased total VFA concentration following a 32 h fast when cattle were transport stressed. At refeeding, rumen pH decreased and VFA concentration increased. Ruminal VFA concentrations were not measured in the present study, but it is hypothesized decreased VFA concentrations in the rumen caused greater pH at arrival.
Figure 3.
Daily rumen pH for high-risk feeder calves during the 56-d feedlot receiving period. Rumen pH was determined from a data logging bolus (Well Cow Limited, Roslin, UK), where daily pH was averaged from data logged every 15 min. Effect of BRD, P = 0.51; day, P < 0.01; and BRD × day, P = 0.23.
Figure 4.
Hourly rumen pH differs between calves administered oral hydration therapy (H2O) at feedlot arrival and negative control (CON). Rumen pH was determined from a data logging bolus (Well Cow Limited, Roslin, UK) with hourly means generated by experimental treatment averaged across the 56 d following feedlot arrival from data logged every 15 min. Effect of treatment, P = 0.18; hour, P < 0.01; and treatment × hour, P < 0.01. *H2O differs from CON within hour (P < 0.05).
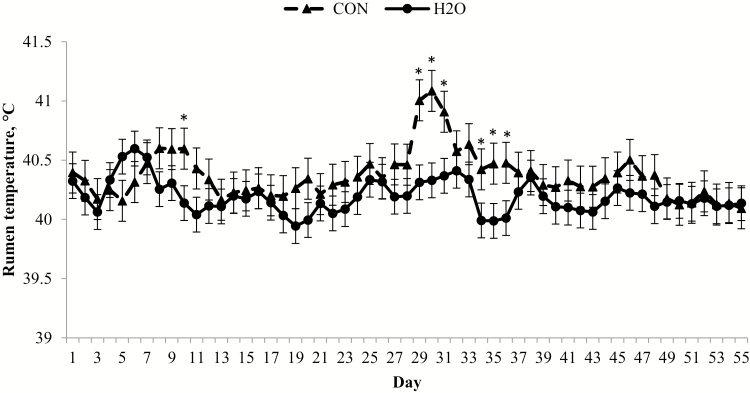
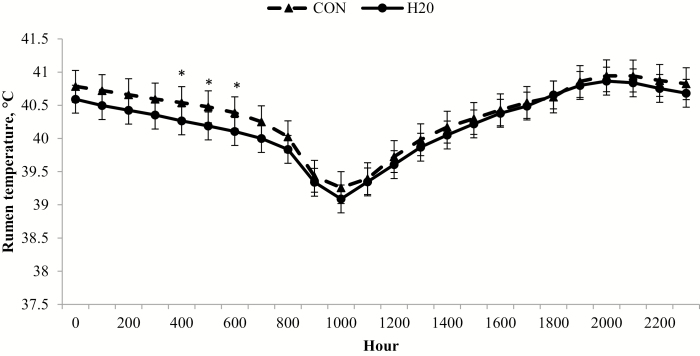
An oral hydration therapy treatment × day interaction existed (P = 0.04) for rumen temperature; an initial peak occurred on day 6 for H2O, but a similar peak did not occur until day 8 for CON (Fig. 5). In addition, CON had an increase in rumen temperature following MLV vaccination on day 28. There was an oral hydration therapy treatment × hour (P < 0.01; Fig. 6) interaction, where CON had greater rumen temperature than H2O from 0400 to 0600 h. The febrile response is initiated by proinflammatory cytokines such as tumor necrosis factor α and interleukin-1 (Roth and Blatteis, 2011; Tesch et al., 2018). The earlier increase in rumen temperature may indirectly indicate a more rapid inflammatory response following feedlot arrival, which could be beneficial for mitigation of viral or bacterial infection associated with BRD. After initial MLV respiratory vaccination on day 28, CON had a greater (P ≤ 0.01) rumen temperature 3 d following vaccine administration. The differential febrile response subsequent to MLV vaccination was unexpected, but may be due to differences in immunocompetence between treatments at the time of vaccination (day 28). Research evaluating the effects of oral hydration therapy on the various components of the immune system is warranted to investigate this hypothesis.
Figure 5.
Daily rumen temperature differs between calves administered oral hydration therapy (H2O) at feedlot arrival and negative control (CON). Rumen temperature was determined from a data logging bolus (Well Cow Limited, Roslin, UK) with daily means averaged by experimental treatment from data logged every 15 min. Effect of treatment, P = 0.18; day, P < 0.01; and treatment × day, P = 0.04. *H2O differs from CON within day (P < 0.05).
Figure 6.
Hourly rumen temperature differs between calves administered oral hydration therapy (H2O) at feedlot arrival and negative control (CON). Rumen temperature was determined from a data logging bolus (Well Cow Limited, Roslin, UK) with hourly means generated by experimental treatment across the 56 d following feedlot arrival from data logged every 15 min. Effect of treatment, P = 0.29; hour, P < 0.01; and treatment × hour, P < 0.01. *H2O differs from CON within hour (P < 0.05).
Bovine Respiratory Disease
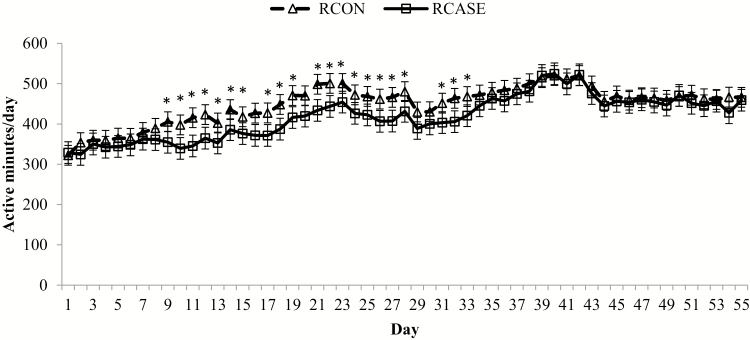
There was a BRD × day interaction (P < 0.01) for active minutes, where RCASE had decreased active minutes intermittently from day 9 through day 33 (Fig. 7). Buhman et al. (2000) documented feeding and eating behavior in 250-kg heifers for 57 d following feedlot arrival. In this study, heifers classified as a BRD case had decreased eating frequency, eating duration, drinking frequency, and drinking duration from days 11 to 27. Sowell et al. (1999) reported fewer eating and drinking bouts by morbid steers than healthy steers during a 32-d receiving period. Reduced activity 4 to 5 d before BRD diagnosis has also been reported (Pillen et al., 2016). In the present study, active minutes is an indicator of general motion and does not differentiate eating or drinking behavior from other activity. However, it is hypothesized the reduced activity values indicate decreased eating and drinking events driven by stress, infection, and the associated inflammatory response. In both the present data and that reported by Buhman et al. (2000), calves treated at any point during the study were classified as BRD cases for the statistical analysis, so some data points for BRD cases may be similar to healthy cattle because they were collected at times when cattle were not experiencing respiratory infection. Before and following convalescence from the BRD event, calves classified as RCASE probably had activity levels comparable to cattle never treated for BRD, so the difference in activity is probably greater during a BRD event than the current data indicate. No difference in activity between RCASE and RCON after day 33 is likely due to the overall resolution of the natural BRD challenge in our study population.
Figure 7.
Daily activity differs between calves diagnosed and treated at least once for BRD (RCASE) and those never treated (RCON). Active minutes was generated from an accelerometer collar (Allflex Livestock Intelligence, Madison, WI) with daily means averaged by BRD status from 2-h data logging periods. Effect of BRD, P = 0.02; day, P < 0.01; and BRD × day, P < 0.01. *RCASE differs from RCON within day (P < 0.05).
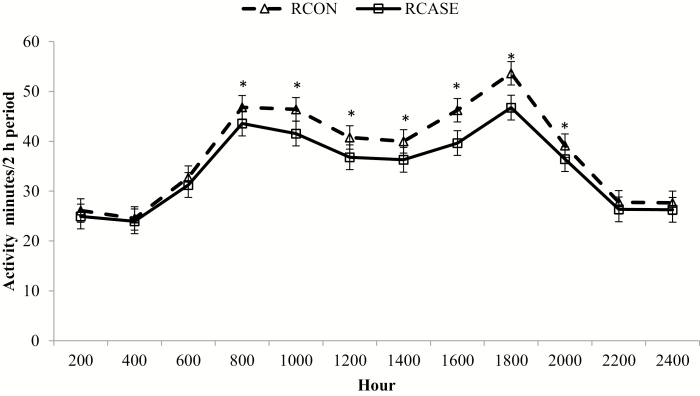
In addition, there was a BRD × hour interaction (P < 0.01; Fig. 8) for active minutes, where RCON was greater than RCASE between 0800 and 2000 h. The decrease in active minutes for RCASE is suggestive of decreased activity around primary meal times. Decreased activity is also related to depression induced by the inflammatory response. Depression in cattle, indicated by lethargy and distended head and ears, is also used as a sign to indicate potential BRD cases (Step et al., 2008; Pillen et al., 2016). Decreased locomotion spares energy to support metabolic processes and the fever response during the inflammatory response (Hart, 1988). An active inflammatory response may be driving decreased activity levels in RCASE. Also noteworthy is the lack of difference in active minutes between 2000 and 0800 h. Cattle are typically inactive during these hours regardless of health status. This may indicate behavior monitoring for disease identification in production settings may only require data capture for specific times of the day; thereby, reducing the amount of data transfer required.
Figure 8.
Hourly activity differs between calves diagnosed and treated at least once for BRD (RCASE) and those never treated (RCON). Active minutes was generated from an accelerometer collar (Allflex Livestock Intelligence, Madison, WI) with 2-h data logging intervals averaged by BRD status across the 56 d following feedlot arrival. Effect of BRD, P = 0.71; hour, P < 0.01; and BRD × hour, P = 0.04. *RCASE differs from RCON within hour (P < 0.05).
There was no BRD × day interaction (P = 0.24) for rumination minutes, but there was a day effect (P < 0.01; Fig. 2). All RCASE were identified as BRD cases before day 17, suggesting the majority of the disease challenge occurred before day 25, allowing downregulation of the inflammatory response and a subsequent increase in DMI. The sharp increase in rumination minutes (Fig. 2) is probably influenced by convalescence at this time in the majority of the cattle.
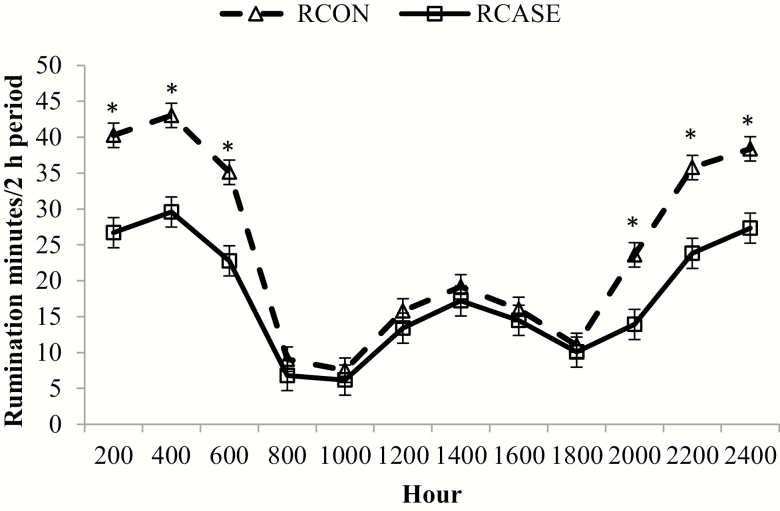
An interaction between BRD and hour was observed (P < 0.01; Fig. 9). No differences occurred in hourly rumination minutes from 0800 through 1800 h, but RCON had increased (P ≤ 0.01) rumination minutes from 0200 to 0600 h and 2000 to 2400 h. Hourly rumination minutes within a day have an inverse pattern compared with hourly activity values (Fig. 8 vs. Fig. 9). Rumination minutes were lowest during times of greatest activity, which occurred early in the morning and just before twilight. Hourly rumination minutes observed from the current study are comparable to both the maximum and minimum reported by Gentry et al. (2016) and Weiss et al. (2017), which quantified rumination time using the same technology in beef cattle. However, the current data set has a more pronounced midday peak in rumination than the previous publications. In all 3 studies, feed was delivered once per day. Differences in the pattern of hourly rumination time within day may be influenced by differences in feeding behavior across different feeding environments. In the present study, subset calves (n = 2 per pen) were group fed in pens with concrete bunks and 8 other animals. Weiss et al. (2017) used individually housed cannulated steers, and Gentry et al. (2016) evaluated steers in groups of 9 with individual feed data collected using Callan head gates. Feed delivery systems that individually isolate cattle during meals may alter feeding behavior and subsequent hourly rumination pattern within a day, and further research is needed to better understand the proposed mechanism for the reported differences.
Figure 9.
Minutes spent ruminating every 2 h differs between calves diagnosed and treated at least once for BRD (RCASE) and those never treated (RCON). Rumination time was determined using an accelerometer collar (Allflex Livestock Intelligence, Madison, WI) with 2-h data logging intervals averaged by BRD status across the 56 d following feedlot arrival. Effect of BRD, P < 0.01; hour, P < 0.01; and BRD × hour, P < 0.01. *RCASE differs from RCON within hour (P < 0.05).
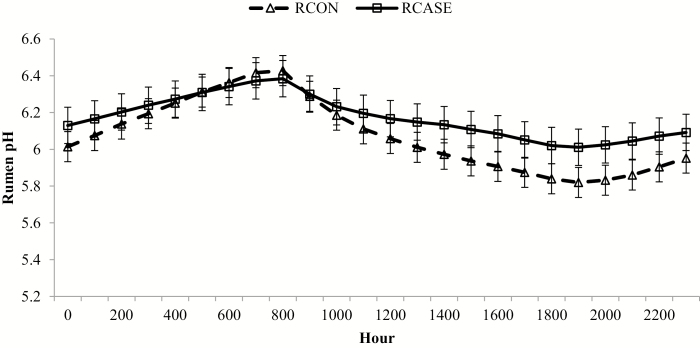
We detected a 2-way interaction (P < 0.01) between hour and BRD incidence for rumen pH, such that RCASE had numerically reduced rumen pH compared with RCON between 1600 and 2100 h (P ≤ 0.10; Fig. 10). Following morning feed delivery (0730), the rumen pH in RCON declined to a greater extent than RCASE likely due to decreased feed intake by RCASE caused by the anorectic behavior induced by inflammation (Plata-Salamán et al., 1988). Decreased feed intake probably limited VFA production resulting in greater rumen pH in RCASE calves. Laarman et al. (2012) used rumen pH boluses in young Holstein bulls and found that hourly pH decreased rapidly following feed delivery, then increased gradually through the remainder of the day, which agrees with observations in the present data set. A limitation of the BRD effects noted is that calves were classified as RCASE after a single treatment for BRD. Throughout the 56-d trial, RCASE were probably experiencing infectious challenge for only a portion of the time and overall health status improved as the study progressed.
Figure 10.
Hourly rumen pH for calves diagnosed and treated at least once for BRD (RCASE) and those never treated (RCON). Rumen pH was determined from a data logging bolus (Well Cow Limited, Roslin, UK) with hourly means generated by BRD status averaged across the 56-d following feedlot arrival from data logged every 15 min. Effect of BRD, P = 0.36; hour, P < 0.01; and BRD × hour, P < 0.01. *RCASE differs from RCON within hour (P < 0.05).
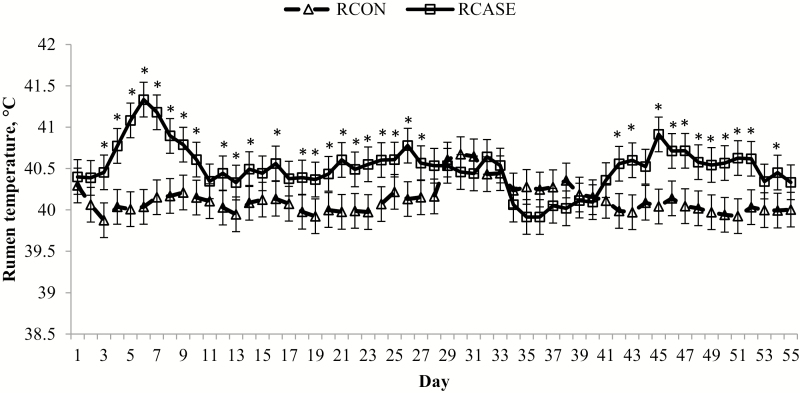
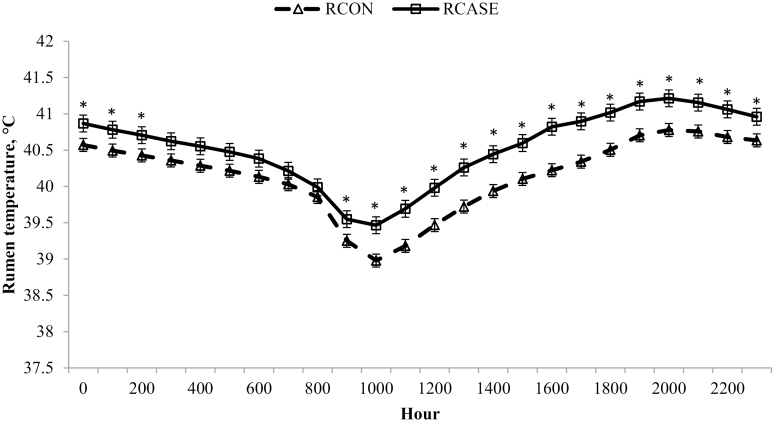
There was also a BRD × day interaction (P < 0.01; Fig. 11) for daily rumen temperature, such that RCASE had greater rumen temperatures than RCON except for the 12 d following MLV respiratory vaccination on day 28. There was also a BRD treatment × hour (P < 0.01; Fig. 12) interaction for rumen temperature. There was no difference in rumen temperature between RCON and RCASE from 0300 through 0800 h (P ≥ 0.06), but for all other time intervals, RCASE had greater (P ≤ 0.05) rumen temperature than RCON. Increased rumen temperature in RCASE was probably due to increased inflammation in response to infectious agents involved in BRD. After MLV vaccination (on day 28), RCON rumen temperature increased from the inflammatory response, whereas RCASE already had increased rumen temperature on day 28 that did not increase further. Timsit et al. (2011) used rumen temperature boluses to diagnose BRD in 24 bull calves for 40 d after feedlot arrival. If a bull had a ruminal hyperthermia episode for greater the 6 h they were visually examined for clinical BRD signs then chute restrained to measure rectal temperature and evaluate lung auscultation. There was confirmed BRD diagnosis in 38 out of 52 suspected cases featuring rumen hypothermia episodes, resulting in a positive predictive value of 73%. These findings support our observation of increased rumen temperature in RCASE.
Figure 11.
Daily rumen temperature differs between calves diagnosed and treated at least once for BRD (RCASE) and those never treated (RCON). Rumen temperature was determined from a data logging bolus (Well Cow Limited, Roslin, UK) with daily means averaged by BRD status from data logged every 15 min. Effect of BRD, P < 0.01; day, P < 0.01; and BRD × day, P < 0.01. *RCASE differs from RCON within day (P < 0.05).
Figure 12.
Hourly rumen temperature differs between calves diagnosed and treated at least once for BRD (RCASE) and those never treated (RCON). Rumen temperature was determined from a data logging bolus (Well Cow Limited, Roslin, UK) with hourly means generated by BRD status across the 56 d following feedlot arrival from data logged every 15 min. Effect of BRD, P < 0.01; hour, P < 0.01; and BRD × hour, P < 0.01. *RCASE differs from RCON within hour (P < 0.05).
Conclusions
There was an initial post-arrival peak in rumen temperature 2 d earlier in calves administered oral hydration therapy, suggesting an earlier and more stimulated immune (febrile) response. The biological mechanism for this outcome is not yet known, but may be influenced by improved hydration and energy balance in H2O. The incidence of clinical BRD in this subset population resulted in decreased activity, less time spent ruminating, and increased rumen temperature. Changes in these variables could be used to assist with BRD diagnosis in the future. At arrival, high-risk auction-sourced feeder calves had elevated rumen pH, which decreased for 7 d, before equilibrating and increasing gradually through the 56-d receiving period. Furthermore, time spent ruminating was initially decreased, but increased concomitant with increased DMI through day 28. These data identify potential variables for BRD diagnosis and provide benchmark rumen dynamics during the receiving period in high-risk feeder calves.
LITERATURE CITED
- Buhman M., Perino L., Galyean M., Wittum T., Montgomery T., and Swingle R.. 2000. Association between changes in eating and drinking behaviors and respiratory tract disease in newly arrived calves at a feedlot. Am. J. Vet. Res. 61:1163–1168. doi:10.2460/ajvr.2000.61.1163 [DOI] [PubMed] [Google Scholar]
- Cole N. A., and Hutcheson D. P.. 1985. Influence of prefast feed intake on recovery from feed and water deprivation by beef steers. J. Anim. Sci. 60:772–780. doi:10.2527/jas1985.603772x [DOI] [PubMed] [Google Scholar]
- Galyean M. L., R. W. Lee, and Hubbert M. E.. 1981. Influence of fasting and transit on ruminal and blood metabolites in beef steers. J. Anim. Sci. 53:7–18. doi:10.2527/jas1981.5317 [DOI] [PubMed] [Google Scholar]
- Gentry W. W., C. P. Weiss C. M. Meredith F. T. McCollum N. A. Cole, and Jennings J. S.. 2016. Effects of roughage inclusion and particle size on performance and rumination behavior of finishing beef steers. J. Anim. Sci. 94:4759–4770. doi:10.2527/jas.2016-0734 [DOI] [PubMed] [Google Scholar]
- Hart B. L. 1988. Biological basis of the behavior of sick animals. Neurosci. Biobehav. Rev. 12:123–137. doi:10.1016/S0149-7634(88)80004–6 [DOI] [PubMed] [Google Scholar]
- Laarman A. H., T. Sugino, and Oba M.. 2012. Effects of starch content of calf starter on growth and rumen pH in Holstein calves during the weaning transition. J. Dairy Sci. 95:4478–4487. doi:10.3168/jds.2011-4822 [DOI] [PubMed] [Google Scholar]
- Pillen J., Pinedo P., Ives S., Covey T., Naikare H., and Richeson J.. 2016. Alteration of activity variables relative to clinical diagnosis of bovine respiratory disease in newly received feedlot cattle. Bov. Pract. 50:1–8. [Google Scholar]
- Plata-Salamán C. R., Y. Oomura, and Kai Y.. 1988. Tumor necrosis factor and interleukin-1 beta: Suppression of food intake by direct action in the central nervous system. Brain Res. 448:106–114. doi:10.1016/0006-8993(88)91106–7 [DOI] [PubMed] [Google Scholar]
- Roth J., and Blatteis C.. 2011. Mechanisms of fever production and lysis: Lessons from experimental LPS fever. Compr. Physiol. 4:1563–1604. doi:10.1002/cphy.c130033 [DOI] [PubMed] [Google Scholar]
- Sowell B. F., M. E. Branine J. G. Bowman M. E. Hubbert H. E. Sherwood, and Quimby W.. 1999. Feeding and watering behavior of healthy and morbid steers in a commercial feedlot. J. Anim. Sci. 77:1105–1112. doi:10.2527/1999.7751105x [DOI] [PubMed] [Google Scholar]
- Step D. L., C. R. Krehbiel H. A. DePra J. J. Cranston R. W. Fulton J. G. Kirkpatrick D. R. Gill M. E. Payton M. A. Montelongo, and Confer A. W.. 2008. Effects of commingling beef calves from different sources and weaning protocols during a forty-two-day receiving period on performance and bovine respiratory disease. J. Anim. Sci. 86:3146–3158. doi:10.2527/jas.2008-0883 [DOI] [PubMed] [Google Scholar]
- Stokes S. R., and Goff J. P.. 2001. Evaluation of calcium propionate and propylene glycol administered into the esophagus of dairy cattle at calving. Prof. Anim. Sci. 17:115–122. doi:10.15232/S1080-7446(15)31607-7 [Google Scholar]
- Taylor J. D., R. W. Fulton T. W. Lehenbauer D. L. Step, and Confer A. W.. 2010. The epidemiology of bovine respiratory disease: What is the evidence for predisposing factors? Can. Vet. J. 51:1095–1102. [PMC free article] [PubMed] [Google Scholar]
- Tesch T., E., Bannert J., Kluess J., Frahm L., Hüther S., Kersten G., Breves L., Renner S., Kahlert H. J., Rothkötter, et al. 2018. Relationships between body temperatures and inflammation indicators under physiological and pathophysiological conditions in pigs exposed to systemic lipopolysaccharide and dietary deoxynivalenol. J. Anim. Physiol. Anim. Nutr. (Berl.) 102:241–251. doi:10.1111/jpn.12684 [DOI] [PubMed] [Google Scholar]
- Timsit E., S. Assié R. Quiniou H. Seegers, and Bareille N.. 2011. Early detection of bovine respiratory disease in young bulls using reticulo-rumen temperature boluses. Vet. J. 190:136–142. doi:10.1016/j.tvjl.2010.09.012 [DOI] [PubMed] [Google Scholar]
- Tomczak D., Samuelson K., Jennings J., and Richeson J.. 2019. Oral hydration therapy with water affects health and performance of high-risk, newly received feedlot cattle. Appl. Anim. Sci. 35:30–38. doi:10.15232/aas.2018-01796 [DOI] [PMC free article] [PubMed] [Google Scholar]
- Weiss C. P., W. W. Gentry C. M. Meredith B. E. Meyer N. A. Cole L. O. Tedeschi F. T. McCollum, and Jennings J. S.. 2017. Effects of roughage inclusion and particle size on digestion and ruminal fermentation characteristics of beef steers. J. Anim. Sci. 95:1707–1714. doi:10.2527/jas.2016.1330 [DOI] [PubMed] [Google Scholar]
- Welch J., and Hooper A.. 1988. Ingestion of feed and water. In: Church D., editor, The ruminant animal: Digestive physiology and nutrition. Prentice Hall, Englewood Cliffs, NJ: p. 108–116. [Google Scholar]


