

Abstract
Scope:
Cruciferous vegetable consumption is associated with favorable health outcomes. Bioactive compounds arising in these, especially isothiocyanates, exert effects that contribute to prevention of disease, in large part through attenuation of inflammation and oxidative stress. However, much about isothiocyanate metabolites and their role as biomarkers of crucifer intake remain unknown.
Methods and results:
We tested the utility and limitations of 2-thiothiazolidine-4-carboxylic acid (TTCA) as a urinary biomarker of broccoli beverage intake in a randomized crossover clinical trial where 50 participants consumed either a glucoraphanin-rich (GRR) or sulforaphane-rich (SFR) beverage. Compared to run-in and wash-out periods, we observed significantly higher urinary TTCA after broccoli beverage consumption. Measurements also showed that TTCA was present in beverage powders and in all tested cruciferous vegetables. GRR resulted in excretion of ~87% of the ingested TTCA while SFR resulted in excretion of ~176%. Elevated urinary TTCA was observed in rats administered 100 μmol/kg SFN. Unlike SFN, TTCA did not activate Nrf2-mediated cytoprotective signaling.
Conclusion:
Collectively, TTCA appears to be common isothiocyanate-derived metabolite that has the capacity to be utilized as a biomarker of cruciferous vegetables which would be beneficial for objective and quantitative tracking of intake in studies.
PubMed Indexing: Palliyaguru, Salvatore, Schopfer, Cheng, Zhou, Kensler, Wendell
Keywords: 2-Thiothiazolidine-4-carboxylic acid, cruciferous vegetables, broccoli, isothiocyanates, sulforaphane, glucosinolates, glucoraphanin, Nrf2
Graphical Abstract
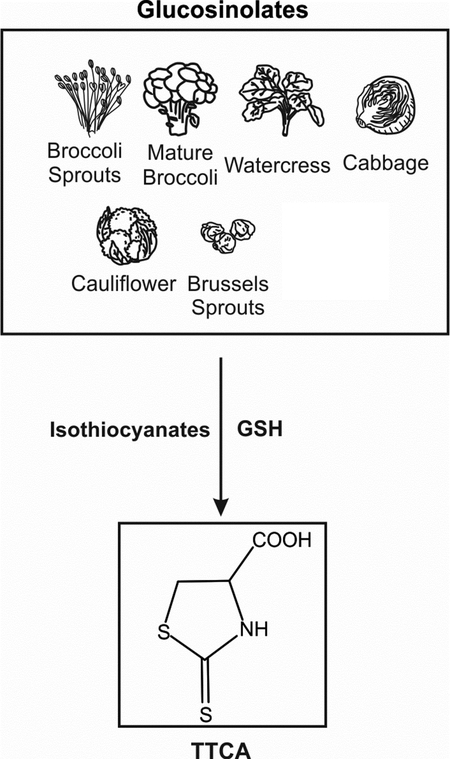
Studying the health effects of cruciferous vegetables is limited by the absence of a reliable biomarker that can accurately determine intake levels. 2-thiothiazolidine-4-carboxylic acid (TTCA) is formed during isothiocyanate metabolism in cruciferous plants. Urinary levels of TTCA can therefore likely predict intake of all types of cruciferous vegetables, irrespective of the identity of the precursor glucosinolate species. With further validation in large nutritional epidemiology studies, TTCA can be a useful biomarker to assess intake of crucifers.
INTRODUCTION
Several dozen types of vegetables make up the cruciferous vegetable family and they have been evaluated as disease preventative and therapeutic agents in both observational studies and in randomized clinical trials [1, 2, 3, 4]. The underlying biological mechanism of these disease-mitigating effects is governed by the enzymatic conversion of glucosinolates to isothiocyanates by the plant enzyme myrosinase. Isothiocyanates, such as sulforaphane (SFN), have potent anti-bacterial, anti-fungal and anti-carcinogenic effects [5, 6] and have been shown to work through activating the Nrf2-mediated stress response amongst several other cytoprotective pathways [7, 8]. Specifically, the attenuation of inflammation and alteration of other aspects of oxidative stress are hallmarks of Nrf2 pathway activation by small electrophilic molecules such as SFN [9].
One of the leading challenges involved in the use of cruciferous vegetables as a nutritional intervention strategy is the absence of reliable, non-invasive biomarkers to assess intake. In studies employing a single type of cruciferous plant, urinary metabolites of isothiocyanates have been used as markers of uptake or bioavailability. For example, our previous clinical trials with broccoli preparations have used urinary SFN metabolites including total or unmetabolized SFN, or SFN-mercapturic acid [10] while in trials using cabbage and Brussels sprouts, 3,3’-diindolyl methane [11] has been used. However, given the fact that the predominant glucosinolate-isothiocyanate species in various cruciferous plants is different and is subject to change based on a variety of external factors such as plant type, part, age and growth conditions etc. [12], measuring these specific metabolites may be deemed less useful when assessing intake of cruciferous vegetables as a whole. Additionally, S-methyl-L-cysteine sulfoxide (SMCSO) has been identified as a potential urinary biomarker of cruciferous vegetables by metabonomic profiling [13]; however, SMCSO is not specific to Brassicaceae as it is also found in small amounts in plants from the Alliceae (e.g., onions) and Fabaceae (e.g., legumes) families [14]. Zhang and colleagues developed a method to quantify isothiocyanate content by using cyclocondensation with vicinal dithiols [15] and has since been used to measure isothiocyanates in many clinical trials. However, whether isothiocyanates have preferred specificity to react with 1,2-benzenedithiol compared to other thiol-containing compounds present in crucifers is not clear. Therefore, a biologically inactive, plant-derived biomarker that is specific and common to all crucifers, irrespective of the identity of the precursor glucosinolate/isothiocyanate could greatly improve objective dietary assessment in clinical trials as well as in observational studies.
The primary and most recognized source of 2-thiothiazolidine-4-carboxylic acid (TTCA) is when it is formed during biotransformation of anthropogenic carbon disulfide (CS2) via glutathione (GSH) conjugation. Yet, it has also been detected in plants that contain glucosinolates [16, 17]. Elevated TTCA has been observed in the urine of people who consumed vegetables like cabbage [18]. Furthermore, it has been reported that endogenous TTCA from cruciferous vegetables (0.5–6 mg/kg) is excreted unchanged in the urine of people consuming them [19]. However, the pharmacokinetics of TTCA excretion as well as the utility of TTCA as a reliable marker of cruciferous vegetable intake could not be determined from these studies that employed small sample sizes of 10–14 volunteers and measured TTCA only before and after a single meal consisting of these vegetables. Interestingly, in Sprague-Dawley rats treated with methyl isothiocyanate, increased urinary TTCA has been observed [20] suggestive of the notion that TTCA is formed as a result of isothiocyanate biotransformation.
In our study, we evaluated whether TTCA could be used as a biomarker of crucifer intake. Stable isotope dilution liquid chromatography high resolution tandem mass spectrometry (LC-MS/MS) (Figure 1) was used to measure urinary TTCA of 50 participants in a randomized crossover cancer prevention clinical trial in Qidong, China at various time points before, during and after intake of two types of broccoli sprout-derived beverages over a course of 24 days. We also measured TTCA levels in the powders used to constitute the broccoli beverages as a way to determine the source of TTCA. TTCA levels were measured in the urine of rats orally gavaged with SFN to understand the contribution of SFN biotransformation to TTCA formation in vivo. In addition, TTCA content was quantified in multiple different types of crucifers and biological activity of TTCA was evaluated in cell culture. Collectively, our data indicated that TTCA could potentially be a useful biomarker to objectively measure cruciferous vegetable intake in clinical trials as well as in epidemiologic studies using a facile and high-throughput analytical method.
Figure 1. LC-MS/MS detection of TTCA.

Chromatographic profile and high resolution product ion spectra of TTCA (upper) and [13C3]TTCA (bottom).
2. METHODS
2.1. Study design
A schematic of the crossover study design is shown in Figure 2A and is described in detail in [10] and [21]. Briefly, 50 healthy volunteers were recruited from the farming community of He Zuo Township, Qidong, Jiangsu Province, People’s Republic of China (NCT01008826). Participants were randomized into two intervention arms in a crossover study where either a glucoraphanin-rich (GRR, 800 μmol) or sulforaphane-rich (SFR, 150 μmol) beverage was given daily. The study consisted of a run-in period (5 days) followed by a first nightly beverage consumption period (7 days) followed by a wash-out period (5 days) followed by a second beverage consumption period (7 days). Participants were instructed not to consume green leafy vegetables during the study to reduce possible dietary sources of other isothiocyanates. The different doses of GRR and SFR were given to establish equivalence in total SFN metabolites excreted in urine. However, subsequent measurements showed that urinary levels of unmetabolized SFN and SFN metabolites were higher in the SFR group compared to the GRR group and therefore the intended dose equivalence was not achieved. The entire volume of twelve-hour overnight urine samples was collected by the participants every night of the study. On the first and last days of the active intervention periods an additional twelve-hour daytime urine sample was collected. Urine samples for run-in and wash-out periods were separated by the randomization assignment of the participants (day 5 and day 13 were matched with wave 1 and day 17 was matched with wave 2). Procedures were followed in accordance with ethical standards approved by the Institutional Review Board of Johns Hopkins University. Written consent was obtained from all participants.
Figure 2. Urinary TTCA levels are significantly increased after broccoli sprout-derived beverage consumption in humans.

A) Crossover study design used to administer two broccoli sprout-derived beverages to 50 participants over a course of 24 days in Qidong, China. Either a glucoraphanin-rich (GRR) or sulforaphane-rich (SFR) beverage was consumed for 6 consecutive days during days 6–12 (1st wave) and days 18–24 (2nd wave). 12 Hour urines were collected throughout the study and the samples used to measure TTCA were from days 5, 6, 12, 13, 17, 18 and 24. B) Comparison of urinary TTCA levels in μmol per 12 hour urine volumes during supplementation with GRR or SFR. Run-in and wash-out period urines were separated according to the type of intervention participants underwent in the respective waves. Values are mean ± SEM (n=25 for intervention arms and n=50 for baselines). *p<0.05 compared to day 5 baseline. $p<0.05 compared to GRR at the same time. #p<0.05 compared to day 12.5 GRR (Anova).
2.2. Dosage regimen and beverage preparation
Both broccoli sprout powders were manufactured by preparing an aqueous extract after boiling 3-day old broccoli sprouts for 30 minutes. The boiling inactivates endogenous myrosinase required for glucosinolate metabolism, but does not affect the integrity of the glucosinolates as was confirmed by the glucoraphanin (GR) and SFN titer measurements in the GRR powder [10]. The GRR powder was prepared by lyophilizing the extract and the SFR powder was prepared by cooling the extract to 37°C and treating with myrosinase (released from Raphanus sativus sprouts) for 4 hours before lyophilization. The initial boiling results in negligible levels of SFN in GRR powder and using excess amounts of myrosinase in the preparation of SFR ensures that there are negligible levels of GR in the SFR powder. GR and SFN concentrations were measured in GRR and SFR powders as described [10]. Powder amounts corresponding to the daily doses of GRR (2.43 g of 329 μmol/g) and SFR (0.74 g of 202 μmol/g) were dissolved in a mango-water mix before administration. During the run-in and wash-out periods, mango-water mixes without GRR and SFR powders were given as placebo.
2.3. Standards and sample preparation
Only 12-hour urine samples collected on day 5, 6, 12, 13, 17, 18 and 24 were analyzed for this study. Urine samples were thawed, aliquoted and briefly centrifuged to separate sediments. Urine (500 μL) was spiked with 5 μL of [13C3]-TTCA (10 μg/mL stock) (Toronto Research Chemicals, Canada), acidified to pH 3 with concentrated HCl and brought to 1 mL with water. Then, 4 mL of diethyl ether was added, samples were vortexed and centrifuged at 1200 g for 10 min at 4 °C. The organic phase was transferred to a clean vial and dried under N2. The samples were reconstituted in 5% acetonitrile in water at pH 3 for LC-MS/MS analysis. The calibration curve was constructed using an analytical standard for TTCA and the [13C3]-TTCA internal standard (Toronto Research Chemicals, Canada) in Surine™ negative urine control (Sigma Aldrich, St Louis, MO). Urinary TTCA amounts were normalized to 12 hour urine volumes and reported as μmol per 12 hour urine.
2.4. Animal study
Four female, 8-week old August Copenhagen Irish (ACI) rats were obtained from Envigo (Somerset, NJ). All rats had access to ad libitum water and were fed a standard chow diet. Animals were orally gavaged with 100 μmol/kg body weight SFN (LKT Laboratories, St. Paul, MN), dissolved in DMSO. Urine was collected (24 hour) pre- and post-gavage by housing rats in metabolic cages (Tecniplast, Italy) for the duration of the collection. This animal study was conducted according to the ethical standards established and approved by the Institutional Animal Care and Use Committee of University of Pittsburgh. The extraction was as described above except that 250 μL of rat urine and 25 μL of [13C3]-TTCA (10 μg/mL stock) was used.
2.5. TTCA extraction from cruciferous vegetables, Avmacol® and SFN solution
Broccoli sprouts, mature broccoli, watercress, cabbage, cauliflower, Brussels sprouts and carrots were purchased at two different occasions from the same local market within a span of 1 month. Only vegetables that were labeled as organic were used for this study, except watercress, which was not available as organic produce at the times of purchasing. Organically grown vegetables were preferred due to previous reports showing that TTCA can be formed from pesticides such as Captan [22]. Cruciferous vegetables were frozen at −20°C upon purchase for 24 hours, weighed dry and homogenized in 200 μL water at pH 3 using a Bullet Blender (Next Advance, Troy, NY) and the supernatant was collected and spiked with [13C3] -TTCA (10 μL of 10 μg/mL stock) before extraction. Tablets of Avmacol® (Nutramax Laboratories, Edgewood, MD) were ground up, weighed and a known quantity was dissolved in water. SFN (LKT Laboratories, St Paul, MN) was dissolved in methanol to make solutions of 10, 100 and 200 μmol. TTCA extractions were carried out using 4 mL of diethyl ether and the organic phase was dried under N2 and reconstituted in 5% acetonitrile in water at pH 3 for LC-MS/MS analysis.
2.6. LC-MS/MS analysis
TTCA extracts were separated on a Vanquish UHPLC and analyzed by a high-resolution Q Exactive mass spectrometer (Thermo Scientific, Waltham, MA) using gradient solvent systems consisting of water containing 0.1% acetic acid (solvent A) and acetonitrile containing 0.1% acetic acid (solvent B). TTCA extracts were separated using a Hypersil GOLD column (100 × 2.1mm × 3μ; Thermo Scientific) at a 0.5 mL/min flow rate and using the following gradient program: 5% B from 0–0.3 min, 5–8% B from 0.3–3 min, 8 to 40% B from 3–3.1 min and holing until 4 min, and equilibration at 5% B from 4.1–6.0 min. The mass spectrometer was equipped with a HESI electrospray source and was operated in positive ion mode using the following parameters: sheath gas flow rate 30, aux gas flow rate 11, sweep gas flow rate 2, spray voltage 3.8 kV, capillary temperature 300 °C, aux gas heater temperature 200°C and S-lens RF level 55%. A parallel reaction monitoring method was used to follow m/z: 163.98345 (TTCA) and m/z 166.99410 ([13C3] -TTCA) for accurate mass identification and the product ions m/z 117.9780 (TTCA) and m/z 119. 9847 ([13C3]-TTCA) were used for quantification. Samples were quantified against the calibration curve developed with TTCA and [13C3]-TTCA in Surine™. Solvents used for extractions and mass spectrometric analyses were HPLC grade or better from Burdick and Jackson (Muskegon, MI).
2.7. Cell culture, RNA isolation and RT PCR
Wild-type (WT) and Nrf2-disrupted mouse embryonic fibroblasts (MEF) that were established according to previously published protocols [23] were seeded at 5 × 10⁵ cells/well in a 6-well plate. Cells were cultured in Iscove’s Modified Dulbecco Medium with 10% FBS. Cells were treated with TTCA (0.5 – 4 μM) or 10 μM SFN and were harvested 20 hours later. RNA was isolated using TRIzol (Invitrogen, Carlsbad, CA) and quantified using UV spectrophotometry at 260 nm. An absorbance ratio of 260/280 was utilized to determine the purity of RNA. RNA integrity was confirmed by gel electrophoresis and cDNA was synthesized using 1 μg of RNA with the qScript system (Quanta Biosciences, Beverly, MA). Real time PCR was performed on a Bio-Rad My-IQ with SYBR Green (Bio-Rad, Hercules, CA). PCR efficiency was determined using a standard curve method and the Pfaffl method was used for quantification of fold changes [24]. Primer sequences for Nqo1 and Gapdh were as previously published [25]. SFN was obtained from LKT laboratories (St Paul, MN).
2.8. Statistical analysis
Values are expressed as mean ± SEM. One-way Analysis of Variance (ANOVA) with Tukey’s post-test was employed for multiple comparisons and Student’s t-test was used for comparison between 2 groups. P<0.05 was considered to be statistically significant.
3. RESULTS
3.1. TTCA is increased in urine after broccoli sprout-derived beverage intake in humans
On day 5, at the end of the run-in period, levels of urinary TTCA were 0.050 ± 0.001 μmol/12 hours (Figure 2B). Longitudinal tracking of urinary TTCA at select points over the course of 24 days showed significant increases (1.5–3 μmol/12 hour) during the first 12 hours-post beverage consumption at days 6, 12, 18 and 24. In comparison, during the second 12 hours of these days, much lower (~1/10th) levels of TTCA were excreted in the urine for both the GRR and SFR groups, supporting previous observations of rapid clearance [26]. However, compared to the day 5 of the run-in, statistically significant levels of TTCA were still detected on wash-out days following the first wave of beverage consumption (day 13 and 17). For example, on day 17, at the end of the wash-out, urinary TTCA levels after consumption of GRR beverage were approximately 4.5-fold higher than observed on day 5, suggesting that consuming the beverage continuously leads to protracted, albeit relatively low levels of urinary TTCA. The 2-fold difference between excreted TTCA levels in GRR and SFR groups in the first wave is likely due to administration of higher amount of GRR (2.43 g powder) compared to SFR (0.74 g powder). Intriguingly, on day 18 (following the beginning of the second wave of the crossover), the 2-fold difference between GRR and SFR groups was diminished.
TTCA is detected in broccoli beverage powders and consumption of SFR beverage leads to a higher percentage of excreted TTCA
Cruciferous vegetable extracts have been shown to be significant sources of TTCA [19] and given the low variations of urinary TTCA between samples (Figure 2B), we hypothesized that TTCA might be pre-formed and present in the beverage at the time of consumption. Hence, we evaluated whether TTCA was present in the GRR and SFR powders. Significant levels of TTCA were detected in both GRR (~1.5 μmol/g of powder) and SFR (~1.4 μmol/g of powder) powders (data not shown) suggesting that TTCA was present in the broccoli sprouts that were used to manufacture the powders. Based on these data and the urinary TTCA data, we calculated the percentage of directly ingested TTCA that was excreted in the urine of participants after each daily dose of GRR or SFR powders (Table 1). The sum of urinary TTCA between the first and second 12 hour collections were used for this analysis. For GRR, ~93% (day 6), 106% (day 12), 72% (day 18) and 79% (day 24) of the ingested TTCAintake was excreted in urine. For SFR, ~165% (day 6), 164% (day 12), 232% (day 18) and 145% (day 24) of the TTCAintake was excreted in urine. Although the interquartile ranges were large in both groups on days 6, 12, 18 and 24, a modest but significant increase was seen in the percentage of excreted TTCA in the SFR group; perhaps due to the formation of additional TTCA through the biotransformation of SFN contained in the SFR beverage. Delta TTCA values were calculated by subtracting the excreted TTCA from the intake TTCA as a measure of TTCA absorbed by tissue, assuming the linear relationship of TTCAintake = TTCAuptake + TTCAexcreted. Urinary levels of GR, unmetabolized SFN and SFN metabolites were measured in (10) (Supplementary data) and were used to determine the contribution of SFN biotransformation to TTCA. The ratio of delta TTCA to urinary GR or SFN + SFN metabolites were very low. During the wash-out period, % excretions of TTCA were as follows: GRR (2.7% and 5.1% for day 13 and 17, respectively), SFR (11.8% and <1% for day 13 and 17, respectively). Collectively, these data bolstered the notion that urinary TTCA levels can originate from 2 sources – 1) from the plant itself and less predominantly 2) from isothiocyanates undergoing biotransformation upon ingestion.
Table 1.
Comparison of percentage of TTCA excretion as a fraction of TTCA intake on days 6,12 (wave 1) and 18, 24 (wave 2). Amount of unmetabolized GR present in urine after intervention (column 5) and total SFN metabolites (SFN-Cys, SFN-NAC and unmetabolized SFN) (column 6) are also shown for reference. Delta TTCA was calculated by subtracting TTCAexcreted from TTCAintake. Column 10 shows values for delta TTCA as a fraction of excreted GR (top line) and excreted SFNs (bottom line) for the interventions. All values are medians (IQR).
| Day | Beverage | Content and concentration of beverage | TTCAintake |
GRexcreted (μmol/24h) |
SFNmet, excreted (μmol/24h) |
TTCAexcreted (μmol/24h) |
% TTCAexcred/TTCAintake | Delta TTCA |
Delta TTCA/ GRexcreted SFNexcreted |
|---|---|---|---|---|---|---|---|---|---|
| 6 | GRR, 800 μmol |
[GR] = 329 μmol/g [SFN] = ND |
3.64 μmol | 3.71 (2.37, 4.79) | 19.22 (10.01, 41.7) | 3.4 (2.15, 5.34) | 93.1 (58.8, 146.9) | −0.51 (−1.5, 1.7) | −0.14 −0.02 |
| 12 | GRR 800 μmol |
[GR] = 329 μmol/g [SFN] = ND |
3.64 μmol | 3.64 (2.21, 4.77) | 32.37 (18.48, 50.72) | 3.9 (1.8, 5.3) | 106 (48.2, 146.5) | 0.2 (−1.8, 1.7) | 0.05 0.006 |
| 18 | SFR 150 μmol |
[SFN] = 202 μmol/g [GR] = ND |
1.04 μmol | 0.16 (0.15, 0.20) | 94.0 (66.05, 127.03) | 2.31 (0.87, 4.01) | 232.2 (83.8, 433.5) | 1.32 (−0.2, 3.5) | 8.25 0.014 |
| 24 | SFR 150 μmol |
[SFN] = 202 μmol/g [GR] = ND |
1.04 μmol | ND | 60.31 (50.29, 78.38) | 1.6 (0.14, 3.97) | 144.7 (13.1, 361.1) | 0.55 (−1.1, 2.87) | ND 0.009 |
| Day | Beverage | Content and concentration of beverage | TTCAintake |
GRexcreted (μmol/24h) |
SFNmet, excreted (μmol/24h) |
TTCAexcreted (μmol/24h) |
% TTCAexcred/TTCAintake | Delta TTCA |
Delta TTCA/ GRexcreted SFNexcreted |
|---|---|---|---|---|---|---|---|---|---|
| 6 | SFR 150 μmol |
[SFN] = 202 μmol/g [GR] = ND |
1.04 μmol | ND | 103.22 (89.6, 121.7) | 1.68 (0.19, 4.35) | 164.9 (19.1, 418.7) | 0.61 (−0.84, 3.31) | ND −0.006 |
| 12 | SFR 150 μmol |
[SFN] = 202 μmol/g [GR] = ND |
1.04 μmol | ND | 104.8 (54.52, 147.54) | 1.7 (0.2, 3.5) | 164.1 (19.6, 335.3) | 0.67 (−0.8, 2.5) | ND 0.006 |
| 18 | GRR 800 μmol |
[GR] = 329 μmol/g [SFN] = ND |
3.64 μmol | 3.58 (2.68, 4.91) | 33.08 (19.91, 33.62) | 2.6 (0.2, 2.4) | 72.2 (5.5, 144.0) | −1.0 (−3.4, 1.6) | −0.3 −0.03 |
| 24 | GRR 800 μmol |
[GR] = 329 μmol/g [SFN] = ND |
3.64 μmol | 2.46 (1.17, 3.2) | 29.31 (14.59, 47.45) | 2.84 (0.25, 4.73) | 78.9 (6.8, 204.1) | −0.76 (−3.4, 3.7) | −0.3 −0.03 |
3.3. TTCA is present in urine of rats treated with oral sulforaphane
Given the excretion of additional TTCA when volunteers consumed the SFR beverage, it was hypothesized that SFN acts as a precursor to TTCA. Previous studies have detected urinary TTCA following methyl isothiocyanate treatment in rats [20] and it was plausible that sulforaphane treatment may result in a similar outcome. In order to test this, four ACI rats were orally gavaged with 100 μmol/ kg body weight SFN and 24h urine was collected before and after dosing. TTCA was not detected in the SFN that was used to dose the rats (data not shown). Rat urine showed a 45-fold increase in TTCA after SFN administration suggesting that TTCA is formed as a result of biotransformation of SFN (Figure 3). Approximately 0.05% of the total dose of SFN was recovered as TTCA in the rats- lower than the 0.6% observed in humans given a SFR beverage (Table 1).
Figure 3. Rat urinary TTCA significantly increased after sulforaphane treatment.

Twenty-four hour urinary TTCA in ACI rats pre and post-oral gavage with a single dose of 100 μmol/kg. Values are mean ± SEM (n=4). ***p<0.001 (Student’s t-test).
3.4. TTCA does not confer cytoprotective enzyme induction activity in a cell culture model
To determine whether TTCA is a product of glucosinolate metabolism that could contribute biological activity relevant to the glucosinolate-isothiocyanate cell signaling axis, WT and Nrf2-disrupted MEF were treated with increasing concentrations of TTCA. No significant induction of Nqo1 transcripts was observed in either cell type (Figure 4) suggesting that TTCA was not responsible for the enzyme induction activities attributable to isothiocyanates such as SFN. SFN (10 μM) a known inducer of Nrf2 signaling was used as positive control and it showed > 5-fold Nqo1 induction in WT MEF. This effect was attenuated in the Nrf2-disrupted MEF in accord with the Nrf2-dependent activation of transcription reported by us and others [25]. Cell viability after TTCA and SFN treatment of MEF cells was determined by Trypan Blue exclusion assay and cytotoxicity was observed at concentrations > 4 μM TTCA. No cytotoxicity or cell death was observed with SFN at the concentration used (data not shown).
Figure 4. TTCA does not exhibit cytoprotective enzyme induction.

WT and Nrf2-disrupted mouse embryonic fibroblasts were treated with graded doses of TTCA (0.5 – 4 μM) for 20 hours, harvested and analyzed for Nqo1 mRNA levels using RT-PCR. Gapdh was used as the housekeeping control. Sulforaphane (SFN; 10 μM) was used as a positive control. Values are mean ± SEM (n=3). p<0.05. *significantly different compared to vehicle control and **significantly different compared to WT MEF (Anova).
3.5. Comparison of TTCA levels in cruciferous vegetable sources
To evaluate whether TTCA is present in cruciferous vegetables themselves, its levels in 6 different types of cruciferous vegetables, including broccoli sprouts, were quantified (Figure 5). Highest TTCA > lowest TTCA was observed in broccoli sprouts (~0.14 μmol/g), mature broccoli (~0.04 μmol/g), watercress (~0.02 μmol/g), cauliflower (~0.01 μmol/g), cabbage (~0.01 μmol/g), and Brussels sprouts (~0.005 μmol/g). Carrot was used as a non-cruciferous vegetable negative control and its levels of TTCA were much lower (~5-fold lower than the Brussels sprouts). We also showed that ~0.07 μmol/g TTCA is found in Avmacol® tablets that are sourced to contain GR and myrosinase from milled broccoli seeds and freeze-dried broccoli sprouts, respectively. Highest TTCA levels were detected in broccoli sprouts compared to other crucifers. Previous reports have shown that broccoli sprouts have the highest concentration of GR per dry weight and thus yields higher amounts of SFN compared to mature broccoli [27]. The biochemical pathways by which TTCA is formed in cruciferous plants is complex but it is likely that TTCA is formed in all crucifers irrespective of the R group of the isothiocyanate because of an intramolecular cyclization reaction of isothiocyanate metabolite species. This makes TTCA an attractive candidate for a biomarker of all cruciferous vegetables. The amounts are likely dependent on factors that dictate expression of the enzymes involved, structure of starting material and other biochemical conditions. However, in addition to TTCA from the plant, our data highlight that TTCA can also be formed in mammalian cells and contributes to lesser but detectable urinary levels.
Figure 5. TTCA is present in cruciferous vegetables other than broccoli.

The amount of TTCA in 6 different types of cruciferous vegetables and in Avmacol® tablets in μmol per g of dry weight. Vegetables were frozen at −20°C for 24 hours and homogenized. Carrot was used as a negative control. Vegetables were purchased from the same grocery store at 2 different times within a span of 1 month. Values are mean ± SEM (n=15). *p<0.05, compared to carrot (Anova).
6. DISCUSSION
In clinical trials employing specific cruciferous vegetables, isothiocyanates and their metabolites in urine and serum have been used to determine intake and uptake. This approach works only if the starting material being administered comes from a single cruciferous plant controlled for factors such as vegetable type, age, growth conditions, cooking method and composition of the gut microbiome as these parameters have been shown to markedly affect isothiocyanate content [28, 29]. Most importantly, different cruciferous plants produce different predominant species of isothiocyanates and in varying amounts depending on the age of the plant. For example, SFN is largely produced by broccoli due to high GR content [30] whereas high amounts of phenethyl isothiocyanate, from high gluconasturtiin levels are produced in watercress [31]. For clinical studies that utilize multiple types of cruciferous vegetables, it is impractical to analyze several dozen isothiocyanate species and their corresponding urinary metabolites, especially given the fact that there may be some isothiocyanates that have not been reported [12]. Therefore, TTCA which is apparently produced by all crucifers regardless of the identity of the precursor glucosinolate/isothiocyanate provides an opportunity to quantify intake and uptake of all isothiocyanate-producing cruciferous vegetables.
The formation of TTCA in plant cells has been shown previously and seems to encompass an intricate metabolism system that is driven by multiple enzymes as well as GSH [16]. By evaluation of the structure of TTCA, it is likely that it is formed when the cysteine moiety of GSH [32] reacts with isothiocyanate species. It is recognized that plants have a well-evolved stress response mechanism that allows for them to protect themselves against environmental threats [33, 34]. In fact, the glucosinolate-isothiocyanate axis may exist precisely for this purpose in the cruciferous plant [35] – to generate a tightly controlled anti-pathogenic response, given the potent anti-bacterial and anti-fungal properties of isothiocyanates [36]. However, upon formation of these bioactive isothiocyanates, they have to be effectively neutralized and eliminated from plant cells, a process that may include the formation of the inactive metabolite TTCA. Nevertheless, the exact mechanism by which this isothiocyanate cycling or removal occurs in plants is not well understood.
The average percent of 24-hour excretion of TTCA with GRR administration was ~87% compared to ~176% with SFR. Less than 100% excretion is suggestive of some level of retention or protracted terminal phase of elimination of TTCA in human tissue whereas >100% excretion indicates the additional formation of TTCA as a result of pharmacokinetic action. The >100% excretions of TTCA in the SFR group arises from SFN metabolism upon ingestion of the SFR beverage to form additional TTCA. However, in GRR, the amount of SFN that can undergo biotransformation to form TTCA was much lower as is evident from the lower amount of urinary SFN and SFN metabolites (Supplementary data) detected after consuming GRR compared to SFR. Therefore, the majority of TTCA arising from GRR likely originated in the plant material whereas in SFR, even though a large majority of the urinary TTCA was sourced from the plant, some, albeit low amounts were attributable to SFN metabolism in the liver, kidneys and other organs. This notion was confirmed in the rat study where elevated TTCA was observed in rats after being administered 100 μmol/kg SFN alone. All of the urinary TTCA of rats originated after ingestion as no TTCA was observed in the SFN solution. However, in human subjects, if SFN was indeed biotransformed to TTCA upon ingestion, we have to look at unmetabolized SFN and SFN metabolites that were excreted in the urine as a guide for the source of TTCA. These levels were markedly higher in SFR compared to GRR suggesting that some, albeit low amounts of TTCA can be formed by SFN biotransformation. There was an inefficient conversion of glucosinolates to isothiocyanates by the gut microbiome [28] as only 5% of the administered GRR dose was recovered as SFN metabolites whereas 70% of the administered SFR dose was recovered. Given that TTCA can be produced from glucosinolate/ isothiocyanate groups other than GR/SFN, it is also possible that the myrosinase treatment performed to produce the SFR powder may have catalyzed the formation of TTCA from these other species.
Although participants in our clinical trial were instructed not to consume green leafy vegetables to limit the exposure to dietary isothiocyanates, it is likely that they consumed other types of vegetables that may produce some low amounts of isothiocyanates. While SFR provided an excellent proof of principle control for our study, it is unlikely that in general population nutritional assessment studies, exposures that mimic such high levels of direct isothiocyanate intakes will be encountered. The GRR group on the other hand may represent TTCA levels after consuming a large serving size of fully or partially cooked cruciferous vegetables. TTCA levels that correlate to nutritionally pragmatic amounts of crucifers should be measured in future feeding studies. Perhaps, these studies will also shed light on why certain crucifers, such as broccoli, produce more TTCA and whether certain precursor isothiocyanates possess a biochemical advantage to form more TTCA compared to others. Whether factors that govern the breakdown of glucosinolates (such as plant age, type, growth conditions) can also alter TTCA levels warrants exploration. Furthermore, it is important to recall that the genetic diversity within the cruciferous vegetable family will invariably result in some differences in the amount of metabolites produced so some crucifers will produce more TTCA than others. Nevertheless, our studies and analyses indicate that TTCA is a generic molecule that is formed during isothiocyanate metabolism, likely in all crucifers. This uniquely allows a bypass to the challenge of quantifying dozens of specific isothiocyanate metabolites in order to accurately measure intake and uptake of various crucifers. While this study has identified TTCA as a potentially useful biomarker of crucifers, to establish its clinical and population research utility, future studies should track how urinary TTCA levels match dietary intake information collected from food frequency questionnaires and other standard intake assessment tools.
Data from the National Health and Nutrition Examination Survey (NHANES) showed that the TTCA concentration in spot urines in the general U.S. population was similar to the baseline TTCA levels seen in our cohort. Furthermore, levels of TTCA observed in our study after broccoli beverage consumption were within the range of those reported after CS2 exposure [26], thus dietary intake should be considered as a confounder in CS2 exposure studies. Non-anthropogenic production of CS2 in Brassica plants in response to stresses has been described [37]. However, it is currently not known how exactly CS2 is involved in glucosinolate metabolism in these types of plants. Furthermore, enhanced urinary TTCA has been detected in populations exposed to the fungicide captan [22] and alcohol [38]. Future studies should also address the possible confounding role of such exposures on urinary TTCA arising from crucifer intake.
CONCLUSIONS
In this study, we measured TTCA levels excreted in urine in a randomized crossover clinical trial where 50 participants were administered two types of broccoli sprout-derived beverages during two consecutive 7-day feeding periods over a course of 24 days. We observed significantly increased urinary TTCA (~30–60 fold compared to run-in) 12 hours post intake of both GRR and SFR beverages. Further measurements also showed that much of the TTCA detected in the human urine originated in the broccoli beverages themselves, although in beverages with high SFN content, some additional TTCA is formed as a result of SFN biotransformation. This was confirmed by rats orally gavaged with SFN showing increased TTCA levels in the urine. We also showed that TTCA does not induce Nrf2-mediated cytoprotective enzyme expression in vitro. Furthermore, we were able to detect TTCA in extracts of all the types of cruciferous vegetables tested as well as in broccoli-based Avmacol® tablets. Collectively, these data suggest that TTCA is formed as a metabolite of isothiocyanates and has potential use as a biomarker of cruciferous vegetable intake in clinical trials and in nutritional epidemiological studies.
Supplementary Material
Acknowledgements
The authors would like to thank the researchers and participants of the crossover clinical trial and especially acknowledge Patricia Egner (Johns Hopkins University) for assistance with sample management, Steven J. Mullett (Health Sciences Metabolomics and Lipidomics Core, University of Pittsburgh) for technical guidance and Krishna Pandravada (Carnegie Mellon University) for designing additional graphic assets.
Sources of Support: Breast Cancer Research Foundation (TWK), National Institutes of Health R35CA197222 (TWK), R21AI122071 (SGW), R01GM125944 (FJS), R01DK112854 (FJS), AHA17GRN33660955 (FJS) and Chinese Medicine Science and Technology Research Foundation, Shandong Academy for Chinese Medicine 2015 – 317 (XMC).
Abbreviations:
- GR
glucoraphanin
- GRR
glucoraphanin-rich
- SFN
sulforaphane
- SFR
sulforaphane-rich
- TTCA
2-thiothiazolidine-4-carboxylic acid
- LC-MS/MS
liquid chromatography mass spectrometry
- Nrf2
Nuclear factor (erythroid-derived 2)-like 2
- Nqo1
NADP(H):quinone oxidoreductase 1
- Gapdh
Glyceraldehyde 3-phosphate dehydrogenase
Footnotes
Clinical Trial Registry Number: 01008826
Conflicts of interest
None to disclose.
References
- 1.Zhang X, Shu XO, Xiang YB, Yang G, Li H, Gao J, Cai H, Gao YT, Zheng W. Cruciferous vegetable consumption is associated with a reduced risk of total and cardiovascular disease mortality. Am J Clin Nutr 2011;94:240–246. [DOI] [PMC free article] [PubMed] [Google Scholar]
- 2.Armah CN, Derdemezis C, Traka MH, Dainty JR, Doleman JF, Saha S, Leung W, Potter JF, Lovegrove JA, Mithen RF. Diet rich in high glucoraphanin broccoli reduces plasma LDL cholesterol: Evidence from randomised controlled trials. Mol Nutr Food Res 2015;59:918–926. [DOI] [PMC free article] [PubMed] [Google Scholar]
- 3.Parsons JK, Pierce JP, Natarajan L, Newman VA, Barbier L, Mohler J, Rock CL, Heath DD, Guru K, Jameson MB, Li H, Mirheydar H, Holmes MA, Marshall J. A randomized pilot trial of dietary modification for the chemoprevention of noninvasive bladder cancer: the dietary intervention in bladder cancer study. Cancer Prev Res (Phila) 2013;6:971–978. [DOI] [PMC free article] [PubMed] [Google Scholar]
- 4.Zhang Z, Bergan R, Shannon J, Slatore CG, Bobe G, Takata Y. The role of cruciferous vegetables and isothiocyanates for lung cancer prevention: current status, challenges, and future research directions. Mol Nutr Food Res 2018;e1700936. [DOI] [PubMed] [Google Scholar]
- 5.Shapiro TA, Fahey JW, Wade KL, Stephenson KK, Talalay P. Chemoprotective glucosinolates and isothiocyanates of broccoli sprouts: metabolism and excretion in humans. Cancer Epidemiol Biomarkers Prev 2001;10:501–508. [PubMed] [Google Scholar]
- 6.Kensler TW, Egner PA, Agyeman AS, Visvanathan K, Groopman JD, Chen JG, Chen TY, Fahey JW, Talalay P. Keap1-nrf2 signaling: a target for cancer prevention by sulforaphane. Top Curr Chem 2013;329:163–177. [DOI] [PMC free article] [PubMed] [Google Scholar]
- 7.Yang L, Palliyaguru DL, Kensler TW. Frugal chemoprevention: targeting Nrf2 with foods rich in sulforaphane. Semin Oncol 2016;43:146–153. [DOI] [PMC free article] [PubMed] [Google Scholar]
- 8.O’Mealey GB, Berry WL, Plafker SM. Sulforaphane is a Nrf2-independent inhibitor of mitochondrial fission. Redox Biol 2017;11:103–110. [DOI] [PMC free article] [PubMed] [Google Scholar]
- 9.Yamamoto M, Kensler TW, Motohashi H. The KEAP1-NRF2 System: a thiol-based sensor-effector apparatus for maintaining redox homeostasis. Physiol Rev 2018;98:1169–1203. [DOI] [PMC free article] [PubMed] [Google Scholar]
- 10.Egner PA, Chen JG, Wang JB, Wu Y, Sun Y, Lu JH, Zhu J, Zhang YH, Chen YS, Friesen MD, Jacobson LP, Munoz A, Ng D, Qian GS, Zhu YR, Chen TY, Botting NP, Zhang Q, Fahey JW, Talalay P, Groopman JD, Kensler TW. Bioavailability of sulforaphane from two broccoli sprout beverages: results of a short-term, cross-over clinical trial in Qidong, China. Cancer Prev Res (Phila) 2011;4:384–395. [DOI] [PMC free article] [PubMed] [Google Scholar]
- 11.Fujioka N, Ransom BW, Carmella SG, Upadhyaya P, Lindgren BR, Roper-Batker A, Hatsukami DK, Fritz VA, Rohwer C, Hecht SS. Harnessing the power of cruciferous vegetables: developing a biomarker for brassica vegetable consumption using urinary 3,3’-diindolylmethane. Cancer Prev Res (Phila) 2016;9:788–793. [DOI] [PMC free article] [PubMed] [Google Scholar]
- 12.Fahey JW, Zalcmann AT, Talalay P. The chemical diversity and distribution of glucosinolates and isothiocyanates among plants. Phytochemistry 2001;56:5–51. [DOI] [PubMed] [Google Scholar]
- 13.Edmands WM, Beckonert OP, Stella C, Campbell A, Lake BG, Lindon JC, Holmes E, Gooderham NJ. Identification of human urinary biomarkers of cruciferous vegetable consumption by metabonomic profiling. J Proteome Res 2011;10:4513–4521. [DOI] [PubMed] [Google Scholar]
- 14.Edmands WMB, Gooderham NJ, Holmes E, Mit. S-Methyl-L-cysteine sulphoxide: the Cinderella phytochemical? Toxicol Res 2013. [Google Scholar]
- 15.Zhang Y, Cho CG, Posner GH, Talalay P. Spectroscopic quantitation of organic isothiocyanates by cyclocondensation with vicinal dithiols. Anal Biochem 1992;205:100–107. [DOI] [PubMed] [Google Scholar]
- 16.Bednarek P, Pislewska-Bednarek M, Svatos A, Schneider B, Doubsky J, Mansurova M, Humphry M, Consonni C, Panstruga R, Sanchez-Vallet A, Molina A, Schulze-Lefert P. A glucosinolate metabolism pathway in living plant cells mediates broad-spectrum antifungal defense. Science 2009;323:101–106. [DOI] [PubMed] [Google Scholar]
- 17.Bednarek P, Schneider B, Svatos A, Oldham NJ, Hahlbrock K. Structural complexity, differential response to infection, and tissue specificity of indolic and phenylpropanoid secondary metabolism in Arabidopsis roots. Plant Physiol 2005;138:1058–1070. [DOI] [PMC free article] [PubMed] [Google Scholar]
- 18.Simon P, Nicot T, Dieudonne M. Dietary habits, a non-negligible source of 2-thiothiazolidine-4-carboxylic acid and possible overestimation of carbon disulfide exposure. Int Arch Occup Environ Health 1994;66:85–90. [DOI] [PubMed] [Google Scholar]
- 19.Kivisto H TTCA measurements in biomonitoring of low-level exposure to carbon disulphide. Int Arch Occup Environ Health 2000;73:263–269. [DOI] [PubMed] [Google Scholar]
- 20.Amarnath V, Amarnath K, Graham DG, Qi Q, Valentine H, Zhang J, Valentine WM. Identification of a new urinary metabolite of carbon disulfide using an improved method for the determination of 2-thioxothiazolidine-4-carboxylic acid. Chem Res Toxicol 2001;14:1277–1283. [DOI] [PubMed] [Google Scholar]
- 21.Kensler TW, Ng D, Carmella SG, Chen M, Jacobson LP, Munoz A, Egner PA, Chen JG, Qian GS, Chen TY, Fahey JW, Talalay P, Groopman JD, Yuan JM, Hecht SS. Modulation of the metabolism of airborne pollutants by glucoraphanin-rich and sulforaphane-rich broccoli sprout beverages in Qidong, China. Carcinogenesis 2012;33:101–107. [DOI] [PMC free article] [PubMed] [Google Scholar]
- 22.Krieger RI, Thongsinthusak T. Captan metabolism in humans yields two biomarkers, tetrahydrophthalimide (THPI) and thiazolidine-2-thione-4-carboxylic acid (TTCA) in urine. Drug Chem Toxicol 1993;16:207–225. [DOI] [PubMed] [Google Scholar]
- 23.Wakabayashi N, Dinkova-Kostova AT, Holtzclaw WD, Kang MI, Kobayashi A, Yamamoto M, Kensler TW, Talalay P. Protection against electrophile and oxidant stress by induction of the phase 2 response: fate of cysteines of the Keap1 sensor modified by inducers. Proc Natl Acad Sci U S A 2004;101:2040–2045. [DOI] [PMC free article] [PubMed] [Google Scholar]
- 24.Pfaffl MW. A new mathematical model for relative quantification in real-time RT-PCR. Nucleic Acids Res 2001;29:e45. [DOI] [PMC free article] [PubMed] [Google Scholar]
- 25.Palliyaguru DL, Chartoumpekis DV, Wakabayashi N, Skoko JJ, Yagishita Y, Singh SV, Kensler TW. Withaferin A induces Nrf2-dependent protection against liver injury: Role of Keap1-independent mechanisms. Free Radic Biol Med 2016;101:116–128. [DOI] [PMC free article] [PubMed] [Google Scholar]
- 26.Vermeulen R, Jonsson BA, Lindh CH, Kromhout H. Biological monitoring of carbon disulphide and phthalate exposure in the contemporary rubber industry. Int Arch Occup Environ Health 2005;78:663–669. [DOI] [PubMed] [Google Scholar]
- 27.Fahey JW, Zhang Y, Talalay P. Broccoli sprouts: an exceptionally rich source of inducers of enzymes that protect against chemical carcinogens. Proc Natl Acad Sci U S A 1997;94:10367–10372. [DOI] [PMC free article] [PubMed] [Google Scholar]
- 28.Oliviero T, Verkerk R, Vermeulen M, Dekker M. In vivo formation and bioavailability of isothiocyanates from glucosinolates in broccoli as affected by processing conditions. Mol Nutr Food Res 2014;58:1447–1456. [DOI] [PubMed] [Google Scholar]
- 29.Rungapamestry V, Duncan AJ, Fuller Z, Ratcliffe B. Effect of meal composition and cooking duration on the fate of sulforaphane following consumption of broccoli by healthy human subjects. Br J Nutr 2007;97:644–652. [DOI] [PubMed] [Google Scholar]
- 30.Kushad MM, Brown AF, Kurilich AC, Juvik JA, Klein BP, Wallig MA, Jeffery EH. Variation of glucosinolates in vegetable crops of Brassica oleracea. J Agric Food Chem 1999;47:1541–1548. [DOI] [PubMed] [Google Scholar]
- 31.Engelen-Eigles G, Holden G, Cohen JD, Gardner G. The effect of temperature, photoperiod, and light quality on gluconasturtiin concentration in watercress (Nasturtium officinale R. Br.). J Agric Food Chem 2006;54:328–334. [DOI] [PubMed] [Google Scholar]
- 32.Johnson DJ, Graham DG, Amarnath V, Amarnath K, Valentine WM. The measurement of 2-thiothiazolidine-4-carboxylic acid as an index of the in vivo release of CS2 by dithiocarbamates. Chem Res Toxicol 1996;9:910–916. [DOI] [PubMed] [Google Scholar]
- 33.Michaletti A, Naghavi MR, Toorchi M, Zolla L, Rinalducci S. Metabolomics and proteomics reveal drought-stress responses of leaf tissues from spring-wheat. Sci Rep 2018;8:5710. [DOI] [PMC free article] [PubMed] [Google Scholar]
- 34.Takahashi F, Suzuki T, Osakabe Y, Betsuyaku S, Kondo Y, Dohmae N, Fukuda H, Yamaguchi-Shinozaki K, Shinozaki K. A small peptide modulates stomatal control via abscisic acid in long-distance signalling. Nature 2018;556:235–238. [DOI] [PubMed] [Google Scholar]
- 35.Pislewska-Bednarek M, Nakano RT, Hiruma K, Pastorczyk M, Sanchez-Vallet A, Singkaravanit-Ogawa S, Ciesiolka D, Takano Y, Molina A, Schulze-Lefert P, Bednarek P. Glutathione Transferase U13 Functions in Pathogen-Triggered Glucosinolate Metabolism. Plant Physiol 2018;176:538–551. [DOI] [PMC free article] [PubMed] [Google Scholar]
- 36.Palliyaguru DL, Yuan JM, Kensler TW, Fahey JW. Isothiocyanates: translating the power of plants to people. Mol Nutr Food Res 2018;62(18):e1700965. [DOI] [PMC free article] [PubMed] [Google Scholar]
- 37.Perz RC, van LH, Schwack W. CS(2) blinds in Brassica crops: false positive results in the dithiocarbamate residue analysis by the acid digestion method. J Agric Food Chem 2000;48:792–796. [DOI] [PubMed] [Google Scholar]
- 38.Jian L Alcohol and urinary 2-thiothiazolidine-4-carboxylic acid. Toxicol Lett 2002;134:277–283. [DOI] [PubMed] [Google Scholar]
Associated Data
This section collects any data citations, data availability statements, or supplementary materials included in this article.