

Abstract
Objective
Narcolepsy is a sleep disorder characterized in humans by excessive daytime sleepiness and cataplexy. Greater than fifty percent of narcoleptic patients have an onset of symptoms prior to the age of 18. Current general agreement considers the loss of hypothalamic hypocretin (orexin) neurons as the direct cause of narcolepsy notably cataplexy. To assess whether brain histamine (HA) is also involved, we quantified the cerebrospinal fluid (CSF) levels of HA and tele‐methylhistamine (t‐MeHA), the direct metabolite of HA between children with orexin‐deficient narcolepsy type 1 (NT1) and controls.
Methods
We included 24 children with NT1 (12.3 ± 3.6 years, 11 boys, 83% cataplexy, 100% HLA DQB1*06:02) and 21 control children (11.2 ± 4.2 years, 10 boys). CSF HA and t‐MeHA were measured in all subjects using a highly sensitive liquid chromatographic‐electrospray/tandem mass spectrometric assay. CSF hypocretin‐1 values were determined in the narcoleptic patients.
Results
Compared with the controls, NT1 children had higher CSF HA levels (771 vs 234 pmol/L, P < 0.001), lower t‐MeHA levels (879 vs 1924 pmol/L, P < 0.001), and lower t‐MeHA/HA ratios (1.1 vs 8.2, P < 0.001). NT1 patients had higher BMI z‐scores (2.7 ± 1.6 vs 1.0 ± 2.3, P = 0.006) and were more often obese (58% vs 29%, P = 0.05) than the controls. Multivariable analyses including age, gender, and BMI z‐score showed a significant decrease in CSF HA levels when the BMI z‐score increased in patients (P = 0.007) but not in the controls. No association was found between CSF HA, t‐MeHA, disease duration, age at disease onset, the presence of cataplexy, lumbar puncture timing, and CSF hypocretin levels.
Conclusions
Narcolepsy type 1 children had a higher CSF HA level together with a lower t‐MeHA level leading to a significant decrease in the t‐MeHA/HA ratios. These results suggest a decreased HA turnover and an impairment of histaminergic neurotransmission in narcoleptic children and support the use of a histaminergic therapy in the treatment against narcolepsy.
Keywords: histamine, hypocretin (orexin), narcolepsy, pediatrics, sleep
1. INTRODUCTION
Narcolepsy type 1 (NT1) (also called hypocretin deficiency syndrome or narcolepsy with cataplexy) is a neurological disorder characterized by excessive daytime sleepiness (EDS), cataplexy (sudden loss of muscle tone triggered by emotions), hallucinations, sleep paralysis, impaired nighttime sleep, and short latency to rapid eye movement (REM) sleep after sleep onset.1 NT1 is caused by a deficiency of hypocretin (orexin) neurons located in the dorsolateral hypothalamus likely secondary to an autoimmune destruction.2
Histamine (HA) neurons, another major component of the wake‐promoting systems,3 are located in the tuberomammillary nucleus (TMN) of the posterior hypothalamus and project to various brain regions involved in sleep‐wake regulation. HA neurons interact anatomically and functionally with hypocretin neurons.4 Recent reports on a possible increase in HA cells number in narcoleptic patients also support the importance of the HA/Hcrt interaction in the pathogenesis of narcolepsy.5, 6 Moreover, a few studies have reported low CSF HA levels in patients affected with central disorders of hypersomnolence7, 8, 9 especially in hypocretin‐deficient and nonmedicated subjects.8, 9 However, Dauvilliers et al found that CSF HA and tele‐methylhistamine (t‐MeHA), its sole and direct metabolite, did not significantly differ between patients with narcolepsy‐cataplexy and other etiologies of non‐hypocretin‐1‐deficient central hypersomnias.10, 11 Thus, the current data regarding an involvement of HA in human narcolepsy remain conflicting.
More than half of narcoleptic patients have an onset of symptoms prior to the age of 18.12, 13 Narcolepsy in children is usually characterized by prominent sleepiness and more spontaneous than emotionally triggered cataplexy than in adulthood.12, 14 Obesity has been reported in 30% of adult narcoleptic patients,15, 16 whereas it occurs in more than 50% of narcoleptic children17, 18 with increasing body weight manifested in the early course of the disease.19, 20 These children have also high prevalence of metabolic syndrome and precocious puberty reflecting broadly based hypothalamic abnormalities.18, 20 In this context, investigating HA neurotransmission in narcoleptic children appears to constitute an interesting avenue and would allow detection of possible neurochemical changes close to disease onset.21
In order to clarify the involvement of HA in narcolepsy, we evaluated HA neurotransmission in narcoleptic children with hypocretin deficiency (NT1) and control children (C) by (a) comparing their CSF levels of HA and t‐MeHA, the direct metabolite of HA and marker of the HA turnover.22, 23 Moreover, the ratio between t‐MeHA and HA was used to evaluate the dynamics of the HA transmission, (b) analyzing the effects of age, gender, BMI z‐score, CSF collection time for both groups, and (c) investigating possible correlations between disease duration, disease onset, presence of cataplexy, medication intake, CSF hypocretin‐1, HA, and t‐MeHA levels in narcoleptic patients.
2. PATIENTS AND METHODS
2.1. Subjects
All narcoleptic children were seen in the national reference centers for narcolepsy in Lyon (n = 13) and in Montpellier (n = 11) and included in a larger study of the clinical and polygraphic aspects of narcolepsy (research program: NARCOBANK).17 This study was approved by the local ethics committees. Parents signed the written consent form and the children were informed and signed the consent if they wished to.
All patients met the criteria for narcolepsy type 1(1): (a) complaints of EDS for at least 3 months; and (b) presence of clear‐cut cataplexy and mean sleep latency during multiple sleep latency tests (MSLT) of fewer than 8 minutes and two or more sleep‐onset REM periods during MSLT and night PSG; or (c) CSF hypocretin‐1 levels below 110 pg/mL. All narcoleptic patients were CSF hypocretin‐1‐deficient and all were positive for HLA‐ DQB1*06:02. None had secondary narcolepsy; (d) as we have reported previously, there are very few narcoleptic children in our cohort presenting obstructive sleep apnea syndrome.17 In this study, the median obstructive apnea/hypopnea index (OAHI) was 0.6/hours (range from 0 to 6.4/hours). Only one child had a OAHI >5/hours.
Diagnosis was done after a complete investigation already reported elsewhere17 including questionnaires concerning daytime sleepiness (Adapted Epworth Sleepiness Score [AESS]24 with pathological scores >10; severity of cataplexy25); anthropometric measurements: Obesity was defined by a BMI greater than the 97th percentile for age and sex.26 BMI z‐scores representing a measure of weight, adjusted for height, sex, and age, relative to a smoothed reference distribution,27 were computed in patients and control children; and polysomnography assessment (night polysomnographic [PSG] recordings were followed by multiple sleep latency tests [MSLT]). Sleep stages, arousals, and respiratory events were scored visually according to standard pediatric criteria.28
2.2. Control subjects
A total of 21 CSF samples (one CSF sample for each control subject) were obtained by lumbar puncture (LP) at the Hôpital Femme Mère Enfant in Lyon, France. We selected all the CSF from children with normal laboratory results of their CSF and blood at the time of the LP: clear CSF, leukocytes count <3 mega/L, erythrocyte count <100 mega/L, protein between 0.15 and 0.36 g/L, and glucose between 2.8 and 3.6 mmol/L. The indications for LP were on the one hand in the emergency room (ER), suspicion of encephalomeningitis with minor clinical abnormalities such as headaches (n = 3), visual symptoms (diplopia, scotoma…; n = 5) with or without fever (fever rectal temperature >38.0°C; n = 3), facial paralysis (n = 1), paresthesia (n = 1), arthritis (n = 1), and cranial trauma (n = 1). No CSF inflammatory etiologies were found. After spontaneous resolution of clinical symptoms and complaints, the children were discharged from the hospital and sent home. The other indications of LP went from the neurological department: delay in neurological development (n = 1), epileptic encephalopathy (n = 1), epilepsy (n = 3), muscular amyotrophia (n = 1), moya‐moya suspicion (not confirmed; n = 1), postencephalitis herpes (n = 1), and ocular myasthenia (n = 1).
Following LP, a spare tube was frozen in the event that further tests would be necessary. Parents granted permission to use the frozen CSF for research purposes.
2.3. Measurement of CSF Hypocretin‐1, HA, and t‐MeHA Levels
Lumbar puncture was performed in the narcoleptic patients in order to measure CSF hypocretin‐1, HA, and t‐MeHA levels. LP was done during the diagnosis procedure (Montpellier) or a few weeks after the diagnosis procedure (Lyon). CSF samples were collected between 11 AM and 6 PM and stored immediately at −80°C until use. There were two samples—one for CSF hypocretin‐1 and the other for HA and t‐MeHA measurements. These samples were thawed once. Blood contamination was visually checked, and CSF samples with abnormal coloring were excluded from the study. All measurements were performed blind of diagnosis. CSF hypocretin‐1, HA, and t‐MeHA results of patients from Montpellier were reported in a previous work.11
Cerebrospinal fluid hypocretin‐1 was determined in all narcoleptic patients in the Montpellier reference center as previously described.29 CSF hypocretin‐1 values were only determined in the 24 narcoleptic patients: 12 were drug‐free while the 12 others had stopped their treatment at least 3 days before the LP (modafinil, n = 6; methylphenidate, n = 4; mazindol, n = 1; Xyrem, n = 1).
Cerebrospinal fluid samples were sent on dry ice to Bioprojet‐Biotech, Saint Gregoire‐France for HA and t‐MeHA measurements. The method previously described involves derivatization of primary amines using 4‐bromobenzenesulfonyl chloride and subsequent analysis by reversed‐phase liquid chromatography with mass spectrometry detection.10, 11 The assay was linear in the concentration range of 50‐5000 pmol/L for each amine (5.5‐555 pg/mL for HA and 6.25‐625 pg/mL for t‐MeHA). CSF HA and t‐MeHA levels were determined in all narcoleptic children (n = 24) and controls (n = 21). Intraassay variability was <11.0% over the tested concentration ranges. Blood contaminated samples were rejected from the measurement.
2.4. Statistical analyses
Biological measures (HA, t‐MeHA, t‐MeHA/HA ratio, and hypocretin) were log base 2 transformed to fit assumptions of parametric statistical tests. Delay from disease onset was dichotomized with the median of the distribution as threshold (ie, 2 years). Descriptive analyses were performed using chi‐square and t tests. Fisher's exact tests and Bonferroni corrections were performed when needed. Multivariable case‐control analyses were performed using logistic regressions successively for HA and t‐MeHA concentrations and the t‐MeHA/HA ratio. These models included age, gender, BMI z‐score, and the significant variables in bivariate analyses. Due to the log base 2 transformation, odds ratio for biological measures should be interpreted as the odds for a 2‐fold increase in the biological value. Multivariable linear regression analyses were performed among cases only and considered three models. Model M1 included the same variables as the case‐control logistic regressions; Model M2 considered Model M1 and treatment intake; and Model M3 included Model M2 and the center. For these models, betas provided in the tables should be interpreted as the proportion of variation of the biological measure for 1 unit of the covariate. Significance was set at P < 0.05. Analyses were performed using SAS (SAS 9.4, SAS Institute Inc, Cary, NC, USA).
3. RESULTS
3.1. Descriptive analyses
Table 1 summarizes the characteristics of narcoleptic children and controls. In narcoleptic patients, the first symptom at onset was EDS. Other symptoms were cataplexy (83%), hypnagogic hallucinations (71%), and sleep paralysis (33%). Forty‐six percent were obese, and 100% were HLA DQB1*0602‐positive. The results of the case‐control descriptive analyses are also shown in Table 1 (see also Figure 1). The cases had higher BMI z‐scores than the controls (2.7 vs 1.0 P = 0.006). They also had higher CSF HA levels (771 vs 234 pmol/l, P = 0.0002) but lower CSF t‐MeHA levels (879 vs 1924 pmol/l, P = 0.0009). The t‐MeHA/HA ratio was lower in the cases than in the controls (1.1 vs 8.2, P < 10−4). We also compared the control subjects with and without neurological pathologies, and we did not find a difference in HA (P = 0.68), t‐MeHA levels (P = 0.32), and t‐MeHA/HA ratio (P = 0.85).
Table 1.
Characteristics of children with hypocretin‐deficient narcolepsy (NT1) and controls
| NT1 Children | Controls | P | |
|---|---|---|---|
| n (%) | 24 | 21 | |
| Male, n (%) | 11 (46) | 10 (48) | 0.90 |
| Age at disease onset, years | 11 (4‐17) | ||
| At diagnosis | |||
| Age at diagnosis, years | 12 (6‐18) | ||
| Body mass index (BMI), kg/m2 | 21.5 (16.8‐28.8) | ||
| BMI z‐score | 2.7 (0.15‐5.11) | ||
| Obesity, n (%) | 11 (46) | ||
| AESS (0‐24) | 17.5 (13‐24) | ||
| Cataplexy, n (%) | 20 (83) | ||
| Hallucinations, n (%) | 17 (71) | ||
| Sleep paralysis, n (%) | 8 (33) | ||
| HLA DQB1*0602 | 24 (100) | ||
| MSLT: Mean sleep latency, min | 2.3 (0.6‐10) | ||
| MSLT: number of sleep onset in REM sleep periods, n | 4 (3‐5) | ||
| At lumbar puncture (LP) | |||
| Age at LP, years | 13 (5.5‐18) | 12 (4‐18) | 0.33 |
| Delay from onset disease and LP, months | 17 (1‐67) | ||
| Delay from PSG diagnosis and LP, months | 1 (0‐31) | ||
| BMI z‐score | 2.57 (0.83‐7.04) | 1.3 (‐2.2‐6.1) | 0.006 |
| Obese, n (%) | 14 (58) | 6 (29) | 0.05 |
| CSF hypocretin‐1, pg/mL | 9 (0‐90) | ||
| CSF HA levels, pmol/L | 775 (190‐3335) | 269 (11‐1597) | <0.001 |
| 771 (95% CI: 385‐1541) | 234 (95% CI: 71‐771) | ||
| CSF t‐MHA levels, pmol/L | 841 (185‐3471) | 2159 (498‐7413) | <0.001 |
| 879 (95% CI: 437‐1771) | 1924 (95% CI: 898‐4124) | ||
| T‐MeHA/HA | 1.2 (0.22‐5.80) | 8.2 (1.3‐133) | <0.001 |
| 1.14 (95% CI: 0.5‐2.8) | 8.17 (95% CI: 2.1‐31.3) | ||
Comparisons performed between narcoleptic and control children. Data are presented in number (N), percent (%), in mean and standard deviation (SD) or 95% confidence intervals (95% CI) calculated after reverse log base 2 transformation.
BMI, body mass index; CSF, cerebral spinal fluid; HA, histamine; HLA, human leukocyte antigen genotyping; NT1, hypocretin‐deficient narcolepsy; t‐MeHA, tele‐methylhistamine.
Figure 1.
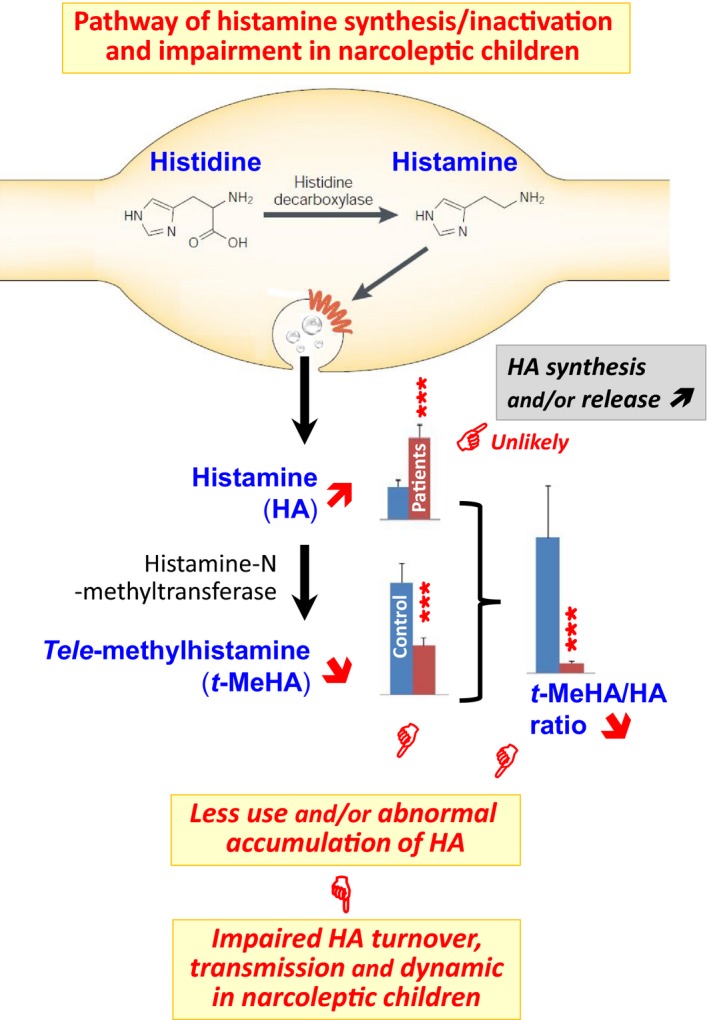
Schematic graphics illustrating the pathway of histamine (HA) synthesis, release, and inactivation and our interpretation on the changes in the CSF HA and tele‐methylhistamine (t‐MeHA) levels seen with the narcoleptic children. HA is synthetized solely by histidine decarboxylase (HDC) and inactivated, once released from terminals, by HA‐N‐methyltransferase producing the direct metabolite t‐MeHA. Bar presentation of HA and t‐MeHA levels is based on the values given in Table 1. Our narcoleptic children showed a marked increase in CSF HA, which unlikely indicates an upregulation of HA synthesis or/and release because of an accompanied marked decrease in t‐MeHA. This concomitant increase in HA and decrease in t‐MeHA lead to a remarkable decrease in the t‐MeHA/HA ratio (7.2 folds), indicating an abnormal accumulation or impaired utilization of HA. On a more functional level, our observations strongly suggest that HA neurotransmission is prominently affected in narcoleptic children. The confirmation of such impaired dynamic of the brain HA system as a causative agent in narcolepsy awaits further development of direct neurochemical monitoring of HA transmission in the human brain
3.2. Multivariable analyses
Multivariable case‐control analyses showed a significant increase in CSF HA in the cases compared to the controls after adjustment for gender, age, and BMI z‐score (Table [Link], [Link]). A significant decrease in CSF HA levels was found when BMI z‐score increased among cases in all models (P ≤ 0.03), while this relation was not observed in the controls (P = 0.31, Model M1; Table 2). T‐MeHA levels and the t‐MeHA/HA ratio were significantly lower in the cases than in the controls after adjustment for gender, age, and BMI z‐score. Adjustment for the center was not possible since children controls came from Lyon.
Table 2.
Multivariable linear analyses considering 3 models
| Controls | Cases | |||||||
|---|---|---|---|---|---|---|---|---|
| M1 | M1 | M2 | M3 | |||||
| Beta (95% CI) | P‐value | Beta (95% CI) | P‐value | Beta (95% CI) | P‐value | Beta (95% CI) | P‐value | |
| CSF HA | ||||||||
| BMI z‐score | 1.14 (1.00‐1.30) | 0.31 | 0.76 (0.70‐0.84) | 0.007 | 0.79 (0.72‐0.86) | 0.02 | 0.82 (0.75‐0.90) | 0.03 |
| Age (y) | 0.91 (0.85‐0.98) | 0.19 | 0.91 (0.88‐0.95) | 0.03 | 0.92 (0.89‐0.96) | 0.09 | 0.92 (0.89‐0.96) | 0.05 |
| Gender (Boy) | 0.82 (0.47‐1.43) | 0.72 | 0.70 (0.54‐0.91) | 0.20 | 0.74 (0.57‐0.97) | 0.29 | 0.75 (0.58‐0.96) | 0.26 |
| Treatment | ‐ | ‐ | ‐ | 0.79 (0.60‐1.03) | 0.40 | 1.13 (0.84‐1.52) | 0.69 | |
| Center | ‐ | ‐ | ‐ | ‐ | 1.88 (1.40‐2.51) | 0.05 | ||
| CSF t‐MeHA | ||||||||
| BMI z‐score | 1.20 (1.13‐1.27) | 0.006 | 0.86 (0.78‐0.95) | 0.15 | 0.91 (0.83‐1.01) | 0.34 | 0.93 (0.84‐1.03) | 0.47 |
| Age (y) | 0.90 (0.88‐0.93) | 0.005 | 0.94 (0.90‐0.98) | 0.15 | 0.96 (0.92‐1.00) | 0.43 | 0.96 (0.92‐1.00) | 0.41 |
| Gender (Boy) | 1.75 (1.35‐2.27) | 0.05 | 1.35 (1.01‐1.80) | 0.31 | 1.51 (1.14‐1.99) | 0.17 | 1.51 (1.14‐1.99) | 0.17 |
| Treatment | ‐ | ‐ | 0.63 (0.47‐0.83) | 0.11 | 0.76 (0.54‐1.06) | 0.42 | ||
| Center | ‐ | ‐ | ‐ | 1.40 (1.01‐1.95) | 0.32 | |||
| CSF t‐MeHA/HA | ||||||||
| BMI z‐score | 1.05 (0.90‐1.22) | 0.73 | 1.13 (0.99‐1.28) | 0.35 | 1.16 (1.01‐1.34) | 0.30 | 1.14 (0.99‐1.31) | 0.38 |
| Age (y) | 0.99 (0.91‐1.07) | 0.89 | 1.03 (0.97‐1.09) | 0.63 | 1.04 (0.98‐1.11) | 0.51 | 1.04 (0.98‐1.11) | 0.50 |
| Gender (Boy) | 2.14 (1.12‐4.10) | 0.26 | 1.92 (1.31‐2.80) | 0.11 | 2.01 (1.35‐3.00) | 0.10 | 2.01 (1.34‐3.03) | 0.10 |
| Treatment | ‐ | ‐ | ‐ | ‐ | 0.79 (0.53‐1.19) | 0.57 | 0.67 (0.41‐1.09) | 0.42 |
| Center | ‐ | ‐ | ‐ | ‐ | ‐ | ‐ | 0.74 (0.46‐1.20) | 0.53 |
Multivariable linear regression analyses were performed separately for the controls and cases. Model M1 included the same variables as the case‐control logistic regressions; Model M2 considered Model M1 and the existence of a treatment; and the last model, M3, included Model M2 and the center. Due to the log transformation, betas provided in the table should be interpreted as the proportion of variation of the biological measure for 1 unit of the covariate. Significance was set at P < 0.05.
CSF, cerebral spinal fluid; HA, histamine; t‐MeHA, tele‐methylhistamine.
Case‐only multivariable analyses allowed additional adjustment for treatment and center (Table 2). Model M1 showed a significant decrease in the CSF HA level with the increase in BMI z‐score and age (Figure 2). These associations were partially accounted for treatment and center adjustments (models M2 and M3), but remained significant for the BMI z‐score (P = 0.03, Model M3). No association was found between CSF t‐MeHA levels and BMI z‐score, age, or gender after adjustment in cases. No association was found between CSF HA, t‐MeHA, and delay from disease onset at time of LP, presence of cataplexy, LP timing, and CSF hypocretin levels in cases. In our sample, four of 24 patients had no cataplexy. We performed a sensitivity subanalysis only in patients with cataplexy that showed, as expected with the sample size reduction, similar tendencies, that is, estimates within the same magnitude of order but with borderline or nonsignificant P‐values especially in model M3.
Figure 2.
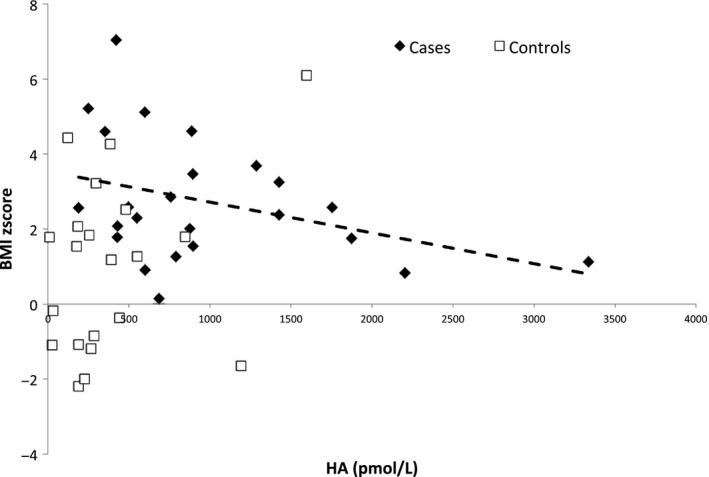
Histamine (HA) levels according to BMI z‐score in case and control children. BMI z‐score: body mass index z‐score, CSF HA levels: cerebrospinal fluid histamine levels; cases: narcoleptic children (cases) are represented by black diamond‐shaped figure (♦), control children by empty squares (□). A significant decrease in CSF HA levels was observed with the increase in BMI z‐score among cases (P = 0.007), while no association was observed among controls (P = 0.31) (multivariable regression model M1)
On the other hand, we found a positive association between CSF t‐MeHA levels and BMI z‐score in the controls (beta = 1.20, P = 0.006; Figure 3) with a negative association between CSF t‐MeHA levels and age (beta = 0.90, P = 0.005; Figure 4).
Figure 3.
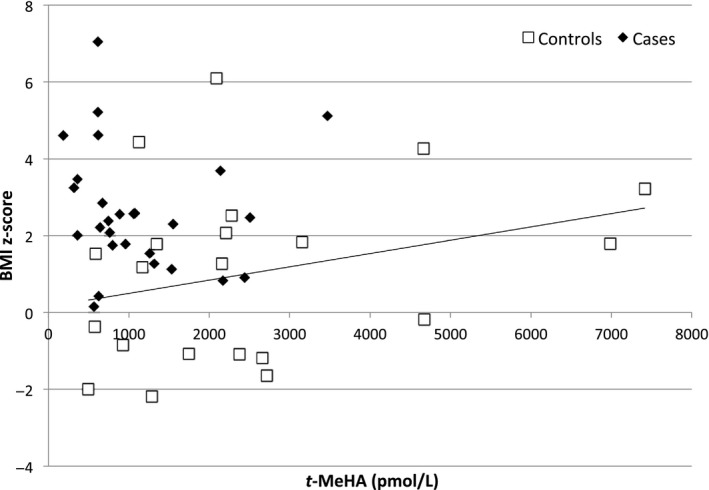
Tele‐methyl‐histamine (t‐MeHA) levels according to BMI z‐score in case and control children. BMI z‐score: body mass index z‐score, t‐MeHA levels: cerebrospinal fluid tele‐methyl‐histamine (t‐MeHA) levels; cases: narcoleptic children (cases) are represented by black diamond‐shaped figure (♦), control children by empty squares (□). A significant increase in CSF t‐MeHA was observed with the increase in BMI z‐score among controls (P = 0.006), while no association was observed among cases (P = 0.15) (multivariable regression model M1)
Figure 4.
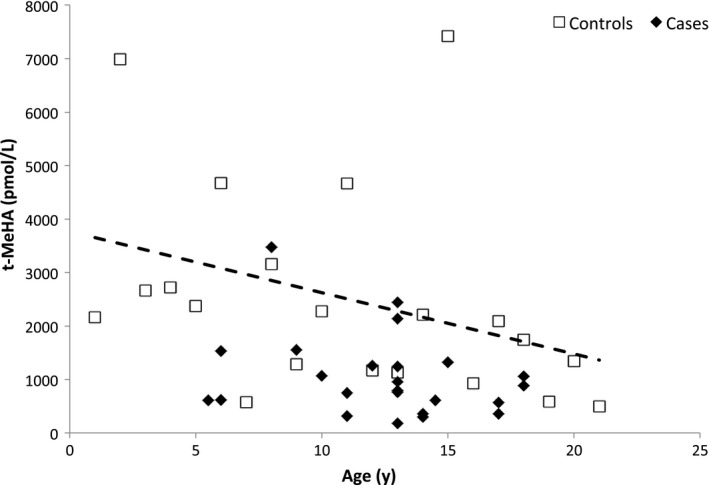
Tele‐methyl‐histamine (t‐MeHA) levels according to age in case and control children. T‐MeHA levels: cerebrospinal fluid tele‐methylhistamine (t‐MeHA) levels; cases: narcoleptic children (cases) are represented by black diamond‐shaped figure (♦), control children by empty squares (□). A significant decrease in CSF t‐MeHA was observed with age among controls (P = 0.005), while no association was observed among cases (P = 0.15) (multivariable regression model M1)
3.3. Effect of center
Significant clinical and biological differences were observed in narcoleptic children according to the recruitment center (Table [Link], [Link]). In Lyon, patients were more frequently treated before LP (P = 0.004), and they tended to be more obese (P = 0.10) with higher BMI z‐score (P = 0.16) and had fewer hallucinations (P = 0.08), sleep paralysis (P = 0.08), and cataplexy (P = 0.10) than in Montpellier. They also presented lower CSF HA levels (P = 0.004) and lower t‐MeHA levels (P = 0.04). However, the t‐MeHA/HA ratio was not different between centers (P = 0.5). Lumbar puncture was done during PSG diagnosis procedure in Montpellier and with a delay from PSG diagnosis in Lyon (median 5 months [from 0.5 to 31]; P ≤0.0001). However, no associations were found between LP delay and HA, t‐MeHA, and t‐MeHA/HA. No other differences were observed between the Lyon and Montpellier recruitment centers, especially for age, gender, delay from disease onset, and CSF hypocretin levels. Nevertheless, statistical differences for HA levels were found for patients from both Lyon and Montpellier when compared to control children. Narcoleptic children had significantly higher HA levels than controls both in Lyon (OR = 2.2 [95% CI: 1.03‐4.7], P = 0.04) and in Montpellier (OR = 6.5 [95% CI 1.8‐23.7], P = 0.005). Lower t‐MeHA levels were found in the patients from Lyon (OR = 0.2 [95% CI: 0.06‐0.61], P = 0.005) with a tendency in those from Montpellier (OR = 0.55 [95% CI: 0.26‐1.2], P = 0.10). The t‐MeHA/HA ratio showed lower levels in cases than in controls in both Lyon and Montpellier (OR = 0.22 [95% CI: 0.07‐0.67], P = 0.008 and OR = 0.25 [95% CI: 0.09‐0.66], P = 0.005, respectively). When taking into account the covariates (age, gender, and BMI z‐score), ORs were at the same levels but we lose statistical power. In multivariate models, the only significant association was observed between CSF HA and BMI z‐score among narcoleptic children from Lyon.
4. DISCUSSION
Narcolepsy during childhood provides the opportunity to evaluate the neurochemical changes at disease onset when the major symptoms such as sleepiness and cataplexy are prominent. In this study, we found that hypocretin‐deficient narcoleptic children had higher CSF HA levels, lower t‐MeHA levels, and a significantly decreased t‐MeHA/HA ratio compared to control children. Further adjustments revealed a negative correlation between CSF HA levels and BMI z‐score in cases only.
4.1. Technical considerations and possible limitations
Small samples (24 patients vs 21 controls) were used in our study. However, the patients were carefully selected; they were all children, hypocretin‐deficient, and HLA DQB1*06:02‐positive. We confirmed the absence of differences between HA levels and the presence of cataplexy, previous treatment intake, and lumbar puncture timing.9, 11 Indeed, our results were similar in the subanalysis only performed in patients with cataplexy. However, it was impossible to analyze the effect of cataplexy severity due to (a) the small number of patients within each category (partial [n = 8] or generalized cataplexy [n = 10]), and (b) the number of covariate to take into account regarding the patients’ characteristics in our sample. Second, the patients from Montpellier and Lyon were probably different. Patients from Lyon were more frequently treated but had a treatment withdrawal before biological measures. This effect of treatment was analyzed in the multivariate models and did not show an effect on HA, t‐MeHA, or t‐MeHA/HA levels. On the other hand, in multivariate models, the center was borderline associated with the HA level. This may reflect that the patients from Lyon had probably a different clinical picture (more obesity, less cataplexy, fewer hypnagogic hallucinations, and sleep paralysis) than the patients from Montpellier. This could be due to the difference in the age recruitment between the reference centers. Lyon is dedicated to pediatric patients, whereas Montpellier is a center for adults. However, the ratio t‐MeHA/HA, reflecting the HA turnover, was similar in both groups of NT1 children (1.25 vs 1.02). Third, obtaining CSF samples in healthy controls was difficult since the parents and their children were reluctant. We then took advantage of CSF samples from patients in the emergency room or with a neurological disease for whom a lumbar puncture had to be performed while finally all CSF results were normal and the children were sent back home. Some neurological diseases were associated with high CSF HA levels, such as CNS inflammations or infections.30, 31 However, our control children had lower HA levels compared with our narcoleptic patients that may underestimate our present findings. When comparing the control subjects with and without neurological pathologies, we did not find any differences in HA, t‐MeHA, and t‐MeHA/HA ratio. Four, the sleep‐wake pattern fluctuates along the day especially in patients with narcolepsy7, 11 and thus may affect the HA levels in cases of sleep/napping prior to lumbar puncture. However, in the primate model, the cisternal CSF HA levels remain stable against variation in sleep‐wake compounds.32 We also did not systematically evaluate sleepiness of the control subjects, nor had their CSF hypocretin levels measured. Therefore, to establish normative data on childhood CSF hypocretin, we analyzed its levels in 101 children recruited in the same way and no values were below 110 pg/mL.33 On the other hand, blood contamination was visually checked in all samples, and CSF samples with abnormal coloring were excluded from the study. Standard biochemical CSF analyses were performed in control children, confirming no blood or cell contamination.
4.2. Comparison with previous studies in adults
Literature concerning CSF HA levels in adult narcolepsy reported conflicting results. Lower CSF HA levels were previously reported in narcoleptic patients7, 8 or patients suffering from EDS.9 The major differences with our study could result from the different populations investigated with phenotype and age differences7, 8, 9 and the different HA measurement methodology.7, 8, 34 In fact, our study in children used a validated highly sensitive liquid chromatographic‐electrospray/tandem mass spectrometric assay for simultaneous quantification of CSF HA and t‐MeHA.10 Lastly, these studies did not measure t‐MeHA levels and so could not directly assess the turnover and dynamics of the HA transmission.
Using a similar method of measurement,10, 11 no significant differences in CSF HA and t‐MeHA levels were found between adult NT1 patients and other etiologies of central hypersomnias. Yet, there were higher CSF HA levels in NT1 patients compared to neurological controls (709 vs 380 pmol/L; P = 0.014),11 a difference that was attributed to age difference between the patients (28 years) and controls (54 years).10, 11 In our present study, there was no age difference between the controls and narcoleptic children. Further studies should assess longitudinally CSF HA levels in children narcoleptics, its changes over time as a function of disease duration, and whether these variations are specific to narcolepsy type 1 or also to type 2.
4.3. Metabolic changes and obesity associated with narcolepsy
We also found a negative association between CSF HA levels and BMI z‐score in narcoleptic children, but none with the t‐MeHA levels, t‐MeHA/HA ratio, or the loss of Hcrt. In controls, CSF t‐MeHA levels were positively correlated with the BMI z‐score, but negatively with age, thus in favor of changes of the HA transmission and metabolism during the development.35 As previously reported,15, 18, 36 we found more obese subjects (>50%) in narcoleptic children than in adults.17 In animal studies, the lack of either Hcrt or HA leads to slight obesity,4, 37 whereas enhancement of Hcrt or HA transmission causes loss of appetite and promotes metabolic rate.38, 39 Altogether, these data may suggest a complex involvement of HA and Hcrt deficiency in obesity associated with narcolepsy in children.
4.4. Histaminergic neurotransmission and narcolepsy
In the mammalian CNS, HA is synthetized solely by histidine decarboxylase (HDC) and inactivated, once released from the terminals, by the omnipresent enzyme histamine‐N‐methyltransferase producing the direct metabolite t‐MeHA22, 23 (Figure 1). Direct measurement of HA and t‐MeHA in specific human brain regions cannot be a routine procedure, as it remains heavily invasive. In contrast, the CSF HA and t‐MeHA levels can be more easily assessed and they represent the stable average values from the whole brain. Therefore, CSF HA and t‐MeHA levels together with the t‐MeHA/HA ratio constitute currently the only realistic functional biomarkers or “mirror” reflecting the activity of HA system in the human CNS and dynamics of the histaminergic neurotransmission.
In our study, the narcoleptic children were firstly characterized by a marked increase in CSF HA. Do such high neurotransmitter levels indicate an upregulation of HA synthesis or/and release? This seems unlikely in view of an accompanied marked decrease in the HA direct metabolite t‐MeHA (Figure 1). Indeed, t‐MeHA is the marker of the HA metabolism and turnover22, 23 and its decrease constitutes a clear sign of a downregulated HA turnover. Thus, the increased CSF HA levels can only be regarded as an abnormal accumulation or impaired functional utilization of the amine. This interpretation is reinforced by a remarkable decrease in the t‐MeHA/HA ratio (7.2 folds < the control levels), which characterizes a prominent impairment of the HA transmission and therefore an affected dynamic of the brain HA system in the narcoleptic children (Figure 1). The fact that narcoleptic syndromes are normalized by H3‐receptor inverse agonists also supports such interpretation. Indeed, HA controls its own synthesis, release, and neuronal activity through a negative feedback via H3‐receptor.22, 23 The use of H3‐receptor antagonists/inverse agonists such as pitolisant allows therefore an enhancement of HA transmission and, as a result, an improvement of EDS and cataplexy in both animal models and narcoleptic patients.40, 41, 42 Further studies should assess whether such an impairment occurs at the level of HA synthesis or release and whether it is specific to narcolepsy type 1, in order to determine how an impaired HA transmission is involved in the pathophysiology of narcolepsy.
The mechanisms underlying the impairment of HA transmission identified here in NT1 children remain to be further determined. There is a general agreement that a deficient Hcrt transmission is the direct cause of narcolepsy and that Hcrt neurons constitute a direct and major excitatory source to HA neurons in addition to aminergic and cholinergic excitatory afferents.3, 4, 23, 43 Our narcoleptic children were all Hcrt‐deficient. Therefore, the lack of the Hcrt excitatory inputs to HA neurons should contribute, at least in part, to the observed impairment of HA transmission. Another hypothesis which remains to be tested would be that HA neurons are functionally affected by similar autoimmune procedures leading to destruction of Hcrt cells.
It remains unknown if the impaired HA transmission found in our patients with NT1 is related to the increased number of HDC‐positive neurons reported in postmortem brain studies of adult patients with narcolepsy.5, 6 Yet, it is not to be excluded that such impairment through homeostatic adaptive mechanisms could upregulate HDC in the hypothalamic neurons in order to compensate for the functional deficit of HA transmission, although such compensatory upregulation of HDC could be also triggered by the deficiency of the Hcrt system associated with narcolepsy in view of the close interaction between the two wake‐promoting systems.3, 4, 44 Animal studies also show clear association between the lack of HA and sleepiness.3, 23, 37, 40 The present study could not establish a link between the decreased HA transmission with the narcolepsy‐associated EDS, most probably due to the relatively small samples collected and the lack of PSG data of most patients at LP time. Nevertheless, the impaired HA transmission demonstrated here could explain why enhancement of HA transmission using H3 receptor inverse agonists can significantly improve EDS in both adult and child narcolepsy.40, 41, 42 Serial analysis on HA and t‐MeHA levels as well as those of other wake‐promoting neurotransmitters from the beginning of the disease in a larger sample of patients with PSG data will be required in order to further clarify the role of HA in the pathogenesis of narcolepsy and notably EDS.
In conclusion, compared with the controls, NT1 children had a higher CSF HA level together with a lower t‐MeHA level leading to a significant decrease in the t‐MeHA/HA ratios. These results suggest a decreased HA turnover and an impairment of histaminergic neurotransmission in narcoleptic children and support the use of a histaminergic therapy in the treatment against narcolepsy.
CONFLICT OF INTERESTS
Pr Yves Dauvilliers received funds for speaking and board engagements with UCB pharma, Jazz, Flamel, Theranexus, GSK, and Bioprojet. He was investigator in studies promoted by Bioprojet (Pitolisant). Pr Patricia Franco received funds for speaking and board engagements with UCB pharma and Procter & Gamble. She is investigator in clinical studies promoted by Bioprojet (Pitolisant). Pr Jian‐Sheng Lin received funds for speaking with Bioprojet. The other authors have nothing to report.
Supporting information
ACKNOWLEDGMENTS
This is not an industry‐sponsored study. The study was supported in part by a Brazilian Grant “CAPES (Coordination for the Improvement of Higher Level Education)” and a Grant “PHRC AOM07‐138” from the French Health Ministry. Patricia Franco benefitted from a research grant “INTERFACE‐INSERM‐Hôpitaux.” We are grateful to Dr. Jeanne‐Marie Lecomte, Prof. Jean‐Charles Schwartz, and Dr. Philippe Robert (Bioprojet‐Biotech, Saint Gregoire‐France) for the HA and t‐MeHA measurements. We thank Dr Luc Gentet for English improvement and Colette Buda for data collection and management.
Franco P, Dauvilliers Y, Inocente CO, et al. Impaired histaminergic neurotransmission in children with narcolepsy type 1. CNS Neurosci Ther. 2019;25:386–395. 10.1111/cns.13057
REFERENCES
- 1. American Academy of Sleep Medicine . International Classification of Sleep Disorders – Third Edition (ICSD‐3). Darien, IL: American Academy of Sleep Medicine; 2014. [Google Scholar]
- 2. Kornum BR, Knudsen S, Ollila HM, et al. Narcolepsy. Nat Rev Dis Primers. 2017;3:16100. [DOI] [PubMed] [Google Scholar]
- 3. Lin JS, Anaclet C, Sergeeva OA, Haas HL. The waking brain: an update. CellMol Life Sci. 2011;68:2499‐2512. [DOI] [PMC free article] [PubMed] [Google Scholar]
- 4. Anaclet C, Parmentier R, Ouk K, et al. Orexin/hypocretin and histamine: distinct roles in the control of wakefulness demonstrated using knock‐out mouse models. J Neurosci. 2009;29:14423‐14438. [DOI] [PMC free article] [PubMed] [Google Scholar]
- 5. Valko PO, Gavrilov YV, Yamamoto M, et al. Increase of histaminergic tuberomammillary neurons in narcolepsy. Ann Neurol. 2013;74:794‐804. [DOI] [PubMed] [Google Scholar]
- 6. John J, Thannickal TC, McGregor R, et al. Greatly increased numbers of histamine cells in human narcolepsy with cataplexy. Ann Neurol. 2013;74:786‐793. [DOI] [PMC free article] [PubMed] [Google Scholar]
- 7. Nishino S, Sakurai E, Nevsimalova S, et al. Decreased CSF histamine in narcolepsy with and without low CSF hypocretin‐1 in comparison to healthy controls. Sleep. 2009;32:175‐180. [DOI] [PMC free article] [PubMed] [Google Scholar]
- 8. Kanbayashi T, Kodama T, Kondo H, et al. CSF histamine contents in narcolepsy, idiopathic hypersomnia and obstructive sleep apnea syndrome. Sleep. 2009;32:181‐187. [DOI] [PMC free article] [PubMed] [Google Scholar]
- 9. Bassetti CL, Baumann CR, Dauvilliers Y, Croyal M, Robert P, Schwartz JC. Cerebrospinal fluid histamine levels are decreased in patients with narcolepsy and excessive daytime sleepiness of other origin. J Sleep Res. 2010;19:620‐623. [DOI] [PubMed] [Google Scholar]
- 10. Croyal M, Dauvilliers Y, Labeeuw O, Capet M, Schwartz JC, Robert P. Histamine and tele‐methylhistamine quantification in cerebrospinal fluid from narcoleptic subjects by liquid chromatography tandem mass spectrometry with precolumn derivatization. Anal Biochem. 2011;409:28‐36. [DOI] [PubMed] [Google Scholar]
- 11. Dauvilliers Y, Delallee N, Jaussent I, et al. Normal cerebrospinal fluid histamine and tele‐methylhistamine levels in hypersomnia conditions. Sleep. 2012;35:1359‐1366. [DOI] [PMC free article] [PubMed] [Google Scholar]
- 12. Nevsimalova S, Buskova J, Kemlink D, Sonka K, Skibova J. Does age at the onset of narcolepsy influence the course and severity of the disease? Sleep Med. 2009;10:967‐972. [DOI] [PubMed] [Google Scholar]
- 13. Dauvilliers Y, Montplaisir J, Molinari N, et al. Age at onset of narcolepsy in two large populations of patients in France and Quebec. Neurology. 2001;57:2029‐2033. [DOI] [PubMed] [Google Scholar]
- 14. Plazzi G, Pizza F, Palaia V, et al. Complex movement disorders at disease onset in childhood narcolepsy with cataplexy. Brain. 2011;134:3477‐3489. [DOI] [PMC free article] [PubMed] [Google Scholar]
- 15. Schuld A, Hebebrand J, Geller F, Pollmacher T. Increased body‐mass index in patients with narcolepsy. Lancet. 2000;355:1274‐1275. [DOI] [PubMed] [Google Scholar]
- 16. Dahmen N, Tonn P, Messroghli L, Ghezel‐Ahmadi D, Engel A. Basal metabolic rate in narcoleptic patients. Sleep. 2009;32:962‐964. [PMC free article] [PubMed] [Google Scholar]
- 17. Inocente CO, Lavault S, Lecendreux M, et al. Impact of obesity in children with narcolepsy. CNS Neurosci Ther. 2013;19:521‐528. [DOI] [PMC free article] [PubMed] [Google Scholar]
- 18. Poli F, Pizza F, Mignot E, et al. High prevalence of precocious puberty and obesity in childhood narcolepsy with cataplexy. Sleep. 2013;36:175‐181. [DOI] [PMC free article] [PubMed] [Google Scholar]
- 19. Aran A, Einen M, Lin L, Plazzi G, Nishino S, Mignot E. Clinical and therapeutic aspects of childhood narcolepsy‐cataplexy: a retrospective study of 51 children. Sleep. 2010;33:1457‐1464. [DOI] [PMC free article] [PubMed] [Google Scholar]
- 20. Ponziani V, Gennari M, Pizza F, Balsamo A, Bernardi F, Plazzi G. Growing up with type 1 narcolepsy: its anthropometric and endocrine features. J Clin Sleep Med. 2016;15(12):1649‐1657. [DOI] [PMC free article] [PubMed] [Google Scholar]
- 21. Lecendreux M, Libri V, Jaussent I, et al. Impact of cytokine in type 1 narcolepsy: Role of pandemic H1N1 vaccination ? J Autoimmun. 2015;60:20‐31. [DOI] [PubMed] [Google Scholar]
- 22. Schwartz JC, Arrang JM, Garbarg M, Pollard H, Ruat M. Histaminergic transmission in the mammalian brain. Physiol Rev. 1991;71:1‐51. [DOI] [PubMed] [Google Scholar]
- 23. Haas HL, Sergeeva OA, Selbach O. Histamine in the nervous system. Physiol Rev. 2008;88:1183‐1241. [DOI] [PubMed] [Google Scholar]
- 24. Snow A, Gozal E, Malhotra A, et al. Severe hypersomnolence after pituitary/hypothalamic surgery in adolescents: clinical characteristics and potential mechanisms. Pediatrics. 2002;110:e74. [DOI] [PubMed] [Google Scholar]
- 25. Murali H, Kotagal S. Off‐label treatment of severe childhood narcolepsy‐cataplexy with sodium oxybate. Sleep. 2006;29:1025‐1029. [DOI] [PubMed] [Google Scholar]
- 26. Cole TJ, Bellizzi MC, Flegal KM, Dietz WH. Establishing a standard definition for child overweight and obesity worldwide: international survey. BMJ. 2000;320:1240‐1243. [DOI] [PMC free article] [PubMed] [Google Scholar]
- 27. Rolland‐Cachera MF. Childhood obesity: current definitions and recommendations for their use. Int J Pediatr Obes. 2011;6:325‐331. [DOI] [PubMed] [Google Scholar]
- 28. Iber C, Ancoli‐Israel S, Chesson A, Quan S; for the American Academy of Sleep Medicine . The AASM Manual for the Scoring of Sleep and Associated Events: Rules, Terminology and Technical Specifications, 1st edn Westchester, IL: American Academy of Sleep Medicine; 2007. [Google Scholar]
- 29. Mignot E, Lammers GJ, Ripley B, et al. The role of cerebrospinal fluid hypocretin measurement in the diagnosis of narcolepsy and other hypersomnias. Arch Neurol. 2002;59:1553‐1562. [DOI] [PubMed] [Google Scholar]
- 30. Nagakura T, Maeda H, Akita M, et al. Increased cerebrospinal fluid levels of histamine in children with aseptic meningitis. Acta Paediatr Jpn. 1994;36:730‐732. [DOI] [PubMed] [Google Scholar]
- 31. Kiviranta T, Tuomisto L, Airaksinen EM. Histamine in cerebrospinal fluid of children with febrile convulsions. Epilepsia. 1995;36:276‐280. [DOI] [PubMed] [Google Scholar]
- 32. Zeitzer JM, Kodama T, Buckmaster CL, et al. Time‐course of cerebrospinal fluid histamine in the wake‐consolidated squirrel monkey. J Sleep Res. 2012;21:189‐194. [DOI] [PMC free article] [PubMed] [Google Scholar]
- 33. Lancien M, Inocente CO, Dauvilliers Y, et al. Low cerebrospinal fluid hypocretin levels during sudden infant death syndrome (SIDS) risk period. Sleep Med. 2017;33:57‐60. [DOI] [PubMed] [Google Scholar]
- 34. Yamatodani A, Fukuda H, Wada H, Iwaeda T, Watanabe T. High‐performance liquid chromatographic determination of plasma and brain histamine without previous purification of biological samples: cation‐exchange chromatography coupled with post‐column derivatization fluorometry. J Chromatogr. 1985;344:115‐123. [DOI] [PubMed] [Google Scholar]
- 35. Molina‐Hernandez A, Diaz NF, Arias‐Montano JA. Histamine in brain development. J Neurochem. 2012;122:872‐882. [DOI] [PubMed] [Google Scholar]
- 36. Poli F, Plazzi G, Di Dalmazi G, et al. Body mass index‐independent metabolic alterations in narcolepsy with cataplexy. Sleep. 2009;32:1491‐1497. [DOI] [PMC free article] [PubMed] [Google Scholar]
- 37. Parmentier R, Ohtsu H, Djebbara‐Hannas Z, Valatx JL, Watanabe T, Lin JS. Anatomical, physiological, and pharmacological characteristics of histidine decarboxylase knock‐out mice: evidence for the role of brain histamine in behavioral and sleep‐wake control. J Neurosci. 2002;22:7695‐7711. [DOI] [PMC free article] [PubMed] [Google Scholar]
- 38. Sakata T, Yoshimatsu H, Kurokawa M. Hypothalamic neuronal histamine: implications of its homeostatic control of energy metabolism. Nutrition. 1997;13:403‐411. [DOI] [PubMed] [Google Scholar]
- 39. Gao XB, Horvath T. Function and dysfunction of hypocretin/orexin: an energetics point of view. Annu Rev Neurosci. 2014;37:101‐116. [DOI] [PubMed] [Google Scholar]
- 40. Lin JS, Sergeeva OA, Haas HL. Histamine H3 receptors and sleep‐wake regulation. J Pharmacol Exp Ther. 2011;336:17‐23. [DOI] [PubMed] [Google Scholar]
- 41. Inocente C, Arnulf I, Bastuji H, et al. Pitolisant, an inverse agonist of the histamine H3 receptor: an alternative stimulant for narcolepsy‐cataplexy in teenagers with refractory sleepiness. Clin Neuropharmacol. 2012;35:55‐60. [DOI] [PubMed] [Google Scholar]
- 42. Dauvilliers Y, Bassetti C, Lammers GJ, et al. Pitolisant versus placebo or modafinil in patients with narcolepsy: a double‐blind, randomised trial. Lancet Neurol. 2013;12:1068‐1075. [DOI] [PubMed] [Google Scholar]
- 43. Sakai K, El Mansari M, Lin JS, Zhang JG, Vanni‐Mercier G. The posterior hypothalamus in the regulation of wakefulness and paradoxical sleep In: Mancia M, Marini G, eds. The Diencephalon and Sleep. New York, NY: Raven Press, ltd.; 1990:171‐198. [Google Scholar]
- 44. Shan L, Dauvilliers Y, Siegel JM. Interactions of the histamine and hypocretin systems in CNS disorders. Nat Rev Neurol. 2015;11:401‐413. [DOI] [PMC free article] [PubMed] [Google Scholar]
Associated Data
This section collects any data citations, data availability statements, or supplementary materials included in this article.
Supplementary Materials