Summary
Aim
Glioma, with fast growth and progression features, is the most common and aggressive tumor in the central nervous system and is essentially incurable. This study is aimed at inducing neuronal differentiation to suppress glioma cell growth with a single transcription factor.
Methods
Overexpression of transcription factor SRY (sex determining region Y)‐box 11 (SOX11) and Zic family member 1 (ZIC1) was, respectively, performed in glioma cells with lentivirus infection. CRISPR/Cas9 technology was used to knock out ZIC1 in U87 cells, and knockout efficiency was identified by Western blotting and Sanger sequencing. Cell cycle and apoptosis were detected by flow cytometry. The downstream targets of SOX11 were analyzed by Affymetrix GeneChip microarrays. qRT‐PCR and immunofluorescence technique were used to verify gene targets of genetically modified U87 cells. All the cells were imaged by a fluorescence microscope. Gene expression correlation analysis and overall survival analysis based on TCGA dataset are performed by GEPIA.
Results
We induced glioma cells into neuron‐like cells to suppress cell growth using a single transcription factor, SOX11 or ZIC1. Besides, we proved that there is a strong correlation between SOX11 and ZIC1. Our study revealed that SOX11 upregulates ZIC1 expression by binding with ZIC1 promoter, and ZIC1 partially mediates SOX11‐induced neuronal differentiation in U87 cells. However, SOX11 expression is not regulated by ZIC1. Moreover, high MAP2 expression means better overall survival in TCGA lower grade glioma.
Conclusion
This study revealed that glioma cells can be reprogrammed into neuron‐like cells using a single factor ZIC1, which may be a potential tumor suppressor gene for gliomas treatment.
Keywords: cell growth, glioma, neuronal differentiation, reprogramming, SOX11, transcription factor, U87, ZIC1
1. INTRODUCTION
Nobel Prize winner Yamanaka has used transcription factors to reprogram somatic cells into iPS cells in 2006,1 which led to a series of improved methods of cell reprogramming, including the direct reprogramming of somatic cells into other tissue cells.2, 3, 4 Glioma is a malignant disease with a high incidence5 and a very poor prognosis.6, 7 It still lacks effective treatment strategies8, 9 and seriously endangers human health. Can glioma be treated with cell reprogramming? In order to find out the answer, we began to explore key transcription factors that affect the development of the nervous system.
ZIC1 gene encodes a zinc finger protein, and almost all Zic1‐deficient mice die within a month, with cerebellum dysplasia.10 Zic1/Zic3 complex mutant mice have abnormal forebrain, and lack of Zic1 and Zic3 leads to hippocampus, septum, and olfactory bulb hypoplasia.11 Zic1, expressed at the anterior neural plate, can regulate the synthesis and transport of retinoic acid and is sufficient and necessary to promote placode fate.12 Zic1 silencing prevents the differentiation of mouse embryonic stem cells into neuron precursors.13 ZIC1 has tumor suppressive effects in breast cancer,14 thyroid cancer,15 gastric cancer,16, 17 colon cancer,18 and malignant pleural mesothelioma.19 However, the role of ZIC1 in glioma is unknown.
Sox11 can reprogram adult optic ganglion cells to a state with sufficient growth capacity, thereby promoting the regeneration of certain types of optic ganglion neurons.20 NEUROG2 and SOX11 synergistically convert human glioma cells into terminally differentiated neuron‐like cells in vitro and in adult mouse brain.21 These two transcription factors can also convert healthy and patient postnatal and adult skin fibroblasts into cholinergic neurons.22 Whether ZIC1 has cell reprogramming ability has not been reported.
From the above‐mentioned findings, we know that ZIC1 and SOX11 have a very important role in neuronal development and tumor suppression. However, the relationship between them has not been fully clarified, and there is also no research using ZIC1 for cell reprogramming. Therefore, we used glioma cells to explore the relationship between SOX11 and ZIC1, revealing that similar to SOX11, ZIC1 can also transdifferentiate U87 cells into neuron‐like cells. Furthermore, ZIC1 is a target gene of SOX11, and SOX11 upregulates ZIC1 expression by direct binding with ZIC1 promoter. ZIC1 partially mediates SOX11‐induced neuronal differentiation of U87 cells. Therefore, this study indicated that ZIC1 may be a new tumor suppressor gene for gliomas treatment.
2. MATERIALS AND METHODS
2.1. Reagents and plasmids
SOX11 and ZIC1 cDNA were constructed into the pLVX‐IRES‐ZsGreen1 (Clontech, Mountain View, CA, USA) for constitutive overexpression. Nontargeting control sgRNA ACGGAGGCTAAGCGTCGCAA, ZIC1‐KO sgRNA#1 CGGCCACGCGTCGCCTAACG and sgRNA#2 GGCATCAACCCGTTCGCCGA were constructed into lentiCRISPR v2, which was a gift from Feng Zhang. The lentivirus packaging vectors psPAX2 and pMD2.G were from Addgene (Cambridge, MA, USA). The 2487 bp, 205 bp, 232 bp, 1248 bp, 1270 bp, and 1219 bp ZIC1 promoters were amplified from the genomic DNA of U87 cells, and the amplified ZIC1 promoter was double‐digested with ClaI and XhoI to replace the CMV promoter on the lentiviral vector pLVX‐mCherry‐N1 (Clontech) (Figure 4A). The primers used to amplify ZIC1 promoter are as follows (Table 1), 2487 bp (ClaI‐ZIC1 promoter‐F and XhoI‐ZIC1 promoter‐R), 205 bp (ClaI‐ZIC1 promoter‐F and XhoI‐ZIC1 promoter‐R3), 232 bp (ClaI‐ZIC1 promoter‐F4 and XhoI‐ZIC1 promoter‐R4), 1248 bp (ClaI‐ZIC1 promoter‐F2 and XhoI‐ZIC1 promoter‐R2), 1270 bp (ClaI‐ZIC1 promoter‐F and XhoI‐ZIC1 promoter‐R5), and 1219 bp (ClaI‐ZIC1 promoter‐F3 and XhoI‐ZIC1 promoter‐R).
Table 1.
Primer oligonucleotides used for amplifying ZIC1 promoter
| Primer name | Sequence |
|---|---|
| ClaI‐ZIC1 promoter‐F | CCATCGATTTACCTCCACTCCTCATTCCATT |
| ClaI‐ZIC1 promoter‐F2 | CCATCGATGATGAGTTGAGGTTTCTTTGT |
| ClaI‐ZIC1 promoter‐F3 | CCATCGATCCAAGTAGGGAACAGGAGTG |
| ClaI‐ZIC1 promoter‐F4 | CCATCGATAAGCACAGCCCATGGAAAG |
| XhoI‐ZIC1 promoter‐R | CCGCTCGAGATCTGAGTCCGGTAGCGCTAGCGATCCCTCCTCGCTCCTTCACTCTC |
| XhoI‐ZIC1 promoter‐R2 | CCGCTCGAGATCTGAGTCCGGTAGCGCTAGCGATCCGTTTGTTTCCCTCTTGCTTT |
| XhoI‐ZIC1 promoter‐R3 | CCGCTCGAGATCTGAGTCCGGTAGCGCTAGCGATCCTGGGCTGTGCTTGCTCAA |
| XhoI‐ZIC1 promoter‐R4 | CCGCTCGAGATCTGAGTCCGGTAGCGCTAGCGATCCCCTCAACTCATCCTTTCATAGGC |
| XhoI‐ZIC1 promoter‐R5 | CCGCTCGAGATCTGAGTCCGGTAGCGCTAGCGATCCGGGCCCCTTTCATTCAGGTA |
2.2. Cell cultures
HEK293T cells, U251 cells, and A172 cells were cultured in DMEM (HyClone, South Logan, UT, USA) containing 10% FBS (Corning, Steuben, NY, USA), 1% penicillin/streptomycin (P/S) (Solarbio, Beijing, China) at 37°C with 5% CO2. U87 cells (ATCC, Manassas, VA, USA) were cultured in 10% FBS, 1% sodium pyruvate (Sigma, Darmstadt, Germany), 1% NEAA (100X, Thermo, Waltham, MA, USA), and 1% P/S containing MEM/EBSS (HyClone) at 37°C with 5% CO2.
2.3. Lentivirus transfection
Lentivirus production was described as previous.23 Briefly, lentivirus vector and lentivirus packaging vectors psPAX2 and pMD2.G were cotransfected into HEK293T cells through calcium phosphate‐DNA coprecipitation. For infection, cells were incubated with viral supernatant at 37°C overnight, and then, medium was replaced with fresh medium.
2.4. ZIC1 KO cell lines construction
After ZIC1 KO lentivirus infection for 48 hours and puromycin selection for 48 hours. Cells were trypsinized and counted, and then 100 μL of medium containing about four cells was added into each well of a 96‐well plate. Cells will be observable via microscopy over 3 days and be ready to score in 8 days. Mark each well on the cover of the plate indicating which well contains a single colony. These colonies can later be subcultured from the wells into larger vessels. Finally, U87‐ZIC1‐KO#1 and U87‐ZIC1‐KO#2 cell lines were identified by Sanger sequencing with primers CACGTCGGCTCCTATTCCA and CCTCCCAGAAGCAGATGTGATTACTC, respectively.
2.5. Flow cytometry
Cells were passaged to 6‐well plate for 2 × 10⁵ cells/well. Six hours later, these cells were infected with virus supernatant (fresh medium: virus supernatant = 1 mL: 0.4 mL), and 24 hours later, repeat infection again. Forty‐eight hours later, replace medium with 2 mL fresh medium. Seventy‐two hours later, after harvesting and centrifugation, the supernatant was removed and the cell pellet was washed once with PBS. Cell cycle and annexin V‐APC apoptosis detection protocols can be found on the KeyGEN product information home page. Tested with BD FACSVerse and analyzed using FlowJo software.
2.6. Microarray gene expression analysis
After infection with control and SOX11 lentivirus, total RNA was extracted from U87 cells. After total RNA samples were analyzed by Agilent 2100 (Agilent, Santa Clara, CA, USA), aRNA (amplified RNA) was prepared using GeneChip 3′IVT Express Kit (Affymetrix, Santa Clara, CA, USA). That is, cDNA is synthesized by one‐strand synthesis, and a double‐stranded DNA template is further obtained by two‐strand synthesis, and then an avidin‐labeled aRNA (amplified RNA) is obtained by in vitro inversion. The aRNA is purified and then fragmented and hybridized with the chip probe. After the hybridization is completed, the chip is washed and dyed, and the image and original data are finally scanned.
2.7. mRNA extraction and qRT‐PCR
Total RNA was isolated by using the RNAprep Pure Cell/Bacteria Kit (Tiangen, Beijing, China), and RNA concentration was determined by Nano‐300 (Allsheng, Hangzhou, China). 500 ng of total RNA from each sample was reverse transcribed into cDNA using HiScript II Q RT SuperMix for qPCR (+gDNA wiper; Vazyme, Nanjing, China) and subjected to qRT‐PCR (ABI 7500, Thermo) using the ChamQ SYBR qPCR Master Mix (Low ROX Premixed; Vazyme). GAPDH serves as an internal reference in gene expression analysis. ChIP‐qPCR was performed according to the manufacturer’s instructions (Beyotime, #P2078, Beijing, China). Primers sequences are as follows (Table 2).
Table 2.
Primer oligonucleotides used for qPCR
| Symbol | Forward primer | Reverse primer |
|---|---|---|
| GAPDH | GAGTCCACTGGCGTCTTCA | TCTTGAGGCTGTTGTCATACTTC |
| DCX | GGTCAGATGGCACAACAGAAG | ACAGGCTAAGAAGAGGCACAT |
| HES1 | GCTGGAGAAGGCGGACATT | GGTAGGTCATGGCATTGATCTG |
| MAP2 | CTCTCAACAGTTCTATCTCTTCTTCA | TTCTTCTCACTCGGCACCAA |
| NES | CGTTGGAACAGAGGTTGGAG | AGGCTGAGGGACATCTTGAG |
| SOX11 | GCTGCTGAGACGCTACAAC | GTGCTGCTTGGTGATGTTCT |
| TUBB3 | GCCTTTGGACATCTCTTCAGG | TCCTTCCGCACCACATCC |
| ZIC1 | CAAGATGTGCGACAAGTCCTAC | GGAGGCGTGGAGGATTCG |
| ChIP‐ZIC1promoter‐1 | TTACCTCCACTCCTCATTCCATT | CCATCAACAAGTCTGAGTCTAGC |
2.8. Immunocytochemistry and imaging
Immunofluorescent staining was described previously.24 We stained directly in 12‐well plates. Samples were visualized with Olympus fluorescence microscope. The primary antibodies used in this study include anti‐rabbit SOX11 (1:100; Abcam, Cambridge, MA, USA), anti‐rabbit ZIC1 (1:250, Abcam), anti‐rabbit MAP2 (1:500, Proteintech, Wuhan, China), and anti‐mouse TUBB3 (1:500, Proteintech) antibodies. The second antibodies include Alexa Fluor 594‐conjugated Goat Anti‐Mouse IgG (H + L; 1:500, Proteintech) and Alexa Fluor 594‐conjugated Goat Anti‐Rabbit IgG (H + L; 1:500, Proteintech).
2.9. Western blotting
Nontargeting control and ZIC1 KO cell lines were collected and lysed in RIPA buffer. Protein concentrations were calculated with the BCA kit (Tiangen). After denaturing, 30 μg of total proteins was subjected to SDS‐PAGE. Antibodies used were ZIC1 (1:1000, rabbit IgG; Abcam) and ACTB (1:5000, mouse IgG, CST, Danvers, MA, USA).
2.10. Gene expression profiling interactive analysis
SOX11 and ZIC1 gene expression correlation analysis and overall survival analysis based on MAP2 gene expression for given sets of TCGA expression data are performed by GEPIA.25
2.11. Statistical analyses
All experiments were carried out in triplicates and repeated separately at least three times. Student’s t tests were used to measure significance between control and the experiment groups. Data were analyzed by Excel (Microsoft, Redmond, WA, USA). The tests were performed with a nominal significant level of 0.05. *P < 0.05, **P < 0.01, and ***P < 0.001. Results were shown as mean ± SEM.
3. RESULTS
3.1. SOX11 inhibits cell proliferation and induces neuronal differentiation
After overexpression of SOX11 for 3 days, the proliferation of U87, U251, and A172 cells was significantly slower than that of the control group, and even there were many floating dead cells (Figure 1A). Then, the cells were tested by cell cycle and apoptosis detection. Cell cycle detection revealed that, compared to the control group, SOX11 overexpression resulted in a significant increase in G0/G1 phase and a significant decrease in G2/M phase, indicating that SOX11 overexpression can cause cell cycle in U87 cells to be arrested in the G0/G1 phase, resulting in slower cell growth (Figure 1B). Apoptosis detection revealed that the early apoptosis of SOX11‐overexpressing cells increased significantly, indicating that SOX11 overexpression not only suppressed the growth of U87 cells, but also caused apoptosis (Figure 1C).
Figure 1.
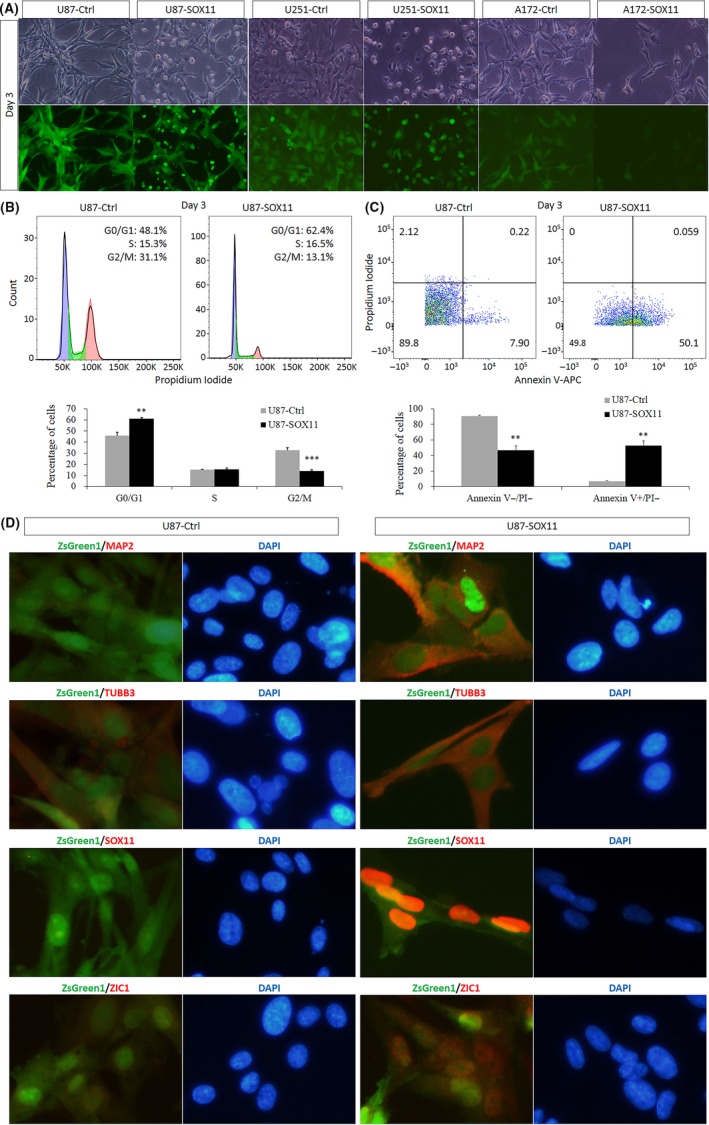
SOX11 overexpression induces growth arrest and neuronal differentiation of glioma cells. (A) Compared with ZsGreen1 empty vector lentivirus infection group (as control), SOX11 overexpression for 3 days caused growth suppression of U87, U251, and A172 cells. (B) FACS illustrated that SOX11+ cell cycle was arrested in G0/G1 phase significantly. Blue indicates cells within G0/G1 phase, green indicates cells within S phase, and red indicates cells within G2/M phase. Statistical difference was accepted when P < 0.05 compared to control. **P < 0.01, ***P < 0.001. (C) FACS revealed that ectopic SOX11 significantly promoted cell apoptosis 3 days after virus infection. Statistical difference was accepted when P < 0.05 compared to control. **P < 0.01. (D) Immunofluorescence staining of control and SOX11 overexpression cells with MAP2, TUBB3, SOX11, and ZIC1 primary antibodies, respectively. MAP2, TUBB3, and ZIC1 co‐expressed with SOX11 (indicated in red channel). MAP2 and TUBB3 are expressed in cytoplasm, SOX11 is only expressed in the nuclei, and ZIC1 is expressed both in nuclei and cytoplasm. Data were obtained from 10 randomly selected fields from triplicate samples
Immunofluorescence staining of U87 cells 3 days after infection with single lentivirus of SOX11 showed that the expression of MAP2, TUBB3, SOX11, and ZIC1 was upregulated in SOX11+ U87 cells compared with the control group (Figure 1D, red channel). In the control group, red fluorescence was not observed with MAP2 and SOX11 staining, a little red fluorescence was observed with TUBB3 staining, and red fluorescence with ZIC1 staining was slightly visible. Subcellular localization: MAP2 and TUBB3 were located in the cytoplasm, SOX11 was located in the nucleus, and ZIC1 was distributed in the nucleus and cytoplasm. This indicated that SOX11 was significantly overexpressed in U87 cells, while MAP2 and TUBB3 were used as neuron markers, suggesting that overexpression of SOX11 can promote the differentiation of U87 cells into neuron‐like cells and can cause upregulation of ZIC1 expression as well.
3.2. The neural induction function of SOX11 was confirmed by the results of GeneChip and qRT‐PCR
Affymetrix GeneChip microarrays revealed that SOX11 induced changes in biological processes such as cell proliferation and neurogenesis, in molecular functions such as cytoskeletal protein (eg, TUBB3 and MAP2) binding, and in cellular components such as neuron projection (Figure 2A). In order to further predict the function of SOX11 targets, we mapped all differentially expressed gene (DEG)‐enriched pathways and found that multiple signaling pathways including neuron axon guidance, PPAR, p53, and MAPK were in high enrichment (Figure 2B).
Figure 2.
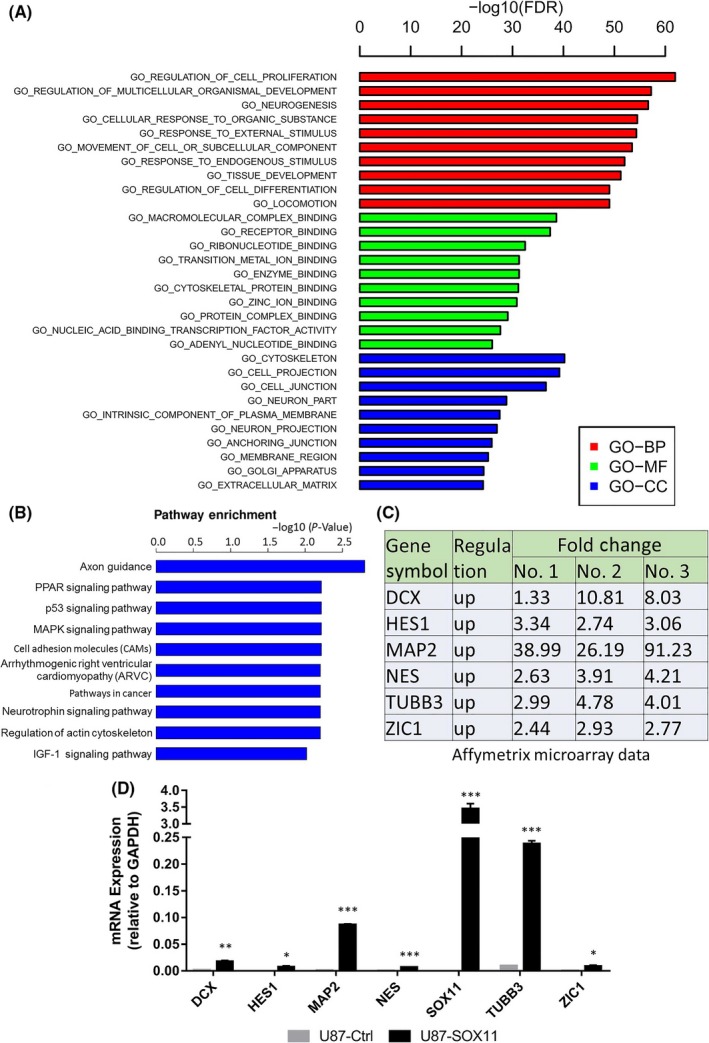
Affymetrix GeneChip microarrays and qRT‐PCR results revealed that SOX11 caused pan‐neuronal genes upregulation. (A, B) Bioinformatics analysis of GeneChip microarray datasets illustrated significantly upregulated Gene Ontology (GO) terms and highly enriched signaling pathways. (C) GeneChip results showed that 6 pan‐neuronal genes whose mRNA expression levels were significantly upregulated in SOX11+ cells compared with control. (D) qRT‐PCR confirmed that the mRNA levels of the mentioned 6 pan‐neuronal genes were significantly increased in SOX11+ cells compared with control. Statistical difference was accepted when P < 0.05 compared to control. *P < 0.05, **P < 0.01, ***P < 0.001
Interestingly, compared with controls, the 6 neural marker genes of SOX11+ cells were significantly upregulated in three independent GeneChips, including DCX, HES1, MAP2, NES, TUBB3, and ZIC1 (Figure 2C). The results of qRT‐PCR confirmed that the above six genes were indeed upregulated in SOX11+ cells, and the levels of TUBB3 and MAP2 were markedly increased (Figure 2D).
3.3. As a downstream gene of SOX11, ZIC1 can also suppress cell growth and induce neuronal differentiation
Similar to SOX11, we also found that, after ZIC1 lentivirus infection for indicated days, the proliferation of ZIC1‐overexpressing U87 cells was significantly inhibited, and a distinct neuron phenotype with elongated projections appeared (Figure 3A). Fluorescence‐activated cell sorting (FACS) analysis also showed the cell cycle of ZIC1‐overexpressing cells was arrested in G0/G1 phase compared with control (Figure 3B).
Figure 3.
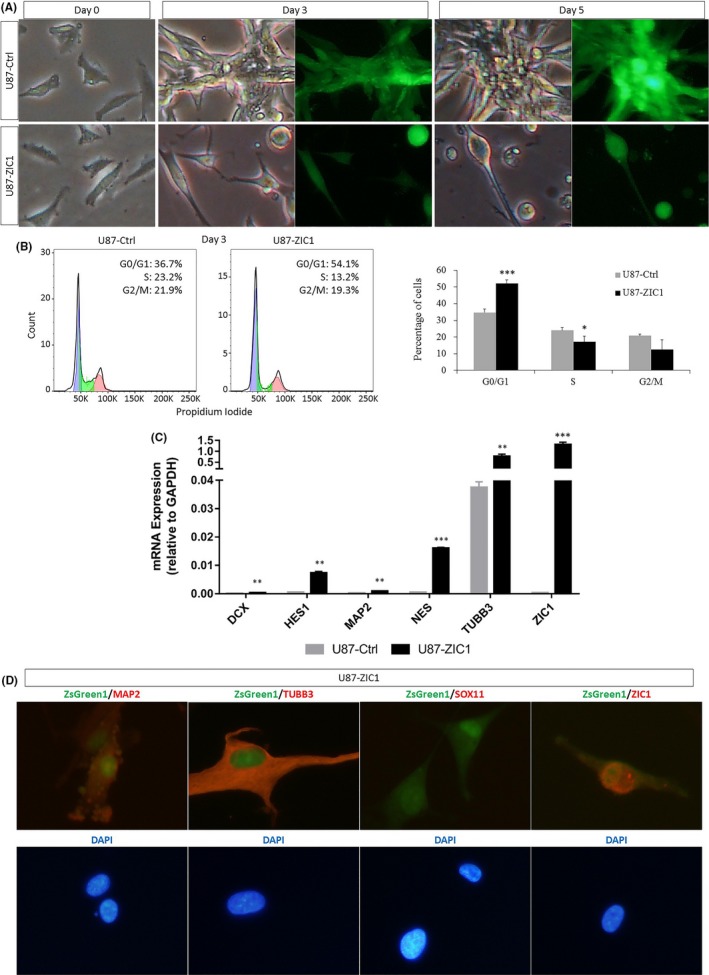
The downstream gene ZIC1 mimics the function of SOX11 in U87 cells. (A) The cell survival number markedly dropped 3 days after ZIC1 virus infection. (B) FACS revealed that ectopic ZIC1 significantly promoted cell cycle arrest 3 days after virus infection. Blue indicates cells within G0/G1 phase, green indicates cells within S phase, and red indicates cells within G2/M phase. Statistical difference was accepted when P < 0.05 compared to control. *P < 0.05, ***P < 0.001. (C) qRT‐PCR validates the expression of genes involved in neural differentiation. Statistical difference was accepted when P < 0.05 compared to control.**P < 0.01, ***P < 0.001. (D) Staining of ZIC1‐overexpressing cells (ZsGreen1+) co‐expressed with MAP2 and TUBB3 (indicated in red channel). Data were obtained from 10 randomly selected fields from triplicate samples
qRT‐PCR revealed that DCX, HES1, MAP2, NES, and TUBB3 were significantly upregulated in ZIC1‐overexpressing cells with TUBB3 increased the most (Figure 3C). Immunofluorescence results showed the elevated MAP2 and TUBB3 protein expression in ZIC1‐overexpressing cells compared with control (Figures 1D and 3D), and SOX11 could not be detected, which revealed that SOX11 is not a downstream target of ZIC1 (Figures 1D and 3D).
The above results revealed that as a downstream gene of SOX11, ZIC1 well mimicked the function of SOX11 to suppress cell growth and promote neuronal differentiation of U87 cells.
3.4. Downstream gene ZIC1 is crucial for neural induction of SOX11
To identify whether SOX11 protein can affect ZIC1 promoter activity, we constructed 2487 bp, 205 bp, 232 bp, 1248 bp, 1270 bp, and 1219 bp ZIC1 promoter‐fluorescent protein reporter genes (Figure 4A). The location of the ChIP‐qPCR product ChIP‐ZIC1promoter‐1 is shown in Figure 4A. Lentiviruses were packaged simultaneously using pLVX‐IRES‐ZsGreen1, pLVX‐SOX11‐IRES‐ZsGreen1, pLVX‐mCherry‐N1, and different lengths’ ZIC1 promoter‐fluorescent protein reporter genes. Four days after virus infection, these cells were imaged with a fluorescence microscope. Compared with control, SOX11 overexpression resulted in a significant upregulation of 2487 bp, 232 bp, 1270 bp, and 1219 bp ZIC1 promoter‐fluorescent protein reporter genes expression, with 2487 bp increased the most, while 205 bp and 1248 bp ZIC1 promoter‐fluorescent protein reporter genes showed almost no red fluorescence expression (Figure 4B), indicating that SOX11 upregulates the expression of ZIC1 by enhancing ZIC1 promoter activity of U87 cells. During ChIP experiment, the genomic DNA of the control group and the SOX11‐overexpressing group U87 cells was sonicated to 300‐700 bp (Figure 4C). The ChIP‐qPCR results showed that the SOX11 protein and the ZIC1 promoter have direct binding effect (Figure 4D). The above results indicated that SOX11 acts directly on the ZIC1 promoter to upregulate ZIC1 expression.
Figure 4.
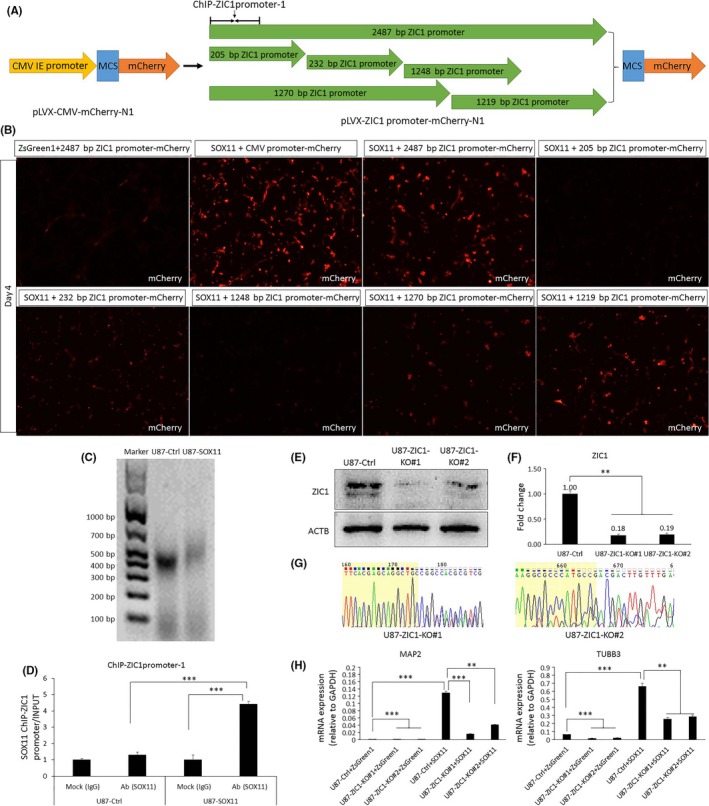
Initiating ZIC1 expression makes SOX11 more powerful in neural induction. (A) A schematic illustration of the construction of different lengths’ ZIC1 promoter‐fluorescent protein reporter gene, and the position of ChIP‐qPCR product ChIP‐ZIC1promoter‐1. (B) Four days after different combinations of lentivirus infection, U87 cells were captured using a fluorescence microscope. Compared with the control, SOX11 overexpression significantly upregulated mCherry expression initiated by ZIC1 promoter of 2487 bp, 232 bp, 1270 bp, and 1219 bp in length, respectively. (C) During ChIP experiment, the length of the genomic DNA fragments of U87 cells was 300‐700 bp after sonication. (D) ChIP‐qPCR assay detects the binding of SOX11 protein with ZIC1 promoter region. WB (E), qRT‐PCR (F), and Sanger sequencing (G) were used to detect ZIC1 knockout effects of U87‐ZIC1‐KO#1 and U87‐ZIC1‐KO#2, respectively. (H) ZIC1 deficiency resulted in significant suppression of SOX11‐induced upregulation of MAP2 and TUBB3 expression. Statistical difference was accepted when P < 0.05 compared to control. **P < 0.01, ***P < 0.001
To further clarify the role of ZIC1 as a target gene of SOX11 in neuronal induction, we used CRISPR/Cas9 technology to construct two ZIC1 knockout lines of U87 cells, named U87‐ZIC1‐KO#1 and U87‐ZIC1‐KO#2. Western blotting (WB), qRT‐PCR, and Sanger sequencing confirmed that ZIC1 was indeed knocked out (Figure 4E‐G). qRT‐PCR showed that ZIC1 deletion resulted in a significant suppression of SOX11‐induced neuronal induction compared to nontargeting control, which was demonstrated by downregulation of MAP2 and TUBB3 expressions.
3.5. ZIC1 could be a potential tumor suppressor gene for gliomas treatment
The Cancer Genome Atlas (TCGA) correlation analysis revealed that there is a strong correlation between SOX11 and ZIC1 in TCGA lower grade glioma dataset (normalized by TUBB3; Figure 5A). As a neuron‐specific cytoskeletal protein, high MAP2 expression means better overall survival in TCGA lower grade glioma, indicating that the neuronal differentiation strategy of glioma cells induced by SOX11 or ZIC1 can be used as a feasible method for gliomas treatment (Figure 5B).
Figure 5.
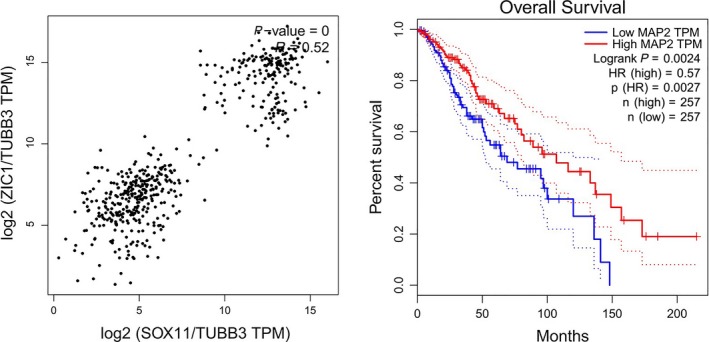
TCGA dataset analysis by GEPIA. (A) The correlation between SOX11 and ZIC1 in TCGA lower grade glioma dataset (normalized by TUBB3). (B) The overall survival of TCGA lower grade glioma dataset based on MAP2 expression
The relationship between SOX11 and ZIC1 and their neuronal induction function in glioma cells described above can be illustrated by Figure 6, indicating that ZIC1 could be a potential tumor suppressor gene for gliomas treatment.
Figure 6.

The relationship between SOX11 and ZIC1 and their neuronal induction of glioma cells are illustrated
4. DISCUSSION
Extremely rapid cell reproduction and progression are the primary cause of the fatality of human gliomas. In this study, we reported a basic transcription factors pathway for brain tumors by inducing gliomas cells into neuron‐like cells with low proliferative capacity through neurogenic transcription factor‐mediated reprogramming. Our results validated that separately overexpression of SOX11 or ZIC1 can efficiently inhibit cell proliferation of glioma cells and convert these cells into pan‐neuronal marker expressed neuron‐like cells. Because unsuitable culture conditions can cause neurons apoptosis, and the medium containing FBS is not suitable for the growth of neurons, which may explain the apoptosis of SOX11‐overexpressing U87 cells26 (Figure 1C). Therefore, we believe that inducing neuronal differentiation of glioma cells with SOX11 or ZIC1 may be more predominant than causing apoptosis. Moreover, this is the first description of the suppression function of ZIC1 in human glioma cells.
Of note, the morphology conversion of U87 cells into neuron‐like cells begins to appear 3 days after the cells infected with SOX11‐ or ZIC1‐expressing lentivirus. This was subsequently supported by the strikingly increase in neuronal marker expression in infected U87 cells which was clearly indicated by qRT‐PCR results. It was known that the reprogramming process is closely associated with the expression of DCX, a microtubule‐associated protein that is highly expressed in immature neurons and neuroblasts during the development.27 Overexpression of DCX was indicated to impede proliferation and invasion of glioma cells.28, 29 Thus, the induction of DCX expression by SOX11 or ZIC1 in U87 cells might cause cell growth arrest. TUBB3 is also an immature neuron protein in the early development stages of neuron differentiation.30 MAP2 is a neuron‐specific cytoskeletal protein that is frequently applied as a mature neuron marker of general neuron phenotype, and its expression appears to be confined to neurons and reactive astrocytes.31, 32 In this study, we have confirmed that SOX11 upregulates ZIC1 expression by binding with ZIC1 promoter and that various neural markers enriched in distinct neuron differentiation stages were highly expressed in SOX11‐ or ZIC1‐overexpressed cells. Collectively, these data indicate that ZIC1 partially mediates the neuronal induction function of SOX11 in U87 cells.
5. CONCLUSION
Our study confirmed that ZIC1, a direct target gene of SOX11, can well mimic the role of SOX11 in promoting neuronal differentiation and suppress cell growth of glioma cells, suggesting that ZIC1 may be a potential target for glioma treatment. These data raise the feasibility of molecular and cellular biology methodologies to deliver new pharmacological tools for reprogramming pathway discovery that can also act as checkpoints for differentiation agents combined with current standard therapies to treat different forms of gliomas.
CONFLICT OF INTEREST
The authors declare no conflict of interest.
ACKNOWLEDGMENTS
We thank Ping Wang for helpful discussion and valuable comments on the manuscript preparation. This work was supported by grants from National Key Basic Research Program of China (973 Program Grant 2014CB965001), National Natural Science Foundation (81550110259), and Shanghai Municipal Commission of Health and Family Planning Project (20174Y0174).
Fu J‐Q, Chen Z, Hu Y‐J, et al. A single factor induces neuronal differentiation to suppress glioma cell growth. CNS Neurosci Ther. 2019;25:486–495. 10.1111/cns.13066
The first two authors contributed equally to this work.
Contributor Information
Xian‐Zhen Chen, Email: chenxianzheny@126.com.
Chen Zhang, Email: zhangchen@tongji.edu.cn.
REFERENCES
- 1. Takahashi K, Yamanaka S. Induction of pluripotent stem cells from mouse embryonic and adult fibroblast cultures by defined factors. Cell. 2006;126(4):663‐676. [DOI] [PubMed] [Google Scholar]
- 2. Ieda M, Fu JD, Delgado‐Olguin P, et al. Direct reprogramming of fibroblasts into functional cardiomyocytes by defined factors. Cell. 2010;142(3):375‐386. [DOI] [PMC free article] [PubMed] [Google Scholar]
- 3. Tursun B, Patel T, Kratsios P, Hobert O. Direct conversion of C. elegans germ cells into specific neuron types. Science. 2011;331(6015):304‐308. [DOI] [PMC free article] [PubMed] [Google Scholar]
- 4. Liang XG, Tan C, Wang CK, et al. Myt1l induced direct reprogramming of pericytes into cholinergic neurons. CNS Neurosci Ther. 2018. [DOI] [PMC free article] [PubMed] [Google Scholar]
- 5. Omuro A, DeAngelis LM. Glioblastoma and other malignant gliomas: a clinical review. JAMA. 2013;310(17):1842‐1850. [DOI] [PubMed] [Google Scholar]
- 6. Hayden EC. Genomics boosts brain‐cancer work. Nature. 2010;463(7279):278. [DOI] [PubMed] [Google Scholar]
- 7. Jansen M, Yip S, Louis DN. Molecular pathology in adult gliomas: diagnostic, prognostic, and predictive markers. Lancet Neurol. 2010;9(7):717‐726. [DOI] [PMC free article] [PubMed] [Google Scholar]
- 8. Ohgaki H, Kleihues P. Epidemiology and etiology of gliomas. Acta Neuropathol. 2005;109(1):93‐108. [DOI] [PubMed] [Google Scholar]
- 9. Schonberg DL, Lubelski D, Miller TE, Rich JN. Brain tumor stem cells: Molecular characteristics and their impact on therapy. Mol Aspects Med. 2014;39:82‐101. [DOI] [PMC free article] [PubMed] [Google Scholar]
- 10. Aruga J, Minowa O, Yaginuma H, et al. Mouse Zic1 is involved in cerebellar development. J Neurosci. 1998;18(1):284‐293. [DOI] [PMC free article] [PubMed] [Google Scholar]
- 11. Inoue T, Ota M, Ogawa M, Mikoshiba K, Aruga J. Zic1 and Zic3 regulate medial forebrain development through expansion of neuronal progenitors. J Neurosci. 2007;27(20):5461‐5473. [DOI] [PMC free article] [PubMed] [Google Scholar]
- 12. Jaurena MB, Juraver‐Geslin H, Devotta A, Saint‐Jeannet JP. Zic1 controls placode progenitor formation non‐cell autonomously by regulating retinoic acid production and transport. Nat Commun. 2015;6:7476. [DOI] [PMC free article] [PubMed] [Google Scholar]
- 13. Urban S, Kobi D, Ennen M, et al. A Brn2‐Zic1 axis specifies the neuronal fate of retinoic‐acid‐treated embryonic stem cells. J Cell Sci. 2015;128(13):2303‐2318. [DOI] [PubMed] [Google Scholar]
- 14. Nakakido M, Tamura K, Chung S, et al. Phosphatidylinositol glycan anchor biosynthesis, class X containing complex promotes cancer cell proliferation through suppression of EHD2 and ZIC1, putative tumor suppressors. Int J Oncol. 2016;49(3):868‐876. [DOI] [PMC free article] [PubMed] [Google Scholar]
- 15. Qiang W, Zhao Y, Yang Q, et al. ZIC1 is a putative tumor suppressor in thyroid cancer by modulating major signaling pathways and transcription factor FOXO3a. J Clin Endocrinol Metab. 2014;99(7):E1163‐E1172. [DOI] [PubMed] [Google Scholar]
- 16. Wang LJ, Jin HC, Wang X, et al. ZIC1 is downregulated through promoter hypermethylation in gastric cancer. Biochem Biophys Res Commun. 2009;379(4):959‐963. [DOI] [PubMed] [Google Scholar]
- 17. Zhong J, Chen S, Xue M, et al. ZIC1 modulates cell‐cycle distributions and cell migration through regulation of sonic hedgehog, PI(3)K and MAPK signaling pathways in gastric cancer. BMC Cancer. 2012;12:290. [DOI] [PMC free article] [PubMed] [Google Scholar]
- 18. Gan L, Chen S, Zhong J, et al. ZIC1 is downregulated through promoter hypermethylation, and functions as a tumor suppressor gene in colorectal cancer. PLoS One. 2011;6(2):e16916. [DOI] [PMC free article] [PubMed] [Google Scholar]
- 19. Cheng YY, Kirschner MB, Cheng NC, et al. ZIC1 is silenced and has tumor suppressor function in malignant pleural mesothelioma. J Thorac Oncol. 2013;8(10):1317‐1328. [DOI] [PubMed] [Google Scholar]
- 20. Norsworthy MW, Bei F, Kawaguchi R, et al. Sox11 expression promotes regeneration of some retinal ganglion cell types but kills others. Neuron. 2017;94(6): 1112‐1120. [DOI] [PMC free article] [PubMed] [Google Scholar]
- 21. Su Z, Zang T, Liu ML, Wang LL, Niu W, Zhang CL. Reprogramming the fate of human glioma cells to impede brain tumor development. Cell Death Dis. 2014;5:e1463. [DOI] [PMC free article] [PubMed] [Google Scholar]
- 22. Liu ML, Zang T, Zou Y, et al. Small molecules enable neurogenin 2 to efficiently convert human fibroblasts into cholinergic neurons. Nat Commun. 2013;4:2183. [DOI] [PMC free article] [PubMed] [Google Scholar]
- 23. Zhang X, Huang CT, Chen J, et al. Pax6 is a human neuroectoderm cell fate determinant. Cell Stem Cell. 2010;7(1):90‐100. [DOI] [PMC free article] [PubMed] [Google Scholar]
- 24. Yang D, Zhang ZJ, Oldenburg M, Ayala M, Zhang SC. Human embryonic stem cell‐derived dopaminergic neurons reverse functional deficit in parkinsonian rats. Stem Cells. 2008;26(1):55‐63. [DOI] [PMC free article] [PubMed] [Google Scholar]
- 25. Tang Z, Li C, Kang B, Gao G, Li C, Zhang Z. GEPIA: a web server for cancer and normal gene expression profiling and interactive analyses. Nucleic Acids Res. 2017;45(W1):W98‐W102. [DOI] [PMC free article] [PubMed] [Google Scholar]
- 26. Kaech S, Banker G. Culturing hippocampal neurons. Nat Protoc. 2006;1(5):2406‐2415. [DOI] [PubMed] [Google Scholar]
- 27. Brown JP, Couillard‐Despres S, Cooper‐Kuhn CM, Winkler J, Aigner L, Kuhn HG. Transient expression of doublecortin during adult neurogenesis. J Comp Neurol. 2003;467(1):1‐10. [DOI] [PubMed] [Google Scholar]
- 28. Santra M, Santra S, Roberts C, Zhang RL, Chopp M. Doublecortin induces mitotic microtubule catastrophe and inhibits glioma cell invasion. J Neurochem. 2009;108(1):231‐245. [DOI] [PMC free article] [PubMed] [Google Scholar]
- 29. Santra M, Zhang X, Santra S, Jiang F, Chopp M. Ectopic doublecortin gene expression suppresses the malignant phenotype in glioblastoma cells. Cancer Res. 2006;66(24):11726‐11735. [DOI] [PubMed] [Google Scholar]
- 30. Mariani J, Coppola G, Zhang P, et al. FOXG1‐dependent dysregulation of GABA/glutamate neuron differentiation in autism spectrum disorders. Cell. 2015;162(2):375‐390. [DOI] [PMC free article] [PubMed] [Google Scholar]
- 31. Dehmelt L, Halpain S. The MAP2/Tau family of microtubule‐associated proteins. Genome Biol. 2005;6(1):204. [DOI] [PMC free article] [PubMed] [Google Scholar]
- 32. Geisert EE Jr, Johnson HG, Binder LI. Expression of microtubule‐associated protein 2 by reactive astrocytes. Proc Natl Acad Sci USA. 1990;87(10):3967‐3971. [DOI] [PMC free article] [PubMed] [Google Scholar]


