An official website of the United States government
Here's how you know
Official websites use .gov
A
.gov website belongs to an official
government organization in the United States.
Secure .gov websites use HTTPS
A lock (
) or https:// means you've safely
connected to the .gov website. Share sensitive
information only on official, secure websites.
As a library, NLM provides access to scientific literature. Inclusion in an NLM database does not imply endorsement of, or agreement with,
the contents by NLM or the National Institutes of Health.
Learn more:
PMC Disclaimer
|
PMC Copyright Notice
This is an open access journal, and articles are distributed under the terms of the Creative Commons Attribution-NonCommercial-ShareAlike 4.0 License, which allows others to remix, tweak, and build upon the work non-commercially, as long as appropriate credit is given and the new creations are licensed under the identical terms.
With the advancements in precision medicine and imaging and computational technology, digital pathology is now considered one of the most promising fields of digital health. Pathology Visions 2018 (PV18), the annual meeting of the Digital Pathology Association (DPA), celebrated nine years as the leading event dedicated to advancing the field of digital pathology. This conference brings pathologists, scientists, technologists, administrators and industry partners together, sharing the cutting-edge knowledge of digital pathology applications in healthcare and life sciences.
This year, participants heard from keynote presenter Jeroen van der Laak who discussed “Computational Pathology: Where Are We Now?”, plenary presenter Liron Pantanowitz on “Evolution of Digital Pathology = Revolution of Medicine” as well as many more timely presentations and workshops by distinguished speakers in two simultaneous Clinical and Education & Research Tracks. Additional presentations included preconference and breakfast workshops. The distinguished presenters were from all over the world including the United States, Canada, Europe and Asia.
Travel award recipients and poster award winners were recognized at PV18; please join us in congratulating them! 2018 travel award recipients: Hoa Pham, MD, Nagasaki University Hospital; Supasan Sripodok, MD, Ramathibodi Hospital, Mahidol University; and Christina Zioga, MD, Aristotle University of Thessaloniki. 2018 poster award winners: An AI-based Quality Control System in a Clinical Workflow Setting presented by Daphna Laifenfeld, Ibex Medical Analytics (Best Clinical); Visualizing the changes in cytotechnology students’ performance in evaluating digital images presented by Maheswari (Manju) Mukherjee, University of Nebraska Medical Center (Best Education); Mid-IR Label-Free Digital Pathology for the Identification of Biomarkers in Tissue Fibrosis presented by Michael Walsh, University of Illinois at Chicago (Best Research); Double-step of deep learning algorithm decrease error in detection of lymph node metastasis in lung cancer patients presented by Hoa H.N. Pham, Nagasaki University Hospital (Best Image Analysis); Application of live dynamic whole slide imaging to support telepathology in intraoperative frozen section diagnosis presented by Ifeoma Onwubiko, Henry Ford Health System (Best Resident).
This conference offered a wide range of topics including whole slide imaging, image analysis, and deep learning for clinical diagnosis, education and research. PV18 provided attendees with the opportunity to meet with experts and peers in digital pathology through networking events including two receptions, refreshment breaks and lunches that also provided opportunities to meet leading industry vendors who were excited to exhibit their newest and best products. Connect-a-thon, round-table discussions, regulatory and standards sessions and timely hot topics rounded out the program.
Pathology Visions provides an excellent archive of learning material. Following the conference, recorded presentations are posted to the DPA website. Oral and poster presentation abstracts are published in this issue of the Journal of Pathology Informatics.
We are very excited about the record number of attendees and exhibitors at PV18. Together, we bring the future into focus with the greatest advances in the field of digital and computational pathology.
A special thanks to this year's Program Committee:
J Pathol Inform. 2019 Apr 1;10:10.
Oral Abstracts: Computational Pathology: Where Are We Now?
Advances in machine learning have propelled computational pathology research. Today, computer systems approach the level of humans for certain well-defined tasks in pathology. At the same time, pathologists are faced with an increased workload both quantitatively (numbers of cases) and qualitatively (the amount of work per case; with increasing treatment options, the data delivered by pathologists is also expected to become more fine-grained). In this presentation I will address the potential of machine learning techniques, and discuss how these may alleviate the challenges of pathologists. Potential solutions range from computer aided support for relatively straightforward tasks to discovery of innovative prognostic and predictive biomarkers. The most basic applications mostly deal with detection problems (lymph node metastases, mitotic cells), and have the potential to increase efficiency of the pathological diagnostic workflow. Expectedly, the first algorithms of this kind will be commercially available within the next few years. On the other end of the spectrum are models that can assess sub-visual morphological information, potentially playing a role in personalized medicine. With increasing complexity of the applications comes an increasing demand for large, well-curated data-sets. This poses challenges for researchers and algorithm developers, as data collection is cumbersome and expensive. Still, the potential for computational pathology is large and applications will definitely play a role in the future of pathology.
The Pathology and Lab Medicine (PALM) domain of the Integrating the Healthcare Enterprise (IHE) organization has collaborated with DICOM (Digital Imaging and Communications in Medicine) working group 26 to propose an initial draft solution supporting an environment of interoperability among vended digital pathology instrumentation and systems focused on acquisition of digital assets critical for anatomic pathology diagnostics. Digital imaging in anatomic pathology typically spans two primary aspects of the conventional workflow, notably the gross/macroscopic examination and the histologic / microscopic examination. Currently there is minimal formal literature that speaks to optimal interactions amongst vended solutions. This gap might be filled through documentation of precise descriptions of how best to accommodate the requirements of the most prevalent requirements within the market. Whole slide imaging (WSI) has the potential to (and likely will) reinvent the processes in the anatomic pathology laboratory information systems (AP-LIS). The advent of WSI technology is a catalyst for change. The authors propose a set of systems (actors) and critical activities (transactions) that will help facilitate interoperability and value of vended digital pathology solutions including the AP-LIS, image scanners, and image archives/PACS. This effort represents an important beginning of a long-term collaboration. There is more to digital pathology than just supporting WSI and associated instrumentation, although it is noted that this innovation is a catalyst for change and has enabled a significant evolution of workflow and advancement of the field.
Background: Educational use cases for digital pathology have been a core use case for many years. However, only a few educational focused software platforms have been developed. We have implemented a dedicated educational software platform (Philips Tutor) for more than a year. The aim of this talk is to share our experience using this digital education tool.
Methods: Philips Tutor was deployed at UPMC as a web-based application to provide our trainees access to whole slide images and educational content. User profiles were tailored with permissions for the material that they are interested in.
Results: The principle use cases include weekly unknown conferences for the residents/housestaff, fixed educational courses (cytotechnologist school) and slide teaching sets. We have been able to run 48 weekly unknown conferences during a year and a half time period. Recently we introduced a compliance/competency test into the environment.
Conclusions: We have found that using a dedicated educational platform is helpful for segregating the educational digital materials from the clinical material and easier to maintain form an IT perspective. Future work that we would like to engage in includes exams with annotations as answers, random question generation and personal slide recuts.
J Pathol Inform. 2019 Apr 1;10:10.
Complete Digital Pathology for Primary Diagnosis: Thirty Months’ Experience at Granada University Hospitals, Spain
Granada University Hospitals comprises two teaching and two district general hospitals integrated in the public health system in southern Spain. We report on the transition to full digital pathology for primary histopathology diagnosis and our experiences since its implementation in 2016.
J Pathol Inform. 2019 Apr 1;10:10.
Predicting Cancer Outcomes from Histology and Genomics Using Deep Learning
Background: Accurately predicting the clinical outcomes of patients diagnosed with cancer is essential for effective treatment. Despite advances in genomics, prognostication often relies on a small number of molecular biomarkers and subjective manual histologic analysis. Computational analysis of digital pathology and high-dimensional genomic data present opportunities to improve prognostic accuracy, however, significant challenges exist in creating algorithms to learn prognostic patterns from this data, and in integrating histology and genomics into a unified prognostic model.
Methods: We developed a new approach that combines deep learning algorithms with conventional survival modeling techniques to predict the clinical outcomes of patients diagnosed with glioma using histology images and genomic biomarkers. We compare these models to WHO classification based on genomic testing and manual histologic grading performed by pathologists using whole-slide images, genomics, and overall survival data from 769 gliomas in The Cancer Genome Atlas. To gain insights into deep learning survival models, we also developed a visualization framework to examine the histologic and molecular patterns that these models associate with poor clinical outcomes.
Results: Our approach surpassed the prognostic accuracy of human experts using the current clinical standard for classifying diffuse gliomas. Visualization revealed that deep learning survival models recognize important histologic structures and molecular biomarkers that are related to prognosis, and that are used by pathologists in grading and molecular classification.
Conclusions: These results highlight the emerging role of deep learning in precision oncology and suggest an expanding utility for computational analysis of histology and genomics in the future practice of pathology.
J Pathol Inform. 2019 Apr 1;10:10.
The Impact of Next-Generation Sequencing on Whole Slide Imaging
Next-Generation Sequencing (NGS) has revolutionized diagnostic molecular testing. Accordingly, many pathology labs today either offer NGS or send out their samples for molecular testing. Not surprisingly, there are various ways in which NGS has started to influence WSI. For example, WSI offers a mechanism to immortalize slides that get sacrificed for molecular testing. Unfortunately, many labs still rely on manual methods instead of digital tools to designate which regions need to be tested or employ image analysis to automate tumor analysis for molecular testing. Image-driven laser capture dissection is a novel mechanism that can be employed to address this problem, as well as automate and scale up NGS testing. NGS data also has great potential when used to help develop deep learning algorithms for digital pathology. This talk explores how NGS is beginning to impact WSI and addresses all of the aforementioned topics.
J Pathol Inform. 2019 Apr 1;10:10.
A Comprehensive Study of Robotic Digital Microscope and Whole Slide Imaging for Adequacy and Preliminary Diagnosis in Fine Needle Aspiration Cytology
Background: Remote assessment of fine needle aspiration (FNA) adequacy using telecytology is in high demand given its important impact on diagnostic quality of FNA materials and disperse nature of FNA clinics. Here we explored the performance of using a robotic digital microscope (RDM) and whole slide imaging (WSI) as potential substitutes for FNA onsite adequacy evaluation.
Methods: Sixty FNA cases from different anatomic sites were assembled based on our routine workflow, including 30 neoplastic, 24 benign, and 6 inadequate cases. One representative Diff-Quik stained slide was selected from each case. Two cytopathologists (A and B) independently reviewed all cases using three methods (conventional light microscopy (CLM), RDM with VisionTek M6 and WSI scanned by Hamamatsu NanoZoomer) with a washout period of at least fourteen days between any two methods.
Results: The adequacy concordance rate between RDM and CLM was 100% for cytopathologist A and 95% for B. The adequacy concordance rate between WSI and CLM was 98% for A and 97% for B. For preliminary diagnosis, across all different diagnostic categories, RDM achieved 92% concordance against CLM for A and 83% for B. WSI achieved 97% concordance against CLM for A and 87% for B. No significant difference was identified among all comparasions.
Conclusion: Our study is the first attempt to have a side-by-side performance comparison between glass slide, RDM, and WSI for FNA adequacy evaluation. Our data demonstrate that both RDM and WSI are suitable for remotely evaluating FNA adequacy and providing relatively accurate preliminary diagnosis.
J Pathol Inform. 2019 Apr 1;10:10.
Image Analysis Validation and Execution for Clinical Trial Biomarker Endpoints
Background: Digital pathology and image analysis have become cornerstones of translational research, transforming tissue pathology-based biomarker strategies for drug development. In some cases the speed of technological innovation in the tissue biomarker space has outpaced data managers and clinical teams working to bring new drugs to market. At this interface between research and the clinic, standardization of image analysis methods and the adoption of end-to-end digital pathology is necessary to preserve data integrity and deliver new medicines to patients quickly and safely.
Methods: This presentation will discuss the multi-faceted approach to validation and delivery of quantitative tissue biomarker data to support secondary and exploratory biomarker endpoints for phase I and II clinical trials across diverse therapeutic areas. Harmonization of IHC assay validation with digital image algorithm validation will be discussed, along with validation of multiplex and other specialized algorithms. Operating considerations, system validation and administration, and data lifecycle management and delivery under FDA GCP guidelines will be addressed.
Results: Adoption of enterprise digital workflows allows greater adherence to GCP practices and the timely delivery of high-quality clinical data, as well as improving transfer of tissue biomarker methods from preclinical discovery to clinical trials. Standardization of digital image analysis facilitates more quantitative tissue biomarker endpoints for clinical trials allowing clinical teams to make more informed decisions.
Conclusions: Digital pathology enables quantitative image analysis that is now the standard for tissue biomarker data delivery for clinical trials, but continual refinement of workflows and implementation of new biomarker technologies that will further inform clinical teams is ongoing.
J Pathol Inform. 2019 Apr 1;10:10.
End-to-end Learning Using Convolutional Neural Networks to Predict Survival in Patients with Gastric Cancer
Background: We applied a survival convolutional neural network (CNN) approach on immunohistochemically (IHC) stained tissue microarrays (TMAs) from gastric cancer (GC) patients to directly learn survival-related risk values for patient stratification. Methods Image patches (80 μm x 80 μm) were extracted from 469 TMA cores from 248 patients, scanned after IHC for CD8 and KI67. For each stain, survival CNNs were trained to maximize a log partial likelihood derived from the Cox proportional hazards model and to predict patch-based risks for cancer-specific death in a 10-fold pre-validation procedure. Patient risks were assessed by averaging the risks from each patients patches.
Results: Stratifying patients into low- and high-risk groups by taking the cohort median as threshold led to a significant log-rank test p-value (<0.01). Whereas Kaplan-Meier curves for TNM staging 2A, 2B, and 3A had no significant prognostic value, the risk score significantly stratified the same subcohort (p<0.05; median as threshold). Visual assessment of the risk heatmaps revealed an association of low-risk regions with clusters of CD8(+) cells and presence of CD8(+) cells in stroma, whereas tumor epithelium and stroma regions with a low density of CD8(+) cells are associated with higher risks.
Conclusions: We applied survival CNNs to digital IHC-stained GC tissue sections to directly associate image regions with risk for cancer-specific death. This information may be used to deepen our knowledge on how tissue morphology relates to survival. Our findings will be extended to other biomarkers and will be validated using data from another clinical site.
J Pathol Inform. 2019 Apr 1;10:10.
Preparing Digital Pathology Data for Machine Learning Experiments
Background: With the advent of convolutional neural networks in recent years, machine learning is becoming increasingly accessible to researchers from non-computer science background. However, preparing data for machine learning remains a crucial step which requires hands-on expertise.
Prerequisites: We assume familiarity with Python programming language and numpy package. Participants are welcome to bring their own digital slides for analysis. Participants will benefit most if they bring a laptop computer with Python3.4+ installed. Methods: In this tutorial we will use OpenSlide library and XML library to load digital slides and their annotation. As an example we will use a set of kidney digital pathology slides acquired and annotated with Leica Aperio software. We demonstrate how to load slides and annotation and how to save images suitable for a machine learning experiment.
J Pathol Inform. 2019 Apr 1;10:10.
The Role of the Laboratory Information System in Digital Pathology: Driver, Passenger or Bystander?
This workshop will discuss the issue of LIS integration in the move to full digital adoption for clinical diagnostics. The panelists will discuss three options: (i) The LIS as the driver with the digital imaging system (DIS) tied to the LIS; in this model the LIS will be integral in housing/viewing/managing the images and/or the workflows. (ii) The digital cockpit as the driver and the LIS working in the background as a passenger; in this model, the focus is on the DIS for housing, viewing and managing the images and workflows. (iii) The LIS as a passive bystander; in this model, a middleware connects the LIS and the DIS together seamlessly. The workshop is intended to be an open and interactive discussion with full audience participation. The goal is to raise awareness of the importance of workflow to the success of adoption of digital pathology and to identify the strengths and weaknesses of the various models.
Image collaboration underpins the considerable energy and efforts expanded to extract information from whole slide digital images. Detailed analysis of the tumor microenvironment is an example of such a purpose that provides impetus to enable digital pathology in the laboratory. Pathologists, researchers and AI experts have developed sophisticated and imaginative tools for analysis, interrogation and discovery. To fully experience the power and utility of these applications, there is an expectation for seamless image collaboration and exchange between users who desire a simple yet comprehensive workflow that integrate their applications of choice. Commercial vendors have started to undertake the challenge to provide such simplicity from a complex array of technologies. This year, Pathology Visions has invited 3 such platform providers to share their image collaboration innovations through the perspective of their clients. Come join us to see how these technologies are being used in research, clinical and commercial laboratory settings. The speakers will discuss solutions for collaboration workflows, security and de-identification, cloud versus on premise deployment, appropriate staffing and other topics that are on the checklist of any organization looking to implement a digital pathology solution to their laboratory. The session includes a Q&A with the expert speakers.
J Pathol Inform. 2019 Apr 1;10:10.
Evolution of Digital Pathology: Revolution of Medicine
This plenary presentation will convey the evolution of digital pathology from the personal perspective of Dr. Pantanowitz. His tale will point out how for every two steps forward we have had to sometimes take one step backwards. Along this journey we have created telepathology tools to address disparities in care, allowed several labs around the world to go fully digital, established attractive new business models, enthused guidelines to be developed to standardize care and promote best practices, and are feeding many deep learning projects to make next-generation tools. This digital revolution is enabling pathology to meet the demands of modern medicine and is connecting pathologists with the rest of healthcare which has already undergone a digital transformation. Digital pathology is contributing to emerging fields in medicine such as immune-oncology. This talk is intended to beckon pathologists to add these new tools to their toolbox. In so doing, digital pathology will help catapult them into a future where every patient can gain access to an expert pathology opinion and all pathologists can count on computer aided diagnostic tools.
J Pathol Inform. 2019 Apr 1;10:10.
Artificial Intelligence and Computer-Assisted Diagnosis for Pathologists
Background: Artificial intelligence (AI) is a powerful technology, but pathologists do not yet know how it could be applied in clinical work. Yet pathologists must participate in AI development to remain relevant in the future. Herein we will discuss practical aspects of our group's work, including ground truth data acquisition, demonstration of AI's potential impact on efficiency, informatics tools that will be needed to implement AI and approaches to developing AI by and for pathologists.
Methods: Work from several studies will be presented including an overview of pCAD (computer-assisted diagnosis for pathologists), a theoretical framework for automating pathology work. Simulations of workflow models will be presented. Whole slide image (WSI) annotation techniques will also be presented. Finally, laboratory information system (LIS) and WSI viewer considerations will be addressed.
Results: The pCAD framework is a paradigm that focuses pathologist expertise on executive decisions that only they can make; this was demonstrated in a prototype demo. Simulations demonstrated 56% reduction in time to read breast biopsies. Advances in WSI annotation enabled super-rapid labeling of 93 WSIs by three pathologists. Current LIS and WSI viewers could support pCAD with use of structured data.
Conclusions: Pathologists are an increasingly scarce healthcare resource. AI is a compelling tool that could improve efficiency and provide next-generation analyses of complex biomarker and genomics data. Pathologists must be active in AI development and implementation, or risk being bypassed. As automation increases, pathologists should also assess their true value to the healthcare team.
J Pathol Inform. 2019 Apr 1;10:10.
Opportunities for Discovering Novel Prognostic Biomarkers with Computational Pathology
Background: Histopathologic classification of cancer precursors based on the arrangement, nuclear cytology and proliferation of epithelial cells is used to guide clinical management, although prognostic accuracy at the individual level is limited. Data suggest that methods ranging from morphometry to convolutional neural network (CNN) analysis may improve classification of precursors by assessing features that are not routinely assessed microscopically. We will discuss and illustrate opportunities for discovering novel prognostic markers for cancer precursors using examples from breast pathology.
Methods: Example 1: Using digitized H&E stained sections from radiologically-guided breast biopsies we trained a CNN based on stroma to discriminate invasive breast cancer (BC) from benign breast disease (BBD), and then tested the algorithm in DCIS to identify associations with grade, another prognostic factor.
Example 2: In the Mayo BBD cohort, which includes ~14,000 women with benign biopsies and >1,200 incident BCs in follow-up, we assessed morphometric analysis of “normal” background lobules as a predictor of risk of incident BC.
Results: Example 1: A CNN trained on stroma can discriminate invasive BC from BBD (AUC=0.962) and distinguish grade 3 from grade 1 DCIS, without additional tuning.
Example 2: Increased lobular involution is related to lower incident BC risk for every BBD category; for example: atypical hyperplasia (AH) with complete involution confers a RR=7.79 versus AH with no involution, which yields a RR=1.49.
Conclusion: Microscopic characterization of stroma and normal structures is difficult, whereas computational pathology offers untapped potential to improve classification of BBD and DCIS by analyzing these features.
J Pathol Inform. 2019 Apr 1;10:10.
Counting versus Measuring and Segmentation versus Molecular Colocalization
In situ assessment of protein expression has long be plagued by inaccuracy or technologies that work on some tissues but not others. Years of effort in this field, and the recent introduction of new software and new approaches is improving the accuracy, but we are still not there yet. Here we show new data on methods for assessment of protein on slides comparing pixel-based colocalization software (AQUA) with phenotype and count software (InForm) and segment and count software (QuPath and Halo). We show the advantages and disadvantages of each in the context of melanoma and lung cancer, always trying to use outcome as a criterion standard. Finally, we show how use of defined cell line standards can be used for definition of thresholds to standardize software and IHC assessment between lab sites and between software packages.
J Pathol Inform. 2019 Apr 1;10:10.
Development and Validation of Multiplexed Immunohistochemistry for the Quantitative Phenotyping of Immune Cell populations in Patient Tumor Samples
With the success of immuno-oncology treatment strategies, there is an increasing need to investigate response – resistance mechanisms in order to optimize therapeutic regimens and develop combination strategies. Fluorescent multiplexed immunohistochemistry (fmIHC) enables translational researchers to characterize immune cell populations within patient tumor samples to further our biological understanding into response/resistance profiles. Many preanalytical factors affect staining quality of fmIHC, such as antibody - fluorophore pairing, antibody staining sequence, antibody stripping efficiency, and intrinsic tissue heterogeneity. Here we describe a standardized workflow for time efficient development and validation of immune-fluorescence multiplex biomarker panels on patient tumor samples. Serial sections of formalin fixed paraffin embedded human tumor TMAs were immunostained with a panel of six analytes (GITR, Lag3, FoxP3, CD155, CD8, cytokeratin) using Opal reagent and the BOND RX autostainer (Leica). Whole slide images were acquired with the Vectra/inForm imaging system (Perkin Elmer). Multispectral image tiles were stitched using a Matlab script. Halo software (Indica Labs) was used for analyte quantification and signal intensity measurement. Our workflow integrates pathologists’ gold-standard evaluation with image analysis to validate analyte expression in terms of specificity and reproducibility. This staining panel has been applied to an archival human pancreatic tumor cohort (n=46), with automated quantification of analytes compared to pathologist evaluation of singleplex chromogenic IHC performed on the same tissues to confirm reliability. Our workflow for developing multiplex panels to phenotype and quantitate immune cell populations is suitable for exploratory analysis of clinical tissue specimens.
J Pathol Inform. 2019 Apr 1;10:10.
The Resources and Guides in DIgital Pathology for Practicing Pathologists
1Department of Anatomic Pathology, Analytic Microscopy Core Facility, H. Lee Moffitt Cancer Center, Tampa, Florida, USA. E-mail: marilyn.bui@moffitt.org
1Department of Anatomic Pathology, Analytic Microscopy Core Facility, H. Lee Moffitt Cancer Center, Tampa, Florida, USA. E-mail: marilyn.bui@moffitt.org
The factors that influence the adoption of digital pathology in US for patient care purpose include the mentality of the pathologists as well as legal, financial and technological challenges. The barriers are gradually breaking down and digital pathology is gaining momentum which is demonstrated by the FDA approval of the first whole slide imaging system for primary diagnosis, recent advance in computational and imaging system, and more US labs are incorporating digital pathology in their practice. The Digital Pathology (DP) Committee of the College of American Pathologists (CAP) is committed to serve as a respected resource for information and education for pathologists, patients and the public on the practice and science of digital pathology. The Committee has produced The Digital Pathology Resource Guide, publications in Archives in Pathology & Laboratory Medicine, and a CAP webinar which are accessible to pathologists and public. This talk is the continuum of this educational effort by addressing the commonly asked questions from practicing pathologists in digital pathology. Helpful resources and practical issues such as guidelines, validation and accreditation requirement will be discussed. This presentation will help practicing pathologist to take advantage of what DP has to offer as an enabler of better patient care.
J Pathol Inform. 2019 Apr 1;10:10.
Searching for Similar Scans in Digital Pathology - A First Comprehensive Report
Large archives of digital scans in pathology are slowly becoming a reality. The amount of information in such archives is not only overwhelming but also not easily accessible yet. Fast and reliable search engines, customized for histopathology to perform content-based image retrieval (CBIR), are urgently needed to exploit the evidence-based knowledge from past cases and make them available to the pathologist for a more efficient and more informed decision making. Through an ensemble approach, we designed a reliable search engine prototype that exploits the strengths of both handcrafted and deep features for image characterization. We examined multiple similarity measures to increase the matching rate when comparing images. The idea of “barcodes” was subsequently used to considerably accelerate the retrieval process. As there are generally no labelled images produced during the clinical workflow in digital pathology, the accuracy of search and retrieval can only be measured by expert's feedback. 300 scans across more than 80 different categories (brain, prostate, breast, kidney, salivary gland, skin etc.) were collected and indexed. 100 sample regions were randomly selected for search. The retrieval results were then evaluated by the pathology expert and then converted into an accuracy value. The experiments show highly accurate results. The image search can provide the pathologist with unprecedented access to the evidence embodied in diagnosed and treated cases from the past. Our preliminary results on a small but extremely diverse dataset demonstrates the feasibility of such technology and justifies further investigations.
J Pathol Inform. 2019 Apr 1;10:10.
Case Studies in Interoperability in Digital Pathology Workflow: Real World Examples of LIS-Integration with Digital Pathology Systems
The adoption of digital pathology offers benefits over labor-intensive, time-consuming and error-prone manual processes. However, because most workflow and lab transactions are centered on the Laboratory Information System (LIS), adoption of digital pathology ideally requires integration with the LIS. The goal of this workshop is to present case studies where three sites who have implemented digital pathology at their hospitals will provide practical insights into the solution that was deployed or is being implemented with an emphasis on interoperability with LIS systems, imaging systems, storage and infrastructure and the unique workflow solutions at each of these three sites. The vendors and the clients will jointly present and discuss the challenges and barriers that were encountered and how with innovation and technology, a specific clinical workflow problem was solved.
J Pathol Inform. 2019 Apr 1;10:10.
Lessons Learned from Radiology's Workflow and AI Spaces
Given Radiology's inherent two to three-decade lead time in acquiring substantial operational experience from the generation, curation and use of diagnostic digital imagery, it is beneficial to examine which approaches and methodologies have been effective and which ones have not. This panel discussion will be led by individuals who are familiar with the trajectory of both Radiology's and Pathology's digital imaging utilization for both routine diagnostics as well as more advanced computational use-cases, such a machine learning, CAD and decision support tools.
J Pathol Inform. 2019 Apr 1;10:10.
Have Regulations and Standards Impact on Interoperability and Algorithms?
During this presentation, the Regulatory and Standards Taskforce will discuss how and if regulations & standards such as DICOM could have an impact on interoperability. Where are the hurdles today and can we overcome them in the future? This is especially important to enable and open digital pathology for precision medicine. Analytical algorithms, either developed under the traditional learning or deep learning, need to be able to be safely and effectively run on every file format. How could regulations & standards bring the future into focus?
J Pathol Inform. 2019 Apr 1;10:10.
Poster Abstracts: Overcoming Limitations of Conventional Fluorescence Slide Scanning with Multispectral Approaches
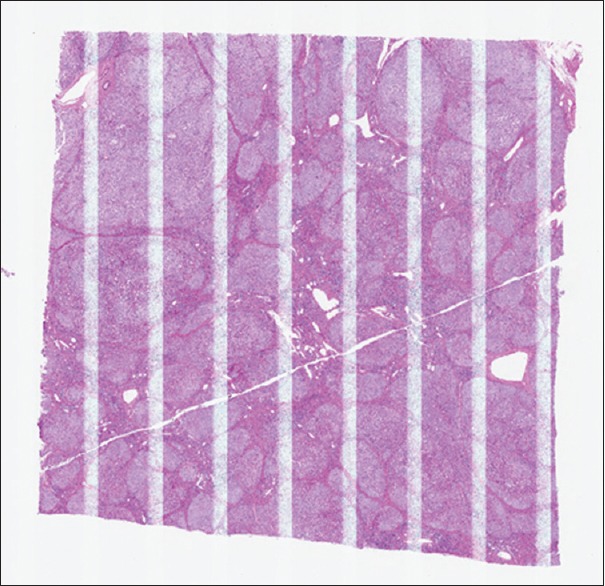
Introduction: Fluorescence imaging enhances quantitation in digital pathology by providing linear readouts of multiple marker expressions. However, conventional fluorescence IHC is typically limited to 3-4 markers and can be confounded by tissue autofluorescence. Multispectral imaging expands the number of distinguishable markers and can robustly remove autofluorescence. However, to date, field-based rather than whole slide imagery and extended acquisition times have been disadvantages compared to conventional digital pathology. Here, we demonstrate and validate a novel, high-throughput method that can acquire a multispectral scan of a 1x1.5 cm tissue section in ~6 minutes, providing an unmixed digital slide that distinguishes up to 6 markers and counterstain with autofluorescence removal. This streamlined workflow enables assessment of cell phenotypes and functional states across the entire digital slide, enabling investigations of spatial relationships from the scale of cell-to-cell interactions to macroscopic tissue architecture.
Methods: Formalin-fixed paraffin-embedded samples of primary tumors were immunostained using Opal™ reagents. Conventional and multispectral digital scans were acquired on a Vectra™ Polaris® automated imaging system and analyzed with inForm® and MATLAB® software.
Multispectral Imaging on Vectra Polaris: Multispectral imaging on the Vectra Polaris is built upon an epifluorescence light path. Different combinations of agile LED bands, bandpass excitation filters, bandpass emission filters, and a liquid crystal tunable filter (LCTF) are used to select narrow spectral bands that reach the imaging sensor. For each spectral band, an image is acquired and added to a ‘data cube’ that contains up to 40 spectral layers. The data from all spectral layers is then linearly unmixed using previously-determined pure emission spectra for each fluorophore using inForm® software. Intensity values in the resulting ‘unmixed’ image are directly related to the amount of each dye present.
Novel High-speed Multispectral Scanning Method: Typical multispectral imaging workflows can accommodate a wide range of fluorophores, but can be time consuming as they require up to 40 spectral layers to unmix 7 fluorophores, and often require exposure times in the hundreds of milliseconds.
Here, we have developed a high-throughput multispectral scanning approach by optimizing a multispectral workflow for a specific set of 7 fluorophores:
We applied computational modeling to determine a minimal set of spectral bands to unmix 7 optimized fluorophores and tissue autofluorescence.
This includes two new Opal™ fluorophores: Opal 480 & Opal 780
We minimized the number of mechanical filter movements using agile LED illumination and multiband filters.
We decreased exposure times down to tens of milliseconds with efficient filter pairings and Opal™ amplification.
This arrangement provides robust unmixing of all 7 fluorophores from tissue autofluorescence, and from one another [Figure 1].
Whole slide scans of lung cancer FFPE tissue section captured in 6 minutes. Top) Conventional narrowband scan acquired with bandpass filters optimal for Opal fluorophores. Bottom) Unmixed multispectral scan that removes crosstalk and autofluorescence. Arrows indicate autofluorescence contamination; asterisks indicate crosstalk from a spectrally adjacent band
Reducing autofluorescence contributions for all immune markers, lowering the limit of detection and extending the dynamic range of some channels by more than 30-fold.
Reducing crosstalk from more than 8% to under 3% (typically <0.5%), thereby reducing false colocalization between non-colocalized markers.
The novel multispectral scanning method described here overcomes limitations imposed by crosstalk and autofluorescence, expanding the number of probed targets and improving analytical performance.
This streamlined workflow enables multiplexed studies at the throughput required for translational studies of cellular phenotypes and interactions across an entire slide, and provides the ability to quickly re-analyze imagery as new biological understanding emerges.
Background: Digital pathology methods are of growing value for studying fluorescently-labeled samples, to obtain quantitative expression measures and to take advantage of multiple markers. At the same time, multiplexed immunofluorescence (mIF) labeling techniques and multispectral imaging systems have made it practical to measure up to 7 colors per specimen, enabling insight into complex samples such as are present in immuno-oncology studies. We report on a new platform that brings these together. It includes optimized dyes, software, and a scanner that performs rapid whole-slide multispectral imaging of FFPE samples (6 minutes for an entire section), along with viewing and analysis tools for handling multispectral analysis using established digital pathology interactions and workflows. This enables studying cell-to-cell interactions over multiple spatial scales; and measuring heterogeneity in immune response across the tumor microenvironment.
Methods – Staining and Scanning: Formalin-fixed paraffin-embedded samples of primary lung cancer tumors were immunostained using an Opal™ Polaris 7 detection kit, with primary antibodies targeting PDL1, PD1, CD8, CD68, FoxP3, and cytokeratin. Staining was done on a Leica Bond automated stainer.
A novel, high-throughput whole-slide multispectral scanning workflow was used to digitize the samples:
Scanning with Vectra Polaris using agile LED illumination and multiband filters to produce the required spectral bands.
Scan time is 6 minutes for a 1 x 1.5 cm sample at 20x
The raw multispectral imagery was stored as a pyramidal tiff (QPTIFF) with no compression; it was 2.6 GB in size
Methods – Image Viewing and Analysis: Multispectral software was used to view and analyze the samples.
Analysis regions were selected by drawing annotations using a special version of the Phenochart viewer. When desired, the entire sample could be selected and analyzed.
The viewer used unmixing-on-demand to obtain pure components, with autofluorescence removal and this guided the operator during region selection.
A one-time measurement of an autofluorescence witness slide was used for all subsequent slides
Selected regions were analyzed using a special version of inForm software, which processed the regions directly from the raw multispectral scan and the annotations.
It, too, used unmix-on-demand to process the large dataset efficiently, without intermediate steps or files
Cells were then segmented and phenotyped for positivity in each marker based on operator-trained classifiers
Results & Conclusions
Whole slide multispectral workflows have been demonstrated that greatly simplify multiplexed tissue studies through the following innovations:
Rapid whole-slide scanning for 6-plex (7-color) samples with only a single operator touch-point
Viewer and analysis software with unmix-on-demand to enable the usual digital pathology workflows for these complex image sets
The datasets are ripe for studying cells and their interactions at all spatial scales either within a region or across the entire sample [Figure 1]
Cell density and interaction density. Lung cancer section, shown as composite image with marker colors indicated in key. Cells were phenotyped in inForm, and interactions assessed with R and Phenoptr. Heatmaps on the top row show cellular density for tumor cells, CD8+, and CD8+ within 30 μm of a tumor cell. Bottom row shows density contours of CK+, and CD+ within 30 μm of a CD8+ cell.
The resulting scan time and file size – 6 minutes, and 2.5 GB per slide – make this technique practical even for large studies. In turn, the information content of these spatially complete, rich datasets recommends them for biomarker hunting and translational use.
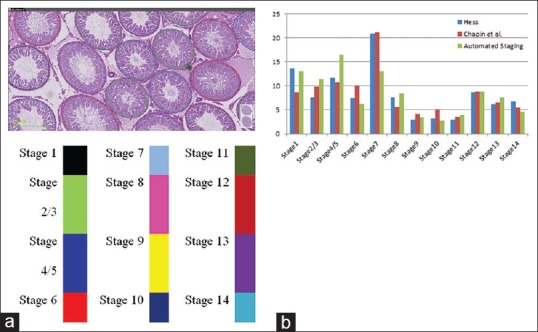
Introduction: Histopathological examination of testicular tissue is considered to be the most sensitive tool to detect toxicological effects on male reproductive function. Regardless of types of toxicity study, the testes should always be examined with an awareness of the spermatogenic cycle to ensure identification of subtle changes.[3] This examination involves classification of seminiferous tubules into different stages of spermatogenic cycle which is a painfully demanding task. We present an automated method to identify the fourteen stages of spermatogenesis in digital images of rat testes using artificial intelligence based technologies. The results of the method are in concordance with that of the manual staging done by pathologists.
Materials and Methods: Materials:
Training dataset of 10 Periodic Acid Schiff (PAS) stained whole slide images of Wistar rat testes
Test dataset of 20 PAS stained whole slide images of Wistar rat testes
Leica SCN400 scanner for image acquisition.
Methods:
Segmentation of seminiferous tubules by training a customized variant of VGG Net (deep learning network) on 1200 tiles of size 512 x 512 at 10x magnification taken from the training data set
Mapping of segmented tubules from 10x to 40x for accurate detection of various germ cells relevant for characterizing the different stages of the tubules [as per Table 1]
Germ cells used for staging are Elongated Spermatids (ESp), Spermatocytes (Spc), Round Spermatids (RSp), Residual bodies (RB), Meiotic bodies (MB)
Detection of germ cells using a customized variant of ResNet (deep residual network)
Tubules in stages 2/3 and 4/5 grouped together due to closely overlapping features.
Table 1.
Characteristic features for individual stages used in automated staging
Stages
Characteristic features
1
ESp heads: Limited bundling; ESp location: Close to lumen with very few moving towards base; Spc size: Smaller than stages 2/3
2, 3
ESp heads: Frequent bundling; ESp location: Majority in the mid-epithelial region; Spc size: Smaller than stages 4/5 and 6
4, 5
ESp heads: Prominent bundling; ESp location: Majority within lower third of the epithelium; Spc size: Larger than stages 2/3
6
ESp heads: Prominent bundling; ESp location: Majority towards lumen; Spc size: Larger than stages 4/5
7
RSp shape: Round; ESp location: Aligned around the lumen; RB size: Smaller than stage 8; RB location: Random with respect to ESp heads
(a) Classification of seminiferous tubules into respective stages using automated staging. (b) Comparison of stage frequency map with Chapin et al.[1] and Hess et al.[2]
Conclusions: This automated solution helps in fast and accurate spermatogenesis staging by overcoming the cumbersome manual process. This solution can thus act as an effective tool to aid male reproductive toxicology studies in terms of spermatogenesis staging.
References
1.Creasy DM. Evaluation of testicular toxicity in safety evaluation studies: The appropriate use of spermatogenic staging. Toxicol Pathol. 1997;25:119–31. doi: 10.1177/019262339702500201. [DOI] [PubMed] [Google Scholar]
2.Chapin RE, Dutton SL, Ross MD, Sumrell BM, Lamb JC., 4th The effects of ethylene glycol monomethyl ether on testicular histology in F344 rats. J Androl. 1984;5:369–80. doi: 10.1002/j.1939-4640.1984.tb00803.x. [DOI] [PubMed] [Google Scholar]
3.Hess RA, Schaeffer DJ, Eroschenko VP, Keen JE. Frequency of the stages in the cycle of the seminiferous epithelium in the rat. Biol Reprod. 1990;43:517–24. doi: 10.1095/biolreprod43.3.517. [DOI] [PubMed] [Google Scholar]
J Pathol Inform. 2019 Apr 1;10:10.
Integration of Digital Pathology Documentation Workflow in a Large Biobank
Introduction: The Barretos Cancer Hospital (BCH) has one of the largest biobanks in Latin America, storing almost 220,000 specimens [Figures 1 and 2]. Such amount of material poses an additional challenge for management, quality control, and information retrieval. Digital Pathology is proving an invaluable tool to document surgical pathology specimens in large scale in a cost-effective way. The evolution of molecular analysis technology is helping to enhance quality assurance practices for biobanks. For several years, the documentation of the microscopic analysis of tissue adequacy was based solely on descriptive criteria like tumor, necrosis and inflammation percentage. Digital Pathology allows the digitization of the glass slide, thus adding visual documentation of the specimen stored and avoiding the unnecessary preparation of new HE slides and allowing the archiving and retrieval of images and the potential use of image analysis and artificial intelligence to enhance and automate this process.[1,2]
Topography of samples stored at the Barretos Cancer Hospital Biobank 2008/17
Objectives: To design a workflow to integrate digital slide images as part of specimen documentation in a biobank's database.
Methods: a testing set of 200x sample images of biobank tissue specimens obtained with a high-resolution slide scanner Aperio CS2 (Aperio, Leica, Wetzlar, Germany) were prepared to be integrated to NorayBanks (NorayBio, Derio, Spain), BCH's biobank database.
Results: the implementation of whole slide imaging allowed the fast retrieval and evaluation of material for research and, eventually, for further molecular testing to the patient's benefit both through visual inspection and image analysis by a pathologist, thus ensuring sample quality for analysis without the need to prepare new glass slides. During 45 days, 46 samples were scanned. The majority of samples were breast (21.7%), head and neck, bone and soft tissue and gastrointestinal tract (13.0% each).
Discussion: the integration of digital whole slide (WSI) images as part of a biobank's database is feasible and can be part of the routine work with minimum impact in the workflow of the pathology department. A simple and effective way to generate WSI is to gather the frozen section slides prepared to assess the specimen adequacy and scan all material on a daily basis. This approach proved simple and time-effective in our institution.
Conclusion: Digital pathology potential uses are growing and expanding to all areas that use microscopy at a faster pace. The main advantages of digital pathology applied to biobank histology samples include permanent image documentation and access, proper selection of areas of interest by visual inspection and by image analysis and/or AI tools,[3] thus enhancing cost-effectiveness and minimizing risks and costs of storing inadequate material.
Examples of whole slide images of frozen sections selected and stored in the HCB biobank
References
1.Lewis C, McQuaid S, Hamilton PW, Salto-Tellez M, McArt D, James JA. Building a ‘repository of science’: The importance of integrating biobanks within molecular pathology programmes. Eur J Cancer. 2016;67:191–9. doi: 10.1016/j.ejca.2016.08.009. [DOI] [PubMed] [Google Scholar]
2.Meredith AJ, Slotty A, Matzke L, Babinszky S, Watson PH. A model to estimate frozen tissue collection targets in biobanks to support cancer research. Biopreserv Biobank. 2015;13:356–62. doi: 10.1089/bio.2014.0081. [DOI] [PubMed] [Google Scholar]
3.Wei BR, Simpson RM. Digital pathology and image analysis augment biospecimen annotation and biobank quality assurance harmonization. Clin Biochem. 2014;47:274–9. doi: 10.1016/j.clinbiochem.2013.12.008. [DOI] [PMC free article] [PubMed] [Google Scholar]
J Pathol Inform. 2019 Apr 1;10:10.
Annotation of Whole Slide Images Using Touchscreen Technology
Introduction: Whole slide imaging (WSI) is the process by which conventional glass slides are scanned and converted into digital images. This technology can be utilized to improve the efficiency of workflow, better integrate images into laboratory information systems, and, when utilized properly, may offer substantial cost savings. These advantages have prompted the recent exponential growth of WSI platform usage. Indeed, many labs have moved towards the complete digitization of all tissue slides, and the breadth of WSI technologies approved by the U.S. Food and Drug Administration (FDA) for diagnostic use continues to widen.[1] As with traditional glass slides, digital slides can be annotated for region of interest (ROI). Annotation of ROI is essential for communication amongst pathologists and other functions in various diagnostic, educational, and research settings. Digital annotation offers obvious advantages to the marking of glass slides with ink, namely in its ability to preserve the integrity of the annotation over time and distance.[2] Traditionally, a hand-held mouse and desktop monitor are used for digital annotation. In addition to the barriers of poor ergonomics and lack of familiarly of the user with imaging software, this approach may lack the speed and precision of hand-drawn annotation. Thus, some pathologists are still hesitant to embrace digital annotation.[3] Technology capable of replicating hand-drawn annotation, namely touchscreen personal computers with stylus capabilities, may be a means of surmounting the latter impediment. These tools have increasingly been embraced by other professions (graphic design, architecture, etc.), in many instances supplanting pencil and pen entirely, but their value in the generation and modification of scientific images has yet to be fully explored.
In this study we sought to determine whether the use of a touchscreen computer and stylus for annotation of ROI offered any advantages over traditional methods of digital annotation.
Materials and Methods: Thirty cases of hematoxylin and eosin (H &E) stained tissue sections from colorectal, pancreatic, and gastric cancers were scanned using the Ventana iScan HT and uploaded to the IRIS Platform (Mountain View, CA). A brief introduction and a hands-on practice session on how to use the IRIS software and the stylus were given to the pathologists before the beginning of the study. Subsequently, two different, randomly-selected slide sets, each consisting of 10 hematoxylin and eosin stained tissue sections, were annotated by the pathologists. One set was used for annotation of tumor area using a hand-held mouse and Hewlett-Packard EliteDisplay S231d Monitor (Palo Alto, CA), while a Microsoft Surface Studio touchscreen computer and stylus (Redmond, Washington) were used to annotate the other set. Annotation times were captured and recorded in seconds at the conclusion of each case. After collection of the score sheets, the pathologists were asked to complete a 5 question survey regarding their experience with the different annotation methodologies, with responses recorded on a 5 point Likert scale [Figure 1].
User Experience Survey Completed by Study Pathologists
Findings and Argument: All study pathologists recorded a shorter average annotation time spent per case using a stylus and touchscreen vs. desktop monitor and mouse, averaging out to an overall improvement of 25.7% (73 seconds vs. 99 seconds spent per case). On a follow-up 5 question survey regarding their user experience with the different annotation methods [Figure 1], each participant reported qualitative improvements in the precision of annotation, navigation functions and the ability to instantly share annotated screen shots via built-in stylus functions. All study pathologists indicated that, with adequate training, most users would be able to annotate tumor area faster using a stylus and touchscreen, while two of the three participants felt that the stylus offered improved ergonomics over a hand-held mouse.
Conclusions: Our study findings demonstrated that the use of touchscreen technology has to potential to increase the speed and quality of annotation of ROI. Future studies including more image sets and multiple pathologists with different expertise and practice settings are needed to further validate our findings.
References
1.Pantanowitz L, Parwani A. Chicago, IL: American Society of Clinical Pathologists Press; 2017. Digital Pathology. [Google Scholar]
3.Pantanowitz L, Farahani N, Parwani A. Whole side imaging in pathology: Advantage, limitations, and emerging perspectives. Pathol Lab Med Int. 2015;7:23–33. [Google Scholar]
J Pathol Inform. 2019 Apr 1;10:10.
A Pilot Study of Computer-Aided Focus Score Calculation for Sjӧgren's Biopsies
Introduction: Sjögren's syndrome (SS) is a chronic immune-mediated condition affecting exocrine glands and clinically manifests as dry mouth and dry eyes. A labial gland biopsy is essential for diagnosis in patients without serologic evidence of autoimmunity. The American College of Rheumatology (ACR) recommends grading system based on quantitation of lymphocytic aggregates (foci) in salivary tissue.[1,2] However, the focus score based grading system proposed by the American College of Rheumatology requires considerable time and effort to perform manually, and many studies report discrepancies in inter-observer reproducibility.[3,4] Given the challenges with manual grading, we designed a supervised algorithm using the Visiopharm image analysis platform to automate the evaluation of Sjögren's biopsies.
Methods: We identified fifteen (N=15) minor salivary gland biopsies submitted for a SS workup. With manual H&E evaluation, four (4/15) were diagnosed as “supportive of Sjögren's”. Eleven cases (11/15) were “not supportive of Sjögren's”. Slides were scanned using the Leica Aperio AT2 system at 40X. A Bayesian based algorithm was designed on Visiopharm to calculate the area of the salivary tissue and identify lymphocytic foci. Employing our algorithm, we recorded the number of lymphocytic foci, glandular area, and focus score for each case.
Results: Our algorithm matched the manual interpretation in 100% of cases, (4/4) of the positive and (11/11) of the negative. However, discrepancies in enumerated features occurred due to the counting of tangentially sectioned ducts and large tissue folds as foci [Table 1]. The overall focus scores were slightly higher on average for with our digital app compared to manual scoring. Nonetheless, there were no statistically significant differences (alpha=0.05) in the above parameters between the two methods.
Conclusions: This is the first study to demonstrate that computational tools have the potential to aid in the focus score calculation of biopsies submitted for Sjögren's evaluation. A well-designed digital application which automates grading of Sjögren's biopsies can potentially improve adherence to the ACR scoring protocol and increase the accuracy of focus score quantitation. Further work is required to expand this series and tune the algorithm to increase the accuracy of the focus score count.
References
1.Shiboski SC, Shiboski CH, Criswell L, Baer A, Challacombe S, Lanfranchi H. American college of rheumatology classification criteria for Sjögren's syndrome: A data-driven, expert consensus approach in the Sjögren's international collaborative clinical alliance cohort. Arthritis Care Res (Hoboken) 2012;64:475–87. doi: 10.1002/acr.21591. [DOI] [PMC free article] [PubMed] [Google Scholar]
2.Fox RI, Saito I. Criteria for diagnosis of Sjögren's syndrome. Rheum Dis Clin North Am. 1994;20:391–407. [PubMed] [Google Scholar]
3.Vivino FB, Gala I, Hermann GA. Change in final diagnosis on second evaluation of labial minor salivary gland biopsies. J Rheumatol. 2002;29:938–44. [PubMed] [Google Scholar]
4.Stewart CM, Bhattacharyya I, Berg K, Cohen DM, Orlando C, Drew P. Labial salivary gland biopsies in Sjögren's syndrome: Still the gold standard? Oral Surg Oral Med Oral Pathol Oral Radiol Endod. 2008;106:392–402. doi: 10.1016/j.tripleo.2008.04.018. [DOI] [PubMed] [Google Scholar]
J Pathol Inform. 2019 Apr 1;10:10.
Utilization and Application Trends in Whole Slide Imaging from an Early Adopting Institution
Introduction: As whole slide imaging (WSI) systems are becoming more widely implemented, it is useful to analyze the application and utilization trends in an early adopting institution to identify barriers to maximizing the usage of WSI and highlight its utility in a busy academic medical center.
Methods: 7011 whole slide images, scanned with a Hamamatsu C9600-12 from January 2012 to September 2018, were categorized by date scanned, application (education, research, regulatory compliance, and consultation), and user. The year to year data was then analyzed by looking at utilization trends.
Results: After implementation in 2012, the predominant usage of WSI was for resident education purposes (i.e. scanning old slide study sets) with some usage for research and regulatory compliance. In 2013 and 2014, the total number of slides scanned dropped to 35.4% and 34.9% of the number scanned in 2012. In 2015, the number of slides scanned was only 17.4% of the number scanned in 2012. However during this same time period, the percentage usage of WSI for research, compliance, and consultation purposes increased from 4.5% to 66.6% with more total unique users, including more residents. Through 2016 to 2018, the annual number of slides scanned compared to 2012 increased to 39.8%, 67.4%, and a projected 71.7% respectively with a continued increase in usage for research, compliance, and consultations up to 90.1%. Additionally during this time, WSI was used for new resident education applications, including unknown slide conferences and archiving guest slide lectures.
Conclusions: To maximize the utility of WSI, it is important to recognize and train all potential users on its various applications, early in WSI implementation, to avoid a drop-off in usage. We recommend a multi-faceted approach, including using WSI for research, all consults, archiving slides used for regulatory compliance (i.e. antibody validations), and archiving slides that may be destroyed during additional testing (i.e. molecular diagnostics). Perhaps most importantly, residents should be introduced to how to use whole slide imaging early in their training to maximize its educational benefits and prepare them for a future where WSI will be ubiquitous.
J Pathol Inform. 2019 Apr 1;10:10.
Cross Generational Approval and Demand for Online Digital Cytology Modules
Introduction: In our current technological arena, there has been a significant shift in how we access and deliver educational content. Online digital resources in the field of pathology offer an alternative to traditional teaching methods that utilize classroom lectures, microscopes, and textbooks- tools that are often limited by location, time, and size.[1] Online educational content offers a variety of advantages- most significantly, portability, rapid accessibility, reproducibility, and ease of distribution.[2] An online cytologic-histologic correlation digital learning module (e-module) was developed to evaluate the efficacy of digital education for pathology personnel at the University of Nebraska Medical Center (UNMC). 35 individuals completed a survey before and after viewing an e-module. E-module perceptions in bimodal age cohorts were evaluated, and a paired t-test was used to identify statistically significant changes in pre/post survey responses. Responses from 35 participants were bimodally grouped by age: ≤35 years (Group 1, n=21) and ≥36 years (Group 2, n=14). We hypothesized that demand for e-module education would be greater in Group 1 than in Group 2. Regardless of age and departmental position, nearly all participants indicated that digital e-modules are helpful tools for histology/cytology education. Younger individuals indicated interest in purchasing modules and mobile phone apps to aid with board review.
Methods: 35 UNMC individuals comprised of 10 residents, 5 fellows, 8 faculty, and 6 cytotechnologists from the Department of Pathology and 7 cytotechnology students from the School of Cytotechnology were asked to complete surveys regarding their perceptions of an e-module developed at UNMC. The participants completed a 15-question paper survey before viewing the e-module. After responses were collected in an anonymous mailbox, a link to the e-module was sent to the participants’ e-mail. The 13-minute e-module included audio, visual, and self-assessment components, and reviewed the morphologic cytologic and histologic correlation of cervical squamous intraepithelial lesions. A second, 20-question paper survey was distributed and collected (Figure 1). A paired t-test using SAS, Version 9.4 was used to determine if there were statistically significant changes in survey responses for individual pre-module and post-module questions. Additionally, the survey responses were compared and contrasted to evaluate variable perceptions of e-module educational resources in two age groups: ≤ 35 years and ≥ 36 years (Figure 2).
Findings and Argument: 97% of participants (n=34/35) agreed that digital e-modules are helpful for learning histology and cytology. 86% of Group 1 (n=18/21) and 57% of Group 2 (n=8/14) would pay for similar modules for board exam review. 76% of Group 1 (n=16/21) and 50% of Group 2 (n=7/14) would purchase an application (”app”) for exam review and/or continuing education. 100% (n=35/35) of participants agreed that the use of digital modules for cytology/histology education would increase in the near future, and 86% (=30/35) of participants agreed that e-modules are important tools to achieve diagnostic adequacy in Telepathology. No statistically significant changes in responses to pre/post-module surveys were identified.
Conclusions: Regardless of age and departmental position, nearly all personnel expressed that e-modules are helpful tools for histology and cytology education. Most significantly, the majority of the younger cohort indicated that they would purchase similar modules for board review. These findings support the increasing demand for high quality, accessible, e-module histology/cytology content, especially for a younger cohort that is frequently tested on material in a digital format. Furthermore, this study establishes the potential to create self-sustaining, if not profitable, means of future production of such modules.
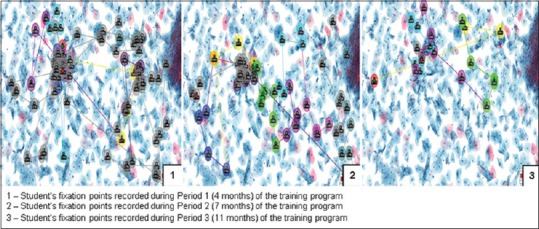
Introduction: The visualization of the digital images (DI) by the pathology residents and medical students has been investigated using eye-tracking system and found that tracking the visualization of DI has the potential for use in training and assessment.[1,2] Eye tracking technology however, has not yet been investigated in cytotechnology (CT). The objective of this study was to analyze the locator and interpretation skills of CT students using an eye tracking device and static DI with regard to the: number of fixation points, task duration, and gaze observations in regions of interest. Static DI of gynecologic cytology specimens were serially displayed on a computer monitor for evaluation by CT students. During evaluation, students’ eye movements were monitored with a Mirametrix S2 eye tracker and EyeWorks™ software. Over the two academic year periods (2016-2017, and 2017-2018), two consecutive sets of students completed the protocol at 3 different time periods during their one-year training: Period1 (P1) - 4 months, Period2 (P2) -7 months, Period3 (P3) -11 months. For the three students who participated in the study during the year, 2016-2017, the mean number of fixation points on DI significantly decreased at P3 when compared to P2 (81.0 vs. 58.9, p=0.006); mean task duration significantly decreased from P1 at both P2 (42.5 vs. 36.0, p=0.03) and P3 (42.5 vs. 26.6, p<0.0001); and mean gaze observations were significantly lower at P3 when compared to P1 (201.6 vs. 112.5, p=0.042). For the eight students who participated in the study during the year, 2017-2018, there was a statistically significant difference in the: mean number of fixation points between the two assessment periods (P1 was 44.16 vs. 27.16 for P3, p=0.0002), and mean duration between the two assessment periods (P1 was 37.89 vs 26.91 for P3, p<0.0001). These results were consistent with more efficient performance by CT students when evaluating DI later in the training program.
Methods: During the year 2016-2017, 25 Static DI of gynecologic cytology specimens were serially displayed on a computer monitor for evaluation by 3 students at the CT program at the University of Nebraska Medical Center (UNMC). During evaluation, students’ eye movements were monitored with a Mirametrix S2 eye tracker and EyeWorks™ software [Figure 1]. Students completed the protocol at 3 different time periods during their one-year training: Period1 (P1) - 4 months, Period2 (P2) -7 months, Period3 (P3) -11 months. A similar protocol was repeated the following year, 2017-2018 with 8 students from UNMC (both from campus and distance site), and Magee-Women's Hospital of University of Pittsburgh Medical Center, Pittsburgh. A general linear mixed model was used to analyze number of fixation points, task duration, and gaze observations in regions of interests.
Eye movements on the static digital image displayed on a monitor with mirametrix S2 eye tracker and EyeWorks™ software being recorder
Findings and Argument: For the three students who participated in the study during the year, 2016-2017, the mean number of fixation points on DI significantly decreased at P3 when compared to P2 (81.0 vs. 58.9, p=0.006); mean task duration significantly decreased from P1 at both P2 (42.5 vs. 36.0, p=0.03) and P3 (42.5 vs. 26.6, p<0.0001); and mean gaze observations were significantly lower at P3 when compared to P1 (201.6 vs. 112.5, p=0.042). For the eight students who participated in the study during the year, 2017-2018, there was a statistically significant difference in the: mean number of fixation points between the two assessment periods (P1 was 44.16 vs. 27.16 for P3, p=0.0002), and mean duration between the two assessment periods (P1 was 37.89 vs 26.91 for P3, p<0.0001).
Conclusions: Our study demonstrated the potential of eye tracking methods in visualizing changes in student performance while achieving mastery of cytopathology interpretation [Figure 2]. Eye-tracking methods could also offer a means of providing rapid student feedback and tutoring. With these results, we aim to analyze the screening skills of our CT students using digitized whole slide images in the future.
1Department of Electrical and Computer Engineering, University of Dayton, OH 45469, 2Deep Lens Inc, Columbus, OH 43212, USA. E-mail: {alomm1, aspirast1, ttaha1, vasari1}@udayton.edu, {dave, tj}@deeplens.ai
1Department of Electrical and Computer Engineering, University of Dayton, OH 45469, 2Deep Lens Inc, Columbus, OH 43212, USA. E-mail: {alomm1, aspirast1, ttaha1, vasari1}@udayton.edu, {dave, tj}@deeplens.ai
1Department of Electrical and Computer Engineering, University of Dayton, OH 45469, 2Deep Lens Inc, Columbus, OH 43212, USA. E-mail: {alomm1, aspirast1, ttaha1, vasari1}@udayton.edu, {dave, tj}@deeplens.ai
1Department of Electrical and Computer Engineering, University of Dayton, OH 45469, 2Deep Lens Inc, Columbus, OH 43212, USA. E-mail: {alomm1, aspirast1, ttaha1, vasari1}@udayton.edu, {dave, tj}@deeplens.ai
1Department of Electrical and Computer Engineering, University of Dayton, OH 45469, 2Deep Lens Inc, Columbus, OH 43212, USA. E-mail: {alomm1, aspirast1, ttaha1, vasari1}@udayton.edu, {dave, tj}@deeplens.ai
1Department of Pathology, The University of Michigan, Ann Arbor, Michigan, USA. E-mail: keluoy@med.umich.edu
Background: Deep Learning (DL) approaches have been providing state-of-the-art performance in different modalities in the field of Bio-medical imagining including Digital Pathology Image Analysis (DPIA). Out of many different DL approaches, Deep Convolutional Neural Network (DCNN) technique provides superior performance for classification, segmentation, and detection tasks in DPIA. Most of the objectives of DPIA problems are somehow possible to solve with classification, segmentation, and detection models. In addition, sometimes pre- and post-processing steps are required for solving some specific type of problems. Recently, different advanced DCNN models including Inception residual recurrent CNN (IRRCNN), Densely Connected Recurrent Network (DCRN), Recurrent Residual U-Net (R2U-Net), and R2U-Net based regression model (UD-Net) have been proposed which provide state-of-the-art performance for different computer vision and Bio-medical image analysis problems against existing DCNN models. However, these advanced DCNN models have not been explored for solving different problems related to DPIA.
Methods: In this study, we have applied these advanced DCNN techniques for solving different DPIA problems that are evaluated on different publicly available benchmark datasets which related to seven unique tasks related to DPIA. These tasks include: nuclei segmentation, epithelium segmentation, tubule segmentation, lymphocyte detection, mitosis detection, invasive ductal carcinoma detection, and lymphoma classification.
Results: The experimental results are evaluated considering different performance metrics including: sensitivity, specificity, accuracy, F1-score, Receiver Operating Characteristics (ROC) curve, dice coefficient (DC), and Means Squired Errors (MSE). The results demonstrate superior performance for classification, segmentation, and detection tasks compared to existing DCNN based approaches.
Conclusions: We evaluated different advanced DCNN approaches including IRRCNN, DCRN, R2U-Net, and UD-Net for solving classification, segmentation and detection problems for digital pathology image analysis. Experimental results show the robustness and efficiency of proposed advanced DCNN methods in analyzing of several digital pathology cases.
Introduction: Medical imaging speed up the assessment process of almost every disease from lung cancer to heart disease. The automatic pathological image classification, segmentation, and detection algorithm can help to unlock the cure faster from the critical disease like cancer to common cold. The computational pathology and microscopy images play a big role in decision making for disease diagnosis. Therefore, this solution can help to ensure the better treatment. Nowadays, there are different DCNN models have successfully applied in computation pathology. However, in this work, we have applied three different improved DCNN models for pathological image classification, segmentation, and detection. The overall implementation diagram is shown in Figure 1. The contributions of this paper are summarized as follows:
Overall experimental diagram for seven different tasks in computational pathology
§ We have proposed improved model named IRRCNN and DCRN for Lymphoma, IDC, and mitosis classification.
§ To generalize the R2U-Net model, R2U-Net is applied for nuclei segmentation, epithelium segmentation, tubule segmentation in this study.
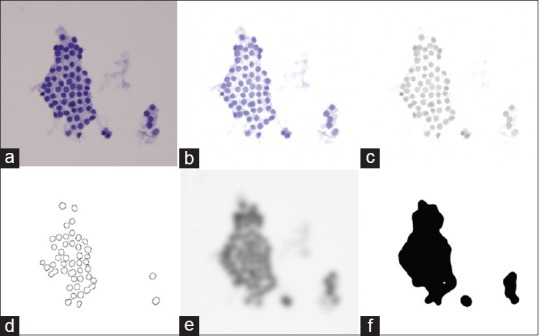
§ The UD-Net is proposed for end-to-end lymphocyte detection from pathological images.
§ The experimental results show superior performance compared to existing machine learning and DL based approaches for classification, segmentation, and detection tasks.
Methods: We have applied these advanced DCNN techniques including IRRCNN[1], R2U-Net[2], and DCRN (an improved version of DenseNet)[3], where the recurrent convolutional layers are incorporated for forward convolution layers in dense blocks, and an R2U-Net based regression model called UD-Net is used which takes cell image as input and computes the density heat maps. Figure 2 shows training and validation accuracy for IRRCNN and DCRN.
The training and validation accuracy for Lymphoma classification with IRRCNN and DRCN on the left and for invasive ductal carcinoma classification on the right
Experiments and results: We have evaluated the performance of these models with different metrices (i.e., precision, recall, accuracy, F1-score, Area under Receiver Operating Characteristics (ROC) curve, dice coefficient (DC), and Means Squired Errors (MSE)). For unbiased comparison, we have normalized our datasets utilizing the same criteria stated in previous studies[4,5]. The quantitative and qualitative results show in Table 1, for the results it can be clearly seen that the proposed methods provide better performance on different tasks. The quantitative results are shown in Figure 3 where the first column shows the inputs images, second column shows the ground truth (GT), third columns shows the model outputs, and fourth column shows the only target regions.
Table 1.
The quantitative results and comparison against existing approaches for seven different tasks
Experimental results: first row shows the results for nuclei segmentation on the left and epithelium segmentation on the right and second row show the result for tubule segmentation: benign on the left and malignant on the right. Third row shows the result for Lymphocyte detection
Conclusions: We have evaluated different advanced DCNN approaches including IRRCNN, DCRCN, R2U-Net and UD-Net models for solving classification, segmentation and detection problems related to computational pathology. First, for classification we have achieved 99.8% and 89.07% testing accuracy for lymphoma and invasive ductal carcinoma (IDC) detection respectively, which are 3.22% and 4.39% better accuracy than previously reported. Second, for segmentation of nuclei, epithelium, and tubules, the experimental results show 3.31%, 6.5%, and 4.13% superior performance compared to existing Deep Learning (DL) based approaches. Third, for detection of lymphocytes we have achieved 0.82% better testing accuracy and 97.32% and around 60% testing accuracy for mitosis detection for image-level and patient-level respectively, which is significantly higher compared to exiting methods. The experimental results clearly demonstrate the robustness and efficiency of our proposed DCNN methods as compared against existing DL based methods for computational pathology.
REFERENCES
1.Alom, Md Zahangir, Mahmudul Hasan, Chris Yakopcic, Tarek M, Taha, Vijayan K. Asari. “Improved Inception-Residual Convolutional Neural Network for Object Recognition.”. arXiv preprint arXiv:1712.09888. 2017 [Google Scholar]
2.Alom, Md Zahangir, Mahmudul Hasan, Chris Yakopcic, Tarek M. Taha, Vijayan K. Asari. “Recurrent Residual Convolutional Neural Network based on U-Net (R2U-Net) for Medical Image Segmentation.”. arXiv preprint arXiv:1802.06955. 2018 [Google Scholar]
3.Huang, Gao, Zhuang Liu, Laurens Van Der Maaten, Kilian Q. Weinberger. “Densely Connected Convolutional Networks.” In CVPR. 2017;1:3. no. 2. [Google Scholar]
4.Janowczyk, Andrew, Anant Madabhushi. “Deep learning for digital pathology image analysis: A comprehensive tutorial with selected use cases.”. Journal of pathology informatics 7. 2016 doi: 10.4103/2153-3539.186902. [DOI] [PMC free article] [PubMed] [Google Scholar]
5.Naylor, Peter, Marick Laé, Fabien Reyal, Thomas Walter. “Nuclei segmentation in histopathology images using deep neural networks.”. Biomedical Imaging (ISBI 2017), 2017 IEEE 14th International Symposium on, pp. 933-936. IEEE. 2017 [Google Scholar]
6.Basavanhally, Ajay, Elaine Yu, Jun Xu, Shridar Ganesan, Michael Feldman, John Tomaszewski, Anant Madabhushi. “Incorporating domain knowledge for tubule detection in breast histopathology using O’Callaghan neighborhoods.”. Medical Imaging 2011: Computer-Aided Diagnosis. 7963:796310. International Society for Optics and Photonics, 2011. [Google Scholar]
7.Cireşan, Dan C., Alessandro Giusti, Luca M. Gambardella, Jürgen Schmidhuber. “Mitosis detection in breast cancer histology images with deep neural networks.”. International Conference on Medical Image Computing and Computer-assisted Intervention, pp. 411-418. Springer, Berlin, Heidelberg. 2013 doi: 10.1007/978-3-642-40763-5_51. [DOI] [PubMed] [Google Scholar]
J Pathol Inform. 2019 Apr 1;10:10.
A Robust Automated Digital Image Analysis Algorithm for Detecting Thyroid Follicular Neoplasm
Content: Thyroid follicular neoplasms (FN) are detected based on preoperative thyroid fine needle aspirations (T-FNA) using subjective cytomorphologic criteria which frequently lead to poor diagnostic precision and suboptimal patient management. Using T-FNA evaluated in liquid-based preparations (LBP) with standardized processing, this study attempts to design an automated digital image analysis (DIA) algorithm to improve FN detection.
Method: Twenty T-FNAs diagnosed as Bethesda category III with the confirmatory surgical diagnosis for follicular adenoma (FA) and 20 T-FNAs diagnosed as benign with confirmed surgically were identified from the laboratory information system. Ten digital images of 10x and 40x fields on LBP were obtained on each case using the DP71 camera on an Olympus BX51 microscope with CellSens v1.12. The Images were processed using ImageJ v1.51p (NIH, USA) and a JavaScript-based macro for architecture, cellularity, and nuclear features [Figure 1]. We analyzed the data using multiple machine learning algorithms available in Python v3.6.4 SciPy v1.0.0 with 1:1 training/validation data split and cross-validation.
The segmentation and feature extraction of follicular cells start with the original image (a), followed by the background subtraction (b), conversion to 8-bit grey scale image (green channel) through color deconvolution (c), automatic threshold segmentation, and nuclear feature extraction (d). The 8-bit grey scale image (c) can also be processed with Gaussian blur (e) followed by threshold segmentation to extract architectural information represented as particles (f)
Results: The best performing linear discriminant analysis comparison showed with FA as the true positive and benign as true negative, we achieved 64-76% (10x images) and 67-72% (40x images) precision. The recall was 74-88% (10x images) and 62-76% (40x images). On the same data, a cytopathologist achieved 57% precision and 95% recall.
Conclusion: We have a working DIA algorithm that can distinguish FN from benign T-FNAs with better precision than a cytopathologist. We are currently working on further refining the algorithm to incorporate other thyroid lesions and whole slide imaging technology.
J Pathol Inform. 2019 Apr 1;10:10.
Mid-IR Label-Free Digital Pathology for the Identification of Biomarkers in Tissue Fibrosis
Introduction: Infrared (IR) spectroscopic imaging allows for rapidly acquiring label-free biochemical information from tissue sections. IR imaging allows for mapping of multiple biochemical components such as proteins, lipids, DNA, carbohydrates and glycosylation across tissues. This derived biochemical information can be harnessed for automated cell-type, disease-type classification or to identify novel biomarkers predicting organ outcome.[1,2,3] IR imaging is potentially very useful in examining tissues with fibrotic diseases.[4] Fibrosis is a common pathological entity that can occur in a wide range of organs such as liver, kidney and heart typically as a result of insult to the tissue. Progressive accumulation of fibrosis can lead to disruption of the function of the organ and eventual organ failure. There exists a need to rapidly identify and quantify fibrosis in tissues. In addition, regions of fibrosis represent a novel target for the identification of biomarkers of organ prognosis that can be detected using IR imaging.[4]
Methods: Tradition Fourier Transform Infrared (FT-IR) spectroscopic imaging is typically slow and creates large data sets which limits it clinical feasibility due to requiring all IR spectral frequencies to be obtained at each pixel. Recent advances in Quantum Cascade Lasers (QCL) implemented in an imaging microscope is potentially a key advance in making this technology feasible in a clinical setting. QCL imaging can permit for real-time imaging of tissue sections at a single IR frequency of interest. In addition, QCL imaging allows for rapidly obtaining only the IR spectral frequencies that are required for tissue diagnosis. We applied wide-field QCL imaging to liver, lung, and kidney tissues to identify regions of fibrosis in real-time and to identify biomarkers that could be used for disease diagnosis and prediction of organ outcome.
Findings and Arguments: QCL-imaging permits the rapid real-time imaging of tissue sections where a single IR frequency can accurately identify and quantify regions of fibrosis. QCL-imaging can rapidly visualize the extent of fibrosis in multiple organs that can give information on the extent of organ damage [5]. In addition, using a mouse model of pulmonary fibrosis, we found that QCL-imaging can detect biochemical changes associated with both progression and remission of fibrosis. Finally, using select IR frequencies extracted from regions of fibrosis it was determined that there was prognostic biochemical information that can predict whether a transplanted kidney will develop progressive fibrosis.[6]
Conclusion: IR imaging is a potentially powerful adjunct to current pathology practice, with the ability to visualize fibrosis in tissues and extract novel biomarkers that can predict the progression of fibrosis.
References
1.Walsh MJ, Reddy RK, Bhargava R. Label-free biomedical imaging with mid-IR spectroscopy. Ieee J Sel Top Quantum Elec. 2012;18:1502–13. [Google Scholar]
2.Baker MJ, Byrne HJ, Chalmers J, Gardner P, Goodacre R, Henderson A. Clinical applications of infrared and raman spectroscopy: State of play and future challenges. Analyst. 2018;143:1735–57. doi: 10.1039/c7an01871a. [DOI] [PubMed] [Google Scholar]
3.Baker MJ, Trevisan J, Bassan P, Bhargava R, Butler HJ, Dorling KM. Using fourier transform IR spectroscopy to analyze biological materials. Nat Protoc. 2014;9:1771–91. doi: 10.1038/nprot.2014.110. [DOI] [PMC free article] [PubMed] [Google Scholar]
4.Nazeer SS, Sreedhar H, Varma VK, Martinez-Marin D, Massie C, Walsh MJ. Infrared spectroscopic imaging: Label-free biochemical analysis of stroma and tissue fibrosis. Int J Biochem Cell Biol. 2017;92:14–7. doi: 10.1016/j.biocel.2017.09.003. [DOI] [PMC free article] [PubMed] [Google Scholar]
5.Sreedhar H, Varma VK, Gambacorta FV, Guzman G, Walsh MJ. Infrared spectroscopic imaging detects chemical modifications in liver fibrosis due to diabetes and disease. Biomed Opt Express. 2016;7:2419–24. doi: 10.1364/BOE.7.002419. [DOI] [PMC free article] [PubMed] [Google Scholar]
6.Varma VK, Kajdacsy-Balla A, Akkina S, Setty S, Walsh MJ. Predicting fibrosis progression in renal transplant recipients using laser-based infrared spectroscopic imaging. Sci Rep. 2018;8:686. doi: 10.1038/s41598-017-19006-1. [DOI] [PMC free article] [PubMed] [Google Scholar]
J Pathol Inform. 2019 Apr 1;10:10.
HER2 breast cancer gold-standard using supervised learning from multiple experts
1Laboratory for Scientific Image Analysis SCIAN-Lab, Developmental Biology Program, Faculty of Medicine, University of Chile, Santiago, Chile. E-mail: vchang@dcc.uchile.cl
2Developmental Biology Program, SCIAN-Lab, Institute of Biomedical Sciences, Biomedical Neuroscience Institute, Center for Medical Informatics and Telemedicine CIMT, National Center for Health Information Systems CENS, Faculty of Medicine, University of Chile, Santiago, Chile
Breast cancer is one of the most common cancer in women around the world. For diagnosis, the expression of HER2 protein is evaluated, estimating intensity and integrity of the membrane cells's staining and scoring the biopsy sample as 0, 1+, 2+, or 3+: a subjective decision that depends on the interpretation of the pathologist. This work is aimed to achieve consensus among opinions of pathologists in cases of HER2 breast cancer biopsies, using supervised learning methods based on multiple experts. The main goal is to generate a reliable public breast cancer gold-standard, to be used as training/testing dataset in future developments of machine learning methods for automatic HER2 assessment. There were collected 30 breast cancer biopsies, an Android application was developed to collect the experts’ opinions, and six breast cancer pathologists are working on scoring the same set of samples.
Keywords: Breast cancer, intra-variability, inter-variability, expert opinion, biopsy score consensus.
Introduction: Breast cancer is one of the most common cancer in women around the world.[1] For diagnosis, the expression of HER2 protein is evaluated, estimating intensity and integrity of the membrane cells's staining and scoring the biopsy as 0, 1+, 2+, or 3+.[2] Label 2+ refers to a borderline case and a confirmation analysis is required for the complete diagnosis, i.e. fluorescence in situ hybridization (FISH)[2]. Thus, HER2 assessment is performed based on a subjective decision that depends on the experience and interpretation of the pathologist.[3,4] This subjective decision could lead to pathologist's inter-variability and intra-variability. Both kind of variability for breast cancer diagnosis is significantly high.[5,6] One way to have a reproducible and objective procedure for HER2 assessment is by means of an automatic classification method that scores a digital biopsy.[7] However, despite decades of research on computer-assisted HER2 assessment,[7,8,9] there are still no standard ways of comparing the results achieved with different methods. Published algorithms for this task are usually evaluated according to how well they correlate with expert-generated classifications, though it seems that each research group has its own dataset of images, whose scores are based on the subjective opinion of only one or two experts. With non-public datasets, direct comparison between competing algorithms is a very difficult task. It would be desirable to have a HER2 assessment ground-truth, as it would represent the absolute truth, but it is impossible because of the subjectivity of the task. Thus, a valid alternative consists of asking many experts in the field for their opinion about specific cases to generate a gold-standard.[6,10] Motivated by this challenge, this research is aimed to achieve consensus among opinions of pathologists for HER2 breast cancer biopsies, using supervised learning methods based on multiple experts. The main goal is to generate a reliable public breast cancer gold-standard, to be used as training/testing dataset in future developments of machine learning methods for automatic HER2 assessment. Also, it is expected to evaluate intra- and inter- variability of the experts. This will be a very significant contribution to the scientific community, because at present there is no public gold-standard for HER2 assessment.
Material and Methods
2.1 Collection of biomedical samples
The dataset entailed 30 whole-slide-images (WSI) extracted from cases of invasive breast carcinomas. The Biobank of Tissues and Fluids of the University of Chile managed the collection of HER2 stained slides obtained from two main Chilean pathology laboratories.
All the biopsies have known histopathological diagnosis (equally distributed in categories: 0, 1+, 2+, and 3+). Between 3 and 4 tumor regions were marked by an expert pathologist as regions-of-interest (ROIs) in each sample, see Figure 1.
Whole-slide-image, scanned using Hamamatsu NanoZoomer at SCIANLab, with the regions-of-interest marked on by an expert pathologist
Then, magnification of 20x was used to crop non-overlapping rectangular sections from ROIs. A total of 1,250 biopsy sections were obtained.
All cases were subjected to supplemental FISH analysis, which is regarded as the gold standard method by the ASCO/CAP guidelines[2].
2.2 Collection of expert's opinions
An Android application was specially designed and developed to collect the pathologists’ opinions. It is expected that each pathologist has the same device under the same conditions, to have a controlled scenario to evaluate inter-observer variability.
For each image, the expert must indicate whether the image is evaluable or not (according to his/her opinion) and must assign a score among 0, 1+, 2+, and 3+ (see Figure 2). All the scores are registered locally in the device and remotely in a dedicated server, if an internet connection is available.
The idea beyond this consensus process is to use a supervised learning method based on multiples experts that allows obtaining: (1) an estimated gold-standard with consensus labels, (2) a classifier that considers multiple labels for each biopsy section, and (3) a mathematical model of the experience of each expert based on the labels and FISH results.
As an additional impact of this study, it is expected to assess the intra-expert variability. In this sense, the same biopsy sections are presented to each pathologist in random order. In addition, presentation of the same sections contemplates a previous transformation of flipping and rotation of 90 degrees to increase the recognition complexity.
Final Remarks: The ongoing work includes the compromise of six referent Chilean breast cancer pathologists. So far, one pathologist have assigned score to 100% of the samples and two of them have assigned score to almost 50%, while the remaining ones have assigned score to more than 20%.
This methodology would be easy extended/modified to be applied to different cancer tissues. Also, the Android application is extendable for other similar tasks and it showed robustness to work with many experts at the same time.
When this gold-standar be publicly available, it will be a very significant contribution to the scientific community, because at present there is no public gold-standard for HER2 assessment.
Finally, it is worth to remark that the first step for generating confidence in the clinical utility of techniques for automatic HER2 assessment is by means of a reliable gold-standard to evaluate their performance. Thus, it is very important to generate ways to use the opinion of a diversity of experts as the base of knowledge for automatic methods, tackling with all kinds of bias and known subjectivity.
Acknowledgements: The author thanks pathologists Gabler, Cornejo, Moyano, Gallegos, De Toro and Ramis for their collaboration in scoring biopsy sections. Thanks Center of Digital Pathology and the Biobank of Tissues and Fluids of the University of Chile for collection of biopsies. This research is funded by FONDECYT 3160559 & 1181823, CONICYT PIA ACT1402, ICM P09-015-F, CORFO 16CTTS-66390 and DAAD 57220037 & 57168868.
REFERENCES
1.Gurcan M., Boucheron L. Histopathological Image Analysis: A Review. IEEE Reviews in Biomedical Engineering, 2, 147–171. 2009 doi: 10.1109/RBME.2009.2034865. [DOI] [PMC free article] [PubMed] [Google Scholar]
2.Wolff A, Hammond M. Recommendations for human epidermal growth factor receptor 2 testing in breast cancer: American Society of Clinical Oncology/College of American Pathologists clinical practice guideline update. Journal of Clinical Oncology. 2013;31(31):3997–4013. doi: 10.1200/JCO.2013.50.9984. [DOI] [PubMed] [Google Scholar]
3.Akbar S, Jordan L. Comparing computer-generated and pathologist-generated tumour segmentations for immunohistochemical scoring of breast tissue microarrays. British Journal of Cancer. 2015;113(7):1075–1080. doi: 10.1038/bjc.2015.309. [DOI] [PMC free article] [PubMed] [Google Scholar]
4.Khan A, Mohammed A. A novel system for scoring of hormone receptors in breast cancer histopathology slides. 2nd IEEE Middle East Conference on Biomedical Engineering. 2014:155–158. [Google Scholar]
5.Press M., Sauter G. Diagnostic evaluation of HER-2 as a molecular target: an assessment of accuracy and reproducibility of laboratory testing in large, prospective, randomized clinical trials. Clinical Cancer Research. 2005;11(18):6598–6607. doi: 10.1158/1078-0432.CCR-05-0636. [DOI] [PubMed] [Google Scholar]
6.Fuchs T, Buhmann J. Computational pathology: Challenges and promises for tissue analysis. Computerized Medical Imaging and Graphics. 2011;35(7-8):515–530. doi: 10.1016/j.compmedimag.2011.02.006. [DOI] [PubMed] [Google Scholar]
7.Dobson L, Conway C. Image analysis as an adjunct to manual HER-2 immunohistochemical review: a diagnostic tool to standardize interpretation. Histopathology. 2010;57(1):27–38. doi: 10.1111/j.1365-2559.2010.03577.x. [DOI] [PMC free article] [PubMed] [Google Scholar]
8.Brugmann A, Eld M. Digital image analysis of membrane connectivity is a robust measure of HER2 immunostains. Breast Cancer Research and Treatment. 2012;132(1):41–49. doi: 10.1007/s10549-011-1514-2. [DOI] [PubMed] [Google Scholar]
9.Laurinaviciene A, Dasevicius D. Membrane connectivity estimated by digital image analysis of HER2 immunohistochemistry is concordant with visual scoring and fluorescence in situ hybridization results: algorithm evaluation on breast cancer tissue microarrays. Diagnostic Pathology. 2011;6(1):87–96. doi: 10.1186/1746-1596-6-87. [DOI] [PMC free article] [PubMed] [Google Scholar]
10.Chang V, Garcia A. Gold-standard for computer-assisted morphological sperm analysis. Computers in Biology and Medicine. 2017;83:143–150. doi: 10.1016/j.compbiomed.2017.03.004. [DOI] [PubMed] [Google Scholar]
J Pathol Inform. 2019 Apr 1;10:10.
Nagasaki-Kameda Digital Pathology Network Establishing a Role Model for Primary Diagnosis and Multidisciplinary Team Consultation with Effective Educational Attainment
Background: Evolution of whole-slide imaging (WSI) technology significantly impacted pathology practice. Implementation of digital pathology (DP) into the routine diagnostic environment is a current worldwide trend. However, in Japan, adoption of these advancements into daily pathology practice has not been widely achieved. Here we report our experience with deep integration of DP into routine workflow of the academic center and networking hospitals, which was aimed to facilitate primary diagnosis, multidisciplinary team consultation, and education.
Methods/Results: Nagasaki-Kameda DP network connecting academic institution (Nagasaki University Hospital), large-scale hospital (Kameda Medical Center), and several independent and affiliated centers [Figure 1], was established in 2017. Currently, when optimization phase is completed, the network is effectively employed on the “all day round” basis. Telepathology activities include remote sign-out sessions for primary diagnosis (three per day), tumor boards, multidisciplinary team consultations, journal clubs, research progress meetings, and regular international web conferences. WSI-based education essentially incorporated into all telepathology activities is highly attractive for pathology residents, rotating clinical fellows, and undergraduate medical students. Noteworthy, this DP model considers immediate adoption of AI technologies for diagnostic and research purposes. Our next goal is a transition to 100% digital, which is expected to be accomplished in 2018.
Nagasaki-Kameda Digital Pathology Network consists of 10 institutes
Conclusion: Smooth integration of WSI in routine pathology workflow is achievable in short time. Nagasaki-Kameda DP network can serve as a role model for primary diagnosis and multidisciplinary team consultation with effective educational attainment, which can be adopted by other institutions in Japan and abroad.
J Pathol Inform. 2019 Apr 1;10:10.
Diagnosing effusion fluid cytology using whole slide imaging and multiple instance learning
Introduction: The goal of screening effusion fluid cytology slide is to find if it contains malignant cells instead of identifying every single malignant cell, therefore, it fits in the framework of multi-instance learning (MIL) in machine learning.[1,2,3] We aimed to develop MIL algorithms to screen effusion fluid cytology.
Methods: The discovery set contained 40 fluid slides (20 malignant and 20 benign) and the validation set contained 38 different slides (19 malignant and 19 benign). All slides were scanned as whole slide images (WSIs). Eight disjoint sections from each WSI were selected (154 malignant and 166 benign images in discovery set, and 152 malignant and 152 benign images in validation set) [Figure 1]. A nucleus segmentation algorithm based on hierarchical multilevel thresholding (geometry, pixel intensity and textures) was used to extract Region of Interest (ROI).[4] Instances were constructed using two different methods: patches as instances (PAI) (each image was segmented as patches and each patch was an instance); and ROIs as instances (RAI) (50 largest ROIs were selected and each ROI was an instance) [Table 1].
Findings and Arguments: In discovery set, both methods showed excellent performance, although PAI seemed better than RAI (PAI: accuracy: 93%, and precision 92%; RAI: accuracy: 82%, precision: 90%) [Table 2]. However, in validation set, RAI seemed to perform better than PAI, although both methods performed worse than in validation set (PAI: accuracy: 66%, and precision 75%; RAI: accuracy: 78%, precision: 92%) [Table 3].
1.Dietterich T, Lathrop R, Lozano-Perez T. Solving the multiple instance problem with axis-parallel rectangles. Artificial Intelligence. 1997;89:31–71. [Google Scholar]
2.Dundar M, Badve S, Raykar V, Jain R, Sertel O, Gurcan M. A multiple instance learning approach toward optimal classification of pathology slides. International Conference on Pattern Recognition. 2010:2732–2735. [Google Scholar]
3.Xu Y, Zhu J.Y, Chang E, Tu Z. Multiple clustered instance learning for histopathology cancer image classification, segmentation and clustering, in: IEEE Conference on Computer Vision and Pattern Recognition. 2012:964–971. [Google Scholar]
4.Xu Y, Zhu J.Y, Chang E, Lai M, Tu Z. Weakly supervised histopathology cancer image segmentation and classification. Medical Image Analysis. 2014;18(3):591–604. doi: 10.1016/j.media.2014.01.010. [DOI] [PubMed] [Google Scholar]
J Pathol Inform. 2019 Apr 1;10:10.
Verification of deep learning to detect adenocarcinoma in TBLB using HALO AI®
Introduction: It has been shown that deep learning based on digital pathology can detect cancer cells with high accuracy.[1,2] Accurate identification of cancer cells in a small lung biopsy plays a vital role in the optimization of precision molecular diagnosis and targeted therapy. The purpose of our study was to verify the utility of deep learning on the whole slide images of TBLB which often pose diagnostic difficulties due to a wide range of artifacts. We used the deep learning software “HALO AI®” as deep learning algorithm. Our purpose is to investigate if HALO AI® can be used as a screening tool to detect cancer in TBLB material by reasonable amount of training.
Methods: Fifty cases of TBLB lung adenocarcinoma were retrieved from Nagasaki University Hospital (2014–2017). With HALO AI®, 10644 annotations from 200 fragments of 40 cases were annotated for training algorithm in 3 million times of iteration. Annotation had been done for 2 classes which are tumor and non-tumor. Testing of the algorithm was performed on 40 fragments from 10 different cases. To evaluate the accuracy of cancer recognition, the whole area of the tissue was broken into 14,611 blocks of 0.01mm2 in size. Sensitivity, specificity, and precision were calculated based on true and false detections in each block.
Findings and Argument: In average, our algorithm achieved 96.2% sensitivity and 85.2% specificity [Figure 1]. Among 10 tested cases, 2 showed lower sensitivity (91.6% and 84.1%, respectively) [Figure 2]. These 2 cases showed micropapillary adenocarcinoma. We found that micropapillary adenocarcinoma was not included in a training set [Figure 3].
Observed histological subtypes with number of fragments in tested cases
Conclusions: Training of deep learning algorithm, Halo AI®, by 40 cases of TBLB cases successfully detect pulmonary adenocarcinoma in high sensitivity and reasonable sensitivity. Coverage of wide histological variations in the training set is critical for the development of effective deep learning algorithms.
Keywords: Deep learning, TBLB
References
1.Kainz P. Segmentation and classification of colon glands with deep convolutional neural networks and total variation regularization. PeerJ. 2017 Oct 3;5:e3874. doi: 10.7717/peerj.3874. doi: 10.7717/peerj.3874. [DOI] [PMC free article] [PubMed] [Google Scholar]
2.Yamamoto Y, Saito A, Tateishi A, Shimojo H, Kanno H, Tsuchiya S. Quantitative diagnosis of breast tumors by morphometric classification of microenvironmental myoepithelial cells using a machine learning approach. Sci Rep. 2017;7:46732. doi: 10.1038/srep46732. [DOI] [PMC free article] [PubMed] [Google Scholar]
J Pathol Inform. 2019 Apr 1;10:10.
Double Steps of Deep Learning Algorithm Decrease Error in Detection of Lymph Node Metastasis in Lung Cancer Patients
Introduction: Lymph node metastasis plays an important role to evaluate stages, treatment and prognosis of lung cancer. Using a deep learning algorithm to detect metastasis in lymph nodes has attracted much attention but there are still errors due to cancer mimickers such as lymphoid follicles, macrophages. We hypothesized that lymphoid follicles are the most error-causing factor, therefore using double steps deep learning can reduce mistake and increase accuracy in detection of lymph node metastasis with the first step to exclude lymphoid follicles and the following step to detect tumor.
Methods: Total of 327 glass slides of lymph nodes of lung cancer patients were collected from 2014 to 2018 in Nagasaki University Hospital and from 2007 to 2018 in Kameda hospital, then were scanned by 40x objective by Aperio Scanscope CS2 scanner. 224 digital slides (100 with and 124 without metastasis) were used for the training algorithm, and 106 digital slides (49 with and 57 without metastasis) were for testing the algorithm acquired by Halo AI 2.2 ® software. The task of the first step was to exclude lymphoid follicles, and the second step was to detect cancer cells. In the first step, we created three models (one random forest model and two deep learning models with different features of input training classifier – 2 and 3 classes) and the best one was chosen. The task of the second step was to detect cancer cells by the other third deep learning model. After all, the two steps would be combined by applying the third deep learning model on top of analyzed layer (after excluding lymphoid follicles) of the best model choosing from the first step. In the end, we compared the results of metastasis detection between double steps and single step deep learning algorithms.
Results and Discussion: Within the three models of the first step, the model of 2-classes-deep learning interpreted the best result compared to two other models for the task of excluding lymphoid follicles. It showed the best-fit shape of lymphoid follicles with no false positive or false negative results which were observed in the results of the two others. Therefore, this model was chosen to exclude lymphoid follicles in the testing set that can reduce error effectively. The result of double steps deep learning algorithm demonstrated an advantage compared to single step when showing 36.5% and 5.4% in average of reduction of error in all cases with statistical significance between groups with lymphoid follicles and without lymphoid follicles, respectively. In the group with lymphoid follicles, double steps could decrease up to 89% of error and remained true detection of tumor areas in metastatic cases [Figure 1]. This result showed the important role of the first step to exclude lymphoid follicles which can be considered as the most frequent error we can find when any deep learning-based algorithm is used to detect cancer. For the task of metastasis detection, our double steps deep learning algorithm showed 100% sensitivity in detection of variable size of tumor which are macro-metastasis, micro-metastasis and ITC (isolated tumor cells) in lymph node slides. In case of no metastasis, we found some small false positive foci in lymph node slides. Those small errors remained due to a fixed low threshold (50%) of tumor possibility of deep learning algorithm which we cannot tune currently.
Reduction of the false positive area of double steps compared to single step deep learning algorithm. From metastatic slide (a) and no metastatic slide (d), single step demonstrated both of cancer cells and germinal center of lymphoid follicles as tumor (b and e) but double steps deep learning could interpret true tumor with a reduction of large false positive area (c and f)
Then we examined the appropriate size of all small false positive foci to reduce false positive slides and found a cut-off point of 1.1mm, with above that threshold, our algorithm could succeed in the detection of no metastatic lymph node. Adjusted cut-off point of 2 mm (micro-metastasis size, practical value) showed the same result with 1.1 mm cut-off point, which means our method can detect metastatic lymph node slides when tumor is larger than micro-metastatic size with 100% accuracy, or we can detect all metastasis and no metastasis case if we ignore all of false positive foci smaller than that size.
Conclusion: By using our double steps method, we can detect lymph node metastasis of lung cancer patient with a large reduction of error compared to only using single step. Limitation of several remaining small false positive foci can be improved in the next version of deep learning software.
J Pathol Inform. 2019 Apr 1;10:10.
A Novel Multidimensional Texture Analysis Approach for Automated Grading of Invasive Breast Carcinoma
Introduction: During the visual examination of the biopsy specimen of the tissue, pathologists look for certain features that can help them predict disease prognosis. The grading of the invasive breast carcinoma is classified into a three-point scale: Grade 1, 2, 3.[1] However, the visual qualitative assessment is a labor and time-consuming task[2] and results in inter- and intra-observer variation in diagnosis, i.e., different pathologists may come up with diverse interpretations, leading to different diagnoses, or the same pathologist may make different diagnosis at different times for the same set of histological images.[3] Due to the important role of histological grading to the treatment of breast cancer, we address the problem of automated grading of invasive breast carcinoma through the encoding of histological images as VLAD (Vector of Locally Aggregated Descriptors) representations on the Grassmann manifold. Various methods[4] of automatic Breast Cancer (BC) grading have been proposed in the literature in order to increase the accuracy and reproducibility of diagnosis. In most of the cases the main challenges are the accurate segmentation[9] and detection of histologic primitives, such as nuclei, as well as the extraction of a number of suitable textural or spatial features in order to model the pathologist's knowledge used in clinical practice. On the other hand other approaches have used deep-learning techniques[5] aiming to address the problem by extracting knowledge directly from the data. We propose a novel approach for the grading of invasive breast carcinoma, which considers each histological image as a set of multidimensional spatially-evolving signals that can be efficiently represented as a cloud of points in a non-Euclidean space, such as a Grassmann manifold.
Method: The proposed method considers each Hematoxylin and Eosin (H&E) stained breast cancer histological image as a set of multidimensional spatially-evolving signals that can be efficiently represented as a cloud of Grassmannian points, enclosing the dynamics and appearance information of the image. By taking advantage of the geometric properties of the space in which these points lie, i.e., the Grassmann manifold, we estimate the VLAD encoding[6] of each image on the manifold in order to identify the grading of invasive breast carcinoma, as shown in Figure 1 below. To evaluate the efficiency of the proposed methodology, two datasets with different characteristics were used. More specifically, we created a new medium-sized dataset consisting of 300 annotated images (collected from 21 patients) of grades 1, 2 and 3, while we also provide experimental results using a large dataset, namely BreaKHis, containing 7,909 breast cancer histological images, collected from 82 patients, of both benign and malignant cases.
Findings and Argument: Experimental results have shown that the proposed method provides high detection rates in both cases (average classification rates of 95.8% and 91.38% with our dataset and the BreaKHis dataset, respectively), outperforming a number of state of the art approaches (Figure 2). The contributions of this paper are summarized as follows: i) We introduce a new methodology for the modelling of static breast cancer histological images through higher-order linear dynamical systems analysis. ii) We demonstrate that each histological image can be represented as a cloud of points on the Grassmann manifold and we propose the VLAD encoding of each image on the non-Euclidean space. iii) To evaluate the efficiency of the proposed methodology, we created a new dataset of 300 annotated images of grades 1–3,[7] while we also provide experimental results using the well-known BreaKHis dataset[8,9] containing 7,909 breast histological images of both benign and malignant cases.
The average image classification rates of the proposed method and the CNN-based deep learning approach presented in[5]
Conclusions: The key advantage of the proposed method over existing methods is the fact that it exploits both image dynamics and appearance information, while at the same time it avoids the detection of the histologic primitives, such as nuclei. In medical laboratories, the proposed methodology could be proved a powerful tool that can be used either as a screening tool or to solve efficiently the problem of inter-observer variations in the assessment of the subjective criteria.
1.Elston CW, Ellis IO. Pathological prognostic factors in breast cancer. I. The value of histological grade in breast cancer: experience from a large study with long-term follow-up. Histopathology. 1991;19(5):403–410. doi: 10.1111/j.1365-2559.1991.tb00229.x. pmid:1757079. [DOI] [PubMed] [Google Scholar]
2.Robbins P, Pinder S, de Klerk N, Harvey J, Sterrett G, Ellis I. Histological grading of breast carcinomas: a study of interobserver agreement. Human Pathology. 1995;26(8):873–879. doi: 10.1016/0046-8177(95)90010-1. pmid:7635449. [DOI] [PubMed] [Google Scholar]
3.Dimitropoulos K, Barmpoutis P, Koletsa T, Kostopoulos I, Grammalidis N. Automated Detection and Classification of Nuclei in PAX5 and H&E stained Tissue Sections of Follicular Lymphoma. Signal, Image and Video Processing, Springer. 2017;11(1):145–153. [Google Scholar]
4.Veta M, Pluim JP, van Diest PJ, Viergever MA. Breast cancer histopathology image analysis: a review. IEEE Trans Biomed Eng. 2014;61(5):1400–1411. doi: 10.1109/TBME.2014.2303852. pmid:24759275. [DOI] [PubMed] [Google Scholar]
5.Spanhol FA, Oliveira LS, Petitjean C, Heutte L. Breast cancer histopathological image classification using Convolutional Neural Networks. International Joint Conference on Neural Networks. 2016 Nov;:24–29. [Google Scholar]
6.Jegou H, Douze M, Schmid C, Pérez P. Aggregating local descriptors into a compact image representation, Computer Vision and Pattern Recognition. 2010 Jun;:13–18. [Google Scholar]
7.Breast carcinoma histological images from the Department of Pathology, “Agios Pavlos” General Hospital of Thessaloniki, Greece. [Accessed: 26th July 2017]; Available from: https://zenodo.org/record/834910#.WXhxt4jrPcs . [Google Scholar]
8.Spanhol FA, Oliveira LS, Petitjean C, Heutte L. A dataset for breast cancer histopathological image classification, IEEE Transactions of Biomedical Engineering. 2016;63(7):1455–62. doi: 10.1109/TBME.2015.2496264. [DOI] [PubMed] [Google Scholar]
Introduction: Maccabi Healthcare Services is a large healthcare provider with a centralized pathology institute, handling 120,000 histology accessions per year, of which 700 are prostate core needle biopsies (PCNBs). While cases that are diagnosed as cancerous undergo independent review by a second pathologist, 60% of PCNBs are diagnosed as benign by a single pathologist and do not undergo further review. In order to ensure accurate and rapid diagnosis, and to provide an additional quality control measure, we collaborated with Ibex, a startup company developing AI for cancer diagnostics. Ibex has developed software that enables identification of various cell types and features within whole slide images of PCNBs, including cancerous glands (Gleason patterns 3, 4 and 5), high-grade PIN and inflammation, to support the pathologist in his diagnosis.
Methods: Two studies were conducted: a retrospective study, in which the algorithm was run on 80 cases previously diagnosed by a pathologist as benign, as well as on samples from two additional institutes, and a prospective study in which the algorithm was deployed as a QC system on all new PCNBs, beginning March 2018. In both studies the system raised alerts when encountering discrepancies between the automated analysis and the pathologist diagnosis, prompting a second pathologist review. The performance of the algorithm, including AUC, sensitivity and specificity, were assessed, as compared to a gold-standard of the pathologist's diagnosis.
Results: Retrospectively, the algorithm identified missed cancers in all three institutes. In Maccabi two cases of missed cancer were identified by the algorithm. In both cases, the algorithm identified small foci of Gleason 3, subsequently confirmed by IHC. EMR data for these cases demonstrate that 2 years after the initial biopsy, they were diagnosed with higher grade cancer and underwent radical prostatectomy. Cases of missed cancers identified in the two additional institutes were confirmed by a second pathologist review as cancerous. Prospectively, deployment of the algorithm in Maccabi identified a case of low-grade cancer diagnosed by the pathologist as benign [Figure 1]. The algorithm's performance on the retrospective data from the three institutes is detailed in Table 1.
Conclusions: AI-based diagnosis in prostate cancer can increase diagnostic speed and accuracy, and has demonstrated clinical utility. To our knowledge, this is the first AI-based digital pathology diagnostic system running in a live clinical setting.
J Pathol Inform. 2019 Apr 1;10:10.
Hierarchical Crowdsourcing for Generating Large-Scale Annotations of Histopathology
Introduction: Deep learning algorithms hold promise for pathology, but require very large datasets for building accurate prediction models. Obtaining annotations at large scales is challenging given constraints on pathologist time, particularly when carefully delineating histologic structures. Most previous applications of crowdsourcing in histopathology were limited to small-scale IHC scoring tasks and malaria diagnosis, and there has been little attention to scalable generation of H&E annotations of histopathology.[1] We investigated how a web-based platform can facilitate crowdsourced annotation, and how varying levels of expertise can be leveraged to efficiently annotate whole-slide images at scale.
Methods: We used the Digital Slide Archive, an online platform, to coordinate the efforts of 25 volunteers (2 senior pathologists, 3 residents, and 20 medical students and graduates) [Figure 1].[2] Regions were selected in 151 whole-slide images and assigned to volunteers based on difficulty and experience. Training and feedback for junior volunteers was provided using a Slack team chat service [Table 1], and slides were reviewed for corrections by senior pathologists at the end of the study. A set of 10 common slides were also annotated by all volunteers to assess inter-reader discordance.
The Digital Slide Archive HistomicsTK interface. Participants created annotations in the form of free-hand polygons that were assigned a style based on a pre-existing template
Table 1.
Sample instructions used and rationale to standardize annotation process
Instruction
Rationale
When tissue extends beyond ROI, extend annotation to slightly overlap boundary
Reduces false gaps between ROI boundary and annotation polygons in final mask
When region is too large to enclose, use multiple overlapping polygons
Reduces deleterious impact of participant fatigue on annotation accuracy
Minimize gaps between annotations of different region classes
Prevents background class (stroma) from being automatically assigned to these pixels
Clear definition of “baseline” or background class
Reduces annotation load by assigning anything not annotated with the label “stroma”
Findings and Argument: More than 20,000 annotations were generated to delineate classes including tumor, stroma, necrosis, lymphocytic infiltration, plasma-cell infiltration, and artifacts. Median concordance between pathologists and junior reviewers was 0.73 overall (compared to 0.76 concordance between pathologists). Concordance for pre- and post- correction is 0.92, suggesting good agreement between pathologists and junior volunteers. Tumor and stromal regions had higher concordance than classes that occur rarely or that require more subjective judgment.
Conclusions: Online tools are important for facilitating crowdsourced histopathology annotation. Organizing volunteers by experience can help scale annotations and leverage volunteers who are enthusiastic but less experienced.
References
1.Alialy R, Tavakkol S, Tavakkol E, Ghorbani-Aghbologhi A, Ghaffarieh A, Kim SH. A review on the applications of crowdsourcing in human pathology. J Pathol Inform. 2018;9:2. doi: 10.4103/jpi.jpi_65_17. [DOI] [PMC free article] [PubMed] [Google Scholar]
2.Gutman DA, Khalilia M, Lee S, Nalisnik M, Mullen Z, Beezley J. The digital slide archive: A software platform for management, integration, and analysis of histology for cancer research. Cancer Res. 2017;77:e75–8. doi: 10.1158/0008-5472.CAN-17-0629. [DOI] [PMC free article] [PubMed] [Google Scholar]
J Pathol Inform. 2019 Apr 1;10:10.
Survey of Basic Knowledge and Attitude toward Autopsy of the First-Year Residents in Faculty of Medicine Ramathibodi Hospital
Introduction: Autopsy is one of essential medical procedures, mainly aiming for exploring the cause of death and also useful in many perspectives such as clinical-diagnosis preciseness and treatment-quality control. However, nowadays, the autopsy rate is apparently declining in every level of medical institute all around the world. As the result, recent medical personnel may not get used to the autopsy. Thus, we conducted this study to evaluate the basic knowledge and attitude toward autopsy in the first-year residents in Faculty of Medicine Ramathibodi Hospital.
Methods: A cross-sectional study was conducted by questionnaires-based survey. Two-page Thai questionnaires were provided to all of the first-year residents in our institute from all departments in the academic year of 2017. The questionnaires consisted of three parts as followings; demographic information, basic knowledge question, and attitude question. The questionnaires received with the complete answers were included for the analysis.
Results: The questionnaires was applied to 211 residents. The response rate was 68.2% (144/211). The majority was female (90/62.5%) and was in the age between 26 to 28 years old (88.8%). The residents from all departments were included in the study with the majorities from medicine (18%), radiology (16%) and surgery (12%) departments. Only one-third had experience in autopsy witness. Most of them (84.7%) had no background about the clinical autopsy, including its process and limitations. The great majority considered autopsy is necessary (86.1%) and useful (95.8%). The respondents thought the utility of autopsy was exploration the cause of death (95.8%), while the factor mainly influenced on cancelling autopsy was refusal by next-to-kin (83.3%). About half of them (52%) would permit autopsy on their passed-away relatives to explore the death cause (84%). While the remains believed the cause of death was already known (71%). Fifty-eight percent would like to witness autopsy. Ninety-three percent wanted an educational session providing the knowledge about autopsy to be held, and 70.1% would like to attend.
Conclusion: The knowledge of autopsy among the first-year residents was poor. However, they had positive attitudes toward autopsy. An education for autopsy should be routinely held in the residency training programs.
References
1.Burton JL, Underwood J. Clinical, educational, and epidemiological value of autopsy. Lancet. 2007;369:1471–80. doi: 10.1016/S0140-6736(07)60376-6. [DOI] [PubMed] [Google Scholar]
2.Cox JA, Lukande RL, Kateregga A, Mayanja-Kizza H, Manabe YC, Colebunders R. Autopsy acceptance rate and reasons for decline in Mulago hospital, Kampala, Uganda. Trop Med Int Health. 2011;16:1015–8. doi: 10.1111/j.1365-3156.2011.02798.x. [DOI] [PubMed] [Google Scholar]
3.Hull MJ, Nazarian RM, Wheeler AE, Black-Schaffer WS, Mark EJ. Resident physician opinions on autopsy importance and procurement. Hum Pathol. 2007;38:342–50. doi: 10.1016/j.humpath.2006.08.011. [DOI] [PubMed] [Google Scholar]
4.Kotabagi RB, Charati SC, Jayachandar D. Clinical autopsy vs. medicolegal autopsy. Med J Armed Forces India. 2005;61:258–63. doi: 10.1016/S0377-1237(05)80169-8. [DOI] [PMC free article] [PubMed] [Google Scholar]
5.Loughrey MB, McCluggage WG, Toner PG. The declining rate and clinician's attitudes. Ulster Med J. 2000;69:83–9. [PMC free article] [PubMed] [Google Scholar]
7.McPhee SJ. Maximizing the benefits of autopsy for clinicians and families. What needs to be done. Arch Pathol Lab Med. 1996;120:743–8. [PubMed] [Google Scholar]
8.Oluwasola OA, Fawole OI, Otegbayo AJ, Ogun GO, Adebamowo CA, Bamigboye AE. The autopsy: Knowledge, attitude, and perceptions of doctors and relatives of the deceased. Arch Pathol Lab Med. 2009;133:78–82. doi: 10.5858/133.1.78. [DOI] [PubMed] [Google Scholar]
J Pathol Inform. 2019 Apr 1;10:10.
Application of live dynamic whole slide imaging to support telepathology in intraoperative frozen section diagnosis
Background: In order to support intraoperative frozen section (FZN) pathology consultations, it is critical to transmit histologic images in real-time. This includes the need to be able to adjust focus in the plane of section, a feature not well supported by most whole slide imaging (WSI) devices. We have used the Mikroscan D2 Digital Slide Scanner (D2) (Mikroscan Inc, Carlsbad, California (CA)) and most recently the Mikroscan SL5 Digital Scanner (SL5) at Henry Ford Health System to support this service.
Methods: Henry Ford Health Systems pathology and laboratory department serves six hospitals, connecting over thirty pathologists within the system. Mikroscan D2 and SL5 devices were used for variety of FZN consultations. These systems use live dynamic WSI allowing for real time, live viewing of pathology slides without prior digitization, allowing for real time changes in magnification and ability to change the focus in the plane of section. Remote viewing is provided through Splashtop Business screen sharing. Recently, SL5 was introduced with new features and advantages compared to D2.
Findings and Argument: While D2 was advantageous in supporting services, SL5 allowed for faster, more reliable operation. Over three years these systems were used successfully to support FZN eliminating the need for specialty pathology on site. Our study features detail differences between these systems and their operation:
Pre-scan time for 2 slides from 1:30 to 2 minutes has been reduced to 18 seconds
Automatically detects one slide or two
Objective switching time reduced from 8 seconds to 1.5 seconds
6x faster loading slides to view
5x faster switching between objectives
60% lighter
2x faster scanning Scan Times dramatically reduced
Single SIMPLE program for both scanning and live, with licensing to turn on or off live or scanning
Can setup and scan both slides at once, not one at a time
Autofocus time and accuracy dramatically improved
Can take ”Z-Snaps” or focusable pictures of a field of view
Auto-browse mode that provides for definition of a region, and ability to scroll through live ensuring complete coverage of tissue
Heat map is toggleable and opacity adjustable
When slide holder is ejected, the stage is secured in position with an electromagnet to prevent unwanted motion
Contains set of 5 objectives by default (2, 4, 10, 20, and 40)
Consistent image quality improvement by an order of magnitude [Figures 1–6].
Images are large pyramidal TIFF files, rather than a proprietary file type, and are viewable in universal viewers.
Conclusion: To support frozen section, live dynamic WSI as deployed by Mikroscan D2/SL5 is effective for real time changes in objective magnification, and focus adjustment, features not typically implemented in WSI device. We have successfully used this technology to support FZN services.
J Pathol Inform. 2019 Apr 1;10:10.
Concordance between Traditional Light Microscopy and Whole Slide Imaging in Determining Presence of Tumor in Cutaneous Enface Frozen Sections
Background: Whole slide imaging (WSI) has demonstrated accuracy in the interpretation of permanent and frozen sections in surgical pathology. No study has evaluated the accuracy of WSI in assessing tumor presence in cutaneous en face frozen sections.
Methods: The records and histologic samples from twenty patients with cutaneous keratinocyte carcinoma who underwent Mohs micrographic surgery (MMS) in 2018 at a single academic medical center were retrospectively selected. A glass slide from each patient was obtained, each containing cutaneous frozen sections prepared en face as part of the patient's MMS procedure. Ten slides contained residual tumor and ten were free of tumor. A blinded fellowship-trained dermatologic surgeon (N.Y.V.) used LM to assess all twenty slides for presence of tumor, while noting other findings such as inflammation, hemorrhage, benign peri-follicular proliferation, missing tissue, or artifact. We recorded the time required to make the determination of presence of tumor and the surgeon's level of confidence on a subjective 1-10 scale in making the determination. After a seven-day period, the same dermatologic surgeon repeated the process using WSI on the same 20 slides, each de-identified, randomized and scanned at 20x using the Aperio AT2 (Leica Biosystems, Wetzlar, Hesse, Germany). Digital slides were viewed on a 24-inch Hewlett-Packard EliteDisplay E241i monitor using the Leica Aperio eSlideManager v12.3.3.5049 software running on Internet Explorer v11.
Statistical Analysis: Concordance was assessed using Cohen's kappa coefficient. Differences of means were evaluated using paired t tests.
Results: In the determination of tumor presence, percent agreement between LM and WSI was 100%, with Cohen's kappa of 1.0. The average time taken to determine tumor presence was 1.7 min with LM and 2.9 min with WSI. This difference was statistically significant (mean difference 1.3 min, 95% CI 0.8 – 1.7, p=.0005, n=19). Similarly, the surgeon's confidence in making the determination of tumor presence was 9.6 using LM, and 8.27 using WSI. This was also statistically significant (mean difference 1.3, 95% CI 0.56 – 2.0, p=.002, n=20). In three of the ten slides with residual tumor, the surgeon labeled the tumor differently when viewed under LM and WSI. Overall, however, these differences were considered minor (e.g., superficial basal cell instead of just basal cell carcinoma). Figures 1a–c are examples of digital images of frozen sections from the cases in this study.
Examples of digital pathology of cutaneous sections prepared en face. A whole slide image, which contained no tumor, prepared by single section method (a, hematoxylin-eosin). Crops from whole slide images showing a superficial basal cell carcinoma (b, hematoxylin-eosin) and a well-differentiated squamous cell carcinoma (c, hematoxylin-eosin)
Discussion: This pilot study suggests that WSI is as accurate as LM in determining tumor presence on a single slide containing cutaneous frozen sections prepared en face. One promising aspect of telepathology is the expansion of access to intraoperative subspecialty expertise. With newer WSI technology, the process of slide scanning is largely automated, which enables the scanning of large number of slides feasible. This is particularly important in MMS in which sections from multiple slides are necessary to determine whether a tumor cleared with excision, and to determine whether a proliferation is benign (i.e., benign follicular hyperplasia) or malignant. For WSI to be useful as a tool for intraoperative consultation of challenging frozen sections in MMS, the process of slide scanning followed by transmission to a server must occur quickly. With our Leica Aperio AT2 WSI system, this is feasible because a whole slide can be scanned at 20x and uploaded to the server in under five minutes (personal communication). Currently, however, intra-operative consultation of challenging cases rarely occurs in our MMS practice, thus not justifying the high cost of implementing WSI for this purpose. A drawback observed with WSI was the significant increase in time taken to determine tumor presence compared to LM, with a mean difference of 1.3 minutes—a 72% increase. This was largely attributed to the lag that occurred with changing the magnification and maneuvering the slide using a keyboard and mouse. Our proof-of-concept study has several limitations: (1) Small sample size, (2) short one-week period between using LM and WSI for evaluating the slides, which may have helped the dermatologic surgeon to more accurately determine whether a slide contained tumor when WSI was used, (3) Assessed the accuracy of WSI compared to LM for a single evaluator.
Conclusion: To the best of our knowledge, this is the first study to compare the accuracy between WSI and LM in the diagnosis of keratinocyte carcinoma in frozen sections prepared en face. This proof-of-concept study suggests that concordance is excellent between LM and WSI. However, WSI was cumbersome to use, not ergonomic, and inefficient. This study is limited by the small sample size, the short time interval between the evaluation of slides by each technology, and in having a single evaluator. Future studies with longer period between evaluating slides using LM and WSI may better assess the true concordance.
J Pathol Inform. 2019 Apr 1;10:10.
Validation of Telepathology for the Assessment of Adequacy of Renal Biopsies
Introduction: Complete evaluation of a renal biopsy is a complex process requiring a highly-skilled renal pathologist examining multiple serial sections of tissue by light microscopy, immunohistochemistry, and electron microscopy. The process to obtain an adequate biopsy sample requires a trained observer, usually the pathology resident or renal pathologist, assessing samples under light microscopy in real-time for sufficient glomerular content and the presence of renal cortex and medulla.[1] The pathologist is not always immediately available to assess the sample and delays in patient care may arise as a result of scheduling conflicts between the pathologist and interventional radiologist performing the procedure. Digital pathology has already proven to be a suitable platform in nephropathology for renal biopsy evaluation and presents a potential solution through the use of telepathology for real-time transmission of image data between remote devices.[2,3]
Methods: Renal biopsies (17) were obtained in interventional radiology at a satellite center and triaged according to the following protocol: tissue obtained from the first 2 passes was brought to the frozen section room equipped with a telepathology system (AperioLV1 scanner). The fresh tissue was placed on glass slides immersed in saline solution, and viewed under the microscope connected to a camera and computer. The expert pathologist at the main hospital accessed the password protected intranet system to view the tissue while communicating with the frozen section operator.
Findings and Argument: In 8/17 cases additional cores were requested (maximum 5 total – average 3.1 cores/case). All biopsies contained glomeruli, ranging from 4-26 (mean 15.8) for H, 0-13 (mean 4.6) for IF, and 0-10 (mean 4.1) for EM [Figure 1]. When compared to 10 randomly selected where adequacy was assessed conventionally, 6/10 cases had between 3 and 5 cores (average 3.1 cores/case). The number of glomeruli reported varied from 8-36 (mean 16.8) for LM, 1-14 for IF (mean 6.7), and 0-15 (3.7) for EM [Figure 2]. We therefore show no difference between conventional assessment of renal biopsies through light microscopy and the use of digital scanner technology (p=0.73) (see Table 1).
Conclusions: The application of telepathology for assessment of renal cortex is a practical methodology to obtain adequate tissue for triaging, comparable to conventional light microscopy. Telepathology facilitates the centralization of assessment, increasing efficiency and making better use of the pathologist's time and expertise.
1.Walker, Patrick D, Tito Cavallo, Stephen M. Bonsib. “Practice guidelines for the renal biopsy.”. Modern Pathology. 2004;17:12. doi: 10.1038/modpathol.3800239. 1555. [DOI] [PubMed] [Google Scholar]
2.Rosenberg, Avi Z. “The application of digital pathology to improve accuracy in glomerular enumeration in renal biopsies.”. PLoS One. 2016;11:6. doi: 10.1371/journal.pone.0156441. e0156441. [DOI] [PMC free article] [PubMed] [Google Scholar]
3.Zee, Jarcy “Reproducibility and Feasibility of Strategies for Morphologic Assessment of Renal Biopsies Using the Nephrotic Syndrome Study Network Digital Pathology Scoring System.”. Archives of pathology & laboratory medicine 142.5. 2018:613–625. doi: 10.5858/arpa.2017-0181-OA. [DOI] [PMC free article] [PubMed] [Google Scholar]
J Pathol Inform. 2019 Apr 1;10:10.
Troubleshooting a Common Scanning Error in Digital Pathology
Introduction: At Cleveland Clinic, histology special stain control slides are scanned daily, using an Aperio ScanScope® AT Turbo scanner, for all pathologists to quickly and conveniently view. Due to the volume of daily control slides, a customized parameter setting is utilized, allowing the scanner to automatically scan by detecting the control tissue, drawing the scan area, and placing the white balance calibration point on a blank area of the slide. A common error that occurs during control slide scanning is banding, characterized by vertical, light or dark colored lines extending throughout the length of the scan, resulting in a poor quality image [Figure 1 for an example]. 6% of all control slides need rescanning due to banding errors. This rescan rate is above the recommended international clinical guidelines of a 5% rescan rate.[1] Additionally, banding accounts for about half of all scanning errors. The possible causes of banding are a dirty microscope objective, a deteriorating scanner light bulb, poor network speed/connection, or a poor calibration result (due to tissue or debris under the calibration point). The purpose of this project was to troubleshoot why so many banding errors were occurring with the control slides.
Methods: A dirty microscope objective and a deteriorating light bulb were not considered causes of banding, as routine objective cleaning and bulb changes are performed as recommended by the scanner manufacturer.[2] The network speed/connection was also excluded after further testing. Reviewing the calibration results: The calibration results of the banded images were reviewed. As expected, the scanner had placed the calibration point on, what appeared to be, a blank area of the slide; although, placement in close proximity to the tissue was noted. Therefore, it did not seem that the calibration result was the cause of banding. Using a different parameter setting: After finding that the calibration result was not seemingly the cause of banding, it was thought that the controls parameter setting could be the problem. This was tested by auto-scanning the control slides using a different parameter setting. However, multiple banding errors still occurred. Since this same parameter setting had successfully auto-scanned hundreds of H&E slides in the past, it seemed unusual that it was unsuccessful with the control slides. The conclusion was that there could be an issue with the control slides and not the controls parameter setting. Testing the controls parameter setting: To further prove that the problem was not with the controls parameter setting, 40 random H&E slides were auto-scanned using the controls parameter setting and no banding errors occurred. This confirmed that the controls parameter setting was not faulty and that the control slides must be contributing to the banding errors. Creating a new controls parameter setting: Finally, the controls parameter setting specifications were reviewed. The scanner was placing the calibration point in close proximity to the tissue, therefore, the controls parameter setting was adjusted to place the calibration point further from the tissue to increase the likelihood of a better quality scan [Figure 2]. The control slides were auto-scanned with this new parameter setting for five consecutive days. No banding errors occurred. The control slides were then scanned for four months, after the initial week, using the new controls parameter setting and minimal banding errors occurred.
Calibration point placement with original controls parameter setting versus with new controls parameter setting. The new controls parameter setting has placed the calibration point further from the tissue resulting in fewer banding errors
Findings and Argument: Before creating and implementing the new parameter setting, just over 6% of the controls slides had banding errors (about 40 slides/month). After using the new parameter setting for four months, the number of control slide banding errors decreased to 1% (about 6 slides/month) [Figure 3]. Furthermore, an average of 53% of all rescanned slides were due to banding errors. After creating the new parameter setting, only 14% of rescanned slides were due to banding, resulting in a dramatic 39% decrease over a four month period. The decrease in banding errors contributed to lowering the overall rescan rate, of all scanned slides, from 4% to 3%.
Percentage of control slides with banding errors over an eight month period
Conclusion: One possible conclusion is that background staining or debris is present near the control tissue, and may not be immediately visible. Many histology special stains require the use of silver and/or other reagents that can leave background staining around the tissue.[3] The calibration point, originally being placed too close to the tissue, may have detected this debris, corrupting the white balance of the scan and resulting in banding. Since the special stain control slides may be problematic, this new parameter setting that places the calibration point further from the tissue, necessarily reduces the risk of banding and a poor quality image.
References
1.García-Rojo M. International clinical guidelines for the adoption of digital pathology: A Review of technical aspects. Pathobiology. 2016;83:99–109. doi: 10.1159/000441192. [DOI] [PubMed] [Google Scholar]
2.Leica Biosystems. Aperio AT Turbo User's Guide. MAN-0205, Revision K. Vista, CA: Leica Biosystems. 2014:28–9. [Google Scholar]
3.Carson FL. 2nd ed. Revised Reprint. Chicago, IL: American Society for Clinical Pathology Press; Histotechnology: A Self-Instructional Text. [Google Scholar]
J Pathol Inform. 2019 Apr 1;10:10.
Joint Project of Health Check Facilities in Vietnam, One Business Model of International Telepathology
Introduction: We opened a health check facility in Ho-Chi-Minh city serving the Japanese standard health check system in Vietnam. This decision was made based on the successful telepathology conference with Cho-Ray Hospital (CRH) in 2011 and 2015. It opened this late September. I’d like to report the issues in international WSI telepathology full double-check system in preparation stage and the early stage of operation and discuss the possibility of business model.
Methods: This is a joint business between CRH and our University named HECI (Health Evaluation and Prevention Center, Cho Ray Hospital and International University of Health and Welfare). CRH provides building, doctors, nurses, staffs, etc., while our University provides medical equipment, system infrastructures, advisors, training opportunities in Japan, and remote diagnosis of medical images from Japan. Most samples for pathology examination are endoscopic biopsy specimens and gynecological cytology specimens. We are outsourcing the slide preparation and primary diagnosis to the CRH. We accepted three Vietnamese pathologists from CRH to study in Japan. We are asking them to write the primary diagnosis in English. As a WSI scanner, we use NanoZoomer S 210 (Hamamatsu Photonics, Japan). For histology slides, at least 3 consecutive slices are mounted on a same slide glass to avoid folding or partial deletion of the slices, and scan them using 40x mode. Cytology slides are prepared by Liqui-Prep method. They are screened and diagnosed by Vietnamese pathologists using conventional microscope. If the slide is negative (NILM in Bethesda), we scan only the central 10x10 mm square region with 40x and 7-layer Z-stack mode. Positive case will be scanned with at most 5 regions of interest (ROI) with 40X and 7-layer Z-stack mode. Then, we login to the HECI pathology information system from Japan through leased line, and double-check the report viewing the WSIs. Final diagnosis is done by Vietnamese pathologists in both English and Vietnamese.
Findings and Argument: The response of WSI viewing is acceptable. Combination of pathology information system and WSI is comfortable even accessing Vietnam from Japan. According to the primary plan, the total pathology system will be run in English, but later we are asked to change format to make Vietnamese people can read the results. We are now working to make many minor adjustments.
Conclusion: As a business model, this may not be good to make a profit because of the difference of employment cost. But our University may get good opportunities to widen our appeal to the world. Our university is now planning to expand this system to the south-eastern Asian countries.
J Pathol Inform. 2019 Apr 1;10:10.
Design and Use of a Digital Slide Library for Pathology Resident Education
Background: The University of Alberta Anatomical/General Pathology and Dermatology residency programs traditionally used private collections of glass slides in the training and education of pathology and dermatology residents. The Royal College of Physicians and Surgeons of Canada, the accreditation and certification body for all Canadian residency programs, is now using digital Whole Slide Images (WSI) in their pathology certification examinations. Using WSI for resident training will emulate how residents will view cases during these examinations. Here, we describe our experience transitioning to a digital pathology platform.’
Methods: Database design: The digital slide scanner and database selected by DynaLIFE was the Aperio ScanScope and eSlide Manager Version 12.3 (Leica Biosystems Imaging, Vista, CA, USA). Two staff members were identified as key operators of the ScanScope CSO and eSlide Manager System administrators. Vendor training was provided during product installation and a proof of concept pilot week. DynaLIFE Information Technology department worked with Leica Biosystems Imaging to develop an IT infrastructure that would provide a secure environment for viewing stations inside the DynaLIFE network and allow authorized outside users to access eSlide Manager without entering the DynaLIFE network [Figure 1]. The resident library curators designed case metadata fields to contain searchable parameters.
Database Use: 16 Anatomical Pathology (AP) residents, 5 General Pathology (GP) residents, 15 Dermatology residents, 5 teaching pathologists including a dermatopathologist and staff pathologists were provided with access credentials to use the Digital Slide Library. The AP and GP residency programs used anonymized slide scans for bi-annual in-house resident exams. The dermatopathologist used anonymized slides for bi-weekly quizzes and for in-class tutorials. Pathology residents from all programs used the library to review cases that were relevant to their specialty or subspecialty of study. AP and GP Residents used the Resident Slide Scanning Services to present cases during their Academic Half Day seminars. Medical staff pathologists used the library to review interesting cases with their assigned resident. Medical staff added interesting cases from all disciplines to the library on a regular basis.
Results: Library Results: In 7 months, 241 cases with a total of 945 images were added to the Digital Slide Library.
Digital Database Advantages: This project identified several advantages for use of WSI in pathology resident education: The digital slides could be remotely accessed and viewed simultaneously by multiple users. The use of digital images reduced the risk of breakage and fading of glass slides. Digital slides proved to have comparable image quality to glass. The ability to annotate images supplemented teaching and presentation activities. Clinical teaching pathologists found using digital images reduced preparation time for teaching sessions and by remotely accessing eSlide Manager, they could use an interactive classroom environment. Teachers received resident feedback that using eSlide Manager was the best teaching tool residents had experienced. Resident slide scanning services were available to residents who were expected to present cases and collaborate with peers and medical students. This service enhanced the learning objectives during these sessions and offered another setting to use digital pathology.
Digital Pathology Limitations and Obstacles: Our experience has identified some technical limitations with digital pathology slide scanning. Scanner operators learned that some slide/tissue types are challenging to scan. The design team learned that adopting digital pathology was a resource heavy project. Startup costs and personnel requirements were identified and resulted in resource commitments from collaborating programs and departments in order to acquire a digital slide scanner and database for education purposes.
Conclusions: A well-designed database resulted in a library resource that can be searched and data mined easily to retrieve cases of interest. Teaching pathologists can now easily share education slides that are rare and sometimes irreplaceable without fear of loss or breakage. Residents who are responsible for the teaching of junior residents and medical students can enhance their teaching opportunities by using the digital slide library. The uptake of digital pathology technology among pathology residents and teaching and staff pathologists has been swift. These leaders will be strong advocates for using this technology in the pathology community.
J Pathol Inform. 2019 Apr 1;10:10.
How to Increase Lab Revenue with an Effective TCPC Program
Introduction: In the environment of continuing lab revenue volatility, TCPC programs can be a smart way for labs to drive new evenue streams and build stronger partnerships with physician clients. By executing the technical components of complex tests, the laboratory maximizes their existing capacity and investment in equipment and lab personne.[1] In this study, we performed an analysis of XIFIN client data that demonstrates the current TCPC opportunities a lab should evaluate for a TCPC program. We also show a client's history of success with a TCPC program over 6 years using a configured LIS system (XIFIN LIS 5) to allow their clients including specialty pathologists to provide their professional, diagnostic component, enabling them to drive ancillary revenue to the lab. Client pathologists didn’t need to invest in the technical equipment, instruments, or human resources required for rendering the test results, both parties benefited from this division of labor and split the billing and reimbursement accordingly.
Methods: Using 2018 client data XIFIN performed an analysis of the proposed changes to the Medicare Physician Fee Schedule and evaluated the greatest impacts for 2019. Our analysis team performed an assessment on the impacts of proposed changes to fee schedules to advise labs on impacts and opportunities in the lab industry. We focused on TCPC impacts for this presentation. We also assessed one lab's (Pathline-Emerge) success over 6 plus years operating a robust TCPC program and the benefit and impact to that business from 2012-2018. Pathline-Emerge contracted with XIFIN to build out the laboratory's TCPC capabilities. The implementation focused on workflow and current technical capabilities including IHC, FISH and flow cytometry.
Results and Conclusions: Our analysis indicates that by sheer volume, laboratories billing the global or the technical component of the 88305 will be the largest contributor to any upside in revenue in 2019.[2] CPT 88305 Impacts:
Proposed 3% increase on Global and 9% on Technical 2% reduction on Professional Component
49% of top 20 anatomic pathology volume billed
88305 = 32%
88305 TC = 7%
88305 PC = 10%
45% of anatomic pathology revenue generated
88305 = 32%
88305 TC = 4%
88305 PC = 9%
The CMS 2019 proposal includes a significant revenue opportunity on the TC component of most major pathology codes.[1] (Figure 1, Table 1) Overall, there are a significant number of CPT codes that will contribute to a labs upside revenue in 2019 (Table 2). Although there has been a steady decline in TC reimbursement rates since 2012 this recent boost represents a significant revenue opportunity for labs that can successfully implement such TCPC programs (Table 3).
88305 Recap: Comparing the 2019 proposed rates to 2012 rates
Professional component is 9% higher than 2012 rates (55% of Global Reimb vs 34% in 2012)
2019 technical component rates are 53% lower than 2012 rates
Small increases and/or decreases shouldn’t be ignored.
Reporting is Key: Value in assessing impact by referring physician
PC vs TC/Global
Payer Mix
Test Mix
Utilize analytics to determine profitability by client and facilitate sales initiatives
Over the course of six years the success of Pathline-Emerge has reflected the volatility of CMS pricing fluctuations. Also evident is the competitive and transient nature of TCPC business (Figure 2). Decline in TCPC revenue in 2016 and 2017 are partially attributed to the loss of several Physician Office Labs. Revenue gains in 2018 are due to the opening of new POL's. 2019 revenue is projected to increase with the CMS increase in pathology codes. Managing POL's come at a significant cost and single clients can represent a large percentage of overall revenue. To reduce this volatility, it is critical to establish a formal TCPC strategic plan that includes sales, marketing, customer service, information technology and lab operations that is reviewed annually to assess market changes. The lab must utilize analytics to determine profitability opportunities and facilitate sales initiatives. Even small percentage changes must be evaluated due to the large volumes of key pathology codes (e.g. 88305). Labs partnered with the right technology partners can build a TCPC program that seamlessly facilitates the flow of technical data to their professional partners. It is critical to have an engaged sales and customer service team that can manage these TCPC relationships. Regularly assessing market data can assist in building and adapting a TCPC revenue strategy that can significantly add to the profitability of the Lab's business.
Introduction: Whole slide images (WSI) are a rich new source of biomedical imaging data. The use of automated systems to classify and segment whole slide images has recently come to forefront of the pathology research community. While digital slides have obvious educational and clinical uses, their most exciting potential lies in application of quantitative computational tools to automate search tasks, assist in classic diagnostic classification tasks, and improve prognosis and theranostics. An essential step in enabling these advancements is to apply advances in machine learning and artificial intelligence from other fields to previously inaccessible pathology data sets, thereby enabling the application of new technologies to solve persistent diagnostic challenges in pathology.
Methods: Here, we applied a Convolutional Neural Network to differentiate between two forms of melanocytic lesions (Spitz and Conventional). Large sections of tissue were curated by an expert dermatopathologist from 100 Hematoxylin and Eosin (H&E) slides each containing Conventional or Spitz nevi. Slides were digitized using an Aperio AT Turbo (Leica Biosystems), with a magnification of 40x power. Smaller variant image patches 299 x 299 pixels (px) were then derived for conventional nevi (n=15,868), Spitz nevi (n=21,468), and other non-nevus skin features (n=38,374). From these patches, 30% were used exclusively for validation experiments. These image sets were then used to train and validate the deep CNN (Inception V3)[1] using the TensorFlow framework [version: 1.5.0].[2] Models were trained using pretrained weights (available from the TensorFlow website) and entirely from scratch. A second experiment was also performed on non-curated image patches representing the entire slide. In this experiment, tissue segments were automatically extracted from the WSI without pathologist input. Successive non-overlapping 299 x 299 px tiles representing the entire WSI were evaluated for tissue content. Because no human selection occurred, only two prediction classes were available: Spitz and Conventional, with n=611,485 and n=612,523 image patches, respectively, from the 100 training slides. To effectively compare the results to the curated patch-level classifications, training was performed for 3.6M steps (~135 epochs). Testing was performed using 200 WSI not used during training or validation. Accuracy was measured at the patch level (from the validation patches) and at the WSI level. WSI were classified as either Conventional or Spitz by calculating a prediction for all non-overlapping 299 x 299 px regions. Classifications where the classification probability (i.e. logit) was at least 10% higher than the next likely class were used as votes, with the classification label for the entire slide assigned by simple majority (Spitz or Conventional, [Other was ignored]). Accuracy for the WSI-label predictions where then assessed for binary classification accuracy using the caret package [version: 6.0-71][3] in R [version: 3.2.3].[4] The gold standard for the correct classification was the diagnosis made by the dermatopathologist.
Findings and Argument: Training using the curated image patches took approximately 50 hours to complete 250k iterations with 4 GeForce GTX 1080 GPUs. Training accuracy for curated patches reached maximum accuracy (100%) at around epoch 13, whereas the pretrained model only began to converge around epoch 100. Training accuracy for the non-curated patches converged around epoch 50. The Validation accuracy however, revealed stark differences in the generalizability of the models. Both the de novo and pretrained networks had high validation accuracy (99.0% and 95.4%, respectively), but the non-curated patches were unable to learn transferable features with a final validation accuracy of only 52.3%. Treating ‘Spitz’ classification as the positive class and ‘Conventional’ as negative, the classification accuracy of whole slides was 92.5%. Sensitivity was 87% with a specificity of 98%. On a per class basis, 101 of 103 Conventional nevi were classified correctly (98%), compared to only 87% for Spitz nevi. Of the 15 misclassified WSI, 87% were due to Spitz-type lesions being classified as conventional. When further exploring the false positive calls, a strong edge effect was observed around the decision boundary [Figure 1], meaning that the incorrect calls were primarily driven by small differences in the expected versus observed classes.
Count of patch predictions from WSI. For each WSI, the total number of predictions for Spitz and Conventional were aggregated. Squares and crosses signify correct classifications. Circles and triangles are misclassified WSI. Notice the majority of misclassified images reside near the decision boundary (solid line)
Conclusions: This work highlights an important lesson when developing algorithms for use by pathologists: involve the pathologist in the design of the assay. The manual curation, though tedious for the clinician, proved to be a valuable contribution to optimizing model performance. By pre-selecting representative examples of Spitz and conventional nevi - along with providing examples for non-diagnostic areas such as hair follicles, sweat glands, tissue artifacts etc. - the model was able to learn faster and have an overall higher accuracy on the training and validation sets with fewer examples. The number of images used from the curated images was 16x less than the non-curated approach, but were more focused on learning the salient features for discrimination in less time, taking only 50 hours to train versus 800. These results highlight the utility of augmented human intelligence in digital pathology applications and the critical role pathologists will play in the evolution of computational pathology algorithms.
References
1.Szegedy C, Vanhoucke V, Ioffe S, Shlens J, Wojna Z. Rethinking the inception architecture for computer vision. 2016 IEEE Conference on Computer Vision and Pattern Recognition (CVPR) 2016 [Google Scholar]
2.Abadi M, Agarwal A, Barham P, Brevdo E, Chen Z, Citro C. Tensor flow: Large-scale machine learning on heterogeneous distributed systems. [Last accessed on 2018 Mar 28];2016 Available from: http://www.arxiv.org/abs/1603.04467 . [Google Scholar]
Introduction: Inflammatory processes in patients with kidney allografts involve various patterns of immune cell recruitment and distributions. Lymphoid aggregates (LA) are commonly observed in patients with kidney allografts and may be indicative of acute kidney rejection.[1] Here we present an automated method of identifying LAs and measuring their densities in digitized kidney biopsy slides using convolutional neural networks.
Method: Histological slides of kidney biopsies from patients with kidney allografts were digitized at 40x magnification with a Leica Aperio CS2 microscope. The ground-truth labels for normaltissue regions and LA regions in each slide were provided by a board-certified pathologist. A deep convolutional neural network based on U-Net[2] was trained on 685 256x256-pixel patches. The square patches were obtained by grid-sampling from 3 annotated histological slides and downsampling by a factor of 4 from the original resolution to obtain 256 by 256 pixel images. The ground-truth labels were also downsampled to a size of 256 by 256 pixels. The training set was then augmented by flipping, shifting, and zooming the patches. The network was subsequently tested on a hold-out set consisting of 815 image patches from 2 other histological slides.
Results: The final model was able to accurately segment Lymphoid Aggregate cells, achieving an auROC score of 0.99 and an IOU score of 0.76 on the hold-out set. The UNet-based model achieved an IOU score of 0.76, while a SegNet[3]-based model achieved an IOU score of 0.74. Both models performed similarly otherwise. The confusion matrix for the Unet-based model is displayed below in [Table 1].
Conclusion: Our study demonstrates that a deep convolutional neural network can accurately identify lymphoid aggregates and provide a quantifiable measure of inflammation in digitized histological slides. As shown in [Figure 1], the network produces qualitatively better results than the hand-labels for some patches. The IOU score may be improved by obtaining higher resolution hand-labels and more trainable data. Visualization tools that display regions of high Lymphoid Aggregate density, such as in Figures 1 and 2, may be of potential use to clinicians investigating inflammatory processes in kidney allografts.
Pixel-level segmentation of Lymphoid Aggregates (Color code: Magenta=LA, Cyan=Non-LA). The top row shows the original slide patches, the middle row the hand labels, and the bottom row the labels generated by the neural network
LA severity for each patch is visualized in the entire histological slide. (Color code: Magenta=LA, Cyan=Non-LA). Each 256*256 patch is assigned a Lymphoid Aggregate score, which represents the aggregate probability of each pixel to be associated with a Lymphoid Aggregate in a patch
Group A patterns show multiple distinct clusters per morphology using t-SNE visualization
REFERENCES
1.Kayler L. K, Lakkis F.G, Morgan C, Basu A, Blisard D, Tan H. P, McCauley J, Wu C, Shapiro R, Randhawa P. S. Acute Cellular Rejection with CD20-Positive Lymphoid Positive Lymphoid Clusters in Kidney Transplant Patients Following Lymphocyte Depletion. American Journal of Transplantation. 2007;7:949–954. doi: 10.1111/j.1600-6143.2007.01737.x. [DOI] [PubMed] [Google Scholar]
2.Ronneberger O, Fischer P, Brox T. “U-Net: Convolutional Networks for Biomedical Image Segmentation.” Medical Image Computing and Computer-Assisted Intervention (MICCAI), Springer, LNCS. 9351:234–241. 2015. [Google Scholar]
3.Badrinarayanan V, Kendall A, Cipolla R. “SegNet: A Deep Convolutional Encoder-Decoder Architecture for Image Segmentation.”. PAMI. 2017 doi: 10.1109/TPAMI.2016.2644615. [DOI] [PubMed] [Google Scholar]
J Pathol Inform. 2019 Apr 1;10:10.
Workflows and Technologies for Multiplexed Immunofluorescent IHC Analysis
Background: Highly multiplexed IHC is a powerful technique for probing complex interactions in the tumor microenvironment. Applying this technique to large sample sets requires an organized workflow and an underlying infrastructure of hardware and software.We will illustrate a system including these principles as well as integration of cloud-based computing platform and advanced data analysis & visualization of results.
Methods: An integrated system using HALO image analysis software coupled with HALO-Link database and slide-sharing environment was established on virtual computers in the Amazon Web Services (AWS) environment. Multiple virtual machines were networked to provide image storage, image processing and database hosting. Additional processes was developed to streamline pre-processing of multispectral images and automatically fuse multiple component images into a whole slide fluorescent image. Projects with the associated images are created in HALO-Link for image management and to allow pathology support to be rendered remotely without the need for specialized hardware.Monoplexed DAB stains were used for pathology review to establish ground truth for staining pattern and specificity. These were compared to fluorescent monoplex and multiplexed stained specimens visually and by scoring algorithms. Data from scored images was analyzed and graphs created using custom R scripts.
Findings and Argument: A highly integrated and automated network is necessary to facilitate the analysis of large sets of images. A system of web based file transfer, image analysis software, project management software for pathologist review, and data storage. These may be used to determine concordance in staining pattern and algorithm scoring across all methods.
Conclusions: A powerful and efficient digital pathology workflow for evaluating & scoring highly multiplexed IHC images can be created by leveraging multiple technologies and coupling it with pathology support. The combination of cloud storage services, application software and custom APIs (application program interfaces) may be combined into a system which efficiently and securely manages a complex digital pathology workflow environment which couples the efficiency of automation and the necessity of algorithm development and validation. Steps are taken to ensure data integrity and preservation of source files for archival purposes and to ensure availability for future use & review.
J Pathol Inform. 2019 Apr 1;10:10.
Just In Time PRIA Morphology Recommendation Transfer among Specialists
ROI viewing patterns vary significantly among pathologists. The viewing is guided by the pathologist's experience that the disease state morphologies are likely to be visually identified. We present a reliable method which learns to assist identifying disease relevant ROIs, based on information available in such viewing patterns. Our approach enables accumulating learned morphologies into dictionaries and organizing them into atlases. Such atlases can be automatically consulted to transfer this knowledge into ROI recommendations, thus reducing the probability of errors through collaboration. Ultimately, these atlases facilitate dramatically improving patient care.
Introduction: ROI viewing patterns exhibit low concordance among pathologists (Ezgi et al, 2016).[1] The viewing is guided by the experience of the pathologist focusing on areas with higher likelihood that disease state morphologies may be identified. Due to the low concordance of viewing patterns, combining the experience of multiple pathologists, through collaboration, may reduce error rates exponentially. As observed by (Halabi et al 2018),[2] significant error reduction can be achieved through collaboration of radiologists, due to dramatically reduced probability that independent specialists experience the same error. Our proposal is to develop methods that enable specialists to project experience of identifying relevant morphology patterns. Following (Fine 2014),[3] organizing cases as collections of ROIs, facilitate the training and establishment of dictionary atlases. This facilitates reliable projection of those atlases as ROI recommendations.
Methods: We observe that Deep Neural Networks (DNN) have the capability to reliably project a morphology pattern regarded as highly relevant onto another image. To quantify the reliability of such projection, we ask specialists to identify 19 Basal Cell Carcinoma (BCC) relevant morphologies, and manually analyze 21 WSIs, and extract >1800 specific patterns representing those morphologies. Within each group, each of the 19 morphologies is represented by numerous individual patterns. Subsequently, we partition those patterns into groups A and B. We use a DNN to learn the morphology patterns in Group A, and project those onto Group B.
Findings: The Stochastic Neighbor Embedding (SNE) in Figure 1 shows general lack of cohesion, thus rendering the task or projecting similar patterns very difficult. Despite the low cohesion, we observe in Figure 2 that a single DNN projected from A onto B all 19 BCC morphologies with >97% Area Under the Curve (AUC). The ability of a single DNN model to reliably project all 19 patterns implies the potential of model reuse. Consistent with (Fine 2014),[3] organizing each case into ROIs enables highly reliable transfer of Just In Time ROI recommendations identified during interactive viewing without a lengthy learning process. This enables a collaborative review approach which may reduce case review errors, leading to dramatically improved patient care.
Background: Deep learning has created a hype about artificial intelligence (AI) and healthcare AI. Flagship Biosciences has been developing a pathology AI system over the last 8 years to solve the most challenging real-world tissue analysis problems across the entire pharmaceutical industry. We share our experience and vision in the following key concepts and aspects around pathology AI. A demo of our pathology AI system for immuno-oncology (IO) can be found on YouTube.[1] Pathology (standard of care): Pathologists examine histology slides under a microscope and provide either a single diagnosis (e.g. cancer/no cancer) or a single score (e.g. 0, 1+, 2+ or 3+). Digital pathology: Digital pathology only replaces the microscope with a computer monitor. There is no tangible business case for digital pathology (unlike radiology), just convenience. Digital pathology enables pathology AI.
Key concepts and aspects: In-depth discussions about the key concepts and aspects around pathology AI can be found in our LinkedIn article series and YouTube lecture series.[2,3] Pathologist-centric system design: A pathologist-centric system design allows pathologists to provide their expertise for each patient by identifying the different cell types and provide the proper controls for the cell detection and classification across the whole slide. Rich information data measurements can be verified properly during software verification. Patient-type-specific cell classification: Patient-type-specific cell classification solves the key problem for any pathology AI system: the variations between different patient types. Simple decision trees can be used that provide excellent performance and transparency into the decision process. There is no need for large training data sets and no need for deep learning. Healthcare big data: Rich information data for tissue (cell type-specific cell distributions with biology-based features) is required to enable healthcare big data for pathology. Major benefits can be realized by implementing a simple 2-step approach with: a. Single standard test that provides rich information data for a tissue type, that only requires a simple regulatory clearance (only measurements, no clinical outcome); followed by: b. Diagnostics (Dx), Prognostics (Px) and Companion Diagnostics (CDx), that are created by simply correlating the rich information data to clinical outcomes, which now is just a scoring scheme and allows all available (and future) drugs to be based on the same standard test and clinicians in the field to develop their own tests. Data science allows us to integrate easily with other complementary, rich data sources, like next generation sequencing (NGS).Business model: The true barrier for pathology AI is the business model, not the technology. Barriers include a myriad of “tissue type” – “stain” – “indication” tests, each having only a $11 million market with < $10 per test, if based on CMS reimbursement. A single test saves the healthcare system thousands of dollars (see pharmacogenomics); therefore, a value-based business model would allow us to create viable business cases. The killer app will be immuno-oncology (IO), where we provide a microscope-impossible test. Healthcare big data for pathology is a huge opportunity to save lives and lower healthcare costs. Ultimately, pathology AI will drive the adoption of digital pathology. Central lab model: The central lab model provides cost-effective alternatives and smart intermediate steps for risk mitigation of a distributed medical device in form of: a. Lab Developed Tests (LDT), that just require the QMS to include digital pathology and pathology AI under CAP/CLIA with the use of any slide scanner and any 3rd party software, and b. Single-site Medical Device, that requires the QMS to include design controls and to obtain FDA approval based on a site-specific study. Digital pathology enables a very simple global service model with no shipping of tissue or slides and no extra IT at local sites. Distributed medical device: Commercializing a pathology AI system as a distributed medical device can be very complex, time consuming and costly. The pathology AI system needs to be manufactured as a medical device according to a QMS compliant with ISO 13485, ISO 14971, IEC 62304, and FDA QSR. FDA approval need to be obtained based on multi-site studies conducted following good clinical practices for clinical trials. A global distribution channel needs to be established but that can also be provided through partnerships with IVD manufacturers.
Conclusion: We need to replace the microscope, not the pathologist. Pathologists using the right tools can perform high-performance, high-complexity tissue analysis. A pathology AI system designed to our key concepts, where pathologists bring in their unique expertise about the tissue and computers provide the computational tasks that are impossible for humans, provides excellent performance, proper controls and full transparency into the decision process. Pathology AI systems that replace the pathologists will have a hard time achieving the performance of pathologists assisted by computers.