

Abstract
Objective:
Despite the rising toll of drug poisoning deaths in the United States, the extent of the problem among adolescents and young adults ages 15–24 years has received relatively little attention. We examined sociodemographic characteristics and state trends in drug poisoning deaths among adolescents and young adults from 2006 to 2015 and estimated the costs of drug poisoning mortality in this population.
Method:
We used the National Vital Statistics System’s Multiple Cause of Death files from 2006 to 2015. We analyzed trends using Joinpoint regression analysis and calculated total costs of drug poisoning deaths, including medical costs, work loss costs, and quality of life loss, based on widely used cost estimates.
Results:
Drug poisoning death rates (per 100,000 population) in adolescents and young adults increased from 8.1 in 2006 to 9.7 in 2015. The rates increased significantly for Whites (1.7% per year) and Asian/Pacific Islanders (4.3% per year) from 2006 to 2015 and for Blacks (11.8% per year) from 2009 to 2015. By U.S. region, the rates increased significantly in the Midwest (4.4% per year) from 2006 to 2015 and in the Northeast (11.0% per year) from 2009 to 2015. Trends varied by age group, intent for drug poisoning, drug category (i.e., opioids, pharmaceutical drugs excluding opioids, illicit drugs excluding opioids, and unspecified drugs), urbanization level, and state. The estimated costs of drug poisoning deaths among adolescents and young adults totaled approximately $35 billion in 2015.
Conclusions:
Trends in drug poisoning deaths and estimated costs inform state-specific prevention and intervention efforts.
The united states is currently grappling with a drug epidemic, as evidenced by 52,404 drug poisoning deaths in 2015 (Rudd et al., 2016b). Drug poisoning death refers to unintentional or intentional fatal intoxication resulting from an improper use of pharmaceutical drugs (either prescribed or over-the-counter medications) or illicit drugs. Drug use and poisoning among 15- to 24-year-olds (hereinafter referred to as adolescents and young adults) is a serious public health problem. An estimated 8.6 million adolescents and young adults in the United States report current illicit drug use, including prescription psychotherapeutics, marijuana, crack/cocaine, heroin, hallucinogens, inhalants, or methamphetamine (Center for Behavioral Health Statistics and Quality, 2016).
The increasing availability of pharmaceutical drugs, especially opioids, and misperceptions about pharmaceutical drug safety have contributed to drug use in adolescents and young adults (Substance Abuse and Mental Health Services Administration [SAMHSA], 2016a). One study showed that individuals prescribed opioids by 12th grade are 33% more likely to misuse prescription opioids by age 23 compared with those never prescribed opioids (Miech et al., 2015). Adolescents and young adults often obtain prescription drugs from friends and relatives (McCabe et al., 2007; SAMHSA, 2014) and misuse them with motivations to relieve pain, relax, feel good, or get high (McCabe et al., 2007, 2013; Miech et al., 2015). The issue of drug use and poisoning is critical for adolescents and young adults, who are susceptible to drug use because of their developmental nature marked by vulnerability and adjustment to psychological and social changes (Brown et al., 2008; Stone et al., 2012). Although the rate of drug poisoning death is lower among adolescents and young adults than among those age 25 and over (9.7 per 100,000 vs. 22.2; Hedegaard et al., 2017), death from drug poisoning is one of the leading causes of injury deaths in this population (Centers for Disease Control and Prevention [CDC], 2017).
Epidemiological studies have investigated state trends in overall drug poisoning mortality (Hedegaard et al., 2017; Rudd et al., 2016a, 2016b), yet research is limited on trends for adolescents and young adults. Research shows sociodemographic differences in drug poisoning deaths among adolescents and young adults, with the rates higher for males than females and higher for Whites than other races/ethnicities (Rudd et al., 2016b). Predictably, drug poisoning death rates vary between U.S. regions and states (Paulozzi et al., 2011). Given the large contribution of drug poisoning to the injury death burden in adolescents and young adults, further investigation of trends across sociodemographic groups and states is needed to guide state-specific prevention and intervention efforts.
Although trend information is useful for assessing the magnitude of the problem, costs better represent the burden of drug poisoning, including the associated medical and work loss costs as well as quality of life losses. Costs are useful in setting priorities and estimating the likely return on investment associated with effective prevention. In this study, we examined sociodemographic characteristics and state trends in drug poisoning death rates for adolescents and young adults and estimated costs attributable to drug poisoning mortality in this population, including the medical costs, work loss costs, and value of quality of life loss.
Method
We used the mortality census data from the National Vital Statistics System’s Multiple Cause of Death files from 2006 to 2015 to analyze records of drug poisoning deaths among 15- to 24-year-olds in the United States, excluding deaths that occurred among non–U.S. residents. We identified drug poisoning deaths through the International Statistical Classification of Diseases and Related Health Problems, 10th Revision (ICD-10; World Health Organization, 1992), underlying cause codes of X40–X44 (drug poisonings, unintentional), X60–X64 (drug poisonings, suicide), X85 (drug poisonings, homicide), or Y10–Y14 (drug poisonings, undetermined intent). To classify each drug poisoning case according to the primary drug involved, we ordered all the entity axis codes from underlying cause to immediate cause, followed by other contributing causes, and then selected the drug poisoning diagnosis (ICD-10 codes T36–T50) that was listed first (i.e., the one that came earliest in the chain of causes leading to death). Based on this code, we assigned the case to one of four drug categories: T40.0–T40.4 (opioids, either prescription or illicit); T36–T39, T41–T43.5, and T43.8– T50.8 (pharmaceutical drugs, excluding opioids); T40.5, T40.7–T40.9, and T43.6 (illicit drugs, excluding opioids); and T40.6 and T50.9 (unspecified drugs). We adapted these labels for drug categories from the CDC (2013) guide. To avoid double counting, we assigned deaths to the first drug category listed.
Sociodemographic characteristics included age group (15–19 or 20–24 years), sex (male or female), race/ethnicity (White, Black, Asian/Pacific Islander, American Indian/Alaska Native, or Hispanic), U.S. census region (Northeast, Midwest, South, or West) as defined by the U.S. Census Bureau (U.S. Census Bureau, 2016), urbanization level (metropolitan or nonmetropolitan), and intent for drug poisoning (unintentional, suicide, homicide, or undetermined). We calculated rates of drug poisoning deaths at the national and state levels using U.S. census population estimates for people ages 15–24 years from 2006 through 2015 (National Center for Health Statistics, 2017). We also calculated corresponding 95% confidence intervals (CIs) as the death rate plus or minus 1.96 times the standard error of the death rate. We performed joinpoint regression analysis using the Joinpoint Regression Program, Version 4.6.0.0 (National Cancer Institute, 2018) to identify time points in which drug poisoning trends significantly changed. We estimated the annual percent change for each time point detected and the average annual percent change for the full study period from 2006 to 2015. For all analyses, non-overlapping CIs indicated statistically significant differences. Death counts of less than 20 and corresponding rates were suppressed.
The total costs of drug poisoning deaths comprised the following three categories: medical costs, work loss costs, and quality of life loss. Our medical and work loss cost estimates were consistent with the methods used to estimate injury costs in the CDC’s Web-based Injury Statistics Query and Reporting System (WISQARS; Lawrence & Miller, 2014). In these estimates, medical costs were assigned by place of death: on scene/at home, dead on arrival at hospital, emergency department, hospital after admission, nursing home, or hospice. Deaths in a medical facility were assigned treatment costs by injury mechanism (and by age and diagnosis, if sample size permitted), based on the mean estimated medical costs of injury deaths in nationally representative samples covering the respective facility type. Costs of emergency transport were added to all but deaths on scene/at home. If an autopsy was performed, the expenses of the coroner or medical examiner were added. Work loss costs consisted of the estimated value of earnings and household work over the victim’s expected remaining life span in the absence of premature death. Life expectancy was calculated from published life tables (Arias, 2014). Earnings were estimated by age and sex based on 2002–2009 data from the March supplement of the Current Population Survey, supplemented with data on fringe benefits from the national income accounts. Estimates of the value of household production were taken from Grosse et al. (2009), which used data from the American Time Use Survey. The quality of life loss accounted for the impact on both quality and quantity of life. The quality of life loss was computed by monetizing the estimated quality-adjusted life years lost, based on a $4.6 million value of statistical life (in 2010 U.S. dollars). The methods and meta-analyses behind estimating the value of statistical life and quality of life loss are detailed elsewhere (Miller, 1990, 2000; Miller & Hendrie, 2012). Quality of life loss excluded work losses, to avoid double counting. Costs beyond the first year were discounted to present value using a widely recommended 3% discount rate (National Academies of Sciences, Engineering, and Medicine, 2016; Neumann et al., 2016). We inflated all costs to 2015 dollars.
Results
Between 2006 and 2015, 36,422 adolescents and young adults (8.4 per 100,000 population) died of drug poisoning, with opioids as the primary contributing cause of death for nearly half of these deaths (47.0%). The majority of drug poisoning deaths were unintentional (84.7%).
Drug poisoning death rates across sociodemographic characteristics
Drug poisoning death rates per 100,000 were more than three times higher for persons ages 20–24 years (13.0) than those ages 15–19 years (3.7). Death rates for males exceeded those for female adolescents and young adults (12.0 vs. 4.6, respectively). The rates for White (11.9) and American Indian/Alaska Native (10.0) adolescents and young adults were approximately three to four times those for Blacks (2.6), Asian/Pacific Islanders (2.3), and Hispanics (4.0). The rates were highest in the Northeast (9.4), followed by the Midwest (8.7), South (8.4), and West (7.4). The rates were higher in metropolitan areas (8.5) compared with nonmetropolitan areas (7.9). Table 1 shows drug poisoning death rates from 2006 to 2015 by age group, sex, race/ethnicity, U.S. region, urbanization level, intent for drug poisoning, and drug category.
Table 1.
Drug poisoning death rates (per 100,000) [95% confidence intervals] for adolescents and young adults, 2006–2015

| Characteristics | 2006 | 2007 | 2008 | 2009 | 2010 | 2011 | 2012 | 2013 | 2014 | 2015 |
| All | 8.1 [7.9, 8.4] | 8.3 [8.0, 8.6] | 8.1 [7.8, 8.4] | 7.8 [7.6, 8.1] | 8.2 [7.9, 8.5] | 8.6 [8.3, 8.9] | 8.0 [7.7, 8.3] | 8.3 [8.1, 8.6] | 8.6 [8.4, 8.9] | 9.7 [9.4, 9.9] |
| Age group | ||||||||||
| 15-19 years | 3.9 [3.6, 4.1] | 4.2 [3.9, 4.5] | 4.2 [3.9, 4.5] | 3.6 [3.3, 3.8] | 3.8 [3.5, 4.0] | 3.8 [3.6, 4.1] | 3.1 [2.9, 3.4] | 3.2 [2.9, 3.4] | 3.1 [2.9, 3.4] | 3.7 [3.4, 3.9] |
| 20-24 years | 12.4 [12.0, 12.9] | 12.4 [12.0, 12.9] | 12.1 [11.6, 12.5] | 12.1 [11.6, 12.5] | 12.7 [12.2, 13.2] | 13.2 [12.7, 13.7] | 12.6 [12.2, 13.1] | 13.1 [12.6, 13.6] | 13.7 [13.2, 14.2] | 15.3 [14.8, 15.8] |
| Sex | ||||||||||
| Male | 12.1 [11.6, 12.5] | 12.1 [11.7, 12.6] | 11.9 [11.5, 12.4] | 11.4 [10.9, 11.8] | 11.6 [11.1, 12.0] | 12.4 [11.9, 12.8] | 11.4 [11.0, 11.9] | 11.7 [11.2, 12.1] | 12.1 [11.6, 12.5] | 13.3 [12.8, 13.7] |
| Female | 4.0 [3.7, 4.2] | 4.3 [4.0, 4.5] | 4.1[3.8, 4.3] | 4.1[3.8, 4.4] | 4.6[4.3, 4.9] | 4.6[4.3, 4.9] | 4.4 [4.1, 4.7] | 4.8 [4.5, 5.1] | 5.0 [4.7, 5.3] | 5.9 [5.6, 6.2] |
| Race/ethnicity | ||||||||||
| White | 11.4 [11.0, 11.8] | 11.4 [11.0, 11.8] | 11.3 [10.9, 11.7] | 10.9 [10.5, 11.3] | 11.9 [11.5, 12.3] | 12.4 [12.0, 12.8] | 11.6 [11.2, 12.0] | 11.9 [11.5, 12.4] | 12.4 [11.9, 12.8] | 13.5 [13.1, 14.0] |
| Black | 2.4 [2.0, 2.8] | 2.4 [2.0, 2.8] | 2.0 [1.7, 2.4] | 1.9 [1.6, 2.2] | 2.4 [2.0, 2.7] | 2.4 [2.1, 2.8] | 2.6 [2.2, 3.0] | 2.7 [2.4, 3.1] | 3.2 [2.8, 3.6] | 4.1 [3.6, 4.6] |
| A/PI | 1.6 [1.0, 2.2] | 2.3 [1.6, 3.0] | 1.7 [1.1, 2.3] | 2.5 [1.8, 3.2] | 1.8 [1.3, 2.4] | 2.3 [1.7, 3.0] | 2.3 [1.7, 2.9] | 2.5 [1.9, 3.1] | 2.2 [1.6, 2.8] | 3.0 [2.3, 3.7] |
| AI/AN | 7.3 [4.8-9.8] | 10.3 [7.4, 13.2] | 10.8 [7.8, 13.8] | 11.7 [8.6, 14.9] | 9.6 [6.7, 12.5] | 9.6 [6.7, 12.4] | 10.4 [7.4, 13.4] | 9.7 [6.8, 12.6] | 11.1 [8.0, 14.2] | 9.8 [6.9, 12.7] |
| Hispanic | 3.3 [2.9, 3.7] | 3.9 [3.5, 4.4] | 3.8 [3.4, 4.2] | 3.7 [3.3, 4.1] | 3.5 [3.1, 3.9] | 4.1 [3.7, 4.5] | 3.4 [3.1, 3.8] | 4.1 [3.7, 4.6] | 4.3 [3.9, 4.7] | 5.4 [5.0, 5.9] |
| U.S. census region | ||||||||||
| Northeast | 8.2 [7.6, 8.9] | 7.9 [7.2, 8.5] | 7.9 [7.3, 8.5] | 7.1 [6.5, 7.7] | 7.6 [7.0, 8.2] | 9.5 [8.8, 10.1] | 9.6 [8.9, 10.3] | 10.5 [9.8, 11.2] | 11.7 [10.9, 12.5] | 14.0 [13.1, 14.8] |
| Midwest | 7.4 [6.8, 7.9] | 7.7 [7.1, 8.2] | 7.6 [7.0, 8.2] | 7.5 [7.0, 8.1] | 8.8 [8.2, 9.4] | 8.6 [8.0, 9.2] | 8.9 [8.3, 9.5] | 9.3 [8.7, 10.0] | 9.9 [9.3, 10.5] | 11.0 [10.3, 11.7] |
| South | 9.9 [9.4, 10.4] | 9.6 [9.1, 10.1] | 9.1 [8.6, 9.6] | 8.5 [8.1, 9.0] | 8.4 [7.9, 8.8] | 8.4 [7.9, 8.8] | 7.2 [6.8, 7.6] | 7.0 [6.6, 7.4] | 7.4 [7.0, 7.9] | 8.4 [8.0, 8.9] |
| West | 6.1 [5.6, 6.6] | 7.2 [6.7, 7.7] | 7.2 [6.7, 7.8] | 7.6 [7.1, 8.2] | 7.8 [7.3, 8.4] | 8.2 [7.7, 8.8] | 7.3 [6.8, 7.8] | 7.9 [7.3, 8.4] | 7.1 [6.6, 7.7] | 7.3 [6.8, 7.8] |
| Urbanization level | ||||||||||
| Metropolitan | 8.0 [7.7, 8.3] | 8.2 [7.9, 8.5] | 8.2 [7.9, 8.5] | 7.9 [7.6, 8.2] | 8.2 [7.9, 8.5] | 8.7 [8.4, 9.0] | 8.1 [7.9, 8.4] | 8.5 [8.2, 8.8] | 8.9 [8.6, 9.2] | 9.9 [9.6, 10.3] |
| Nonmetropolitan | 9.0 [8.3, 9.7] | 8.8 [8.0, 9.5] | 7.8 [7.1, 8.5] | 7.7 [7.0, 8.4] | 8.3 [7.5, 9.0] | 8.0 [7.3, 8.7] | 7.1 [6.5, 7.8] | 7.4 [6.7, 8.1] | 7.0 [6.4, 7.7] | 7.9 [7.2, 8.6] |
| Intent | ||||||||||
| Unintentional | 6.6 [6.4, 6.9] | 6.8 [6.6, 7.1] | 6.8 [6.6, 7.1] | 6.5 [6.3, 6.8] | 6.9 [6.6, 7.1] | 7.4 [7.1, 7.6] | 6.8 [6.5, 7.0] | 7.1 [6.8, 7.3] | 7.5 [7.3, 7.8] | 8.5 [8.2, 8.8] |
| Suicide | 0.6 [0.5, 0.7] | 0.6 [0.6, 0.7] | 0.6 [0.5, 0.7] | 0.6 [0.6, 0.7] | 0.7 [0.6, 0.8] | 0.6 [0.6, 0.7] | 0.7 [0.6, 0.7] | 0.8 [0.7, 0.8] | 0.6 [0.5, 0.7] | 0.6 [0.5, 0.7] |
| Undetermined | 0.9 [0.8, 1.0] | 0.8 [0.7, 0.9] | 0.6 [0.6, 0.7] | 0.6 [0.5, 0.7] | 0.6 [0.5, 0.7] | 0.5 [0.5, 0.6] | 0.5 [0.5, 0.6] | 0.5 [0.4, 0.5] | 0.5 [0.4, 0.6] | 0.5 [0.4, 0.6] |
| Drug poisoning category | ||||||||||
| Opioidsa | 3.4 [3.2, 3.6] | 3.6 [3.4, 3.7] | 3.6 [3.4, 3.8] | 3.5 [3.3, 3.7] | 3.8 [3.6, 3.9] | 4.0 [3.8, 4.2] | 3.7 [3.5, 3.8] | 4.0 [3.8, 4.2] | 4.5 [4.3, 4.7] | 5.3 [5.1, 5.5] |
| Pharmaceutical | ||||||||||
| Drugsb | 0.6 [0.6, 0.7] | 0.7 [0.6, 0.8] | 0.8 [0.7, 0.8] | 0.8 [0.7, 0.9] | 0.9 [0.8, 1.0] | 0.8 [0.7, 0.9] | 0.8 [0.7, 0.9] | 0.9 [0.8, 0.9] | 0.8 [0.7, 0.9] | 0.8 [0.7, 0.9] |
| Illicit drugsc | 1.2 [1.1, 1.3] | 1.0 [0.9, 1.1] | 0.7 [0.6, 0.8] | 0.5 [0.5, 0.6] | 0.6 [0.5, 0.7] | 0.6 [0.5, 0.6] | 0.6 [0.5, 0.7] | 0.8 [0.7, 0.8] | 0.8 [0.7, 0.9] | 1.0 [0.9, 1.1] |
| Unspecified drugs | 2.7 [2.6, 2.9] | 2.7 [2.6, 2.9] | 2.7 [2.6, 2.9] | 2.7 [2.6, 2.9] | 2.6 [2.4, 2.7] | 2.9 [2.7, 3.1] | 2.7 [2.6, 2.9] | 2.4 [2.2, 2.5] | 2.3 [2.2, 2.5] | 2.3 [2.2, 2.4] |
Notes: Homicide rates suppressed because numerators were < 20. A/PI = Asian/Pacific Islander; AI/AN = American Indian/Alaska Native.
Opioids were prescribed or illicit;
pharmaceutical drugs excluded opioids;
illicit drugs excluded opioids.
Trends in drug poisoning deaths across sociodemographic characteristics
Drug poisoning death rates in adolescents and young adults increased from 8.1 in 2006 to 9.7 in 2015, changing by 1.8% annually on average (rate change not statistically significant). Death rates attributed to opioids increased significantly by 4.8% per year from 2006 to 2015,1 rising at a faster pace from 2013 to 2015 (15.4% per year). The rates for deaths involving pharmaceutical drugs (excluding opioids) increased significantly by 2.1% per year from 2006 to 2015, with a notable increase from 2006 to 2010 (6.7% per year). Death rates for unspecified drugs decreased significantly by 2.1% per year from 2006 to 2015, mostly declining from 2011 to 2015 (5.1% per year). For illicit drugs (excluding opioids), the rates decreased significantly by 25.1% per year from 2006 to 2009 but followed a significant increase by 9.7% per year from 2009 to 2015.
Between 2006 and 2015, death rates declined significantly by 2.6% per year for persons ages 15–19 years. During this time, death rates increased by 2.4% per year on average for persons ages 20–24 years; however, changes in the identified trend periods (2006–2013 and 2013–2015) were not statistically significant. The rate grew by 4.1% per year on average for female adolescents and young adults, but changes in the identified trend periods (2006–2013 and 2013–2015) were not statistically significant. Across race/ethnicity, the rates increased significantly by 4.3% and 1.7% per year for Asian/Pacific Islander and White adolescents and young adults, respectively. For Black adolescents and young adults, the rates increased significantly by 11.8% from 2009 to 2015.
Death rates in the Northeast region grew significantly by 5.5% annually from 2006 to 2015, increasing at a faster pace from 2009 to 2015 (11.0% per year). The rates in the Midwest region increased significantly by 4.4% per year from 2006 to 2015. In the South region, the rates dropped significantly by 4.8% per year from 2006 to 2013. By urbanization level, the rates decreased significantly by 1.9% per year from 2006 to 2015 in nonmetropolitan areas. Although the rates increased by 2.3% per year on average in metropolitan areas, changes in the identified trend periods (2006–2013 and 2013–2015) were not statistically significant. Table 2 shows trends from 2006 to 2015 across sociodemographic characteristics.
Table 2.
Trends in drug poisoning deaths across sociodemographic characteristics among adolescents and young adults, 2006–2015

| Characteristics | Trend 1 |
Trend 2 |
2006–2015 Average APC [95% CI] | ||
| Years | APC [95% CI] | Years | APC [95% CI] | ||
| All | 2006–2013 | 0.1 [-1.4, 1.7] | 2013–2015 | 7.9 [-3.1, 20.1] | 1.8 [-0.3, 3.9] |
| Age group | |||||
| 15–19 years | 2006–2015 | -2.6 [-4.6, -0.5] | – | – | -2.6 [-4.6, -0.5] |
| 20–24 years | 2006–2013 | 0.8 [-0.6, 2.3] | 2013–2015 | 8.1 [-1.9, 19.1] | 2.4 [0.5, 4.3] |
| Sex | |||||
| Male | 2006–2013 | -0.5 [-2.1, 1.1] | 2013–2015 | 6.5 [-5.2, 19.6] | 1.0 [-1.2, 3.2] |
| Female | 2006–2013 | 2.2 [-0.0, 4.5] | 2013–2015 | 11.1 [-3.7, 28.2] | 4.1 [1.3, 7.0] |
| Race/ethnicity | |||||
| White | 2006–2015 | 1.7 [0.6, 2.7] | – | – | 1.7 [0.6, 2.7] |
| Black | 2006–2009 | -8.0 [-22.2, 8.9] | 2009–2015 | 11.8 [6.6, 17.3] | 4.8 [-0.2, 10.1] |
| A/PI | 2006–2015 | 4.3 [0.6, 8.2] | – | – | 4.3 [0.6, 8.2] |
| AI/AN | 2006–2015 | 0.9 [-2.2, 4.2] | – | – | 0.9 [-2.2, 4.2] |
| Hispanic | 2006–2012 | -0.0 [-4.8, 5.0] | 2012–2015 | 12.6 [-0.2, 26.9] | 4.0 [-0.0, 8.2] |
| U.S. census region | |||||
| Northeast | 2006–2009 | -4.8 [-13.7, 5.0] | 2009–2015 | 11.0 [7.9, 14.3] | 5.5 [2.5, 8.6] |
| Midwest | 2006–2015 | 4.4 [3.3, 5.5] | – | – | 4.4 [3.3, 5.5] |
| South | 2006–2013 | -4.8 [-6.4, -3.3] | 2013–2015 | 8.2 [-4.6, 22.7] | -2.1 [-4.4, 0.2] |
| West | 2006–2010 | 5.8 [-0.3, 12.4] | 2010–2015 | -2.2 [-6.0, 1.7] | 1.3 [-1.3, 4.0] |
| Urbanization level | |||||
| Metropolitan | 2006–2013 | 0.6 [-0.9, 2.1] | 2013–2015 | 8.4 [-2.3, 20.2] | 2.3 [0.3, 4.3] |
| Nonmetropolitan | 2006–2015 | -1.9 [-3.4, -0.5] | – | – | -1.9 [-3.4, -0.5] |
| Intent | |||||
| Unintentional | 2006–2013 | 0.7 [-1.1, 2.6] | 2013-2015 | 9.4 [-3.6, 24.2] | 2.6 [0.1, 5.1] |
| Suicide | 2006–2015 | 0.8 [-1.2, 2.8] | – | – | 0.8 [-1.2, 2.8] |
| Undetermined | 2006–2008 | -15.6 [-28.1, -0.8] | 2008–2015 | -4.4 [-6.9, -1.9] | -7.0 [-9.9, -4.0] |
| Drug poisoning category | |||||
| Opioidsa | 2006–2013 | 2.0 [-0.1, 4.1] | 2013–2015 | 15.4 [1.1, 31.7] | 4.8 [2.2, 7.5] |
| Pharmaceutical drugsb | 2006–2010 | 6.7 [2.2, 11.4] | 2010–2015 | -1.5 [-4.3, 1.4] | 2.1 [0.1, 4.0] |
| Illicit drugsc | 2006–2009 | -25.1 [-35.8, -12.5] | 2009–2015 | 9.7 [3.6, 16.1] | -3.4 [-8.0, 1.4] |
| Unspecified drugs | 2006–2011 | 0.4 [-1.7, 2.6] | 2011–2015 | -5.1 [-8.0, -2.0] | -2.1 [-3.4, -0.7] |
Notes: APC = annual percent change; CI = confidence interval; A/PI = Asian/Pacific Islander; AI/AN = American Indian/Alaska Native.
Opioids were prescribed or illicit;
pharmaceutical drugs excluded opioids;
illicit drugs excluded opioids.
Drug poisoning death rates by state
Compared with the national rate of 8.4 per 100,000, drug poisoning death rates were significantly lower in Nebraska (3.1), North Dakota (3.1), South Dakota (3.9), Hawaii (4.3), Iowa (4.7), Mississippi (5.3), California (5.3), Kansas (5.7), Minnesota (5.8), Idaho (6.3), South Carolina (6.6), Georgia (6.7), Virginia (6.8), New York (6.9), Texas (7.0), and Oregon (7.3) during the study period from 2006 to 2015. In contrast, Illinois (8.9), Tennessee (9.2), Michigan (9.3), Connecticut (9.5), Colorado (9.6), Florida (9.8), Louisiana (9.9), Maryland (10.0), New Jersey (10.0), Ohio (10.1), Arizona (11.0), Oklahoma (11.1), Delaware (11.2), Missouri (11.2), Indiana (11.3), New Hampshire (11.6), Kentucky (11.6), Utah (12.5), Pennsylvania (13.2), Nevada (13.5), New Mexico (14.7), and West Virginia (15.1) had significantly higher rates than the national rate. Table 3 provides state-specific drug poisoning death rates by drug category.
Table 3.
National and state drug poisoning death rates (per 100,000) [95% confidence intervals] for adolescents and young adults, 2006–2015

| State | Any drug poisoning | Opioids (prescribed or illicit) | Pharmaceutical drugs (excluding opioids) | Illicit drugs (excluding opioids) | Unspecified |
| Alabama | 8.1 [7.4, 8.7] | 2.7 [2.3, 3.1] | 0.3 [0.2, 0.4] | 0.5 [0.3, 0.6] | 4.4 [3.9, 4.9] |
| Alaska | 10.3 [8.4, 12.2] | 4.8 [3.5, 6.0] | a | 1.8 [1.0, 2.6] | 2.0 [1.2, 2.8] |
| Arizona | 11.0 [10.3, 11.7] | 4.9 [4.5, 5.4] | 0.7 [0.5, 0.8] | 1.0 [0.8, 1.3] | 4.0 [3.6, 4.4] |
| Arkansas | 9.4 [8.4, 10.3] | 2.1 [1.7, 2.5] | 0.7 [0.5, 1.0] | 0.7 [0.5, 1.0] | 5.4 [4.7, 6.1] |
| California | 5.3 [5.1, 5.5] | 2.3 [2.1, 2.4] | 0.6 [0.5, 0.6] | 0.8 [0.7, 0.8] | 1.5 [1.4, 1.6] |
| Colorado | 9.6 [8.8, 10.3] | 4.5 [4.0, 5.0] | 0.7 [0.5, 0.8] | 1.0 [0.7, 1.2] | 3.0 [2.6, 3.4] |
| Connecticut | 9.5 [8.7, 10.4] | 5.9 [5.2, 6.6] | 0.6 [0.4, 0.9] | 0.7 [0.5, 1.0] | 1.9 [1.5, 2.3] |
| Delaware | 11.2 [9.3, 13.0] | 4.8 [3.6, 6.0] | a | a | 4.4 [3.2, 5.6] |
| Florida | 9.8 [9.4, 10.2] | 4.2 [4.0, 4.5] | 1.2 [1.0, 1.3] | 0.9 [0.8, 1.0] | 3.2 [2.9, 3.4] |
| Georgia | 6.7 [6.3, 7.2] | 3.3 [3.0, 3.6] | 0.8 [0.6, 0.9] | 0.6 [0.5, 0.8] | 1.9 [1.7, 2.2] |
| Hawaii | 4.3 [3.3, 5.2] | 1.4 [0.9, 2.0] | a | a | a |
| Idaho | 6.3 [5.2, 7.3] | 2.5 [1.8, 3.1] | a | a | 2.7 [2.1, 3.4] |
| Illinois | 8.9 [8.5, 9.4] | 3.9 [3.6, 4.2] | 0.7 [0.6, 0.8] | 0.7 [0.6, 0.8] | 3.5 [3.2, 3.8] |
| Indiana | 11.3 [10.7, 12.0] | 3.6 [3.2, 3.9] | 0.6 [0.5, 0.8] | 0.3 [0.2, 0.5] | 6.6 [6.0, 7.1] |
| Iowa | 4.7 [4.1, 5.4] | 2.2 [1.8, 2.6] | 0.9 [0.6, 1.2] | a | 1.1 [0.8, 1.4] |
| Kansas | 5.7 [5.0, 6.4] | 2.3 [1.8, 2.8] | a | 0.5 [0.3, 0.8] | 2.2 [1.8, 2.7] |
| Kentucky | 11.6 [10.8, 12.5] | 5.5 [4.9, 6.1] | 1.3 [1.0, 1.6] | 0.5 [0.3, 0.7] | 4.2 [3.7, 4.7] |
| Louisiana | 9.9 [9.1, 10.6] | 2.1 [1.7, 2.4] | 0.5 [0.3, 0.6] | 0.6 [0.4, 0.8] | 6.5 [5.9, 7.1] |
| Maine | 8.4 [7.0, 9.8] | 5.2 [4.1, 6.3] | a | a | 1.2 [0.7, 1.7] |
| Maryland | 10.0 [9.3, 10.7] | 6.0 [5.5, 6.5] | 0.6 [0.4, 0.8] | 0.5 [0.3, 0.6] | 2.5 [2.2, 2.9] |
| Massachusetts | 9.1 [8.4, 9.7] | 3.8 [3.4, 4.2] | 0.7 [0.5, 0.8] | 0.9 [0.7, 1.1] | 3.1 [2.7, 3.4] |
| Michigan | 9.3 [8.8, 9.8] | 4.3 [3.9, 4.6] | 1.0 [0.8, 1.1] | 0.6 [0.4, 0.7] | 3.2 [2.9, 3.5] |
| Minnesota | 5.8 [5.2, 6.3] | 2.8 [2.5, 3.2] | 0.5 [0.3, 0.7] | 0.4 [0.2, 0.5] | 1.8 [1.5, 2.1] |
| Mississippi | 5.3 [4.6, 5.9] | 1.3 [0.9, 1.6] | a | a | 3.2 [2.7, 3.8] |
| Missouri | 11.2 [10.5, 11.9] | 6.5 [6.0, 7.1] | 0.9 [0.7, 1.1] | 0.7 [0.5, 0.9] | 2.5 [2.2, 2.9] |
| Montana | 7.3 [5.9, 8.7] | 2.9 [2.0, 3.7] | a | a | 2.8 [1.9, 3.7] |
| Nebraska | 3.1 [2.4, 3.8] | 0.9 [0.5, 1.3] | a | a | 1.2 [0.8, 1.7] |
| Nevada | 13.5 [12.3, 14.7] | 7.5 [6.6, 8.4] | 1.5 [1.1, 1.9] | 1.5 [1.1, 1.9] | 2.3 [1.8, 2.8] |
| New Hampshire | 11.6 [10.0, 13.2] | 8.4 [7.1, 9.8] | a | a | 1.3 [0.8, 1.9] |
| New Jersey | 10.0 [9.4, 10.6] | 4.3 [3.9, 4.7] | 0.5 [0.4, 0.7] | 0.6 [0.5, 0.8] | 4.3 [3.9, 4.6] |
| New Mexico | 14.7 [13.3, 16.1] | 7.5 [6.5, 8.5] | 1.4 [1.0, 1.8] | 2.7 [2.1, 3.3] | 2.6 [2.0, 3.2] |
| New York | 6.9 [6.5, 7.2] | 3.8 [3.6, 4.0] | 0.8 [0.7, 0.9] | 0.6 [0.5, 0.7] | 1.4 [1.2, 1.5] |
| North Carolina | 8.8 [8.3, 9.3] | 6.1 [5.7, 6.5] | 0.7 [0.6, 0.8] | 0.8 [0.7, 1.0] | 1.0 [0.9, 1.2] |
| North Dakota | 3.1 [2.1, 4.1] | a | a | a | a |
| Ohio | 10.1 [9.6, 10.6] | 5.7 [5.3, 6.1] | 0.7 [0.6, 0.9] | 0.7 [0.5, 0.8] | 2.7 [2.5, 3.0] |
| Oklahoma | 11.1 [10.2, 11.9] | 6.7 [6.0, 7.4] | 1.7 [1.3, 2.0] | 1.1 [0.8, 1.3] | 1.1 [0.9, 1.4] |
| Oregon | 7.3 [6.6, 8.1] | 5.1 [4.5, 5.7] | 0.8 [0.6, 1.1] | 0.5 [0.3, 0.6] | 0.7 [0.5, 0.9] |
| Pennsylvania | 13.2 [12.7, 13.8] | 4.8 [4.5, 5.2] | 0.7 [0.6, 0.8] | 0.5 [0.4, 0.6] | 7.0 [6.6, 7.4] |
| Rhode Island | 7.9 [6.5, 9.2] | 4.0 [3.0, 4.9] | a | a | 1.9 [1.2, 2.5] |
| South Carolina | 6.6 [5.9, 7.2] | 2.5 [2.2, 2.9] | 0.8 [0.5, 1.0] | 0.7 [0.5, 0.9] | 2.4 [2.0, 2.7] |
| South Dakota | 3.9 [2.7, 5.0] | 1.9 [1.1, 2.7] | a | a | a |
| Tennessee | 9.2 [8.5, 9.8] | 4.4 [4.0, 4.8] | 1.5 [1.2, 1.7] | 0.9 [0.7, 1.1] | 2.1 [1.8, 2.4] |
| Texas | 7.0 [6.7, 7.2] | 2.9 [2.7, 3.0] | 0.8 [0.7, 0.9] | 1.1 [1.0, 1.2] | 1.9 [1.8, 2.1] |
| Utah | 12.5 [11.5, 13.5] | 5.3 [4.6, 5.9] | 2.1 [1.7, 2.5] | 2.1 [1.6, 2.5] | 2.2 [1.8, 2.6] |
| Vermont | 7.4 [5.6, 9.2] | 4.9 [3.5, 6.3] | a | a | a |
| Virginia | 6.8 [6.3, 7.3] | 4.2 [3.9, 4.6] | 0.9 [0.7, 1.1] | 0.5 [0.4, 0.6] | 0.7 [0.5, 0.9] |
| Washington | 8.0 [7.4, 8.6] | 3.8 [3.4, 4.2] | 1.0 [0.8, 1.2] | 1.0 [0.8, 1.2] | 1.9 [1.6, 2.2] |
| West Virginia | 15.1 [13.5, 16.7] | 10.8 [9.5, 12.2] | 1.1 [0.7, 1.6] | 2.0 [1.4, 2.5] | a |
| Wisconsin | 8.1 [7.5, 8.7] | 4.6 [4.2, 5.1] | 0.7 [0.5, 0.9] | 0.4 [0.2, 0.5] | 2.2 [1.9, 2.5] |
| Wyoming | 9.1 [7.0, 11.2] | 3.4 [2.1, 4.6] | a | a | 3.4 [2.1, 4.6] |
| United States | 8.4 [8.3, 8.5] | 3.9 [3.9, 4.0] | 0.8 [0.8, 0.8] | 0.8 [0.7, 0.8] | 2.6 [2.6, 2.7] |
Notes: District of Columbia not reported due to low death counts.
Death rates with numerators < 20.
Trends in drug poisoning deaths by state
From 2006 to 2015, drug poisoning death rates increased significantly in New York (9.4% per year), Ohio (9.1% per year), Massachusetts (9.0% per year), New Jersey (8.7% per year), Minnesota (8.6% per year), Wisconsin (6.2% per year), California (4.2% per year), Michigan (3.9% per year), and Illinois (2.6% per year). In Massachusetts, the rate grew faster, by 32.2% per year from 2012 to 2015. The rate increased significantly by 7.2% per year in Maryland from 2008 to 2015 and by 9.9% per year in Pennsylvania from 2010 to 2015. In New Mexico, the rate increased significantly by 14.9% per year from 2006 to 2009 and then declined by 6.7% per year from 2009 to 2015. The rates decreased significantly in Louisiana (8.1% per year), Arkansas (4.2% per year), and Nevada (4.0% per year) from 2006 to 2015. In Louisiana, the decline was faster by 17.4% per year from 2006 to 2011. The rates decreased significantly by 13.6% per year in Florida and by 6.4% per year in Tennessee from 2006 to 2013. Figure 1 illustrates changes in drug poisoning death rates, by state, between 2006 and 2015.
Figure 1.
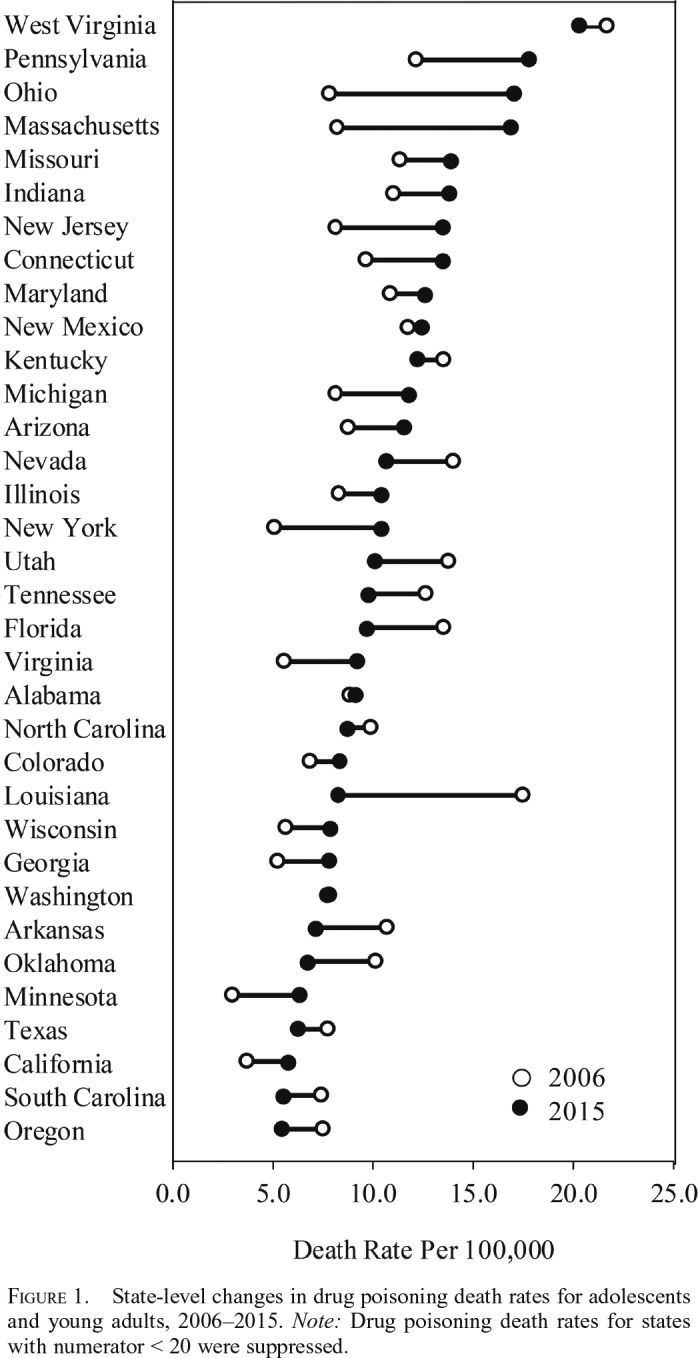
State-level changes in drug poisoning death rates for adolescents and young adults, 2006–2015. Note: Drug poisoning death rates for states with numerator < 20 were suppressed.
Costs of drug poisoning deaths
In 2015, the total costs of drug poisoning deaths among adolescents and young adults was estimated as $35.1 billion nationally. That total costs included $27.1 million in medical costs, $8.5 billion in work loss costs, and $26.5 billion in quality of life loss. The costs of drug poisoning deaths varied by state, with costs ranging from $190.7 million in Iowa to $2.6 billion in California. Table 4 details the costs of drug poisoning deaths by state.
Table 4.
Comprehensive costs of drug poisoning deaths among adolescents and young adults, by state, 2015

| State | Medical costs (2015 million $) | Work loss costs (2015 million $) | Quality of life loss (2015 million $) | Total costs (2015 million $) |
| Alabama | 0.2 | 120.7 | 382.8 | 503.7 |
| Arizona | 0.7 | 221.9 | 688.2 | 910.8 |
| Arkansas | 0.1 | 57.4 | 181.9 | 239.4 |
| California | 2.1 | 633.9 | 1,980.7 | 2,616.7 |
| Colorado | 0.3 | 123.6 | 389.7 | 513.6 |
| Connecticut | 0.3 | 138.5 | 416.9 | 555.6 |
| Florida | 1.7 | 483.0 | 1,515.2 | 1,999.9 |
| Georgia | 0.9 | 227.9 | 706.7 | 935.5 |
| Illinois | 1.0 | 365.6 | 1,147.6 | 1,514.2 |
| Indiana | 1.1 | 257.4 | 815.8 | 1,074.2 |
| Iowa | 0.3 | 46.5 | 144.0 | 190.7 |
| Kentucky | 0.6 | 145.9 | 457.3 | 603.9 |
| Louisiana | 0.3 | 110.2 | 330.0 | 440.5 |
| Maryland | 0.8 | 199.2 | 619.1 | 819.1 |
| Massachusetts | 1.0 | 327.8 | 1,004.0 | 1,332.8 |
| Michigan | 1.1 | 324.6 | 1,029.6 | 1,355.2 |
| Minnesota | 0.2 | 94.9 | 287.1 | 382.2 |
| Missouri | 0.8 | 227.5 | 724.3 | 952.5 |
| Nevada | 0.3 | 77.9 | 245.1 | 323.3 |
| New Hampshire | 0.2 | 84.5 | 263.1 | 347.8 |
| New Jersey | 0.8 | 317.6 | 965.5 | 1,283.9 |
| New Mexico | 0.1 | 72.8 | 225.2 | 298.1 |
| New York | 1.6 | 568.5 | 1,734.4 | 2,304.5 |
| North Carolina | 0.7 | 245.8 | 755.8 | 1,002.2 |
| Ohio | 1.7 | 529.3 | 1,651.1 | 2,182.1 |
| Oklahoma | 0.1 | 76.0 | 231.6 | 307.7 |
| Oregon | 0.2 | 57.2 | 174.6 | 232.0 |
| Pennsylvania | 1.8 | 600.0 | 1,877.7 | 2,479.5 |
| Rhode Island | 0.2 | 48.4 | 150.2 | 198.8 |
| South Carolina | 0.2 | 74.7 | 231.0 | 305.9 |
| Tennessee | 0.7 | 174.6 | 544.6 | 719.9 |
| Texas | 1.8 | 501.7 | 1,553.7 | 2,057.2 |
| Utah | 0.4 | 98.9 | 306.4 | 405.7 |
| Virginia | 0.6 | 213.6 | 655.5 | 869.7 |
| Washington | 0.6 | 141.7 | 452.4 | 594.8 |
| West Virginia | 0.3 | 91.5 | 295.6 | 387.4 |
| Wisconsin | 0.3 | 123.1 | 389.1 | 512.5 |
| United States | 27.1 | 8,520.8 | 26,506.9 | 35,054.8 |
Notes: Costs for Alaska, Delaware, District of Columbia, Hawaii, Idaho, Kansas, Maine, Mississippi, Montana, Nebraska, North Dakota, South Dakota, Vermont, and Wyoming not reported because of < 20 drug poisoning deaths in those states.
Discussion
Adolescents and young adults are at heightened risk for drug use and poisoning. We examined sociodemographic characteristics and state trends as well as costs of drug poisoning deaths among 15- to 24-year-olds to explore where state-level prevention and intervention strategies are most needed and which sociodemographic groups should be targeted by prevention efforts. Between 2006 and 2015, drug poisoning death rates in adolescents and young adults increased by 1.8% per year on average (nonsignificant increase), with significant increases in deaths attributable to pharmaceutical drugs (6.7% per year from 2006 to 2010), illicit drugs (9.7% per year from 2009 to 2015), and opioids (15.4% per year from 2013 to 2015). We found that death rates decreased over time for adolescents and young adults ages 15–19 years but increased for those ages 20–24 years. These trends in drug poisoning death rates parallel trends in self-reported drug use and drug dependence in the two age groups (Center for Behavioral Health Statistics and Quality, 2011, 2016; SAMHSA, 2007). Nonetheless, the significant increases in death rates from 2014 to 2015 in both age groups indicate a growing problem.Although drug poisoning death rates were consistently higher in male than female adolescents and young adults, the gap narrowed over time. White and American Indian/Alaskan Native adolescents and young adults had the highest rates, and the rates increased for White, Asian/Pacific Islander, and Black adolescents and young adults. The sex and racial pattern of death rates in this population mirror the all-age pattern (Mack et al., 2013). Older reports indicate higher nonmedical prescription drug and opioid use among adolescents in nonmetropolitan areas (Havens et al., 2011; Monnat & Rigg, 2016), but we found that overall drug poisoning death rates decreased for adolescents and young adults in nonmetropolitan areas.
Regional comparisons indicated increased death rates in the Northeast and the Midwest regions. This pattern mirrors the all-age pattern (Rudd et al., 2016b) and reflects the growing illegal drug market in these regions (Drug Enforcement Agency [DEA], 2016). In our study, the rates increased significantly in nine states and decreased significantly in three states over the course of 10 years. Rate changes were not significant in 22 states. Trends could not be determined for 16 states and the District of Columbia because of small numbers. Increased rates in some states may be explained by the availability of drugs in those states, as state variations in drug poisoning deaths track variations in opioid prescriptions per resident (Paulozzi et al., 2011).
The surge in drug poisoning deaths, especially opioids and pharmaceutical drugs, among adolescents and young adults reflects the ease of access to pharmaceutical drugs, especially prescription opioids (McCabe et al., 2007; SAMHSA, 2014), and later transition to more potent opioids (Jones, 2013; Miech et al., 2015). For example, when people addicted to prescription opioids face difficulty accessing these drugs because of tighter controls, they often turn to increasingly available and cheaper heroin (Cicero et al., 2014; DEA, 2016). When transitioning to heroin use, these individuals are at high risk for poisoning because they are accustomed to titrated prescription drugs and do not realize that heroin varies in potency and can be cut or mixed with dangerous and potentially deadly substances (Collier, 2013; DEA, 2016). Highly potent and lethal nonprescription fentanyl and fentanyl analogs, such as carfentanil and U47700, have flooded the illicit market. They commonly are mixed with or substituted for heroin (DEA, 2016; SAMHSA, 2013). An experienced heroin user tests each buy with a tiny bit to assess potency before deciding on the dose to take, but a novice may fail to follow that procedure or may not be able to judge well.
In our study, we examined sociodemographic characteristics and state trends in drug poisoning deaths, as well as estimated costs of drug poisoning deaths nationally and by state. Our findings extend previous research on drug poisoning trends in adolescents and/or young adults (Curtin et al., 2017; Gilchrist et al., 2012; Hedegaard et al., 2017). Our analysis of sociodemographic characteristics and state trends in drug poisoning death rates inform state-level intervention planning. Public health practitioners in states with growing drug poisoning death rates may consider systems-level interventions to reduce prescription drug poisoning, such as expansion of prescription drug monitoring programs, insurer strategies, pain clinic legislation, clinical guidelines, and naloxone distribution programs (Haegerich et al., 2014). We found that although drug poisoning deaths were mostly unintentional, a small fraction were suicides. Hence, separate intervention strategies should be tailored for suicide-related drug poisoning. In addition, education for patients and physicians, development of prescription drug disposal methods that are convenient and environmentally responsible, and medication-assisted treatment combining medications with counseling and behavioral therapies are promising strategies to reduce drug poisoning death rates among adolescents and young adults (SAMHSA, 2016b).
The burden of drug poisoning deaths among adolescents and young adults is substantial, as reflected in the total costs. Premature deaths from drug poisonings prevent individuals from contributing goods and services in the marketplace, the public sector, or the household. These deaths also have a significant emotional and psychosocial toll on the victim’s families and their communities. The value of these losses is a cost borne by society. We provided costs of drug poisoning deaths among adolescents and young adults based on widely used cost estimates. Information regarding the costs of drug poisoning deaths may help prioritize policies and programs targeting drug use treatment and prevention.
Limitations
Although based on a mortality census, our findings have limitations. The Multiple Cause of Death data used in this study contain ICD-10 cause codes recorded on death certificates. Cause reporting variability between states and over time are known issues when using death certificate data (Heins & Crifasi, 2016). In 2008–2010, only 75% of drug poisoning death certificates indicated specific drugs involved, with states varying from 33% to 95% (Warner et al., 2013). Another limitation of the Multiple Cause of Death data is the rate at which states test decedents for drugs. If a state starts testing more decedents and reporting the drugs used, then its opioid death rate will appear to rise over time, unless the time series is adjusted to allocate deaths by unspecified drugs proportionally to the more specific categories. Indeed, the spike in documented deaths from opioids resulted in part from improved testing and reporting of opioid involvement. Even the combined total drug poisoning measure is imperfect because budget constraints or deadlines for data submission can cause some deaths to be coded with uninformative codes, like “R99: Other ill-defined and unspecified causes of mortality” or “W78: Inhalation of gastric contents.” Approximately 80% of deaths with pending causes due to toxicology testing time and cost, some of which include drug poisoning causes, are assigned an underlying code of R99 (Hedegaard et al., n.d.).
Moreover, no standard training exists for those completing death certificates, primarily medical examiners and coroners. Coroners typically have less medical training and less familiarity with toxicological terminology than medical examiners. Thus, compared with coroners, medical examiners are more likely to specify drugs involved in drug poisonings (Warner et al., 2013). Wide variations in documentation and toxicological testing practices across time and from state to state indicate higher reliability of aggregated data on total drug poisoning deaths than drug categories.
We did not conduct trend analysis and cost estimates by the specific type of drug involved in death due to small counts. However, a previous study on all-age drug poisoning deaths reported that deaths involving heroin, synthetic opioids other than methadone (e.g., fentanyl and tramadol), cocaine, and psychostimulants (e.g., methamphetamine) have risen, whereas deaths involving methadone and natural and semisynthetic opioid analgesics (e.g., oxycodone and hydrocodone) have declined (Hedegaard et al., 2017). In addition, we purposely restricted the range of drug categories analyzed in this study. We examined opioids, both prescription or illicit, together to count all naturally derived, semisynthetic, and synthetic substances that stimulate opioid receptors in the brain, because toxicological tests cannot distinguish between some drugs, notably heroin and pharmaceutical morphine. Also, the Multiple Cause of Death data do not differentiate prescribed from illicit use of specific drugs. Our labels for drug categories were adapted from the CDC (2013) guide. We categorized poisoning by unspecified narcotics (T40.6) as unspecified drugs because this code is frequently used for both opioids and cocaine derivatives in practice (Hedegaard et al., n.d.).
Drug poisoning deaths often involve more than one drug category. We found that nearly half of drug poisoning deaths among adolescents and young adults involved more than one drug category (data available from the authors upon request). When CDC Wide-ranging Online Data for Epidemiologic Research (WONDER) database users tabulate deaths by drug category, WONDER includes deaths involving more than one category of drug in the count for each category (Calcaterra et al., 2013; Mack et al., 2013; Paulozzi et al., 2011; Rudd et al., 2016a, 2016b). Summing those counts across categories is inappropriate; it yields a count far exceeding total drug deaths. We instead assigned deaths into one drug category based on the first listed drug poisoning diagnosis on the death certificate. Assigning a single drug category for each death avoids double counting of drug-involved deaths. Alternative methods of avoiding double counting would be to weight all the drugs involved such that the weights sum to 1, but any such weighting scheme would be arbitrary. Another alternative would be to develop a hierarchy of drugs according to their associated relative risks of death.
Future research is encouraged to inform and standardize researchers’ categorization of deaths involving multiple drugs. Future research may also examine trends in drug poisoning deaths involving opioids only, pharmaceutical drugs only, illicit drugs only, unspecified drugs only, and combinations of drugs among adolescents and young adults.
Conclusions
Deaths among adolescents and young adults because of drug poisoning is a serious public health issue. Death rates have increased significantly for White, Asian/Pacific Islander, and Black adolescents and young adults, as well as for those in the Northeast and Midwest regions. We provided death rates in states by drug categories (i.e., opioids, pharmaceutical drugs excluding opioids, illicit drugs excluding opioids, and unspecified drugs). Total drug poisoning counts, however, are more reliable than drug categories because of varying levels of testing and reporting of drugs among states. With the burden of drug poisoning deaths among adolescents and young adults estimated at $35.1 billion nationally, targeted state-specific efforts are warranted to address drug poisoning deaths in this population.
Footnotes
This project is supported by the Health Resources and Services Administration of the U.S. Department of Health and Human Services under the Child and Adolescent Injury and Violence Prevention Resource Centers Cooperative Agreement (U49MC28422).
The rate increased from 3.4 in 2006 to 5.3 in 2015. When counting with any mention of opioids on death certificates, the opioid-related death rate increased from 4.4 in 2006 to 6.7 in 2015.
References
- Arias E. National Vital Statistics Reports. 7. Vol. 62. Hyattsville, MD: National Center for Health Statistics; 2014. United States life tables, 2009. [PubMed] [Google Scholar]
- Brown S. A., McGue M., Maggs J., Schulenberg J., Hingson R., Swartzwelder S., Murphy S. A developmental perspective on alcohol and youths 16 to 20 years of age. Pediatrics. 2008;121(Supplement 4):S290–S310. doi: 10.1542/peds.2007-2243D. doi:10.1542/peds.2007-2243D. [DOI] [PMC free article] [PubMed] [Google Scholar]
- Calcaterra S., Glanz J., Binswanger I. A. National trends in pharmaceutical opioid related overdose deaths compared to other substance related overdose deaths: 1999-2009. Drug and Alcohol Dependence. 2013;131:263–270. doi: 10.1016/j.drugalcdep.2012.11.018. doi:10.1016/j.drugalcdep.2012.11.018. [DOI] [PMC free article] [PubMed] [Google Scholar]
- Center for Behavioral Health Statistics and Quality. Results from the 2010 National Survey on Drug Use and Health: Summary of national findings. 2011. (HHS Publication No. SMA 11-4658, NSDUH Series H-41). Rockville, MD: Substance Abuse and Mental Health Services Administration. [Google Scholar]
- Center for Behavioral Health Statistics and Quality. Results from the 2015 National Survey of Drug Use and Health: Detailed tables. Rockville, MD: Substance Abuse and Mental Health Services Administration; 2016. [Google Scholar]
- Centers for Disease Control and Prevention (CDC) Prescription drug overdose data & statistics: Guide to ICD-9-CM and ICD-10 codes related to poisoning and pain. 2013. Retrieved from https://www.cdc.gov/drugoverdose/pdf/pdo_guide_to_icd-9-cm_and_icd-10_codes-a.pdf. [Google Scholar]
- Centers for Disease Control and Prevention (CDC) WISQARS: Leading cause of death reports, 2015. 2017. Retrieved from www.cdc.gov/injury/wisqars. [Google Scholar]
- Cicero T. J., Ellis M. S., Surratt H. L., Kurtz S. P. The changing face of heroin use in the United States: A retrospective analysis of the past 50 years. JAMA Psychiatry. 2014;71:821–826. doi: 10.1001/jamapsychiatry.2014.366. doi:10.1001/jamapsychiatry.2014.366. [DOI] [PubMed] [Google Scholar]
- Collier R. Street versions of opioids more potent and dangerous. Canadian Medical Association Journal. 2013;185:1027. doi: 10.1503/cmaj.109-4535. doi:10.1503/cmaj.109-4535. [DOI] [PMC free article] [PubMed] [Google Scholar]
- Curtin S. C., Tejada-Vera B., Warmer M. Drug overdose deaths among adolescents aged 15–19 in the United States: 1999–2015. NCHS Data Brief. 2017;282:1–8. Retrieved from https://www.cdc.gov/nchs/data/databriefs/db282.pdf. [PubMed] [Google Scholar]
- Drug Enforcement Agency (DEA) National heroin threat assessment summary - Updated. 2016. Retrieved from https://www.dea.gov/sites/default/files/2018-07/hq062716_attach.pdf. [Google Scholar]
- Gilchrist J., Ballesteros M. F., Parker E. M. the Centers for Disease Control and Prevention. Vital signs: Unintentional injury deaths among persons aged 0-19 years - United States, 2000-2009. Morbidity and Mortality Weekly Report. 2012;61:270–276. [PubMed] [Google Scholar]
- Grosse S. D., Krueger K. V., Mvundura M. Economic productivity by age and sex: 2007 estimates for the United States. Medical Care, 47, Supplement. 2009:S94–S103. doi: 10.1097/MLR.0b013e31819c9571. doi:10.1097/MLR.0b013e31819c9571. [DOI] [PubMed] [Google Scholar]
- Haegerich T. M., Paulozzi L. J., Manns B. J., Jones C. M. What we know, and don’t know, about the impact of state policy and systems-level interventions on prescription drug overdose. Drug and Alcohol Dependence. 2014;145:34–47. doi: 10.1016/j.drugalcdep.2014.10.001. doi:10.1016/j.drugalcdep.2014.10.001. [DOI] [PMC free article] [PubMed] [Google Scholar]
- Havens J. R., Young A. M., Havens C. E. Nonmedical prescription drug use in a nationally representative sample of adolescents: Evidence of greater use among rural adolescents. Archives of Pediatrics & Adolescent Medicine. 2011;165:250–255. doi: 10.1001/archpediatrics.2010.217. doi:10.1001/archpediatrics.2010.217. [DOI] [PubMed] [Google Scholar]
- Hedegaard H., Warner M., Miniño A. M. Drug overdose deaths in the United States, 1999-2015. NCHS Data Brief. 2017;273:1–8. [PubMed] [Google Scholar]
- Hedegaard H., Warner M., Paulozzi L., Johnson R. Excerpts from: Issues to consider when analyzing ICD-10 coded data on drug poisoning (overdose) deaths. n.d http://c.ymcdn.com/sites/www.cste.org/resource/resmgr/Injury/Analysis_of_data_on_drug_poi.pdf The National Center for Health Statistics and the National Center for Injury Prevention and Control. Retrieved from. [Google Scholar]
- Heins S. E., Crifasi C. K. Distinctive injury deaths: The role of environment, policy and measurement across states. Injury Prevention. 2016;22:247–252. doi: 10.1136/injuryprev-2015-041833. doi:10.1136/injuryprev-2015-041833. [DOI] [PubMed] [Google Scholar]
- Jones C. M. Heroin use and heroin use risk behaviors among nonmedical users of prescription opioid pain relievers - United States, 20022004 and 2008-2010. Drug and Alcohol Dependence. 2013;132:95–100. doi: 10.1016/j.drugalcdep.2013.01.007. doi:10.1016/j.drugalcdep.2013.01.007. [DOI] [PubMed] [Google Scholar]
- Lawrence B. A., Miller T. R. Medical and work loss cost estimation methods for the WISQARS cost of injury module. 2014. doi:10.13140/2.1.2130.1127. [Google Scholar]
- Mack K. A., Jones C. M., Paulozzi L. J. the Centers for Disease Control and Prevention. Vital signs: Overdoses of prescription opioid pain relievers and other drugs among women—United States, 1999-2010. Morbidity and Mortality Weekly Report. 2013;62:537–542. [PMC free article] [PubMed] [Google Scholar]
- McCabe S. E., Cranford J. A., Boyd C. J., Teter C. J. Motives, diversion and routes of administration associated with nonmedical use of prescription opioids. Addictive Behaviors. 2007;32:562–575. doi: 10.1016/j.addbeh.2006.05.022. doi:10.1016/j.addbeh.2006.05.022. [DOI] [PMC free article] [PubMed] [Google Scholar]
- McCabe S. E., West B. T., Boyd C. J. Motives for medical misuse of prescription opioids among adolescents. Journal of Pain. 2013;14:1208–1216. doi: 10.1016/j.jpain.2013.05.004. doi:10.1016/j.jpain.2013.05.004. [DOI] [PMC free article] [PubMed] [Google Scholar]
- Miech R., Johnston L., O’Malley P. M., Keyes K. M., Heard K. Prescription opioids in adolescence and future opioid misuse. Pediatrics. 2015;136:e1169–e1177. doi: 10.1542/peds.2015-1364. doi:10.1542/peds.2015-1364. [DOI] [PMC free article] [PubMed] [Google Scholar]
- Miller T. R. The plausible range for the value of life––Red herrings among the mackerel. Journal of Forensic Economics. 1990;3:17–39. doi:10.5085/0898-5510-3.3.17. [Google Scholar]
- Miller T. R. Variations between countries in values of statistical life. Journal of Transport Economics and Policy. 2000;34:169–188. [Google Scholar]
- Miller T., Hendrie D. Economic evaluation of injury prevention and control programs. In: Li G., Baker S., editors. Injury research. Theories, methods and approaches. r; 2012. (pp. 641–666). New York, NY: Springe. [Google Scholar]
- Monnat S. M., Rigg K. K. Examining rural/urban differences in prescription opioid misuse among US adolescents. Journal of Rural Health. 2016;32:204–218. doi: 10.1111/jrh.12141. doi:10.1111/jrh.12141. [DOI] [PMC free article] [PubMed] [Google Scholar]
- National Academies of Sciences, Engineering, and Medicine. Advancing the power of economic evidence to inform investments in children, youth, and families. Washington DC: National Academies Press; 2016. [PubMed] [Google Scholar]
- National Cancer Institute. Joinpoint Regression Program, Version 4.6.0.0. 2018. Surveillance Research Program, Statistical Methodology and Applications Branch. Retrieved from https://surveillance.cancer.gov/joinpoint/ [Google Scholar]
- National Center for Health Statistics. U.S. Census populations with bridged race categories. 2017. Retrieved from https://www.cdc.gov/nchs/nvss/ bridged_race.htm. [Google Scholar]
- Neumann P. J., Sanders G. D., Russell L. B., Siegel J. E., Ganiats T. G. Cost-effectiveness in health and medicine. 2nd ed. New York, NY: Oxford University Press; 2016. [Google Scholar]
- Paulozzi L. J., Jones C. M., Mack K. A., Rudd R. A. the Centers for Disease Control and Prevention. Vital signs: Overdoses of prescription opioid pain relievers—United States, 1999–2008. Morbidity and Mortality Weekly Report. 2011;60:1487–1492. [PubMed] [Google Scholar]
- Rudd R. A., Aleshire N., Zibbell J. E., Gladden R. M. Increases in drug and opioid-involved overdose deaths—United States, 2010–2014. Morbidity and Mortality Weekly Report. 2016a;64:1378–1382. doi: 10.15585/mmwr.mm6450a3. doi:10.15585/mmwr.mm6450a3. [DOI] [PubMed] [Google Scholar]
- Rudd R. A., Seth P., David F., Scholl L. Increases in drug and opioid-involved overdose deaths—United States, 2010–2015. Morbidity and Mortality Weekly Report. 2016b;65:1445–1452. doi: 10.15585/mmwr.mm655051e1. doi:10.15585/mmwr. mm655051e1. [DOI] [PubMed] [Google Scholar]
- Stone A. L., Becker L. G., Huber A. M., Catalano R. F. Review of risk and protective factors of substance use and problem use in emerging adulthood. Addictive Behaviors. 2012;37:747–775. doi: 10.1016/j.addbeh.2012.02.014. doi:10.1016/j.addbeh.2012.02.014. [DOI] [PubMed] [Google Scholar]
- Substance Abuse and Mental Health Services Administration (SAMHSA) Results from the 2006 National Survey on Drug Use and Health: National findings. 2007 (Office of Applied Studies, NSDUH Series H-32, DHHS Publication No. SMA 07-4293). Rockville, MD: Author. [Google Scholar]
- Substance Abuse and Mental Health Services Administration (SAMHSA) Fact sheet: Fentanyl-laced heroin and cocaine. 2013. Retrieved from http://www.samhsa.gov/sites/default/files/programs_campaigns/medication_assisted/dear_colleague_letters/2013-colleague-letter-fentanylanalogues.pdf. [Google Scholar]
- Substance Abuse and Mental Health Services Administration (SAMHSA) Results from the 2013 National Survey on Drug Use and Health: Summary of National Findings. 2014. Retrieved from https://www.samhsa.gov/data/sites/default/files/NSDUHresultsPDFWHTML2013/Web/NSDUHresults2013.pdf. [PubMed] [Google Scholar]
- Substance Abuse and Mental Health Services Administration (SAMHSA) Rise in prescription drug misuse and abuse impacting teens. 2016a. Retrieved from https://www.samhsa.gov/homelessnessprograms-resources/hpr-resources/teen-prescription-drug-misuse-abuseSubstanceAbuse. [Google Scholar]
- Substance Abuse and Mental Health Services Administration (SAMHSA) SAMHSA’s efforts to fight prescription drug misuse and abuse. 2016b. Retrieved from https://www.samhsa.gov/prescription-drug-misuse-abuse/samhsas-efforts. [Google Scholar]
- U.S. Census Bureau. 2013 Census Bureau region and division codes and state FIPS codes. 2016. Retrieved from https://www.census.gov/geographies/reference-files/2013/demo/popest/2013-geocodes-all.html. [Google Scholar]
- Warner M., Paulozzi L. J., Nolte K. B., Davis G. G., Nelson L. S. State variation in certifying manner of death and drugs involved in drug intoxication deaths. Academic Forensic Pathology. 2013;3:231–237. doi:10.23907/2013.029. [Google Scholar]
- World Health Organization. International statistical classification of diseases and related health problems, 10th Revision. Geneva, Switzerland: Author; 1992. [Google Scholar]