

Abstract
Background
Pericardial effusion is common in hospitalized patients with chronic kidney disease (CKD). We sought to identify predictors and prognostic impact of pericardial effusion in CKD patients.
Hypothesis
Clinical and biochemical parameters can predict pericardial effusion in CKD patients.
Methods
In a retrospective nested case‐control design, we analyzed hospitalized adult patients with CKD stage 4, 5, or end‐stage renal disease diagnosed with pericardial effusion. Controls were same‐stage CKD patients without effusion.
Results
Among 84 cases and 61 controls, 44% and 34% were on dialysis, respectively. The mean creatinine was higher among cases versus controls (8.4±6.0 vs. 6.0±3.4 mg/dL, P = 0.002). Effusion was moderate to large in 46% of cases. Independent predictors of any pericardial effusion were serum potassium (OR: 1.95 per 1‐mEq/L increment, 95% CI: 1.21–3.13, P = 0.006), serum corrected calcium (OR: 1.33 per 1‐mg/dL decrement, 95% CI: 1.11–1.67, P = 0.015), and admission heart rate (OR: 1.29 per 10‐bpm increment, 95% CI: 1.03–1.62, P = 0.027). Corrected calcium level was an independent predictor of moderate to large pericardial effusion (OR: 1.38 per 1‐mg/dL decrement, 95% CI: 1.04–1.82, P = 0.023). Corrected calcium <8.0 mg/dL demonstrated 95% specificity for moderate to large effusion. Patients with effusion had no significant difference in the composite endpoint of mortality or cardiovascular rehospitalization (P = 0.408).
Conclusions
In hospitalized CKD patients, hypocalcemia may be useful in identifying those with moderate to large pericardial effusion. In this population, pericardial effusion does not seem to be associated with adverse outcomes.
Keywords: Chronic Kidney Disease, Outcomes, Pericardial Effusion, Predictors
1. INTRODUCTION
Uremic pericarditis, dialysis‐associated pericarditis, and pericardial effusion are common manifestations of patients with late‐stage chronic kidney disease (CKD). Although the specific pathophysiology is unclear, uremic and dialysis‐associated pericarditis are believed to be caused by accumulation of unidentified uremic toxins that resolve with initiation or intensification of dialysis.1 Chronic volume overload and hypoalbuminemia are additional potential mechanisms, as not all effusions are inflammatory in nature.1 Early studies in the predialysis era reported that the prevalence of uremic pericarditis among patients dying of CKD ranged from 35% to 50%.2 The prevalence of uremic pericarditis among patients on dialysis ranged from 16% to 41%.3, 4, 5 These patients benefit from initiation or intensification of dialysis.6, 7 The prevalence of pericardial effusion is 13% to 38% in patients starting dialysis and 30% among those established on dialysis.6, 7, 8 Although earlier studies specifically identified pericardial inflammation at autopsy in uremic patients, later studies used echocardiography to identify pericardial effusions with or without clinical symptoms of pericarditis. Currently, there is no clear literature addressing the prediction of pericardial effusion in CKD patients. Metabolic derangements associated with uremia, such as hypocalcemia, hyperparathyroidism, hypoproteinemia, and hyperuricemia were suggested to contribute to pericardial effusion.1, 9, 10, 11 However, this was not confirmed in comparative studies.9 Moreover, as most literature stems from decades‐old studies, it is unclear if pericardial effusion in late‐stage CKD patients portends a poor prognosis in the current era.
In this investigation, we sought to describe the clinical predictors of pericardial effusion in CKD patients and to evaluate the impact of pericardial effusion on their outcomes.
2. METHODS
2.1. Design and patients
We implemented a retrospective nested case–control study design. We conducted a search of electronic medical records for adult patients admitted to the John H. Stroger Jr. Hospital of Cook County (Chicago, IL) with a diagnosis of CKD or end‐stage renal disease (ESRD) in the period from January 1, 2004 to December 31, 2011. ICD‐9 codes (585.4, 585.5, 585.6, 39.95) were utilized to identify a list of CKD patients, which was cross‐referenced with a transthoracic echocardiography (TTE) database to identify patients with CKD who underwent TTE during their index hospitalization. From this list, cases were defined as patients with CKD stage 4 or 5, or those with ESRD, who were found to have pericardial effusion on TTE. CKD stage 4 and 5 were defined based on glomerular filtration rate (GFR) of <30 and < 15 mL/min/1.73 m2, respectively, using the CKD epidemiology collaboration formula.12 ESRD was defined as being dialysis dependent. Controls were randomly selected patients with CKD stage 4 or 5, or those with ESRD, who had no evidence of pericardial effusion on TTE. Patients with acute kidney injury were excluded. The study was approved by the institutional review board.
2.2. Clinical data
Demographic, clinical, and laboratory data were collected from the day of hospital admission. Medications known to cause pericardial effusion were tabulated; these included minoxidil, hydralazine, amiodarone, warfarin, sulfonamides, mesalamine, phenytoin, and certain chemotherapeutic agents (anthracyclines, cyclophosphamide, 5‐fluorouracil). Electrocardiographic (ECG) data were tabulated from the first ECG performed during the index hospitalization. Low voltage was defined as amplitude of total QRS voltage <1 mV in all precordial leads and < 0.5 mV in all limb leads.13 Electrical alternans was defined as a peak‐to‐peak QRS amplitude change ≥0.1 mV in each successive beat in ≥1 lead.14
2.3. Pericardial effusion
The TTE data were extracted from the formal study reports. The size of pericardial effusion was determined as small, moderate, or large based on the echo‐free space measured between the visceral and parietal pericardium at end‐diastole being <10 mm, 10 to 20 mm, or > 20 mm, respectively, according to the guidelines of the American Society of Echocardiography (ASE).15
2.4. Outcomes
Death and hospital readmission events and corresponding dates were ascertained via a detailed review of electronic medical records. Cardiovascular (CV) rehospitalization was defined as an admission with primary discharge diagnosis of heart failure (HF), myocardial infarction (MI), stroke, or pericarditis. The primary outcome was a composite endpoint of all‐cause mortality or CV rehospitalization.
2.5. Statistical analysis
The Student t test was used to compare continuous variables, which were expressed as mean ±SD. The χ2 test was used for comparisons of categorical variables, which were reported as frequencies and percentages.
To determine independent predictors of pericardial effusion, univariate predictors with P value <0.10 were entered in multivariate logistic regression models. Significant independent predictors were determined by applying a conditional backward elimination technique, such that at each step the variable with the highest P value that is >0.10 was eliminated to arrive at the fewest independent predictors. The risk of pericardial effusion associated with each predictor was expressed as odds ratio (OR) with 95% confidence interval (CI). One‐thousand sample iteration bootstrapping technique was used to ensure internal validity of OR estimates; a β coefficient bias of <0.1 was considered acceptable, indicating internal validity. The Hosmer‐Lemeshow test was used to assess the logistic models' goodness of fit.
Receiver operator characteristic (ROC) analyses were used to determine discriminative capacity of independent predictors of pericardial effusion, which were expressed as area under the curve (AUC) and 95% CI. We used the coordinates of ROC curves to determine sensitivity and specificity of selected abnormal cutoff values of continuous variables.
Kaplan–Meier survival plots and the log‐rank test were used to compare event‐free survival for patients with and without pericardial effusion. Time “0” in survival analysis was the date of hospital admission. Patients were censored at the date of the last clinical encounter. P values <0.05 were considered statistically significant. SPSS software, version 21 (IBM Corp., Armonk, NY) was used in all statistical analyses.
3. RESULTS
After applying the exclusion criteria, 84 patients were identified as cases of pericardial effusion and 61 patients were randomly selected as controls without pericardial effusion. The baseline characteristics of the study subjects are presented in Table 1. The study population was predominantly non‐Caucasian (84%). Among all subjects, 57% were on medications known to cause pericarditis, with similar distribution between cases and controls. Among patients with pericardial effusion, TTE was obtained for suspicion of pericarditis or pericardial effusion in only 6 (7.1%) subjects. The most common indication for TTE was HF, followed by suspected infective endocarditis. Among patients with effusion, pericardial rub, elevated jugular venous pulsation, and muffled heart sounds were observed in 2 (2.4%), 22 (26%), and 2 (2.4%) subjects, respectively, whereas low QRS voltage and electrical alternans on ECG were seen in only 5 (6%) and 4 (5%) subjects, respectively. Among patients with pericardial effusion, 7 (8%), 32 (38%), and 45 (54%) had large, moderate, and small effusion, respectively.
Table 1.
Baseline characteristics
| Controls (No Effusion), n = 61 | Pericardial Effusion (Any), n = 84 | Moderate to Large Effusion, n = 39 | |||
|---|---|---|---|---|---|
| Variable | P Valuea | P Valueb | |||
| Age, yc , d | 56 ±15 | 50 ±17 | 0.034 | 49 ±16 | 0.034 |
| Male sex | 41 (67) | 48 (57) | 0.219 | 19 (49) | 0.066 |
| Ethnicity | 0.386 | 0.338 | |||
| African American | 38 (62) | 43 (51) | 21 (54) | ||
| Hispanic | 17 (28) | 25 (30) | 10 (25) | ||
| Caucasian | 2 (3) | 8 (10) | 3 (8) | ||
| Other | 4 (7) | 8 (10) | 5 (13) | ||
| DM | 34 (56) | 42 (50) | 0.495 | 15 (39) | 0.092 |
| HTN | 57 (93) | 76 (90) | 0.522 | 33 (85) | 0.151 |
| HF | 15 (25) | 24 (29) | 0.594 | 12 (31) | 0.497 |
| COPD | 7 (12) | 11 (13) | 0.770 | 3 (8) | 0.539 |
| CAD | 8 (13) | 11(14) | 0.997 | 8 (21) | 0.325 |
| Cirrhosis | 1 (2) | 4 (5) | 0.309 | 2 (5) | 0.318 |
| HIV/TB | 3 (5) | 3 (4) | 0.688 | 1 (3) | 0.558 |
| Malignancy | 3 (5) | 8 (10) | 0.301 | 4 (10) | 0.307 |
| Cardiac surgery | 2 (3) | 2 (2) | 0.745 | 2 (5) | 0.645 |
| CKD stage | 0.159 | 0.411 | |||
| 4 | 20 (33) | 16 (19) | 8 (21) | ||
| 5 | 20 (33) | 31 (37) | 15 (39) | ||
| ESRD | 21 (34) | 37 (44) | 16 (41) | ||
| Dialysis | 21 (34) | 37 (44) | 0.243 | 16 (41) | 0.505 |
| Medications known to cause pericarditis | 35 (57) | 48 (57) | 0.980 | 22 (56) | 0.924 |
| SBP, mm Hg | 150 ± 35 | 159 ± 30 | 0.100 | 158 ±32 | 0.262 |
| DBP, mm Hgc | 82 ±25 | 89 ±22 | 0.050 | 88 ± 22 | 0.194 |
| HR, bpmc | 84 ±18 | 91 ±17 | 0.024 | 89 ±16 | 0.148 |
| Na, mEq/L | 137 ±5 | 137 ±5 | 0.574 | 137 ±5 | 0.587 |
| K, mEq/Lc , d | 4.5 ±0.8 | 4.9 ±0.9 | 0.003 | 4.8 ±0.9 | 0.074 |
| Bicarbonate, mEq/L | 21.3 ±5.7 | 20.7 ±5.3 | 0.505 | 21.0 ±5.6 | 0.765 |
| Chloride, mEq/L | 103 ±7 | 103 ±8 | 0.938 | 102 ±8 | 0.780 |
| Ca (corrected), mg/dLc , d | 10.5 ±2.0 | 9.4 ±1.7 | <0.001 | 9.3 ±1.9 | 0.003 |
| P, mg/dLc , d | 4.8 ±1.7 | 5.5 ±2.2 | 0.074 | 5.8 ±2.8 | 0.053 |
| Mg, mg/dL | 2.1 ±0.5 | 2.1 ±0.4 | 0.864 | 2.1 ±0.5 | 0.891 |
| Cr, mg/dLd | 6.0 ±3.4 | 8.4 ±5.9 | 0.002 | 8.5 ±6.1 | 0.024 |
| BUN, mg/dLc | 53.6 ±25.9 | 70.5 ±37.4 | 0.003 | 73.8 ±46.5 | 0.016 |
| GFR, mL/min/1.73 m2 | 12.8 ±6.3 | 10.3 ±7.1 | 0.038 | 10.0 ±7.1 | 0.048 |
| Hb, g/dLc , d | 10.2 ±2.4 | 9.5 ±1.9 | 0.043 | 9.4 ±1.9 | 0.075 |
| WBCs, × 1000/mm3 | 9.5 ±5.9 | 9.7 ±4.9 | 0.774 | 9.7 ±5.7 | 0.853 |
| Platelets, × 1000/mm3 | 248 ± 114 | 272 ±112.4 | 0.199 | 287 ±125 | 0.104 |
| Total protein, g/dL | 6.3 ±1.1 | 6.4 ±1.0 | 0.816 | 6.4 ±0.9 | 0.669 |
| Albumin, g/dL | 3.1 ±0.7 | 3.3 ±0.9 | 0.389 | 3.3 ±0.9 | 0.425 |
| TG, mg/dL | 134 ±83 | 124 ±59 | 0.578 | 116 ±49 | 0.413 |
| Cholesterol, mg/dL | 141 ±83 | 148 ±56 | 0.528 | 140 ±57 | 0.924 |
| TSH, mU/L | 4.4 ±8.3 | 6.0 ±18.8 | 0.668 | 2.6 ±2.0 | 0.372 |
| PTH, pg/mL | 348 ±275 | 361 ±252 | 0.816 | 367 ±227 | 0.782 |
| LDH, U/L | 361 ±416 | 333 ±368 | 0.726 | 286 ±149 | 0.321 |
Abbreviations: bpm, beat per minute; BUN, blood urea nitrogen; Ca, calcium; CAD, coronary artery disease; CKD, chronic kidney disease; COPD, chronic obstructive pulmonary disease; Cr, creatinine; DBP, diastolic blood pressure; DM, diabetes mellitus; ESRD, end‐stage renal disease; GFR, glomerular filtration rate; HF, heart failure; Hb, hemoglobin; HIV, human immunodeficiency virus; HR, heart rate; HTN, hypertension; K, potassium; LDH, lactate dehydrogenase; Mg, magnesium; Na, sodium; P, phosphorus; PTH, parathyroid hormone; SBP, systolic blood pressure; SD, standard deviation; TB, tuberculosis; TG, triglycerides; TSH, thyroid‐stimulating hormone; WBC, white blood cell.
Data are presented as n (%) or mean ±SD.
P value of any pericardial effusion vs controls.
P value of any moderate to large pericardial effusion vs controls.
Variables selected for multivariate analysis (P < 0.10) in predicting any pericardial effusion.
Variables selected for multivariate analysis (P < 0.10) in predicting moderate to large pericardial effusion.
There were no significant differences between the 2 study groups in terms of baseline comorbidities (Table 1). Notably, patients with pericardial effusion were younger and had higher diastolic blood pressure, heart rate (HR), blood urea nitrogen (BUN), serum creatinine (Cr), and potassium, but had lower serum corrected calcium and hemoglobin (Hb). The proportion of patients on dialysis therapy was higher among patients with pericardial effusion, although this difference was not statistically significant.
In univariate analysis, variables found to be associated with pericardial effusion with P values <0.10 were age, diastolic blood pressure, HR, serum potassium, corrected calcium, phosphorous, BUN, Cr, GFR, and Hb (Table 1). These variables were selected for multivariate analyses. Due to collinearity between Cr, BUN, and GFR, these variables were entered into separate multivariate models to identify the best fit model. The Hosmer‐Lemeshow test P values for models that included BUN, Cr, or GFR were 0.817, 0.685, and 0.596, respectively. Thus, the multivariate model that includes BUN was identified as the best fit model (the higher the P value, the better the fit); thus, BUN level was selected as a covariate of choice in subsequent analyses. In multivariate logistic regression model with backward elimination, only 3 variables remained independently predictive of pericardial effusions: HR at admission, serum potassium, and corrected calcium level (Table 2). Bootstrapping showed a bias of 0.002, 0.022, and 0.009 for the β coefficients of HR, serum potassium, and corrected calcium level, respectively, indicating acceptable internal validity of the results. ROC analyses demonstrated modest discriminative capacity for the 3 variables in identifying patients with any pericardial effusion (Figure 1A). Tachycardia (>100 bpm), hyperkalemia (>5 mEq/L), and hypocalcemia (corrected calcium <8 mg/dL) demonstrated specificity values of 84%, 89%, and 95%, respectively, for identifying any pericardial effusion (Figure 1A). The presence of any 1 of these abnormalities demonstrated 66% specificity and 55% sensitivity in identifying patients with any pericardial effusion. The presence of any 2 of these abnormalities demonstrated 97% specificity and 18% sensitivity in identifying patients with any pericardial effusion. The baseline characteristics of CKD patients not on dialysis (n = 47) are depicted in the Supporting Information, Table 1, in the online version of this article. Using the same methodology in this subgroup, serum corrected calcium was identified as the only independent predictor of pericardial effusion (OR: 1.45 per 1‐mg/dL decrement in level, 95% CI: 1.08–1.96, P = 0.013).
Table 2.
Independent predictors of any pericardial effusion
| Variable | OR | 95% CI | P Value |
|---|---|---|---|
| HR, bpm | 1.290a | 1.029–1.618 | 0.027 |
| Serum K, mEq/L | 1.949b | 1.213–3.134 | 0.006 |
| Serum corrected Ca, mg/dL | 1.330c | 1.057–1.675 | 0.015 |
Abbreviations: bpm, beat per minute; Ca, calcium; CI, confidence interval; HR, heart rate; K, potassium; OR, odds ratio.
Per 10‐bpm increase in HR.
Per 1‐mEq/L increment in K level.
Per 1‐mg/dL decrement in corrected Ca level.
Figure 1.

Discriminatory capacity of predictors of pericardial effusion. The figures depict ROC curves of significant predictors of pericardial effusion and the diagnostic performance of selected abnormal thresholds. Abbreviations: AUC, area under the curve; bpm, beat per minute; Ca, serum corrected calcium level; CI, confidence interval; HR, heart rate; K, serum potassium level; ROC, receiver operator characteristic; sen, sensitivity; spec, specificity
Separate statistical analyses were performed to determine variables associated with moderate to large pericardial effusion (n = 39). As shown in Table 1, variables found to be associated with moderate to large effusion in univariate analysis (P < 0.10) were age, serum potassium, corrected calcium, phosphorous, Cr, and Hb. These variables were entered in a multivariate logistic regression model with backward elimination. Only serum corrected calcium continued to be independently predictive of moderate to large effusion (OR: 1.38 per 1‐mg/dL decrement in level, 95% CI: 1.04–1.81, P = 0.023). Bootstrapping revealed a bias of 0.008 in the β coefficient of corrected calcium level, indicating acceptable internal validity of the results. ROC analysis demonstrated that serum corrected calcium had modest discriminatory capacity for moderate to large pericardial effusion (AUC: 0.67, 95% CI: 0.57–0.78, P = 0.004; Figure 1B). Serum corrected calcium <8.0 mg/dL demonstrated a 95% specificity and 22% sensitivity for moderate to large pericardial effusion.
During a mean follow‐up of 2.0 ±2.3 years, there were 15 (10.3%) deaths, 64 (44.1%) CV rehospitalizations, and 73 (50.3%) composite events of death or CV rehospitalization. As indicated in Figure 2, there was no statistically significant difference in survival free of death or CV rehospitalization between patients with and without pericardial effusion (median survival, 226 vs 277 days; log‐rank P = 0.408). Furthermore, there was no statistically significant difference in all‐cause mortality between patients with and without pericardial effusion (log‐rank P = 0.385).
Figure 2.
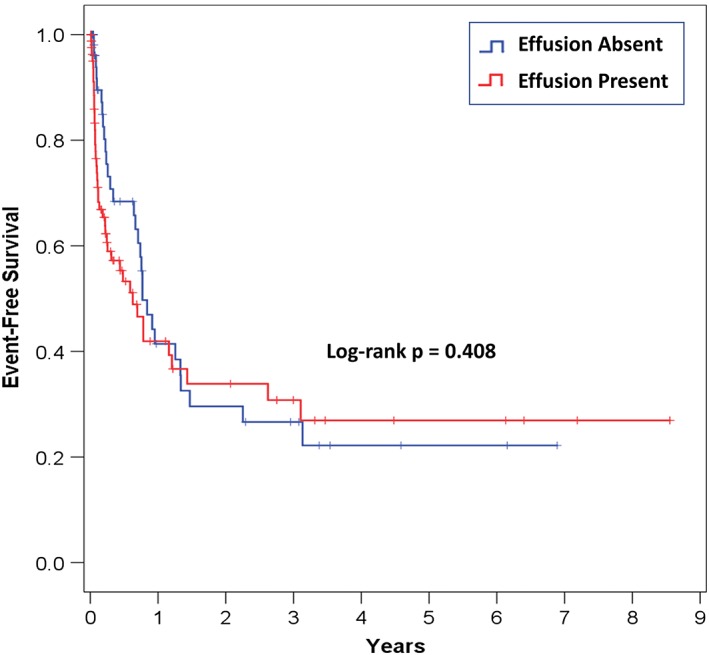
Survival free of death or cardiovascular rehospitalization according to pericardial effusion status. The figure depicts Kaplan–Meier survival plots
4. DISCUSSION
We investigated the predictors and prognostic implications of pericardial effusion in patients with late‐stage CKD. We identified HR, serum corrected calcium, and serum potassium as independent predictors of pericardial effusion in patients with late‐stage CKD. We also identified corrected serum calcium as a sole predictor of moderate to large effusion. We established HR >100 beats per min, potassium >5 mEq/L, and corrected calcium <8 mg/dL as highly specific predictors for any pericardial effusion, whereas a corrected calcium level of <8 mg/dL was suggested as a highly specific threshold for moderate to large pericardial effusion. We found no difference in survival free of death or CV rehospitalization between patients with and without pericardial effusion.
Since the 1990s, there has been a paucity of literature on pericardial effusion in patients with CKD. Our study provides an updated perspective with current management practices in a predominantly African American and Hispanic population. Consistent with previous investigations, the clinical suspicion for pericardial effusion in this population was generally low, as the effusion was incidentally discovered in 93% of the patients.1, 9 This finding suggests that pericardial effusion in CKD patients is underdiagnosed. Moreover, patients with pericardial effusion were younger than those without effusion, which is also consistent with previous data.1, 5, 9 Expectedly, physical examination and ECG findings suggestive of pericardial effusion were absent in the majority of patients, highlighting the diagnostic difficulty with this condition. Previous studies have not determined clinical or laboratory variables to aid in the prediction of pericardial effusion1, 5, 9, 10, 16; therefore, there is a need to establish such clinical or biochemical markers.17 In our study, we identified HR, serum potassium level, and corrected serum calcium level as independent predictors of pericardial effusion in patients with late‐stage CKD. We further determined that HR >100 bpm, potassium >5 mEq/L, and corrected calcium <8 mg/dL were highly specific, but insensitive, predictors of pericardial effusion in these patients. Moreover, we identified corrected calcium level as the sole independent predictor of moderate to large pericardial effusion, with serum corrected calcium <8 mg/dL as a highly specific threshold. Our findings are not surprising, as hypocalcemia and hyperkalemia reflect advanced renal dysfunction. What is somewhat surprising is that GFR, BUN level, and serum Cr level, established measures of kidney function, were not independently predictive of pericardial effusion, but this was in agreement with several previous studies.1, 5, 9, 10, 11 Thus, screening hospitalized patients with late‐stage CKD for tachycardia, hyperkalemia, and hypocalcemia can help identify patients with pericardial effusion. Prompt imaging with TTE would establish this important diagnosis.
Importantly, there was no significant difference in survival free of death or hospital readmission between patients with and without pericardial effusion. There was no difference in all‐cause mortality between the 2 groups either. These findings suggest that the clinical outcomes of this population are primarily determined by CKD and other comorbidities, rather than pericardial effusion.1 Prompt initiation or intensification of dialysis in patients with pericardial effusion may explain the absence of difference in mortality and morbidity. In a study of 534 patients, Mitiku et al. demonstrated the presence of small pericardial effusion was associated with an increase in mortality, after adjustment for demographics, medical history, and TTE findings.18 However, renal disease was the cause of the effusion in only 4.3% of these patients; thus, the results of the aforementioned study may not be applicable to CKD patients and are not inconsistent with our findings.18
4.1. Study limitations
The retrospective nested case–control design is an obvious limitation. Furthermore, the study was limited to hospitalized CKD patients, which limits its applicability to ambulatory patients. Moreover, the study is underpowered to detect a difference in mortality. Finally, because outcome data was solely collected from our institutional health records, it is likely that we missed outcome events registered at other institutions.
5. CONCLUSION
In patients with late‐stage CKD and ESRD, HR, serum potassium, and corrected serum calcium are predictive of pericardial effusion. Tachycardia (>100 bpm), hyperkalemia (>5 mEq/L), and hypocalcemia (corrected calcium <8 mg/dL) are highly specific for pericardial effusion. On the other hand, hypocalcemia (<8 mg/dL) was solely predictive of moderate to large pericardial effusion. Prompt TTE should be strongly considered in CKD patients with these clinical or biochemical derangements in order to diagnose and treat pericardial effusion. Furthermore, pericardial effusion does not seem to impact the outcomes of patients with late‐stage CKD. Additional studies are needed to validate our findings, particularly in ambulatory patients.
Conflicts of interest
The authors declare no potential conflicts of interest.
Supporting information
Supplemental Table 1 Baseline Characteristics of late‐stage CKD Patients, Not Yet on Dialysis
Ravi V, Iskander F, Saini A, Brecklin C, Doukky R. Clinical predictors and outcomes of patients with pericardial effusion in chronic kidney disease. Clin Cardiol. 2018;41:660–665. 10.1002/clc.22946
REFERENCES
- 1. Alpert MA, Ravenscraft MD. Pericardial involvement in end‐stage renal disease. Am J Med Sci. 2003;325:228–236. [DOI] [PubMed] [Google Scholar]
- 2. Wacker W, Merrill JP. Uremic pericarditis in acute and chronic renal failure. J Am Med Assoc. 1954;156:764–765. [DOI] [PubMed] [Google Scholar]
- 3. Bailey GL, Hampers CL, Hager EB, et al. Uremic pericarditis: clinical features and management. Circulation. 1968;38:582–591. [DOI] [PubMed] [Google Scholar]
- 4. Marini PV, Hull AR. Uremic pericarditis: a review of incidence and management. Kidney Int Suppl. 1975;2:163–166. [PubMed] [Google Scholar]
- 5. Rostand SG, Rutsky EA. Pericarditis in end‐stage renal disease. Cardiol Clin. 1990;8:701–707. [PubMed] [Google Scholar]
- 6. Dad T, Sarnak MJ. Pericarditis and pericardial effusions in end‐stage renal disease. Semin Dial. 2016;29:366–373. [DOI] [PubMed] [Google Scholar]
- 7. Frommer JP, Young JB, Ayus JC. Asymptomatic pericardial effusion in uremic patients: effect of long‐term dialysis. Nephron. 1985;39:296–301. [DOI] [PubMed] [Google Scholar]
- 8. Goldstein DH, Nagar C, Srivastava N, et al. Clinically silent pericardial effusions in patients on long‐term hemodialysis: pericardial effusions in hemodialysis. Chest. 1977;72:744–747. [DOI] [PubMed] [Google Scholar]
- 9. Rutsky EA, Rostand SG. Pericarditis in end‐stage renal disease: clinical characteristics and management. Semin Dial. 1989;2:25–30. [Google Scholar]
- 10. Falk RJ. Pericarditis in renal failure. Kidney Int. 1981;14:35–40. [Google Scholar]
- 11. Yoshida K, Shiina A, Asano Y, et al. Uremic pericardial effusion: detection and evaluation of uremic pericardial effusion by echocardiography. Clin Nephrol. 1980;13:260 – 268. [PubMed] [Google Scholar]
- 12. Levey AS, Stevens LA, Schmid CH, et al; CKD‐EPI (Chronic Kidney Disease Epidemiology Collaboration) . A new equation to estimate glomerular filtration rate [published correction appears in Ann Intern Med 2011;155:408]. Ann Intern Med. 2009;150:604–612. [DOI] [PMC free article] [PubMed] [Google Scholar]
- 13. O'Keefe JH Jr, Hammill SC, Freed MS, et al. The Complete Guide to ECGs. 3rd ed Sudbury, MA: Jones and Bartlett Publishers; 2009:539–540. [Google Scholar]
- 14. Eisenberg MJ, de Romeral LM, Heidenreich PA, et al. The diagnosis of pericardial effusion and cardiac tamponade by 12‐lead ECG: a technology assessment. Chest. 1996;110:318–324. [DOI] [PubMed] [Google Scholar]
- 15. Klein AL, Abbara S, Agler DA, et al. American Society of Echocardiography clinical recommendations for multimodality cardiovascular imaging of patients with pericardial disease: endorsed by the Society for Cardiovascular Magnetic Resonance and Society of Cardiovascular Computed Tomography. J Am Soc Echocardiogr. 2013;26:965.e15–1012.e15. [DOI] [PubMed] [Google Scholar]
- 16. Chang KW, Aisenberg GM. Pericardial effusion in patients with end‐stage renal disease. Tex Heart Inst J. 2015;42:596. [DOI] [PMC free article] [PubMed] [Google Scholar]
- 17. Nasir H, Kumar H, Hussain R, et al. Pericardial effusion as a cause of morbidity in patients on maintenance hemodialysis: is it preventable? J Pak Med Assoc. 2011;51:146–148. [PubMed] [Google Scholar]
- 18. Mitiku TY, Heidenreich PA. A small pericardial effusion is a marker of increased mortality. Am Heart J. 2011;161:152–157. [DOI] [PubMed] [Google Scholar]
Associated Data
This section collects any data citations, data availability statements, or supplementary materials included in this article.
Supplementary Materials
Supplemental Table 1 Baseline Characteristics of late‐stage CKD Patients, Not Yet on Dialysis