

Summary
Aim
α‐Synuclein (αSyn) is known as a small soluble protein abundantly expressed in neuronal cells. Although its physiological role is still unclear, the aggregation of αSyn has been recognized as responsible for some neurodegenerative disorders such as dementia with Lewy bodies (DLB). In most cases, intracellular abnormal aggregates are caused by protein‐coding mutations that alter primary structure and therefore increase propensity toward aggregation. However, no pathogenic alterations or polymorphisms in αSyn are found in DLB patients so far, suggesting genetic mutations may not play a major role in DLB pathogenesis. In contrast, emerging evidence reveals that amyloid β (Aβ) may contribute to aggregate formation and exacerbate neurotoxicity of αSyn. However, the underlying mechanism of action has remained unclear.
Methods
To investigate molecular pathways involved in Aβ‐mediated αSyn pathology, we established an in vitro model for inducible αSyn overexpression in SK‐N‐MC human neuronal cells.
Results
Our results demonstrated that Aβ treatment in αSyn‐overexpressed neuronal cells significantly increases αSyn intracellular aggregation and cytotoxicity. Moreover, Aβ also caused AMP‐activated protein kinase (AMPK) inhibition and impaired insulin sensitivity, which leads to significant downregulation of nuclear factor erythroid 2‐related factor 2 (NRF2)/heme oxygenase 1 (HO‐1) antioxidant signaling to elicit αSyn aggregation.
Conclusions
This raised the possibility that insulin resistance could be one of the causative factors of αSyn toxicity, and the strategies for insulin sensitization may have therapeutic potential for synucleinopathies including DLB.
Keywords: α‐synuclein, AMP‐activated protein kinase, amyloid β, dementia with Lewy bodies, insulin resistance
1. INTRODUCTION
Dementia with Lewy bodies (DLB) is a form of progressive dementia caused by degeneration of the neurons in the brain. Among adults aged 65 and over, it is widely considered as the common cause of dementia after Alzheimer's disease (AD) and vascular dementia.1 Clinically, the central features of DLB are composed by progressive decline in both motor and cognitive function, that share symptoms sometimes overlaps with AD or Parkinson's diseases (PD).2 At the molecular level, evidence has confirmed that α‐synuclein (αSyn), a small (14.4 kDa) protein abundantly expressed in neuronal cells, plays a critical role in the pathogenesis of synucleinopathies such as DLB and PD.3 Although the exact function of αSyn is not fully known, it is apparently essential for regulation of some neuronal function like synaptic plasticity and development.4 However, αSyn can also be triggered to generate some cytoplasmic aggregates named as Lewy bodies that are strongly associated with DLB and PD pathology. Actually, aggregated αSyn inclusions are found where neuron death occurs, indicating the aggregation is the main pathogenic cause of αSyn toxicity.5 Moreover, αSyn aggregates have been demonstrated to alter mitochondrial function and concomitant reactive oxygen species (ROS) intracellular accumulation,6 suggesting oxidative damage may also have an important pathogenic role in DLB.7 In most cases of neurodegenerative disorders, abnormal aggregates are generally favored by protein‐coding mutations that cause conformational changes and result in formation of the misfolded proteins. Although mutations in αSyn can account for a only small fraction of PD cases, no pathogenic alterations or polymorphisms in the SNCA gene (encoding αSyn) are found in DLB.8 In addition, overexpression of wild‐type αSyn has been demonstrated nontoxic to human neuronal cells, demonstrating that protein mutations do not play a major role in DLB.9
Past studies indicate that an overlap of pathologies is found in most individuals with DLB in more than half of AD cases.10 Similarly, the AD risk fact apolipoprotein E (ApoE) ε4 allele has also been recognized as the strongest genetic risk factor for DLB.11 These findings further delineate the pathophysiologic connection between AD and DLB. Furthermore, although the accumulation of amyloid β (Aβ) peptides in the brain is well‐known to play a driving mechanism of AD pathogenesis, Aβ plaques are also frequently present in DLB and linked to disease severity.12 In particular, Aβ (particularly Aβ1‐42) was shown to effectively promote wild‐type αSyn oligomerization in vitro,13 and some studies reported Aβ may also enhance αSyn aggregation and accelerate cognitive decline in animals.14 These observations indicate that Aβ may pathologically contribute to the development of DLB by promoting the aggregation of wild‐type αSyn. While there is a growing interest in the effects of Aβ in DLB pathogenesis, the exact role of Aβ in the DLB pathogenesis and αSyn aggregation is still not fully understood.
Recently, we have reported that exogenous Aβ can potentially trigger the aggregation and accumulation of wild‐type αSyn inside the neuronal cells.15 Using a transient αSyn‐overexpressed model, we demonstrated that Aβ inhibits autophagy thus causing intracellular accumulation of aggregated αSyn. Nevertheless, Aβ and αSyn synergistically repressed AMP‐activated protein kinase (AMPK) signaling, that ultimately results in oxidative stress‐mediated cell death. These results clearly indicated that Aβ indeed plays an important role in αSyn aggregation and neurotoxicity. However, the SNCA gene sequence is not introduced into most cell population during transient expression. Therefore, the effect of target gene overexpression is temporary and unstable, and the impact of transfection‐mediated toxicity may also interfere with the data interpretations. To overcome this problem, this study was undertaken to establish a stable in vitro model for inducible overexpression of αSyn in SK‐N‐MC human neuronal cells. Our results demonstrated that co‐treatment of Aβ in αSyn‐overexpressed cells significantly increases αSyn intracellular aggregation and cytotoxicity. This αSyn toxic effect is partly mediated by inactivation of AMPK, which impairs neuronal insulin signaling and leads to downregulation of nuclear factor erythroid 2‐related factor 2 (NRF2)/heme oxygenase 1 (HO‐1) antioxidant pathway. This suggests a simultaneous increase in αSyn and Aβ may have a synergistic effect for αSyn aggregation and neurotoxicity, which suppresses endogenous antioxidant pathway and causes an increase in oxidative stress due to the impairment of insulin signaling.
2. MATERIALS AND METHODS
2.1. Materials
Chemicals such as 3‐(4,5‐dimethylthiazol‐2‐yl)‐2,5‐diphenyltetrazolium bromide (MTT), 4′,6‐diamidino‐2‐phenylindole (DAPI), human recombinant insulin, and JC‐1 were purchased from Sigma (München, Germany). Antibodies against αSyn, AMPK, p‐AMPK, mTOR, p‐mTOR, cleaved caspase 3, and poly(ADP‐ribose) polymerase (PARP) were obtained from Santa Cruz Biotechnology (Santa Cruz, CA, USA), and antibodies against SOD1, FoxO3a, and Sirt1 were purchased from GeneTex (Irvine, CA, USA). Antibodies against Atg7 and Atg12‐Atg5 were purchased from Cell Signaling Technology (Danvers, MA, USA). The β‐actin and LC3 antibody was obtained from Novus Biologicals. (Littleton, CO, USA). We purchased α‐synuclein (SNCA, GeneID: 6622) coding sequence from transOMIC (Huntsville, AL, USA). Amyloid β (Aβ) 1‐42 was synthesized by LifeTein (Somerset, NJ, USA), and Aβ solution was prepared as described previously.16 Primary antibodies were used at a dilution of 1:1000 in 0.1% Tween‐20, and secondary antibodies were used at 1:5000 dilutions. All the chemicals were prepared by dissolving phosphate‐buffered saline solutions stored at −20°C until needed for use in experiments.
2.2. Vector construction and transfection
For αSyn overexpression studies, we used a GeneSwitch System (Invitrogen, Carlsbad, CA, USA) to generate SK‐N‐MC cells inducible expressing human wild‐type αSyn by manufacturer's protocols. Briefly, cells were seeded onto 100 mm diameter dishes (1 × 10⁶ cells/dish) in Minimal Eagle's medium (MEM, Gibco) containing 10% FBS 24 hours prior to transfection. Human αSyn coding sequence was amplified and cloned into an inducible expression plasmid pGene. For establishment of inducible expression condition, cells were firstly transfected with the regulatory plasmid pSwitch using Lipofectamine 2000 (Life Technologies), which continuously expresses a mifepristone (MFP)‐responsive GAL4 regulatory fusion protein (GAL4‐DBD/hPR‐LBD/p65‐AD). The transfected cells were selected in hygromycin for 4 weeks in getting stable clones. For αSyn overexpression, these cells were then transfected with a regulatory plasmid pSwitch, and selected in zoecin for additional 4 weeks in getting another stable clone. Finally, a GeneSwitch‐driven SK‐N‐MC cell line with doubly stable gene expression, pGene‐αSyn/pSwitch, was established. To stimulate αSyn overexpression, GeneSwitch‐driven cells were treated with MFP for 48 hours and then co‐treated with indicated conditions as described for each experimental design.
2.3. Cell culture and viability assay
Human neuroblastoma SK‐N‐MC cells were obtained from the American Type Culture Collection (Bethesda, MD, USA). Cells were maintained in minimal Eagle's medium (MEM, Gibco) supplemented with 10% fetal bovine serum, 100 units/mL penicillin, 100 μg/mL streptomycin, and 2 mmol/L L‐glutamine at 37°C and 5% CO2. For the cell viability tests, cells were seeded in a 24‐well plate overnight and then treated with the indicated conditions. After 24 hours, MTT was added to the medium following the manufacturer's instructions. Only viable cells can metabolize MTT into a purple formazan product, and the color density of which was quantified by a Jasco V‐700 spectrophotometer (JASCO, Tokyo, Japan) at 550 nm. The average population number of control cells was set to 100% to enable comparison of the survival rates of other tested cells.
2.4. Western blot analysis
Cells were harvested and homogenized with protein extraction lysis buffer. This buffer contained 50 mmol/L Tris‐HCl at pH 8.0, 5 mmol/L ethylenediaminetetraacetic acid, 150 mmol/L sodium chloride, 0.5% Nonidet P‐40, 0.5 mmol/L dithiothreitol, 1 mmol/L phenylmethylsulfonyl fluoride, 0.15 units/mL aprotinin, 5 μg/mL Leupeptin, 1 μg/mL pepstatin, and 1 mmol/L sodium fluoride. The solution was centrifuged at 12 000 g for 30 minutes at 4°C to remove debris, and the supernatant cell lysate was used for immunoblotting analysis. Equal amounts (50 μg) of total proteins from the cell lysate were resolved by SDS‐PAGE, transferred onto polyvinylidene difluoride membranes (Millipore, Bedford, MA, USA), and then probed with a primary antibody followed by another secondary antibody conjugated with horseradish peroxidase. Primary antibodies were used at a dilution of 1:1000 in 0.1% Tween‐20, and secondary antibodies were used at 1:5000 dilutions. The immunocomplexes were visualized using enhanced chemiluminescence kits (Millipore). The relative expression levels of proteins were quantified densitometrically using QuantityOne software (Bio‐Rad, Hercules, CA, USA), further normalized according to the housekeeping β‐actin protein and then compared with the normalized protein levels from control cells. The control protein level was then set to 100% for further comparison.
2.5. Flow cytometric analysis
At the end of the experiments, cells were harvested by trypsinization. After centrifugation and washed twice, resuspended the cell pellet in PBS and fixed in 70% chilled ethanol. Cells were stained with propidium iodine (PI), and subsequently analyzed for DNA content using a NovoCyte flow cytometer (NovoCyte 2000, ACEA Biosciences, San Diego, CA, USA), and data analysis was performed by NovoExpress Software. The number of apoptotic cells was quantified by measuring the sub‐G1 population.
2.6. Immunocytochemistry and acridine orange staining
After treatment, cells were fixed with 2% buffered paraformaldehyde, permeabilized in 0.25% Triton X‐100 (Sigma‐Aldrich) for 5 minutes at 4°C, and then incubated with anti‐αSyn primary antibody. The slides were then incubated with an FITC labeled second antibody (Santa Cruz) depending on the origin of the primary antibody. For acridine orange staining, cells were stained with 1 μg/mL acridine orange for 15 minutes and then washed with MEM medium. Then, images were taken using the fluorescence microscope (DP80/BX53, Olympus) and cellSense, V 1.9 digital imaging software.
2.7. Microscopic observation and nucleus morphology
Changes in cell nucleus morphology, characteristic of apoptosis, were examined in cells grown on coverslips, using a microscope. The cells were fixed in 4% paraformaldehyde after 24 hours of treatment with the indicated compounds. For phase‐contrast inverted microscopy, images of cells were captured with no specific staining procedure. For nucleus morphology microscopy, cells were fixed in ice‐cold methanol, incubated for 15 minutes at room temperature with 1 ng/mL of 4′,6‐diamidino‐2‐phenylindole (DAPI) stain, and observed under a fluorescence microscope (DP80/BX53, Olympus). Apoptosis was quantified by averaging cell counts in five random 400 x fields. Values were expressed as the percentage of apoptotic cells relative to total number of cells.
2.8. Analysis of mitochondrial membrane potential
The vital mitochondrial cationic dye JC‐1 was used as a tool for investigating mitochondrial function which exhibits potential‐dependent accumulation in mitochondria. At normal cells, JC‐1 continues to exist as a monomer and produces a red fluorescence. During the induction of Aβ cytotoxicity, the mitochondrial transmembrane potential collapse and JC‐1 forms aggregates which produces a red fluorescence. After treatment for indicated conditions, cells were treated in fresh media containing 1 μmol/L JC‐1 and incubated at 37°C for 30 minutes in an incubator. After that staining medium was discarded, washed, and then the cell imaging was performed using an inverted fluorescence microscope (DP72/CKX41, Olympus).
2.9. Statistical analysis
All data are presented as means ± standard error of the means (SEM). Statistical analysis of data was performed using analysis of variance (ANOVA), followed by Dunnett's post hoc test for multiple comparisons with SPSS statistical software (SPSS, Inc., Chicago, IL, USA). Differences were considered statistically significant at *P < 0.05 and **P < 0.01.
3. RESULTS
3.1. Establishing an inducible in vitro model for αSyn overexpression in SK‐N‐MC neuronal cells
To generate a reliable conditional gene expression in vitro model, we first used the GeneSwitch System to establish an inducible expression system for αSyn overexpression in SK‐N‐MC neuronal cells.17 As shown in Figure 1A, the GeneSwitch system is based on the binding of a mifepristone (MFP)‐responsive GAL4 regulatory fusion protein to GAL4 upstream activating sequences (UAS) in the promoter controlling expression of SCNA gene. By co‐transfection of two vectors, a regulatory plasmid pSwitch and an inducible expression plasmid pGene‐αSyn, cells can be stimulated with MFP to induce αSyn overexpression. To test the induction efficiency for αSyn inducible overexpression, Western blot analysis was conducted to detect the expression levels of αSyn at various concentrations of MFP for 24 and 48 hours. As shown in Figure 1B, incubation of GeneSwitch‐driven SK‐N‐MC cells with MFP can function to induce αSyn protein overexpression stimulated by increasing concentrations of inducer MFP at 24 hours, and this overexpression was further upregulated at 48 hours. In addition, the highest enhancement of αSyn expression was about 6‐fold higher than that of the control at 10 μmol/L of MFP at 48 hours. Therefore, all subsequent experiments were carried out using this induction time and MFP concentration to ensure the overexpression of αSyn.
Figure 1.

Establishing an inducible expression system for αSyn overexpression in SK‐N‐MC cells. A, Scheme of GeneSwitch System for αSyn inducible overexpression. Incubation of GeneSwitch‐driven cells with mifepristone (MFP) can induce αSyn overexpression. B, Intracellular levels of αSyn were analyzed by Western blotting. At 24 h postinduction by MFP, there was a slight increase of αSyn levels in a dose‐dependent manner, and this overexpression was further upregulated at 48 h. The highest enhancement of αSyn overexpression is about 6‐fold higher than that of the control at 10 μmol/L of MFP. All Western blotting data were performed in three independent experiments, and the densitometrical values are presented as mean ± SEM
3.2. Aβ exacerbates αSyn‐mediated cytotoxicity in αSyn‐overexpressed cells
As reported previously, increased expression of wild‐type αSyn seems nontoxic and not to affect neuronal cell response, suggesting some other causal factors such as Aβ may play a role in αSyn‐mediated neurotoxicity. To verify this speculation, GeneSwitch‐driven SK‐N‐MC cells were incubated without or with MFP for 48 hours to control the overexpression of αSyn, and then, 2.5 μmol/L of Aβ1‐42 peptides was added to the culture medium for additional 24 hours. As shown in Figure 2A, the phase contrast images revealed that overexpression of wild‐type αSyn does not did not show markedly cytotoxicity or morphological changes in cells, indicating αSyn alone is not sufficient to cell death. Aβ treatment, on the other hand, resulted in a moderate reduction of cell viability of non‐MFP‐induced cells. However, this Aβ‐induced cytotoxic effect was further deteriorated by the overexpression of αSyn. These results were in accordance with the findings obtained from MTT assay, which indicates overexpressed αSyn significantly enhances Aβ‐induced cell viability loss from 52 ± 9.6% to 26 ± 5.7% (Figure 2B). To precisely determine which mode of cell death is induced by Aβ in αSyn‐overexpressed cells, we measured the sub‐G1 population by flow cytometry. As shown in Figure 2C, results revealed that both αSyn‐overexpressed cells and control cells show a low sub‐G1fraction without Aβ treatment. Conversely, Aβ significantly increased the sub‐G1fraction of αSyn‐overexpressed cells compared to noninduction groups, indicating apoptosis may be a major mode of cell death. Further studies in two apoptotic markers cleaved‐caspase 3 and cleaved‐PARP confirmed that Aβ‐induced apoptosis was synergistically elevated in αSyn‐overexpressed cells (Figure 2D). Taken together, these findings demonstrated that Aβ synergistically exacerbates overexpressed αSyn‐induced apoptosis in SK‐N‐MC neuronal cells.
Figure 2.

Treatment of Aβ exacerbates αSyn‐mediated neuronal apoptosis. A, MFP‐induced αSyn‐overexpressed cells showed no morphological evidence of cytotoxicity or apoptosis compared to control cells. However, 2.5 μmol/L Aβ markedly induced cell death, and further exacerbated cytotoxicity in αSyn‐overexpressed cells. B, MTT assays indicated Aβ induces cell death by 48% after 48‐h incubation, and αSyn overexpression exacerbated Aβ‐stimulated cytotoxicity up to 74% of cell death. C, Flow cytometry data analysis using propidium iodide DNA staining demonstrated that Aβ significantly increased the sub‐G1fraction of αSyn‐overexpressed cells compared to noninduction groups. D, Western blot results showed that Aβ enhances caspase 3 and PARP cleavages in αSyn‐overexpressed cells. All data were performed in three independent experiments, and values are presented as mean ± SEM. Significant difference is determined using the multiple comparisons of Dunnett's post hoc test for *P < 0.05 and **P < 0.01. N. S., no significant difference. Scale bar represents 100 μm
3.3. Aβ exacerbates αSyn intracellular deposits and suppresses AMPK signaling in αSyn‐overexpressed cells
It is generally accepted that the formation of αSyn intracellular aggregates is the major pathological hallmark of DLB. To investigate whether exogenous Aβ treatment stimulates αSyn aggregate formation in αSyn‐overexpressed cells, we performed fluorescent immunostaining with a specific antibody against αSyn. As shown in Figure 3A, without Aβ treatment, no aggregates were observed in cells regardless of αSyn expression levels. On the contrary, only very few aggregates were observed in cells overexpressing αSyn only, but these aggregates were markedly increased in αSyn‐overexpressed cells co‐incubated with Aβ. This implicates Aβ may contribute to the process of intracellular aggregation or accumulation of αSyn. Some studies have also proposed that impaired autophagy function can lead to the accumulation of abnormal aggregate‐prone proteins inside the cell.18 To determine whether Aβ could interfere with autophagy, immunoblotting analysis was performed to detect autophagic activity by evaluating some autophagy‐associated markers such as LC3, Atg7, and Atg12‐Atg5 conjugate. As shown in Figure 3B, no obvious LC3‐II inhibition was observed in cells without Aβ treatment. Conversely, LC3‐II levels dropped slightly in control cells by Aβ treatment, and this LC3‐II inhibition was further enhanced by overexpression of αSyn. The same, other autophagy‐related markers Atg7 and Atg12‐Atg5 conjugate, also displayed a similar pattern of reduction in LC3‐II levels. It has been reported that AMPK can induce autophagy via inhibition of mTOR, and the inhibition of AMPK by Aβ has also been observed in neuronal cells,19 suggesting the suppression of AMPK signaling may result in decreased autophagic clearance.20 As Figure 3C shown, these observations were confirmed by our results that Aβ causes markedly activation of mTOR Ser2448 phosphorylation, which possibly as a result of the reduction in phosphorylation of AMPK at Thr172. These results were also confirmed by acridine orange staining that overexpressing αSyn only did not decrease the number of orange fluorescence particles (as markers of autophagosomes) However, Aβ causes markedly decrease the orange fluorescence particles in αSyn‐overexpressed cells (Figure 3D). Altogether, our data demonstrated Aβ‐suppressed AMPK signaling may cause upregulation of mTOR activity, which leads to reduced clearance of αSyn aggregates in αSyn‐overexpressed cells.
Figure 3.
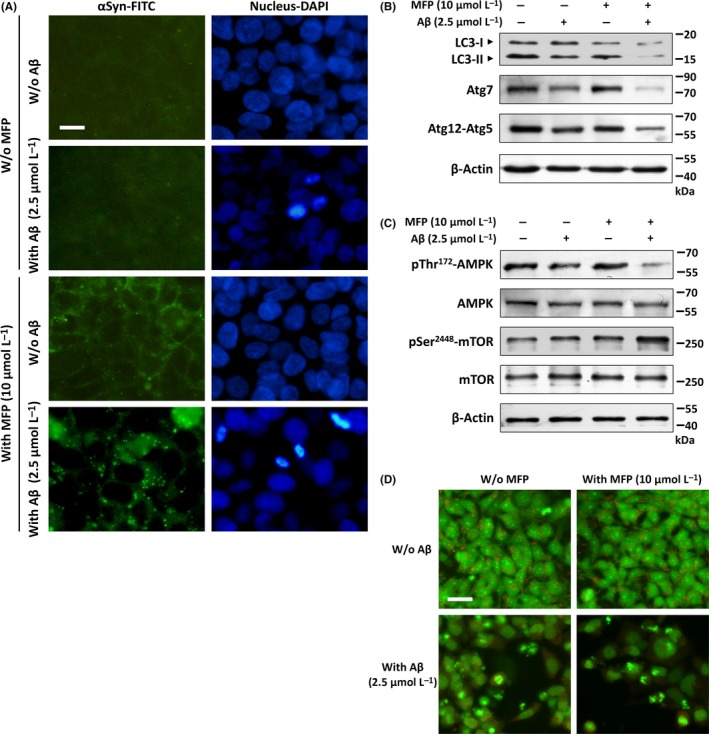
Aβ activates mTOR by inhibiting AMPK and increases αSyn aggregates in αSyn‐overexpressed cells. A, Fluorescent immunostaining images demonstrated that few αSyn aggregates were observed in αSyn‐overexpressed only cells. However, these aggregates were markedly increased by co‐treating with Aβ for 24 h. B, Western blots showed the protein levels of some autophagy‐associated markers including LC3‐II, Atg7, and Atg12‐Atg5 conjugate. Aβ treatment obviously inhibited the expression of these autophagy‐related proteins suggesting reduced autophagy in these cells. C, Effects of Aβ on the protein levels of p‐AMPK and p‐mTOR. The result showed that Aβ increases Ser2448 phosphorylation of mTOR and inhibits Thr172 phosphorylation of AMPK in αSyn‐overexpressed cells. D, Formation of acridine orange‐accumulating acidic vacuoles (orange‐red fluorescence) is markedly reduced by Aβ treatment. Scale bar represents 10 μm
3.4. Reduced neuronal insulin signaling activity is observed in αSyn‐overexpressed neuronal cells co‐treated with Aβ
Our previous research has shown that Aβ can trigger neuronal insulin resistance, which may be functionally linked to the neurodegenerative processes.21 To determine whether the Aβ‐enhanced αSyn neurotoxicity is associated with impaired neuronal insulin signaling, we performed Western blotting to detect the level of IRS‐1 phosphorylation in Ser307, a typical marker indicates the severity of insulin resistance. As shown in Figure 4A, the serine‐phosphorylated IRS‐1 exhibited reduced expression levels in cells without Aβ treatment. On the contrary, Aβ caused an increased expression of serine‐phosphorylated IRS‐1, and this increase was further upregulated by overexpression of αSyn, suggesting neuronal insulin signaling is impaired by Aβ. To elucidate the role of insulin signaling in Aβ and αSyn‐induced cell death, MTT assays were performed to assess cell death in the presence or absence of exogenous insulin. As shown in Figure 4B, Aβ significantly enhanced αSyn‐induced cell death without adding insulin in culture medium. Conversely, this cell death was attenuated by exogenous supplement of 0.1 μmol/L or 1 μmol/L insulin in a dose‐dependent manner, demonstrating that upregulation of insulin signaling can protect against Aβ‐induced cell death in αSyn‐overexpressed cells. These results were also confirmed by DAPI staining that treatment with insulin significantly reduced nuclei fragmentation as shown in Figure 4C, indicating Aβ‐caused apoptotic events were attenuated by co‐treatment of insulin in αSyn‐overexpressed cells.
Figure 4.

Aβ impairs neuronal insulin signaling in αSyn‐overexpressed cells. A, Immunoblotting revealed that treatment with Aβ for 24 h upregulates the phosphorylation of Ser307‐IRS‐1, and this increase was further upregulated by overexpression of αSyn. B, MTT assay revealed that without insulin Aβ significantly enhanced αSyn‐induced cell death; however, this cell death was attenuated by exogenous supplement of insulin in a dose‐dependent manner. C, DAPI staining yielded similar results, thereby indicating that treatment with insulin significantly reduced Aβ‐induced nuclei fragmentation in αSyn‐overexpressed cells. All data were performed in three independent experiments, and values are presented as mean ± SEM. Significant difference is determined using the multiple comparisons of Dunnett's post hoc test for *P < 0.05 and **P < 0.01. Scale bar represents 20 μm
3.5. Insulin alleviates Aβ‐induced αSyn aggregation and oxidative stress in αSyn‐overexpressed cells
As mentioned earlier, autophagy plays a pivotal role in the clearance of intracellular misfolded protein such as αSyn aggregates. Hence, to identify the molecular basis of insulin‐mediated neuroprotection, Western blot analysis of autophagy‐related proteins was performed as shown in Figure 5A. Unexpectedly, the levels of LC3‐II were shown to increase slightly in αSyn‐overexpressed cells co‐treated with Aβ and insulin. Similarly, the addition of insulin caused only moderate effects on increased phosphorylation at Thr172 of AMPK. These results implied that insulin‐mediated neuroprotection in αSyn‐overexpressed cells would be unlikely through the induction of autophagy. As the aggregated αSyn is thought to play a central role in DLB pathogenesis, we therefore investigated whether Aβ‐induced αSyn aggregation can be attenuated by insulin. As shown in Figure 5B, our results from immunofluorescence analysis revealed that compared to the Aβ+MFP group, the supplement of exogenous insulin significantly reduced the number of fluorescent spots, indicating insulin treatment effectively suppresses Aβ‐induced αSyn aggregation in αSyn‐overexpressed cells. It has been reported that oxidative stress can stimulate αSyn synuclein oligomerization via ROS increase‐driven protein post‐translational modifications.22 To elucidate whether insulin protects against Aβ‐induced αSyn aggregation is mediated through reduction of oxidative stress, we performed Western blot analysis to measure the levels of some antioxidant signaling‐related proteins. As shown in Figure 5C, the levels of Nrf2 and of its target gene HO‐1 were markedly reduced by Aβ in αSyn‐overexpressed cells. However, adding insulin to Aβ‐treated cells resulted in upregulation of this antioxidant pathway significantly. The result of Nrf2/HO‐1 downstream protein expression also provided further evidence that the levels of ROS detoxifying enzyme SOD1 were effectively restored by insulin treatment. Finally, we performed JC‐1 staining to assess the mitochondrial membrane potential to further examine the details of insulin‐mediated neuroprotection. As shown in Figure 5D, exposure of αSyn‐overexpressed cells to Aβ resulted in an increase in green fluorescence, indicating a great loss of mitochondrial membrane potential. However, co‐treatment with insulin reduced the effects of Aβ on mitochondrial membrane potential significantly, suggesting that insulin preserves mitochondrial function against Aβ‐induced αSyn toxicity. Taken together, these results showed that Aβ‐enhanced αSyn neurotoxicity can be related to impaired neuronal insulin signaling which appears to be a deleterious factor leading to increased propensity of αSyn aggregation.
Figure 5.

Treatment of insulin suppresses Aβ‐induced αSyn aggregation and oxidative stress. A, Western blotting results revealed that treatment with insulin causes limited effects on increased AMPK Thr172 phosphorylation and LC3‐II levels, suggesting that impaired autophagy activity cannot be fully restored by insulin. B, Immunofluorescence analysis showed that αSyn aggregates were markedly decreased by treating with insulin in Aβ‐treated αSyn‐overexpressed cells. Scale bar represents 10 μm. C, Some antioxidant signaling‐related proteins including Nrf2, HO‐1, and SOD1 were analyzed by Western blotting, and inhibitory effects of this antioxidant pathway were effectively restored by insulin treatment. D, JC‐1 immunofluorescent staining. Green fluorescence represents Aβ‐induced mitochondrial dysfunction in αSyn‐overexpressed cells by dissipation of mitochondrial membrane potential. Red fluorescence indicates that co‐treatment with insulin preserves an intact mitochondrial membrane potential. Scale bar represents 20 μm
4. DISCUSSION
At present, there is still no cure for DLB, but symptoms sometimes can be alleviated with medications used for either AD or PD, indicating these diseases may have some shared pathogenic mechanisms. Although the common mechanism underlying these neurodegenerations is not fully understood, some factors have been associated with a higher risk of developing dementia. Particularly, impaired insulin signaling is associated with decreased cognitive ability and the development of dementia.23 It is conceivable that AD can be mediated by defective insulin signaling in the brain.24 In fact, the proximal cause of brain insulin resistance appears to be the deposition of Aβ.25 Similarly, our recent finding also indicated that Aβ can directly cause insulin signaling blockade in neuronal cells and thus contributed to the enhanced oxidative stress leading to neuronal damage.26 All these findings indicate that Aβ may play a central role in inhibition of insulin signaling in αSyn‐overexpressed cells. Interestingly, a previous study indicates that the presence of insulin resistance in patients with type 2 diabetes displays approximately a 40% increased risk of developing PD.27 In addition, insulin resistance has been recognized to be associated with increased risk and more severe symptoms of PD dementia.28 This raises the possibility that Aβ‐caused insulin resistance may enhance the development of αSyn aggregation and its neurotoxicity, which has been recognized as a key mechanism involved in PD and DLB pathogenesis.29 Given these growing links between insulin resistance and αSyn pathology, it is not surprising that Aβ may exacerbate αSyn toxicity by disrupting neuronal insulin signaling in αSyn‐overexpressed cells and therefore suggests that the insulin signaling pathway may be a novel therapeutic target for disease treatment.
Our results also demonstrated that Aβ may suppress Nrf2/HO‐1 endogenous antioxidant pathways via inhibition of insulin signaling. Actually, Nrf2 has been found to mediate the expression of a number of antioxidant genes, suggesting increased Nrf2 signaling may be able to suppress oxidative stress in brain tissues.30 Notably, an insulin‐sensitizing agent metformin which likely acts directly through activation of AMPK was reported displaying their neuroprotective potential by increasing the level of Nrf2 and HO‐1 in the brain.31 In parallel with this finding, our previous study also demonstrated that restoration of Aβ‐induced neuronal insulin resistance can increase Nrf2/HO‐1 signaling and subsequently elevate antioxidant enzyme expression.26 All these supported that attenuated AMPK activation and impaired insulin signaling may act as a detecting factor representing an underlying mechanism of αSyn pathology. On the other hand, evidence suggesting that oxidative stress elicited by mitochondrial dysfunction may be involved in the process of αSyn‐induced neurotoxicity.32 Particularly, in vitro studies have shown that increasing levels of oxidative stress can lead to αSyn aggregation.33 In fact, oxidative stress‐induced posttranslational modifications have been demonstrated to play a major role in αSyn oligomerization and toxicity.34 Moreover, ROS generated by dysfunctional mitochondria appears to accelerate αSyn phosphorylation at Ser129,35 which has been identified as a pathological prognostic marker for synucleinopathy.36 Based on these findings, we conclude that Aβ‐suppressed insulin signaling may cause inhibition of Nrf2/HO‐1 and result in oxidative damage to αSyn, which modulates post‐translational modifications and finally affect protein aggregation. However, the precise mechanism of action for αSyn aggregation remains to be fully elucidated.
Recently, Bassil et al reported that the use of glucagon‐like peptide‐1 analogue exendin‐4, an antidiabetic drug improving insulin sensitivity and action, has positive effects on αSyn pathologies of a multiple system atrophy animal model.37 In accordance with our results, this indicates the restoration of neuronal insulin sensitivity can be a potential therapeutic target for treatment of these Lewy body diseases. These imply that antidiabetic drug acts against insulin resistance may provide some symptom relief for neurodegenerative synucleinopathy including DLB, as there are no effective treatments for these diseases. To our knowledge, this is the first study to shed light on the role and molecular mechanism of insulin signaling on αSyn neurotoxicity. In summary, the current study demonstrated that overexpression of αSyn alone shows nontoxic to SK‐N‐MC human neuronal cells. However, co‐treatment of Aβ in αSyn‐overexpressed cells significantly increased αSyn intracellular aggregation and neurotoxicity. Our results also raised the possibility that Aβ‐induced neuronal insulin resistance could indeed be one of the causative factors of αSyn aggregation, due to suppressed Nrf2/HO‐1 antioxidative signaling and mitochondrial dysfunction. However, whether the use of insulin‐sensitizing agents for treatment or prevention of αSyn‐related neurodegeneration requires further investigation.
CONFLICT OF INTEREST
The authors declare no conflict of interest.
ACKNOWLEDGMENTS
This work was supported by grants from the Chung Shan Medical University Hospital (CSH‐2016‐C‐002), and from the Ministry of Science and Technology of Taiwan (MOST 105‐2320‐B‐040‐024, MOST 104‐2314‐B‐040‐007‐MY2, and MOST 106‐2320‐B‐040‐021‐MY3).
Chang C‐C, Li H‐H, Chang Y‐T, et al. Aβ exacerbates α‐synuclein‐induced neurotoxicity through impaired insulin signaling in α‐synuclein‐overexpressed human SK‐N‐MC neuronal cells. CNS Neurosci Ther. 2018;24:47–57. 10.1111/cns.12772
The first two authors contributed equally to this work.
Contributor Information
Chih‐Li Lin, Email: dll@csmu.edu.tw.
Te‐Jen Lai, Email: ltj3123@ms2.hinet.net.
REFERENCES
- 1. Galasko D. Lewy body disorders. Neurol Clin. 2017;35:325‐338. [DOI] [PMC free article] [PubMed] [Google Scholar]
- 2. Mueller C, Ballard C, Corbett A, Aarsland D. The prognosis of dementia with Lewy bodies. Lancet Neurol. 2017;16:390‐398. [DOI] [PubMed] [Google Scholar]
- 3. Kim WS, Kagedal K, Halliday GM. Alpha‐synuclein biology in Lewy body diseases. Alzheimers Res Ther. 2014;6:73. [DOI] [PMC free article] [PubMed] [Google Scholar]
- 4. Bendor JT, Logan TP, Edwards RH. The function of alpha‐synuclein. Neuron. 2013;79:1044‐1066. [DOI] [PMC free article] [PubMed] [Google Scholar]
- 5. Valdinocci D, Radford RA, Siow SM, Chung RS, Pountney DL. Potential Modes of Intercellular alpha‐Synuclein Transmission. Int J Mol Sci. 2017;18:E469. [DOI] [PMC free article] [PubMed] [Google Scholar]
- 6. Melo TQ, van Zomeren KC, Ferrari MF, Boddeke HW, Copray JC. Impairment of mitochondria dynamics by human A53T alpha‐synuclein and rescue by NAP (davunetide) in a cell model for Parkinson's disease. Exp Brain Res. 2017;235:731‐742. [DOI] [PMC free article] [PubMed] [Google Scholar]
- 7. Spano M, Signorelli M, Vitaliani R, Aguglia E, Giometto B. The possible involvement of mitochondrial dysfunctions in Lewy body dementia: a systematic review. Funct Neurol. 2015;30:151‐158. [DOI] [PMC free article] [PubMed] [Google Scholar]
- 8. Tagliafierro L, Chiba‐Falek O. Up‐regulation of SNCA gene expression: implications to synucleinopathies. Neurogenetics. 2016;17:145‐157. [DOI] [PMC free article] [PubMed] [Google Scholar]
- 9. Hong DP, Xiong W, Chang JY, Jiang C. The role of the C‐terminus of human alpha‐synuclein: intra‐disulfide bonds between the C‐terminus and other regions stabilize non‐fibrillar monomeric isomers. FEBS Lett. 2011;585:561‐566. [DOI] [PubMed] [Google Scholar]
- 10. Bachhuber T, Katzmarski N, McCarter JF, et al. Inhibition of amyloid‐beta plaque formation by alpha‐synuclein. Nat Med. 2015;21:802‐807. [DOI] [PubMed] [Google Scholar]
- 11. Tsuang D, Leverenz JB, Lopez OL, et al. APOE epsilon4 increases risk for dementia in pure synucleinopathies. JAMA Neurol. 2013;70:223‐228. [DOI] [PMC free article] [PubMed] [Google Scholar]
- 12. Armstrong RA, Cairns NJ. Size frequency distribution of the beta‐amyloid (abeta) deposits in dementia with Lewy bodies with associated Alzheimer's disease pathology. Neurol Sci. 2009;30:471‐477. [DOI] [PMC free article] [PubMed] [Google Scholar]
- 13. Masliah E, Rockenstein E, Veinbergs I, et al. beta‐amyloid peptides enhance alpha‐synuclein accumulation and neuronal deficits in a transgenic mouse model linking Alzheimer's disease and Parkinson's disease. Proc Natl Acad Sci U S A. 2001;98:12245‐12250. [DOI] [PMC free article] [PubMed] [Google Scholar]
- 14. Marsh SE, Blurton‐Jones M. Examining the mechanisms that link beta‐amyloid and alpha‐synuclein pathologies. Alzheimers Res Ther. 2012;4:11. [DOI] [PMC free article] [PubMed] [Google Scholar]
- 15. Lin CL, Cheng YS, Li HH, et al. Amyloid‐beta suppresses AMP‐activated protein kinase (AMPK) signaling and contributes to alpha‐synuclein‐induced cytotoxicity. Exp Neurol. 2016;275:84‐98. [DOI] [PubMed] [Google Scholar]
- 16. Cheng‐Chung Wei J, Huang HC, Chen WJ, Huang CN, Peng CH, Lin CL. Epigallocatechin gallate attenuates amyloid beta‐induced inflammation and neurotoxicity in EOC 13.31 microglia. Eur J Pharmacol. 2016;770:16‐24. [DOI] [PubMed] [Google Scholar]
- 17. Sofola‐Adesakin O, Khericha M, Snoeren I, Tsuda L, Partridge L. pGluAbeta increases accumulation of Abeta in vivo and exacerbates its toxicity. Acta Neuropathol Commun. 2016;4:109. [DOI] [PMC free article] [PubMed] [Google Scholar]
- 18. Tanik SA, Schultheiss CE, Volpicelli‐Daley LA, Brunden KR, Lee VM. Lewy body‐like alpha‐synuclein aggregates resist degradation and impair macroautophagy. J Biol Chem. 2013;288:15194‐15210. [DOI] [PMC free article] [PubMed] [Google Scholar]
- 19. Lin CL, Huang WN, Li HH, et al. Hydrogen‐rich water attenuates amyloid beta‐induced cytotoxicity through upregulation of Sirt1‐FoxO3a by stimulation of AMP‐activated protein kinase in SK‐N‐MC cells. Chem Biol Interact. 2015;240:12‐21. [DOI] [PubMed] [Google Scholar]
- 20. Ghavami S, Shojaei S, Yeganeh B, et al. Autophagy and apoptosis dysfunction in neurodegenerative disorders. Prog Neurobiol. 2014;112:24‐49. [DOI] [PubMed] [Google Scholar]
- 21. Li HH, Lin SL, Huang CN, et al. miR‐302 Attenuates Amyloid‐beta‐Induced Neurotoxicity through Activation of Akt Signaling. J Alzheimers Dis. 2016;50:1083‐1098. [DOI] [PubMed] [Google Scholar]
- 22. Esteves AR, Arduino DM, Swerdlow RH, Oliveira CR, Cardoso SM. Oxidative stress involvement in alpha‐synuclein oligomerization in Parkinson's disease cybrids. Antioxid Redox Signal. 2009;11:439‐448. [DOI] [PubMed] [Google Scholar]
- 23. Kim B, Feldman EL. Insulin resistance as a key link for the increased risk of cognitive impairment in the metabolic syndrome. Exp Mol Med. 2015;47:e149. [DOI] [PMC free article] [PubMed] [Google Scholar]
- 24. Diehl T, Mullins R, Kapogiannis D. Insulin resistance in Alzheimer's disease. Transl Res. 2017;183:26‐40. [DOI] [PMC free article] [PubMed] [Google Scholar]
- 25. Talbot K. Brain insulin resistance in Alzheimer's disease and its potential treatment with GLP‐1 analogs. Neurodegener Dis Manag. 2014;4:31‐40. [DOI] [PMC free article] [PubMed] [Google Scholar]
- 26. Kornelius E, Lin CL, Chang HH, et al. DPP‐4 Inhibitor Linagliptin Attenuates Abeta‐induced Cytotoxicity through Activation of AMPK in Neuronal Cells. CNS Neurosci Ther. 2015;21:549‐557. [DOI] [PMC free article] [PubMed] [Google Scholar]
- 27. Schernhammer E, Hansen J, Rugbjerg K, Wermuth L, Ritz B. Diabetes and the risk of developing Parkinson's disease in Denmark. Diabetes Care. 2011;34:1102‐1108. [DOI] [PMC free article] [PubMed] [Google Scholar]
- 28. Bosco D, Plastino M, Cristiano D, et al. Dementia is associated with insulin resistance in patients with Parkinson's disease. J Neurol Sci. 2012;315:39‐43. [DOI] [PubMed] [Google Scholar]
- 29. Athauda D, Foltynie T. Insulin resistance and Parkinson's disease: a new target for disease modification? Prog Neurobiol. 2016;145–146:98‐120. [DOI] [PubMed] [Google Scholar]
- 30. Yagishita Y, Uruno A, Fukutomi T, et al. Nrf2 improves Leptin and insulin resistance provoked by hypothalamic oxidative stress. Cell Rep. 2017;18:2030‐2044. [DOI] [PubMed] [Google Scholar]
- 31. Ashabi G, Khalaj L, Khodagholi F, Goudarzvand M, Sarkaki A. Pre‐treatment with metformin activates Nrf2 antioxidant pathways and inhibits inflammatory responses through induction of AMPK after transient global cerebral ischemia. Metab Brain Dis. 2015;30:747‐754. [DOI] [PubMed] [Google Scholar]
- 32. Ganguly G, Chakrabarti S, Chatterjee U, Saso L. Proteinopathy, oxidative stress and mitochondrial dysfunction: cross talk in Alzheimer's disease and Parkinson's disease. Drug Des Devel Ther. 2017;11:797‐810. [DOI] [PMC free article] [PubMed] [Google Scholar]
- 33. Hsu LJ, Sagara Y, Arroyo A, et al. alpha‐synuclein promotes mitochondrial deficit and oxidative stress. Am J Pathol. 2000;157:401‐410. [DOI] [PMC free article] [PubMed] [Google Scholar]
- 34. Xiang W, Schlachetzki JC, Helling S, et al. Oxidative stress‐induced posttranslational modifications of alpha‐synuclein: specific modification of alpha‐synuclein by 4‐hydroxy‐2‐nonenal increases dopaminergic toxicity. Mol Cell Neurosci. 2013;54:71‐83. [DOI] [PubMed] [Google Scholar]
- 35. Kim T, Vemuganti R. Mechanisms of Parkinson's disease‐related proteins in mediating secondary brain damage after cerebral ischemia. J Cereb Blood Flow Metab. 2017;37:1910‐1926. [DOI] [PMC free article] [PubMed] [Google Scholar]
- 36. Sato H, Kato T, Arawaka S. The role of Ser129 phosphorylation of alpha‐synuclein in neurodegeneration of Parkinson's disease: a review of in vivo models. Rev Neurosci. 2013;24:115‐123. [DOI] [PubMed] [Google Scholar]
- 37. Bassil F, Canron MH, Vital A, et al. Insulin resistance and exendin‐4 treatment for multiple system atrophy. Brain. 2017;140:1420‐1436. [DOI] [PMC free article] [PubMed] [Google Scholar]