Summary
Aims
To investigate the roles of Lats1/p‐YAP1 pathway in TBI‐induced neuronal apoptosis and neurological deficits in rats.
Results
We found that Lats1 and YAP1 were expressed in cerebral cortex neurons of Sprague‐Dawley rats, and the phosphorylation levels of Lats1 and YAP1 in injured regions were significantly increased after TBI. Furthermore, inhibition of Lats1 not only decreased the level of p‐YAP1, but also attenuated neuronal apoptosis and neurological impairment.
Conclusions
Our work demonstrates that inhibition of Lats1/p‐YAP1 pathway mitigates neuronal apoptosis and neurological deficits in a rat model of TBI.
Keywords: Lats1, neurological deficit, neuronal apoptosis, traumatic brain injury, YAP1
1. INTRODUCTION
Traumatic brain injury (TBI) is the major reason for the death of young people and is well known for its high mortality and morbidity.1 During TBI, neuronal cell death is not only a paramount contributor to neurological deficits but also a critical factor which seriously affecting the TBI patients’ quality of life. And the neuronal apoptosis after TBI often caused by some secondary events such as hemorrhage, brain edema, and local inflammation.2, 3, 4 Although there are a significant amount of studies about TBI, there are few effective clinical treatments for TBI patients.5 Inadequate understanding of the pathogenesis of neuronal cell death in the damaged area and its surroundings is a major obstacle to the effective treatment of TBI.
In this study, we made a rat weight‐drop TBI model. Weight‐drop model is similar to clinical mechanics of TBI, which fully simulates clinical focal TBI and brain edema. And the TBI model has important value in the study of injury mechanism, biological effect, and related physiological pharmacodynamics.6
Large tumor suppressor 1 (Lats1), also known as tumor suppressor warts,7 is a core kinase of Hippo pathway and located upstream of Yes‐associated protein 1 (YAP1) which is a transcriptional coactivator, another component of Hippo pathway.8 Previous reports demonstrated that Lats1/YAP1 is a susceptible pathway of tumor, cell proliferation and differentiation in the liver, lung, and other organs.9, 10 However, all the above studies are only refer to Lats1/YAP1 in cell proliferation and differentiation, the physiological function of Lats1/YAP1 pathway in cell death following brain injury has yet to be determined.8, 11 Recent studies indicated that in the activated mammalian Hippo pathway, p‐Lats1 leads to phosphorylation of Ser 127 in YAP1 and stimulates p‐YAP1 binding to 14‐3‐3 proteins and subsequent cytoplasmic retention, cannot be transferred into the nucleus, thereby losing its transcriptional activation activity.12, 13 It is worth noting that YAP (Yes‐associated protein 1 homolog) in the nucleus has the effects on promoting the transcription of prosurvival genes such as ctgf and cyr61 and inhibiting the transcription of apoptosis‐related genes such as P53 and P73.14, 15 Therefore, when YAP1 is cytoplasmic retention, its role of inhibition of apoptosis may disappear.16 Although increasing evidences have revealed that Lats1‐YAP1 signaling plays an important role in the regulation of apoptosis, none of the previous researches has examined whether or how Lats1/YAP1 pathway participating in neuronal apoptosis or neurological impairment of TBI.
In this study, we show that Lats1 plays an essential role in regulating the neuronal apoptosis and neurological deficits following TBI in rats. We describe that Lats1 is expressed in neurons and its phosphorylation level is significantly increased at 24 hours (hrs) after TBI. Deficiency of Lats1 attenuates neuronal loss and improves neurological impairment during TBI. We further show that Lats1 aggravates the TBI‐induced neuronal apoptosis and some other secondary brain injury events by promoting phosphorylation of YAP1.
2. MATERIALS AND METHODS
2.1. Animals
All male Sprague‐Dawley rats (weight between 280~300 g; age between 7~8 weeks) used in this work were purchased from Animal Center of Chinese Academy of Sciences, Shanghai, China. Rats were housed in groups of 3 or 4 per cage (485 × 350 × 225 mm) in a specific pathogen‐free (SPF) condition,with a 12/12 hours light‐dark cycle in a temperature‐ and humidity‐controlled facility, and free access to water and food. And all rats were treated (Permit Number: 2012‐0045) according to the guidelines of Ethic Committee of Soochow University.
2.2. Antibodies
Antibodies used in this study were as follows: anti‐Lats1 (CST, #3477, Western blot), anti‐p‐Lats1 (CST, #8654), anti‐Lats1 (Sigma, SAB4501145, immunofluorescence), anti‐YAP1 (Abcam, ab52771), anti‐p‐YAP1 (Abcam, ab76252) anti‐Caspase‐3 (Abcam, ab13847), anti‐Neun (Millipore, mab377), anti‐Albumin (Abcam, ab106582) anti‐GAPDH (Sigma, G9545‐100 μL), and anti‐β‐actin (Sigma, A5316‐100 μL).
2.3. Lats1 siRNA
Lats1 siRNA was purchased from RiboBio, Guangzhou, China. The Lats1 siRNA and the vector siRNA were diluted into a stock solution at a concentration of 500 pmol/10 μL with ddH2O according to instruction. Then, we take a 200‐μL portion of the stock solution, dilute it with in vivo transfection reagent (Entranster‐in vivo; Engreen) to a total volume of 400 μL, and gently mix the solution. Finally, the concentration of the mixture is 500 pmol/20 μL. This concentration is the experimental concentration throughout the study. Target sequence: CCAGGAAATGTGCAACATT.
2.4. Experimental grouping and design routes
There was no obvious difference in body temperature, weight, feed intake, and motor ability of all rats before the experiment. Our work can be mainly divided into two parts: part I and part II.
2.4.1. Part I
This was designed to detect the time course of the protein levels of Lats1, p‐Lats1, and p‐YAP1 and the location of these molecules in cerebral cortex tissue, meanwhile detect the neuronal apoptosis and BBB damage following TBI. In part I, seventy‐two male rats were randomly divided into six groups, one sham group and five TBI groups (12 rats per group; n = 12), according to a computer‐based randomization system. Then, we established TBI model according the method of 2.5 in materials and methods section. The rats were sacrificed at 6, 12, 24, 48, and 72 hours after TBI. Next, we examined the protein levels and the expression and location of Lats1 and p‐Lats1 in the cortex tissue (Figure 1A shaded parts) of each group by Western blot and immunofluorescence (Figure 1A, B).
Figure 1.
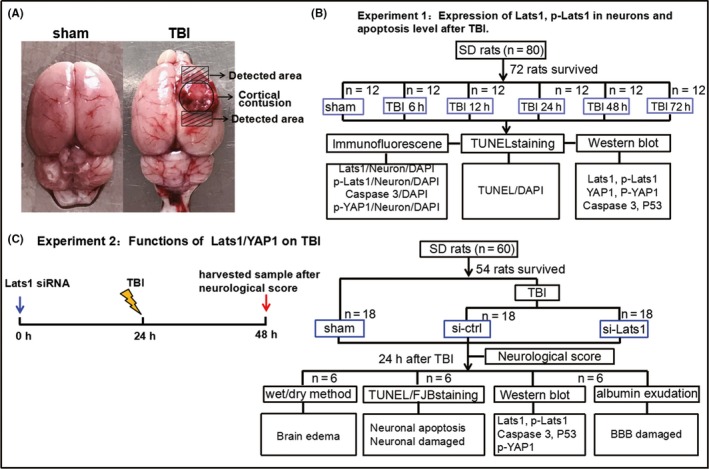
Traumatic brain injury (TBI) model and experimental design. (A) In TBI group, the circular area in the figure is the cortical contusion section; the shaded part (5 mm x 3 mm x 4 mm) above the circular area was used for Western blot; and the shaded portion under the cortical contusion area was used for immunohistochemistry. (B) The experiment 1 was designed to detect the expression levels of Lats1 at each time point after TBI and indicate the suitable time point for the experiment 2. (C) The experiment 2 was designed to detect the effects of Lats1/YAP1 pathway in TBI. DAPI = 4,6‐diamino‐2‐phenyl indole; FJB = fluoro‐jade B; TUNEL = terminal deoxynucleotidyl transferase‐mediated dUTP nick‐end labeling
2.4.2. Part II
This was designed to analyze the role and the mechanism of Lats1 in the pathogenesis of TBI. In part II, fifty‐four male rats were divided into three groups, sham group, control siRNA group (TBI group), and Lats1 siRNA group (18 rats each; n = 18), according to the randomized grouping method. First, we used stereotaxic instrument to performed intraventricular injection of siRNA vehicle and Lats1 siRNA (20 μL, 500 pmol/20 μL).17 At 24 hours after intracerebroventricular injection, the rats in control siRNA group (TBI group) and Lats1 siRNA group were performed brain trauma. Meanwhile, the sham group was treated with a sham wound. At 24 hours after TBI and sham trauma, all the rats were sacrificed and the cortical tissues around the damaged area and the same location tissues of sham group were used for the following each experimental analysis (Figure 1C).
During the analysis of all the above experiments, the experimenters were blinded to all the samples identity and all the samples were encoded by an independent investigator.
2.5. Rat model of TBI
In this study, we made a rat weight‐drop TBI model. Before the experimental operation, the rats were anesthetized with 4% chloral hydrate (10 mL/kg), according to the published dose,17 by intraperitoneal injection. Before disinfected,the hair on the head of the rat was shaved. Then, we cut the rat's head skin; removed the periosteum; exposed the right parietal bone. A diameter of 5 mm bone window was opened, which on the 2.5 mm right side of the brain midline and 1.5 mm behind the coronal suture, with a small drill. The dura mater was kept intact throughout the procedure. Severe open brain injury was caused by the free fall of a cylindrical steel block weight 40 g, which hit the dura mater through a piston pipe from 25 cm height. The impact force of the injury is 1000 g/cm and belongs to severe TBI.6 Then, the skin of rat was disinfected and sutured. Finally, the rats were sacrificed on the basis of the experimental requirements.
2.6. Western blot analysis
The left cortical tissue samples were collected according to the plan of experiment. Total soluble proteins were extracted from the samples with brain tissue lysis buffer which containing protease inhibitor. The concentration of the protein was measured by bicin‐choninic acid (BCA) kit which purchased form Thermo (23227). After SDS‐PAGE, the protein was transferred to the PVDF membrane, blocked with 5% milk at least for one hour at room temperature, and then incubated with primary antibodies overnight at 4°C. The following day, the membranes were incubated with secondary antibodies for 2 hours at 4°C. Subsequently, the target bands signal was detected by enhanced chemiluminescence (ECL) method.
2.7. Immunofluorescence
The brain tissues were fixed with 4% paraformaldehyde for 36 hours at 4°C and then gradient dehydrated with 15% and 30% sucrose. Subsequently, frozen sections were performed with 15 μm thickness. Then, sections were rinsed 3 times in phosphate‐buffered saline (PBS) with 0.3% Triton X‐100, 10 minutes each time. Next, 10% fetal bovine serum was blocked for an hour at room temperature. Then, primary antibodies were incubated overnight at 4°C. Following day, sections were washed 3 times with PBS, then incubated with fluorescent secondary antibodies for one hour at room temperature. Before covered with DAPI Fluoromount‐G, sections were rinsed 3 times with PBS. Finally, sections were detected and analyzed using confocal microscopy (Leica, TCS SP8).
2.8. Neurological and motor function score
Neurological and motor function of the rats in experiment 2 was assessed with blind evaluation, by the previously published and modified neurological severity score (mNSS) system at 24 hours after TBI.16 The modified mNSS included four test items: motor, sensory, balance, and reflex test scores. The total score of motor test is 6 points; sensory test is 2 points; beam balance test is 6 points; and reflexes absent and abnormal movements test is 4 points. Each test items include several test standards and give points to each experimental rat according to each scoring criteria; the higher the score, the more serious the neurological and motor function injury. Finally, the total score (maximum score = 18) was calculated by accumulating the score for each item: 13 to 18 points indicates severe TBI; 7 to 12 points means moderate injury; and 1 to 6 points represents mild injury.18
2.9. TUNEL and Fluoro‐Jade B staining
TUNEL assay kit was purchased from Abcam (ab66110) which is used to detect cell apoptosis. First, tissue sections were fixed with 4% paraformaldehyde for 15 minutes at room temperature; washed 2 times with 0.01M PBS; and then incubated with proteinase K solution (20 μg/mL) for 5 minutes at room temperature. Then, sections were washed with wash buffer for 5 minutes. Slides were covered with the DNA labeling solution for an hour at 37°C; rinsed with PBS for 5 minutes; subsequently incubated with antibody solution for 30 minutes at room temperature. Sections were washed with ddH2O; incubated for 5 minutes; and finally, covered with DAPI Fluoromount‐G.
FJB (Histo‐Chem, Jefferson) staining was used to detect the damaged neurons. Sections were immersed in a solution containing 1% sodium hydroxide in 80% alcohol for 5 minutes at room temperature; then immersed in 70% alcohol for 2 minutes and washed with ddH2O for 2 minutes. The slides were transferred to 0.06% potassium permanganate for 10 minutes. After washed 2 minutes with ddH2O, the sections were immersed in FJB staining solution for 20 minutes and then washed 1 minute with ddH2O; the procedure was repeated 3 times. The sections were dried at 50°C for about 5 minutes. Subsequently, the slides were immersed in xylene for 1 minute before covered with resin.
2.10. Brain edema and BBB damage
Brain edema can be assessed by measuring brain water content. Fresh brain tissues of each group were collected and weighed them immediately, recorded as wet weight. Subsequently, the brain tissues were placed in oven for 24 hours at 100°C, the weight was recorded as dry weight at this moment. So the brain water content can be calculated using the formula [(wet weight−dry weight)/wet weight × 100%.19
Western blot analyzed the extravasation of albumin which can be used to assess blood‐brain barrier (BBB) damage.17
2.11. Statistical analysis
We analyzed all the data in this work with SPSS 19.0. The error bars in each graph indicated standard error of the mean (SEM). The comparisons between means and the processing of the outliers were carried out using Student's t test or one‐way ANOVA. Values were represented as means ± SEM. Significant difference was accepted at P < 0.05. (*P < 0.05, **P < 0.01, ***P < 0.001).
3. RESULTS
3.1. Survival rates following TBI
There was no obvious difference in body temperature, weight, feed intake, and motor ability of all rats before the experiment.
Survival rates in each group were as follows: sham—100% (24 of 24), TBI—90% (72 of 80), TBI+control siRNA—85% (18 of 20), and TBI+Lats1 siRNA—82% (18 of 22).
3.2. Lats1 is colocalized with neurons, and its phosphorylation level is increased following TBI
To detect the location of Lats1 in rat cerebral cortex, we first performed immunofluorescence double staining of Lats1 and neurons. The result showed that Lats1 was expressed in neurons (Figure 2D). Next, we analyzed the expression levels of Lats1 at each time point after TBI by Western blot. Preliminary results showed that the total protein level of Lats1 did not changed (Figure 2A,B), but it is noteworthy that Lats1 phosphorylation or the activation level was significantly increased and reached the highest at 24 hours after TBI (Figure 2A,C). In addition, our immunofluorescence results demonstrated again that Lats1 phosphorylation level was significantly higher than sham group at 24 hours following TBI (Figure 2F,G). These results suggest that p‐Lats1 may play an important role in the progression of TBI, and 24 hours after the TBI is a more suitable time point for the implementation of the following experiments.
Figure 2.
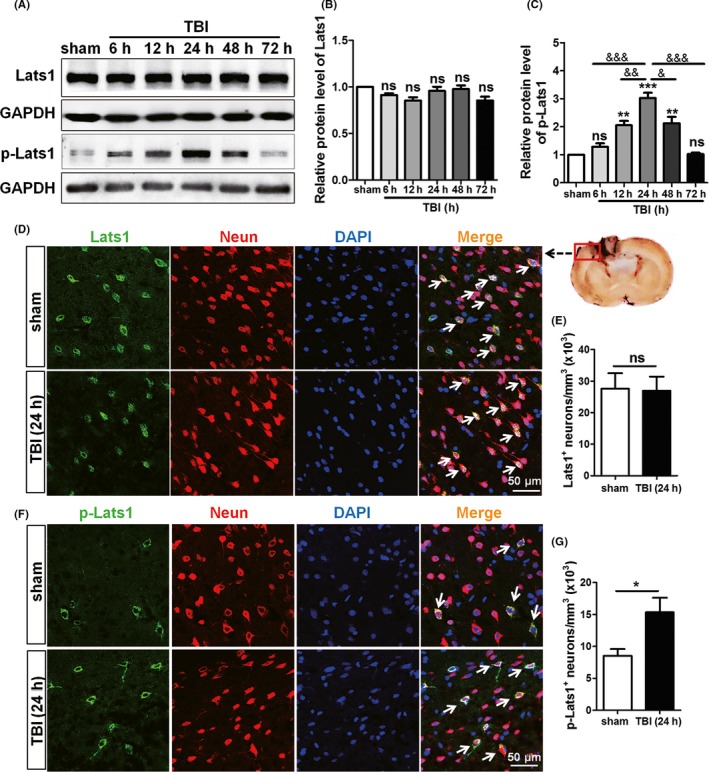
Lats1 was expressed in neurons, and its phosphorylation level was increased after Traumatic brain injury (TBI). (A) Western blot analysis showed the protein levels of Lats1 and p‐Lats1 at 6 h, 12 h, 24 h, 48 h, and 72 h following TBI. (B, C) Quantification of Lats1 and p‐Lats1 protein levels at each time point as shown in (A), and the protein level of p‐Lats1 reached the highest at 24 h after TBI. (D, F) Immunofluorescence results indicated that Lats1 (green) and p‐Lats1 (green) were expressed in rat cortical neurons (red). And the expression levels of p‐Lats1 were increased at 24 h after TBI. (E, G) Density of Lats1 + cells and p‐Lats1 + cells. Scale bars: 50 μm. Values represent means ± SEM. Student's t test and one‐way ANOVA. *P < 0.05; **P < 0.01; ***P < 0.001 vs sham group; & P < 0.05; && P < 0.01; &&& P < 0.001 vs TBI group (24 h); ns: not significant
3.3. Inhibition of Lats1 repressed the expression level of p‐Lats1 and attenuated apoptosis following TBI
Previous studies have revealed that TBI can induce some secondary events such as brain edema, hematoma, and local inflammation which often lead to neuronal cell apoptosis in the injured region and its surroundings.4, 20 In our work, increased apoptosis has also been detected following TBI (Figure S1). In part II, SD rats were divided into three groups: sham group, control siRNA group, and Lats1 siRNA group. In order to detect the role of Lats1 in pathological process of TBI, we used the siRNA of Lats1 to silence Lats1 while the control group was treated with siRNA vehicle. First, we detected the inhibition effect of siRNA interference on Lats1 via Western blot analysis. From Figure 3A, the expression level of Lats1 was significantly lower than those in control siRNA group and sham group, indicating that the Lats1 siRNA was effective in silencing Lats1. It is worth noting that inhibition of Lats1, p‐Lats1 expression level also decreased; the reason for the significantly reduced p‐Lats1 level may be that the body in order to maintain a dynamic balance between Lats1 and p‐Lats1 in vivo.
Figure 3.
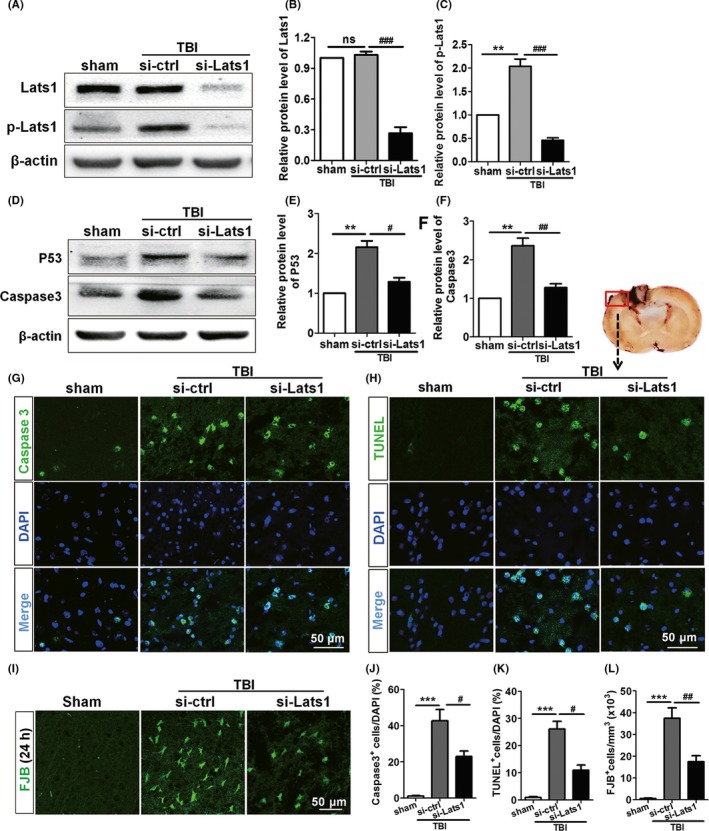
Inhibition of Lats1 repressed the expression level of p‐Lats1 and attenuated apoptosis following Traumatic brain injury (TBI). (A) Western blot analyzed the expression levels of Lats1 and p‐Lats1 in sham group, control siRNA group, and Lats1 siRNA group after silenced Lats1. (B, C) Quantification of the expression levels of Lats1 and p‐Lats1 in each group as shown in (A). (D) Western blot analysis of caspase‐3 and P53 protein levels in cerebral cortex of each group after silenced Lats1. (E, F) Quantification of the expression levels of caspase‐3 and P53 as shown in (E). (G‐I) Coronal sections of the cerebral cortex from sham group, control siRNA group, and Lats1 siRNA group rats were immunostained for caspase‐3, TUNEL, and FJB at 48 hrs after intracerebroventricular injection of siRNA. (J‐L) Numbers of caspase‐3 + cells (J), TUNEL+ cells (K), and FJB+cells (L) are expressed as percentage of DAPI+ cell numbers in the rat cortex of each group. Scale bars: 50 μm. Values represent means ± SEM. One‐way ANOVA. **P < 0.01; ***P < 0.001 vs sham group; # P < 0.05; ## P < 0.01; ### P < 0.001 vs si‐ctrl group; ns: not significant
Subsequently, in order to analyze the neuronal damaged and apoptosis in each group, we detected the expression levels of activated caspase‐3 and P53 of each group to assess the apoptosis after TBI. Both Western blot and immunofluorescence results showed that the expression level of activated caspase‐3 in the control siRNA group was higher than that of sham group. However, the expression level of activated caspase‐3 was significantly decreased after silenced Lats1 compared with control siRNA group (Figure 3E,G,H,K). In addition, the changed tendency of P53 protein level was consistent with caspase‐3 (Figure 3E,F). The results suggest that the apoptosis was increased after TBI; nevertheless, inhibition of Lats1 could effectively mitigate neuronal apoptosis. In addition, TUNEL staining and FJB staining demonstrated again that the downregulation of Lats1 significantly alleviated the apoptosis of neurons in the cortical injured region (Figure 3H,I,K,L). The above results indicate that the inhibition of Lats1 can effectively reduce the loss of neurons following TBI.
3.4. Inhibition of Lats1 reduced brain edema, BBB damage, and neurological behavior dysfunction following TBI
Throughout the previous studies, except apoptosis, TBI is often accompanied by many other events such as brain edema, destruction of BBB permeability, and neurological impairment.21, 22 Our data also show that the destruction of the BBB permeability impaired following TBI (Figure S1). To investigate the function of Lats1 in TBI‐induced secondary brain injuries, we measured the brain water content in each group by dry‐wet weight method. We found that the brain water content of control siRNA group was significantly higher than that of sham group (Figure 4D), but in Lats1 siRNA group, after specifically silenced Lats1, the brain water content was meaningfully decreased compared with control siRNA group (Figure 4D). The result indicates that inhibition of Lats1 can significantly relieve brain edema following TBI.
Figure 4.
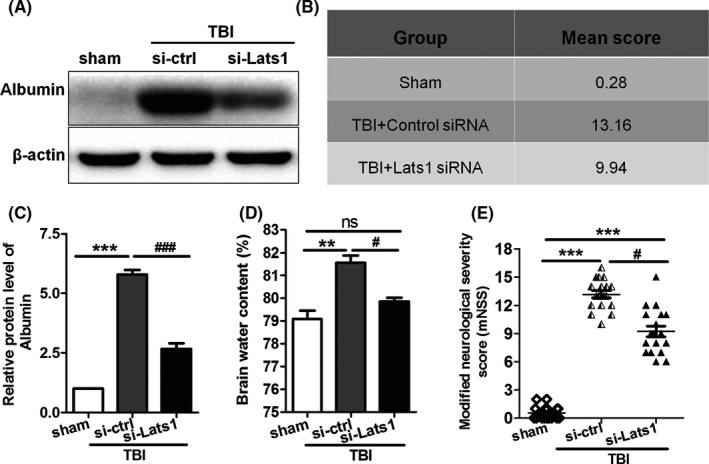
Inhibition of Lats1 reduced brain edema, BBB damage, and neurological deficits following Traumatic brain injury (TBI). (A) Western blot analysis of albumin protein level in cerebral cortex of sham group, control siRNA group, and Lats1 siRNA group after inhibited Lats1. (B, E) Neurological behavior scores in each group. (C) Quantification of the expression levels of albumin in each group as shown in (A). (D) Dry and wet method analysis of brain water content in different groups. Values represent means ± SEM. One‐way ANOVA and nonparametric analysis of variance. **P < 0.01; ***P < 0.001 vs sham group; # P < 0.05; ### P < 0.001 vs si‐ctrl group
Next, we performed Western blot to detect the albumin exudation in each group. We discovered that the albumin expression level of control siRNA group was considerably higher than that of sham group, and similarly, inhibition of Lats1 reduced TBI‐induced albumin exudation (Figure 4A,C). These results demonstrate that inhibition of Lats1 contributes to the recovery of the damaged blood‐brain barrier permeability following TBI.
In addition, we also measured the degree of neurological impairment in each group based on the published modified neurological severity score. We discovered that in the precondition of silenced Lats1, the motor, sensory, balance, and reflex of the rats in Lats1 siRNA group were significantly better than those of control siRNA group (Figure 4B,E). The result reveals that the inhibition of Lats1/YAP1 pathway can effectively improve neurological behavior injury of rats who are suffering from TBI.
3.5. YAP1 phosphorylation level is increased after TBI, and inhibition of Lats1 represses YAP1 phosphorylation
Previous studies have demonstrated in the activated Hippo pathway, p‐Lats1 leads to phosphorylation and cytoplasmic retention of YAP1, which in turn promotes or suppresses some of the downstream events such as cell growth, survival, and apoptosis.8 As an example, cytoplasmic ASPP1 (apoptosis‐stimulating protein of p53) prevents apoptosis through inhibit the phosphorylation of YAP by Lats1.23 Which leads us to speculate that Lats1 may be involved in the pathogenesis of TBI by phosphorylating YAP1. Consequently, we examined the expression and location of YAP1 in rat cerebral cortex at each time point following TBI with Western blot and immunofluorescence. Results displayed that p‐YAP1 was also expressed in neurons of rat's cerebral cortical (Figure 5D); similarly, the phosphorylation level of YAP1 was increased remarkably and reached peak at 24 hrs after TBI while the total protein level of YAP1 was unchanged (Figure 5). Subsequently, under the premise of silenced Lats1, we examined the protein level of p‐YAP1; it is noteworthy that p‐YAP1 protein level was also significantly decreased following silenced Lats1 (Figure 5E,F). Therefore,there is a great possibility that p‐Lats1 is involved in the pathogenesis of TBI by phosphorylation of downstream YAP1.
Figure 5.
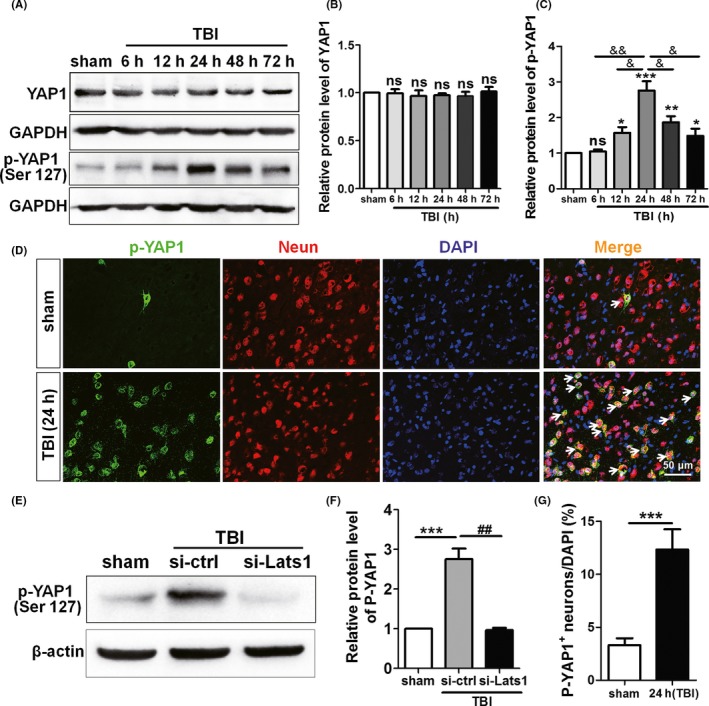
YAP1 phosphorylation level is increased after TBI, and inhibition of Lats1 represses YAP1 phosphorylation. (A) Western blot detected the expression levels of YAP1 and p‐YAP1 at 6 h, 12 h, 24 h, 48 h, and 72 h following TBI. (B, C) The protein levels of YAP1 and p‐YAP1 were quantified as shown in (A), and the protein level of p‐YAP1 reached the peak at 24 hrs after TBI. (D) Immunofluorescence results indicated that p‐YAP1 (green) was expressed in rat cortical neurons (red). And the expression levels of p‐YAP1 were increased in TBI group. (E) Western blot analysis protein levels of p‐YAP1 in sham group, control siRNA group, and Lats1 siRNA group under the premise of silenced Lats1. (F) Quantification of the p‐YAP1 protein levels in each group as shown in (E). (G) Density of p‐YAP1 + cells. Scale bars: 50 μm. Values represent means ± SEM. Student's t test and one‐way ANOVA. *P < 0.05; **P < 0.01; ***P < 0.001 vs sham group; & P < 0.05; && P < 0.01 vs TBI group (24 h); ## P < 0.01 vs si‐ctrl group; ns: not significant
4. DISCUSSION
In this study, we create a weight‐drop rat model, a severe TBI model. The TBI model in this experiment has the following characteristics: mechanism of mechanics is similar to mechanisms of clinically accelerated brain injury. Experimental controllable, less‐disturbing factors can copy different levels of brain injury. In addition, the repeatability of the experiment is good; the extent,range, and the pathophysiological responses of the brain injury caused by the same external injury are basically in line.6, 24 Therefore, the development of this TBI model will contribute to understand more about the potential mechanisms of TBI pathophysiology and find more effective treatments. In this model, rats with brain injury showed obvious neuronal apoptosis and neurological dysfunction. Many studies on TBI patients prove that neuronal cells death and subsequent neurological deficits following TBI contribute significantly to increase TBI patients mortality, long‐term disability, and a series of complications, such as communication barriers, sensory, and behavioral disorders, and an increased risk for chronic CNS diseases, such as Parkinson's disease (PD) and Alzheimer's disease (AD).25, 26, 27 Therefore, efforts to improve apoptosis and neurological dysfunction imminently need to clarify the potential cellular and molecular mechanism.
Lats1 and YAP1 are two critical components of Hippo signal pathway. The focus of previous studies is the role of Lats1 and YAP in cell growth and tumor.8 Although Lats1/YAP1 pathway in the regulation of apoptosis during brain injury has not been studied before, there is a lot of evidence that YAP1 plays a quite important role in the regulation of apoptosis. For instance, in myocardial ischemic injury, unphosphorylated YAP1 has the ability to maintain homeostasis of heart and mitigate the response to myocardial infarction.28 Furthermore, in endometrial stromal cells (ESCs) of endometriosis, YAP1 expression increased, while the expression of p‐YAP decreased, the results contributed to the proliferation of ESCs and meanwhile inhibited the apoptosis of ESCs.29 These evidences suggested that p‐YAP has an effect of promoting apoptosis. In our work, we found a significant increase in p‐Lats1 level of TBI rats compared with sham groups. It has been suggested that a significant elevation of p‐Lats1 immunoreactivity and protein levels in the ischemic cortex region following TBI is associated with TBI‐induced delayed neuronal death.
Lats1 regulates the transcriptional activation activity of YAP1 by regulating the phosphorylation of YAP1. When Lats1 is activated, p‐Lats1 phosphorylated YAP1 and p‐YAP1 is cytoplasmic retention and cannot be transferred into the nucleus, thereby inhibits YAP1‐TEAD‐dependent transcriptional activation activity.30 On the other side, inactivated Lats1 cannot phosphorylate YAP1, unphosphorylated YAP1 transferred to the nucleus, combined with TEAD to initiate the transcription of proliferation and prosurvival genes,31 which led us to ask whether Lats1/YAP1 pathway participates in the pathological process of TBI. In our work, we reported that high levels of p‐Lats1 following TBI lead to elevated levels of p‐YAP1 and a series of TBI‐induced secondary events such as cell death, edema, neurological dysfunction, and so on. After decreasing the level of p‐Lats1, not only p‐YAP1 levels decreased, neuronal death and neurological deficits also improved. In short, p‐Lats1 promotes phosphorylation of YAP1, thereby promoting TBI‐induced neuronal apoptosis (Figure 6). These results indicate that blocking phosphorylation of YAP1 may be an effective target for the treatment of TBI.
Figure 6.
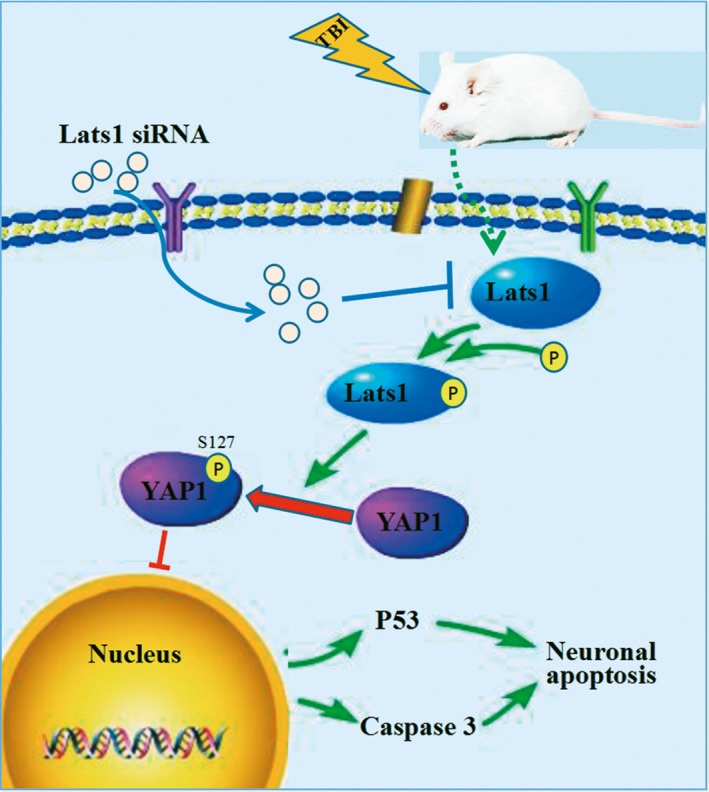
Schematic model for the roles of Lats1‐YAP1 signaling in neuronal apoptosis. Lats1 is phosphorylated and activated; in turn, p‐Lats1 phosphorylates the downstream molecule YAP1; and p‐YAP1 is cytoplasmic retention, then the expression levels of P53 and caspase‐3 are upregulated which aggravates neuronal apoptosis following Traumatic brain injury (TBI)
TBI‐induced apoptosis as a complex network signaling process involves many molecules and different mechanisms, although many study results of TBI have been reported and significant advances in the technological and medical treatments have been made.32, 33 However, in the treatment of clinical TBI patients, the results are always unsatisfactory. Therefore, the key to effective treatment of cell death in TBI is to identify the pivots in different regulatory mechanisms in the complex network signal of apoptosis. From our results, Lats1‐YAP1 pathway may be as a signaling in apoptotic network signal and together with other pathways to regulate TBI‐induced apoptosis. However, the hypothesis needs to be further confirmed.
5. CONCLUSIONS
In our work, we illustrated the role of Lats1/YAP1 in pathogenesis of a rat model of TBI. The main novelties of our work are as follows: (i) we found that Lats1 participates in the pathogenesis of TBI in rat; (ii) we demonstrated that Lats1 was involved in the regulation of TBI by regulating the phosphorylation of downstream YAP1; and (iii) the inhibition of Lats1/YAP1 pathway mitigated neuronal apoptosis and neurological deficits.
CONFLICTS OF INTEREST
The authors declare no conflict of interest.
Supporting information
ACKNOWLEDGMENTS
This work was supported by grants from Zhangjiagang Government Nos. (ZJGQNKJ201706).
Li D, Ji J‐X, Xu Y‐T, et al. Inhibition of Lats1/p‐YAP1 pathway mitigates neuronal apoptosis and neurological deficits in a rat model of traumatic brain injury. CNS Neurosci Ther. 2018;24:906–916. 10.1111/cns.12833
REFERENCES
- 1. Wang Y, Liu Y, Lopez D, et al. Protection against TBI‐induced neuronal death with post‐treatment with a selective calpain‐2 inhibitor in mice. J Neurotrauma. 2018;35:105‐117. [DOI] [PMC free article] [PubMed] [Google Scholar]
- 2. Indraswari F, Wang H, Lei B, et al. Statins improve outcome in murine models of intracranial hemorrhage and traumatic brain injury: a translational approach. J Neurotrauma. 2012;29:1388‐1400. [DOI] [PubMed] [Google Scholar]
- 3. Salehi A, Zhang JH, Obenaus A. Response of the cerebral vasculature following traumatic brain injury. J Cereb Blood Flow Metab. 2017;37:2320‐2339. [DOI] [PMC free article] [PubMed] [Google Scholar]
- 4. Hopp S, Nolte MW, Stetter C, Kleinschnitz C, Sirén AL, Albert‐Weissenberger C. Alleviation of secondary brain injury, posttraumatic inflammation, and brain edema formation by inhibition of factor XIIa. J Neuroinflammation. 2017;14:39. [DOI] [PMC free article] [PubMed] [Google Scholar]
- 5. Menon DK, Maas AI. Traumatic brain injury in 2014. Progress, failures and new approaches for TBI research. Nat Rev Neurol. 2015;11:‐72. [DOI] [PubMed] [Google Scholar]
- 6. Feeney DM, Boyeson MG, Linn RT, Murray HM, Dail WG. Responses to cortical injury: I. Methodology and local effects of contusions in the rat. Brain Res. 1981;211:67‐77. [DOI] [PubMed] [Google Scholar]
- 7. Chiyoda T, Sugiyama N, Shimizu T, et al. LATS1/WARTS phosphorylates MYPT1 to counteract PLK1 and regulate mammalian mitotic progression. J Cell Biol. 2012;197:625‐641. [DOI] [PMC free article] [PubMed] [Google Scholar]
- 8. Yu FX, Zhao B, Guan KL. Hippo pathway in organ size control, tissue homeostasis, and cancer. Cell. 2015;163:811‐828. [DOI] [PMC free article] [PubMed] [Google Scholar]
- 9. Lee DH, Park JO, Kim TS, et al. LATS‐YAP/TAZ controls lineage specification by regulating TGFβ signaling and Hnf4α expression during liver development. Nat Commun. 2016;7:11961. [DOI] [PMC free article] [PubMed] [Google Scholar]
- 10. Ye XY, Luo QQ, Xu YH, et al. 17‐AAG suppresses growth and invasion of lung adenocarcinoma cells via regulation of the LATS1/YAP pathway. J Cell Mol Med. 2015;19:651‐663. [DOI] [PMC free article] [PubMed] [Google Scholar]
- 11. Camargo FD, Gokhale S, Johnnidis JB, et al. YAP1 increases organ size and expands undifferentiated progenitor cells. Curr Biol. 2007;17:2054‐2060. [DOI] [PubMed] [Google Scholar]
- 12. Zhao B, Tumaneng K, Guan KL. The Hippo pathway in organ size control, tissue regeneration and stem cell self‐renewal. Nat Cell Biol. 2011;13:877‐883. [DOI] [PMC free article] [PubMed] [Google Scholar]
- 13. Iwasa H, Maimaiti S, Kuroyanagi H, et al. Yes‐associated protein homolog, YAP‐1, is involved in the thermotolerance and aging in the nematode Caenorhabditis elegans. Exp Cell Res. 2013;319:931‐945. [DOI] [PubMed] [Google Scholar]
- 14. Robertson A, Mohamed TM, El Maadawi Z, et al. Genetic ablation of the mammalian sterile‐20 like kinase 1 (Mst1) improves cell reprogramming efficiency and increases induced pluripotent stem cell proliferation and survival. Stem Cell Res. 2017;20:42‐49. [DOI] [PMC free article] [PubMed] [Google Scholar]
- 15. Xu S, Yang Z, Fan Y, et al. Curcumin enhances temsirolimus‐induced apoptosis in human renal carcinoma cells through upregulation of YAP/p53. Oncol Lett. 2016;12:4999‐5006. [DOI] [PMC free article] [PubMed] [Google Scholar]
- 16. Yu FX, Guan KL. The Hippo pathway: regulators and regulations. Genes Dev. 2013;27:355‐371. [DOI] [PMC free article] [PubMed] [Google Scholar]
- 17. Dang B, Li H, Xu X, et al. Cyclophilin A/cluster of differentiation 147 interactions participate in early brain injury after subarachnoid hemorrhage in rats. Crit Care Med. 2015;43:e369‐e381. [DOI] [PubMed] [Google Scholar]
- 18. Chen J1, Li Y, Wang L, et al. Therapeutic benefit of intravenous administration of bone marrow stromal cells after cerebral ischemia in rats. Stroke 2001;32:1005‐1011. [DOI] [PubMed] [Google Scholar]
- 19. Yin C, Huang GF, Sun XC, Guo Z, Zhang JH. DLK silencing attenuated neuron apoptosis through JIP3/MA2K7/JNK pathway in early brain injury after SAH in rats. Neurobiol Dis. 2017;103:133‐143. [DOI] [PMC free article] [PubMed] [Google Scholar]
- 20. Gong J, Li Q, Cao Y, Zheng X, Ma Y, Zhan R. Serial attacks: contralateral hematoma secondary to decompressive craniectomy for traumatic brain injury led to posttraumatic cerebral infarction. J Craniofac Surg. 2016;27:e159‐e162. [DOI] [PubMed] [Google Scholar]
- 21. Bao HJ, Wang T, Zhang MY, et al. Poloxamer‐188 attenuates TBI‐induced blood‐brain barrier damage leading to decreased brain edema and reduced cellular death. Neurochem Res. 2012;37:2856‐2867. [DOI] [PubMed] [Google Scholar]
- 22. Li Z, Dong X, Zhang J, et al. Formononetin protects TBI rats against neurological lesions and the underlying mechanism. J Neurol Sci. 2014;338:112‐117. [DOI] [PubMed] [Google Scholar]
- 23. Vigneron AM, Ludwig RL, Vousden KH. Cytoplasmic ASPP1 inhibits apoptosis through the control of YAP. Genes Dev. 2010;24:2430‐2439. [DOI] [PMC free article] [PubMed] [Google Scholar]
- 24. Leker RR, Shohami E, Constantini S. Experimental models of head trauma. Acta Neurochir Suppl. 2002;83:49‐54. [DOI] [PubMed] [Google Scholar]
- 25. Steel J, Ferguson A, Spencer E, Togher L. Language and cognitive communication disorder during post‐traumatic amnesia: profiles of recovery after TBI from three cases. Brain Inj. 2017;31:1889‐1902. [DOI] [PubMed] [Google Scholar]
- 26. Pang AL, Xiong LL, Xia QJ, et al. Neural stem cell transplantation is associated with inhibition of apoptosis, Bcl‐xL upregulation, and recovery of neurological function in a rat model of traumatic brain injury. Cell Transplant. 2017;26:1262‐1275. [DOI] [PMC free article] [PubMed] [Google Scholar]
- 27. Camacho‐Soto A, Warden MN, Searles Nielsen S, et al. Traumatic brain injury in the prodromal period of Parkinson's disease: a large epidemiological study using medicare data. Ann Neurol. 2017;82:744‐754. [DOI] [PMC free article] [PubMed] [Google Scholar]
- 28. Del Re DP, Yang Y, Nakano N, et al. Yes‐associated protein isoform 1 (Yap1) promotes cardiomyocyte survival and growth to protect against myocardial ischemic injury. J Biol Chem. 2013;288:3977‐3988. [DOI] [PMC free article] [PubMed] [Google Scholar]
- 29. Song Y, Fu J, Zhou M, et al. Activated Hippo/Yes‐associated protein pathway promotes cell proliferation and anti‐apoptosis in endometrial stromal cells of endometriosis. J Clin Endocrinol Metab. 2016;101:1552‐1561. [DOI] [PMC free article] [PubMed] [Google Scholar]
- 30. Stein C, Bardet AF, Roma G, et al. YAP1 Exerts Its Transcriptional Control via TEAD‐Mediated Activation of Enhancers. PLoS Genet. 2015;11:e1005465. [DOI] [PMC free article] [PubMed] [Google Scholar]
- 31. Matsuda T, Zhai P, Sciarretta S, et al. NF2 Activates Hippo Signaling and Promotes Ischemia/Reperfusion Injury in the Heart. Circ Res. 2016;119:596‐606. [DOI] [PMC free article] [PubMed] [Google Scholar]
- 32. Khalafian A, Dukes C, Tucker P. Consultation Dilemma Catatonia in a patient with prior TBI: mentaI or medical disorder? J Okla State Med Assoc. 2015;108:358‐360. [PubMed] [Google Scholar]
- 33. Chantsoulis M, Polrola P, Goral‐Polrola J, et al. Application of ERPs neuromarkers for assessment and treatment of a patient with chronic crossed aphasia after severe TBI and long‐term coma ‐ Case Report. Ann Agric Environ Med. 2017;24:141‐147. [DOI] [PubMed] [Google Scholar]
Associated Data
This section collects any data citations, data availability statements, or supplementary materials included in this article.
Supplementary Materials


