

Summary
Aims
This study assessed whether antidepressant drug treatment has a common effect on gray matter (GM) volume in MDD patients with and without childhood maltreatment (CM).
Methods
T1‐weighted structural magnetic resonance imaging data were collected from 168 participants, including 51 MDD patients with CM, 31 MDD patients without CM, 48 normal controls with CM, and 38 normal controls without CM. MDD patients received 6 months of treatment with paroxetine, and 24 patients with CM, and 16 patients without CM received a second MRI scan. A whole‐brain voxel‐based morphometry approach was used to estimate GM volume in each participant at two time points. Two‐way analysis of variance (ANOVA) was used to determine the effects of MDD and CM on GM volume at baseline. Repeated measures two‐way ANOVA was used to determine the treatment‐by‐CM interactive effect and main effect of treatment during paroxetine treatment. We further investigated the relationship between GM volume and clinical variables.
Results
At baseline, significant MDD‐by‐CM interactive effects on GM volume were mainly observed in the left parahippocampal gyrus, left entorhinal cortex, and left cuneus. GM volume was significantly lower mainly in the right middle temporal gyrus in patients with MDD than in normal controls. We did not find any significant treatment‐by‐CM interactive effects. However, a treatment‐related increase in GM was found in the right middle temporal gyrus in both MDD groups.
Conclusions
These results suggest that paroxetine treatment operates via a shared neurobiological mechanism in MDD patients with and without CM.
Keywords: antidepressant drug, childhood stress, depression, follow‐up, MRI
1. INTRODUCTION
Major depressive disorder (MDD) is one of the most prevalent mental disorders in the world, with a lifetime prevalence of approximately 20%.1 Environmental stress, especially childhood maltreatment (CM), is one of the highest risk factors for the onset of MDD.2 Here, CM includes physical, emotional, and sexual abuse as well as physical and emotional neglect that occurs before an individual is 16 years old.3 Compared to MDD patients without a history of CM, MDD patients with a history of CM exhibit more severe depressive symptoms.4 Notably, reports of treatment outcomes in patients with depression who experienced CM are inconsistent, with some studies showing that depressive patients with CM compared with those without CM often exhibit poor treatment outcomes, such as a reduced response to antidepressant drugs or residual subthreshold symptoms.4, 5, 6 However, other studies have suggested that MDD patients with and without CM experience the same treatment effects when using antidepressant drug therapy.7, 8
Recently, the rapid development of magnetic resonance imaging (MRI) has provided an unprecedented opportunity for noninvasive investigations of abnormal brain structures in patients with MDD. Depressive disorder is associated with changes in gray matter (GM) volume in many brain regions, including frontal‐limbic system regions and the caudate, temporal lobe, and cerebellum.9, 10 Moreover, neuroimaging studies focused on CM have revealed CM‐related changes in GM volume in the hippocampus, medial prefrontal cortex and orbitofrontal cortex in both healthy subjects and current MDD patients.11, 12, 13, 14, 15, 16 A significant MDD‐by‐CM interactive effect was found in the prefrontal cortex in a study that recruited relatively large numbers of MDD patients and controls.17 Together, these findings demonstrate that CM and MDD exert interactive effects on GM volume. Furthermore, the results of structural neuroimaging studies of MDD treatment often suggest that GM volumes are altered after treatment in certain regions18, 19, 20, 21 including the temporal lobe.21 However, no study has explored the effect of CM on GM volume in MDD patients during antidepressant treatment. This question has important significance to our understanding of the pathophysiology underlying the changes that occur in MDD patients with and without CM during treatment.
Here, we collected T1‐weighted structural MRI data from 168 participants, including 51 MDD patients with CM, 31 MDD patients without CM, 48 normal controls (NCs) with CM and 38 NCs without CM. After 6 months of treatment with paroxetine, 24 patients with CM and 16 patients without CM received a second MRI scan. We used a whole‐brain voxel‐based morphometry (VBM) approach to estimate GM volume in each participant at each time point. We further studied MDD‐by‐CM interactive effects and treatment‐by‐CM interactive effects on GM volume at baseline and follow‐up time points, respectively. Finally, the correlations between abnormalities in GM volume and the symptoms of MDD patients were also explored at baseline and follow‐up.
2. METHODS
2.1. Participants
A total of 168 participants were enrolled in this study, including 82 MDD patients and 86 NCs. MDD patients were recruited from the inpatient or outpatient departments of the Zhumadian Psychiatry Hospital, Henan province, China. The diagnosis of MDD was confirmed by two well‐trained psychiatrists using the Structured Clinical Interview for Diagnostic and Statistical Manual of Mental Disorders‐IV (SCID). NCs from the local area were recruited by flyers placed in the community. The inclusion criteria for patients with MDD were as follows: 18‐55 years, acutely depressed and medication‐free for not less than 2 weeks, and the severity of depression assessed by the 24‐item Hamilton Rating Scale for Depression (HAMD) with a score of at least 20.22 The following exclusion criteria for patients were applied: comorbid Axis I or Axis II disorder or a personal history of bipolar disorder. NCs were required to be between 18 and 55 years of age, have a HAMD score <7 and no current or history of psychiatric disorders. For both groups, additional exclusion criteria included substance abuse or dependence, neurological or internal illness, or any contraindication for MRI scans.
For each participant, the history of CM occurring before the participant reached 16 years old was evaluated with the Childhood Trauma Questionnaire (CTQ).23, 24, 25 The credibility and efficiency of this scale have been previously demonstrated.23, 24, 25 Twenty‐five items were included in the questionnaire and classified into five subscales. Participants were identified as positive for CM (ie, moderate to severe CM) if their scores exceeded any one subscale cutoff (ie, emotional abuse more than 12, physical abuse more than 9, sexual abuse more than 7, emotional neglect more than 14, or physical neglect more than 9).25 According to these criteria, we further divided all subjects into the following four groups: 51 MDD patients with a history of CM (MDD‐CM), 31 MDD patients without a history of CM (MDD‐nCM), 48 NCs with a history of CM (NC‐CM), and 38 NCs without a history of CM (NC‐nCM).
All participants gave both written and verbal informed consent. This study was approved by the Human Investigation Committees of the Zhumadian Psychiatry Hospital and the Second Xiangya Hospital, Central South University of China.
2.2. Paroxetine administration
All subjects were scanned at baseline, and patients received a 6‐month course of paroxetine treatment based on the judgment of the physician and the patient's consent. In the first week, patients received 10 mg paroxetine, which was the minimum dosing level for this study. In the second week, patients received 20 mg paroxetine or higher dose levels depending on illness symptoms, clinical antidepressant effects, and side effects. The maximum dose was 60 mg of paroxetine. Symptoms of depression were assessed using the HAMD every month for the following 6 months. In the sixth month, the patients received a second MRI scan. Of the initial 82 patients, one had excessive head motion, and five experienced manic onset during the 6‐month study period. Therefore, data from 48 MDD‐CM and 28 MDD‐nCM participants were used for baseline analysis. During treatment, seven patients received electroconvulsive therapy or other antidepressant drugs depending on their depressive symptoms, and 29 patients did not continue participation. In all, 40 patients, including 24 MDD‐CM and 16 MDD‐nCM patients who received paroxetine treatment, finished 6 months of treatment and received a second MRI scan. A total of 18 NC‐CM and 10 NC‐nCM subjects returned for the second MRI. Of note, two patients received additional irregular transcranial magnetic stimulation therapy; one patient received this treatment once, and the other received it three times. Therefore, we also performed post hoc paired sample t tests in regions with significant treatment effects to assess whether the treatment effect remained significant after excluding these two individuals (see results in Appendix S1).
2.3. MRI data acquisition
Participants in this study were scanned on a 3T GE scanner (Signa HDxT 3.0T). During the scan, foam padding and earbuds were used to limit head motion and attenuate scanner noise. Participants were required to keep still with their eyes closed. High‐resolution structural images were collected using the following 3D magnetization‐prepared rapid gradient echo (MPRAGE) T1‐weighted sequence: repetition time = 6.8 milliseconds, echo time = 2.5 milliseconds, flip angle = 7°, field of view = 256 × 256 mm2, matrix = 256 × 256, thickness = 1 mm, voxel size = 1 × 1 × 1 mm3, slice = 256, and scan time = 6 minutes.
2.4. Voxel‐based morphometry analysis
Image preprocessing and GM volume calculations were performed using the VBM8 (https://dbm.neuro.uni-jena.de/vbm/) toolbox based on statistical parametric mapping software (SPM8, University College of London, London, UK. https://www.fil.ion.ac.uk/spm). Briefly, the T1‐weighted image of each participant at each time point was first corrected for image‐intensity nonuniformity. The corrected images were then segmented into GM, white matter, and cerebrospinal fluid. Using the Diffeomorphic anatomical registration using exponentiated lie algebra (DARTEL)26 algorithm, these segmented tissue images were then spatially normalized to the customized template in the standardized anatomic space. DARTEL‐based deformations were iteratively applied to the segmented tissue images to obtain a good alignment of GM morphology across the subjects. Subsequently, GM tissue images were normalized to the Montreal Neurological Institute space using DARTEL transformations, and the GM volume scale was acquired by Jacobian determinants. Finally, the normalized GM volume images were smoothed with a Gaussian filter of 8 mm full width at half maximum (FWHM).
2.5. Statistical analysis
For the demographic and clinical data, two‐way analysis of variance (ANOVA) was used to identify significant interactive or group effects (factor 1: MDD, factor 2: CM) for age, education, and CTQ scores among the four groups. Differences in gender were assessed using Pearson's chi‐squared test. Moreover, differences in clinical information between the two patient groups were identified by two‐sample t test.
To assess the differences in GM volume among the four groups at baseline, we performed two‐way analysis of covariance (ANCOVA) (factor 1: MDD, factor 2: CM) and post hoc analyses with gender, age, and education as covariates in a voxelwise fashion. The MDD‐by‐CM interactive effect, main effect of MDD, and main effect of CM were estimated for each voxel. The significance level was set as the cluster‐forming threshold of P < 0.01 with a Gaussian random field (GRF)‐corrected P < 0.05 at the cluster level (To further strictly control for the risk of false positives and enhance spatial specificity, we applied two additional cluster‐forming thresholds of P < 0.001 and P < 0.005. Moreover, given that there were no significant differences in demographic variables among the four groups, we reanalyzed data without adding covariates in the statistical model. Please see the relevant results in the Appendix S1). For each region with significant interactive or main effects, the mean GM volume was extracted, and partial correlations were used to investigate its relationship with clinical variables across all patients. Notably, partial correlations between the mean GM volume and CTQ were carried out in all individuals after controlling for gender, age, and education.
To investigate whether treatment had different effects on the two MDD groups, we performed the following statistical analyses, which were restricted to regions showing significant interactive or group effects at baseline. First, paired t tests were performed between the two time points in the NC group to exclude any regions with significant normal time‐related changes. Then, repeated measurement ANCOVA and post hoc analyses were performed on longitudinal changes in GM volume in the two patient groups to determine the group by treatment interaction effect and the main effects of treatment (within‐subject factor, after 6 months and at baseline) and CM (between‐subject factor, with and without CM) using gender, age, and education as covariates. The significance level was set as the cluster‐forming threshold of P < 0.01 with a GRF‐corrected P < 0.05 at the cluster level. Moreover, for regions with significant interactive or main treatment effects, correlation analyses were performed to assess the relationships between changes in GM volume and changes in clinical variables during the 6‐month treatment period in patients.
3. RESULTS
3.1. Demographic and clinical characteristics
The demographic and clinical characteristics of the study population are provided in Table 1. No significant differences were observed in gender, age, and education among the four groups (ie, MDD‐CM, MDD‐nCM, NC‐CM, and NC‐nCM) (all P‐values >0.61). Individuals with CM had significantly higher CTQ scores than did nCM individuals (P < 0.001). Moreover, HAMD scores were significantly higher in MDD‐CM patients than in MDD‐nCM patients at baseline (P = 0.015). No significant differences were found in the age of onset, number of episodes, current illness duration, or total illness duration between the two patient groups (all P‐values >0.269).
Table 1.
Sample characteristics
| Baseline | MDD‐CM (n = 48) | MDD‐nCM (n = 28) | NC‐CM (n = 48) | NC‐nCM (n = 38) | Statistics |
|---|---|---|---|---|---|
| Age (y) | 33.2 ± 8.7 | 36.1 ± 7.8 | 33.0 ± 7.8 | 33.8 ± 7.4 | F inter(1, 159) = 0.630; P = 0.429a |
| F MDD(1, 159) = 0.882; P = 0.349a | |||||
| F CM(1, 159) = 2.096; P = 0.155a | |||||
| Gender (M/F) | 20/28 | 12/16 | 24/24 | 19/19 | χ2 (3) = 1.021; P = 0.796b |
| Education (y) | 10.7 ± 3.8 | 10.8 ± 4.2 | 11.0 ± 3.2 | 12.8 ± 3.7 | F inter(1, 159) = 2.041; P = 0.142a |
| F MDD(1, 159) = 3.553; P = 0.061a | |||||
| FCM(1, 159) = 2.854; P = 0.093a | |||||
| CTQ | 45.5 ± 10.3 | 31.9 ± 5.5 | 44.7 ± 9.0 | 30.2 ± 4.3 | F inter(1, 159) = 0.008; P = 0.929a |
| F MDD(1, 159) = 0.377; P = 0.540a | |||||
| F CM(1, 159) = 104.419; P < 0.001a, * | |||||
| Emotional abuse | 1.8 ± 0.4 | 1.1 ± 0.3 | 1.8 ± 0.4 | 1.0 ± 0.0 | F inter(1, 159) = 0.069; P = 0.793 |
| F MDD(1, 159) = 0.016; P = 0.900 | |||||
| F CM(1, 159) = 151.433; P < 0.001* | |||||
| Physical abuse | 6.4 ± 2.2 | 5.4 ± 0.9 | 6.1 ± 1.8 | 5.5 ± 0.9 | F inter(1, 159) = 0.271; P = 0.604 |
| F MDD(1, 159) = 0.338; P = 0.562 | |||||
| F CM(1, 159) = 10.654; P = 0.001* | |||||
| Sexual abuse | 5.5 ± 1.3 | 5.1 ± 0.4 | 5.5 ± 1.5 | 5.2 ± 0.6 | F inter(1, 159) = 0.005; P = 0.945 |
| F MDD(1, 159) = 0.119; P = 0.731 | |||||
| F CM(1, 159) = 2.941; P = 0.088 | |||||
| Emotional neglect | 14.5 ± 5.6 | 7.8 ± 3.1 | 14.2 ± 4.3 | 7.3 ± 2.2 | F inter(1, 159) = 0.023; P = 0.880 |
| F MDD(1, 159) = 0.027; P = 0.871 | |||||
| F CM(1, 159) = 89.575; P < 0.001* | |||||
| Physical neglect | 11.0 ± 3.0 | 6.3 ± 1.5 | 11.1 ± 3.2 | 6.5 ± 1.6 | F inter(1, 159) = 0.021; P = 0.885 |
| F MDD(1, 159) = 0.035; P = 0.853 | |||||
| F CM(1, 159) = 109.106; P < 0.001* | |||||
| Onset age (y) | 30.1 ± 8.5 | 31.8 ± 7.5 | NA | NA | T (75) = −0.855; P = 0.395c |
| Episodes (number) | 2.0 ± 1.4 | 2.2 ± 1.4 | NA | NA | T (75) = −0.523; P = 0.603c |
| Current illness duration (mo) | 3.7 ± 3.5 | 3.3 ± 4.4 | NA | NA | T (75) = 0.530; P = 0.598c |
| Total illness duration (mo) | 39.6 ± 52.7 | 53.9 ± 55.8 | NA | NA | T (75) = −1.114; P = 0.269c |
| HAMD | 35.4 ± 7.2 | 31.2 ± 5.7 | NA | NA | T (75) = 6.140; P = 0.015c, * |
| Follow‐up | MDD‐CM (n = 24) | MDD‐nCM (n = 16) | NC‐CM (n = 18) | NC‐nCM (n = 10) | |
| HAMD | 5.13 ± 8.2 | 1.25 ± 2.2 | NA | NA | T (39) = 1.849; P = 0.072 |
Data are presented as the mean ± standard deviation (SD).
*P < 0.05.
P value obtained by two‐way analysis of variance.
P value obtained by two‐tailed Pearson's chi‐square test.
P value obtained by independent‐sample t test.
Both MDD groups had significantly lower HAMD scores (both P‐values<0.001) after the 6‐month treatment period than at baseline. However, no significant group‐by‐time interaction effect or main effect of CM was found in HAMD scores between the two MDD groups (Table 1).
3.2. Gray matter volume differences at baseline
At baseline, VBM analysis revealed a significant MDD‐by‐CM interactive effect on GM volumes in the left parahippocampal gyrus, left entorhinal cortex, right inferior temporal gyrus, left cuneus, left superior temporal gyrus, and left anterior lobe of the cerebellum. Post hoc analysis revealed differences in the patterns of alterations in GM volumes among the four groups. For instance, the GM volume of the left parahippocampus was not significantly different between the two MDD groups but was significantly smaller in the NC‐CM group than in the NC‐nCM group. The volume of the left cuneus was significantly smaller in the MDD‐CM group than in the MDD‐nCM group but significantly larger in the NC‐CM group than in the NC‐nCM group (Figure 1). Significant MDD‐related effects were found in the bilateral parahippocampal gyrus/hippocampus and the right middle temporal gyrus (MDD<NC), left caudate, left posterior lobe of the cerebellum, right inferior temporal gyrus, and left lingual gyrus (MDD>NC; Figure 2). Significant CM effects were observed in the left parahippocampal gyrus/hippocampus (CM<nCM), dorsal medial prefrontal cortex (DMPFC) extending to the supplementary motor area (SMA) and cuneus (CM>nCM; Figure 3).
Figure 1.

MDD‐by‐CM interactive effect on gray matter volume at baseline. Axial sections showing the regions with significant MDD‐by‐CM interactive effects on gray matter volume (corrected P < 0.05). L, left; R, right; PHG, parahippocampal gyrus; ERC, entorhinal cortex; ITG, inferior temporal gyrus; CUN, cuneus; STG, superior temporal gyrus; ALC, anterior lobe of the cerebellum
Figure 2.

Main effect of MDD on gray matter volume at baseline. Axial sections showing the regions with a significant main effect of MDD on gray matter volume (corrected P < 0.05). The color map indicates the t values of post hoc analyses, with a warm color indicating a larger gray matter volume and a cold color indicating a smaller gray matter volume in MDD. L, left; R, right; PHG/HG, parahippocampal gyrus/hippocampus; MTG, middle temporal gyrus; CAU, caudate; PLC, posterior lobe of the cerebellum, ITG, inferior temporal gyrus; LING, lingual gyrus
Figure 3.

Main effect of CM on gray matter volume at baseline. Axial sections showing the regions with significant main effects of CM on gray matter volume (corrected P < 0.05). The color map indicates the t values of post hoc analyses, with a warm color indicating a larger gray matter volume and a cold color indicating a smaller gray matter volume in participants with CM than in participants without CM. L, left; R, right; PHG/HG, parahippocampal gyrus/hippocampus; DMPFC, dorsal medial prefrontal cortex; CUN, cuneus
3.3. Treatment effects on gray matter volume
We did not observe any significant treatment‐by‐CM interactive effects on GM volume. However, we found a significant treatment‐related main effect in the right middle temporal gyrus in which GM volume was significantly higher in both MDD groups after 6 months of treatment with paroxetine. This result indicated that the effects of antidepressant treatment on GM volume did not discriminate between MDD patients with and without CM (Figure 4). The cluster sizes, corrected P‐values and other details of above reported clusters were showed in Table 2.
Figure 4.
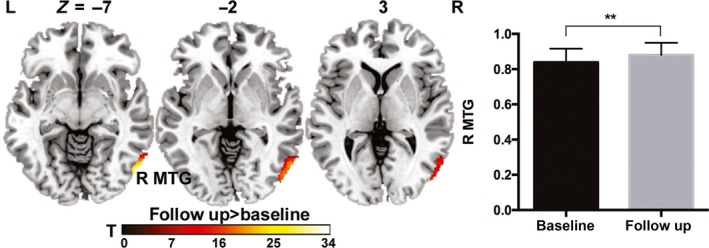
Treatment effect on gray matter volume in MDD patients. Axial sections showing the regions with significant treatment effects on gray matter volume in patients with MDD (corrected P < 0.05). The color map indicates the t values of post hoc analyses, with a warm color indicating higher gray matter volume after 6 mo of paroxetine treatment. L, left; R, right; MTG, middle temporal gyrus
Table 2.
Brain regions showing significant effects
| Brain Region | BA | Direction | x | y | z | F‐value | Corrected P‐value | Cluster size (mm3) |
|---|---|---|---|---|---|---|---|---|
| Baseline MDD‐by‐CM interactive effect | ||||||||
| Left parahippocampal gyrus | NA | MDD‐CM<NC‐nCM | −28.5 | −46.5 | −12 | 15.67 | 7.7 × 10− 5 | 2389.5 |
| MDD‐nCM<NC‐nCM | ||||||||
| NC‐CM<NC‐nCM | ||||||||
| Left entorhinal cortex | 34 | MDD‐CM>NC‐CM | −15 | −12 | −33 | 13.61 | 9.9 × 10− 5 | 2332.13 |
| MDD‐nCM<NC‐nCM | ||||||||
| NC‐CM<NC‐nCM | ||||||||
| Right inferior temporal gyrus | 20 | MDD‐CM>MDD‐nCM | 46.5 | −31.5 | −21 | 15.90 | 0.007 | 1400.63 |
| MDD‐CM>NC‐CM | ||||||||
| MDD‐nCM<NC‐CM | ||||||||
| Left cuneus | 17 | MDD‐CM<MDD‐nCM | −7.5 | −72 | 6 | 13.91 | 2.4 × 10− 6 | 3263.63 |
| MDD‐nCM>NC‐nCM | ||||||||
| NC‐CM<NC‐nCM | ||||||||
| Left superior temporal gyrus | 22 | MDD‐CM<MDD‐nCM | −51 | −33 | 13.5 | 9.85 | 0.019 | 1204.88 |
| MDD‐nCM>NC‐nCM | ||||||||
| Left anterior lobe of the cerebellum | NA | MDD‐CM<MDD‐nCM | −6 | −49.5 | −19.5 | 11.10 | 0.011 | 1316.25 |
| MDD‐CM<NC‐CM | ||||||||
| MDD‐nCM>NC‐nCM | ||||||||
| Baseline MDD main effect | ||||||||
| Left parahippocampal gyrus/hippocampus | NA | MDD<NC | −24 | −37.5 | −10.5 | 14.22 | 1.1 × 10− 7 | 4215.38 |
| Right parahippocampal gyrus/hippocampus | NA | MDD<NC | 31.5 | −43.5 | −13.5 | 9.92 | 0.026 | 1167.75 |
| Right middle temporal gyrus | 21 | MDD<NC | 60 | −63 | 1.5 | 13.98 | 1.8 × 10− 7 | 4083.75 |
| Left caudate | NA | MDD>NC | −15 | 27 | 10.5 | 11.63 | 0.001 | 1852.88 |
| Right inferior temporal gyrus | 20 | MDD>NC | 43.5 | −66 | −19.5 | 16.35 | 0.016 | 1269.00 |
| Left posterior lobe of the cerebellum | NA | MDD>NC | −52.5 | −51 | −25.5 | 12.37 | 0.004 | 1552.50 |
| Left lingual gyrus | 18 | MDD>NC | −10.5 | −88.5 | −19.5 | 13.71 | 0.034 | 1117.13 |
| Baseline CM main effect | ||||||||
| Left parahippocampal gyrus/hippocampus | NA | CM<nCM | −3 | −45 | 6 | 15.73 | 6.9 × 10− 8 | 4961.25 |
| Dorsal medial prefrontal cortex | 9/6 | CM>nCM | −6 | −3 | 61.5 | 20.39 | 2.8 × 10− 10 | 6962.63 |
| Right cuneus | 17 | CM>nCM | 1.5 | −78 | 9 | 10.08 | 0.032 | 1265.63 |
| Treatment effect | ||||||||
| Right middle temporal gyrus | 21 | Follow‐up>Baseline | 54 | −72 | −9 | 34.62 | 0.002 | 3354.75 |
BA, Brodmann Area; MDD, major depressive disorder; CM, childhood maltreatment; NA, not available; NC, normal control.
3.4. Correlation between gray matter volume and clinical variables
At baseline, the GM volume of the right middle temporal gyrus was significantly and negatively correlated with HAMD scores (R = −0.241, P = 0.040) in all MDD patients when gender, age, and education were used as covariates. The GM volume of the left parahippocampal gyrus/hippocampus was significantly and negatively correlated with CTQ scores across all individuals (R = −0.221, P = 0.005) when gender, age, and education were used as covariates. Moreover, we found a significantly negative correlation between changes in GM volume in the right middle temporal gyrus and changes in HAMD scores in MDD patients (R = −0.315, P = 0.048; Figure 5). Additionally, we found a tendency toward a positive correlation between the average daily dose of paroxetine and volume changes in the right middle temporal gyrus in MDD patients (R = 0.326, P = 0.052).
Figure 5.

Correlations between gray matter volume and clinical variables. (A) Correlation between the adjusted gray matter volume of the right middle temporal gyrus and adjusted HAMD scores across all MDD patients at baseline when gender, age, and education were used as covariates. (B) Correlation between the adjusted gray matter volume of the left parahippocampal gyrus/hippocampus and adjusted CTQ across all participants at baseline when gender, age, and education were used as covariates. (C) Correlation between changes in the gray matter volume of the right middle temporal gyrus and changes in HAMD scores across all MDD patients
4. DISCUSSION
In the current study, we found significant MDD‐by‐CM interactive effects on GM volume mainly in the left parahippocampal gyrus, entorhinal cortex, and right inferior temporal gyrus. The GM volumes of the right middle temporal gyrus and parahippocampal gyrus/hippocampus were significantly smaller in patients with MDD than in healthy controls at baseline. More importantly, a treatment‐related increase in GM volume occurred in the right middle temporal gyrus in both MDD groups. Moreover, changes in GM volume of the region were correlated with changes in HAMD scores.
Our results demonstrate that the GM volume of the right middle temporal gyrus is smaller in MDD patients than in healthy controls at baseline. The middle temporal gyrus is suggested to participate in visual and auditory functions, which are crucial to the emotional processing of facial moods and working memory.27 Dysfunctions in emotional regulation and cognitive function are widely reported in the pathophysiology of depression.28 Moreover, the GM volume of this region increased after 6 months of paroxetine treatment, which is in agreement with previous studies focusing on antidepressant pharmacotherapy effects on GM volume in depressive patients.18 A possible reason that antidepressant drugs can reverse GM volume changes in depressive patients might be due to their capacity to alter synaptic plasticity and the expression of neurotrophic factors.29 Selective serotonin reuptake inhibitors (SSRIs) exert effects on brain structures, including the temporal lobe, through the serotonergic system in MDD patients.30 Moreover, the change in GM volume was significantly associated with the reversal of depressive symptoms. In our results, MDD patients demonstrated increased GM volume of the middle temporal gyrus regardless of CM, indicating that the two groups of patients shared targets in GM volume during SSRI treatment. Hence, our study provides neurobiological evidence underlying the clinical observation that MDD patients with or without CM have the same outcomes when using antidepressant drugs.
Our results demonstrate that parahippocampal gyrus/hippocampus volume is smaller in MDD patients with CM, MDD patients without CM and healthy controls with CM than in controls without CM. The hippocampus is involved in regulating emotion that appears to be critical to the biological basis of MDD and has sensitivity to stress that occurs in childhood. The hippocampus is vulnerable to the neurotoxic effects of excessive glucocorticoid levels, which often indicate high levels underlying chronic stress31 and might explain the hippocampal atrophy often observed in individuals with CM.11, 32 However, GM volume reduction in the hippocampus is frequently reported in patients with MDD.33, 34, 35 Recent studies have suggested that hippocampal volume reductions may result from CM but not MDD because a significant correlation between hippocampal volume and depression is lost when CM is considered as a covariant.13, 16, 35 Here, our results indicate that hippocampal atrophy is not largely due to CM in depression. Moreover, findings regarding whether an antidepressant drug can reverse hippocampal atrophy remain inconsistent. For instance, Vermetten et al showed that reduced hippocampal volume was reversed after 9‐12 months of paroxetine treatment in 20 patients with posttraumatic stress disorder.36 Some longitudinal studies suggest that hippocampal volume does not change after SSRI treatment in depression.37, 38 We did not find during‐treatment effects in the hippocampus in MDD patients with or without CM, providing experimental evidence that the volume of hippocampus has not reverse after SSRI treatment in depression. These varying results may be largely due to different treatment periods and patient heterogeneity. Long‐term antidepressant treatment more likely led to hippocampal volume changes than did short‐term treatment.39 MDD‐by‐CM interactive effects were also observed in the entorhinal cortex, inferior temporal gyrus, cuneus, superior temporal gyrus and so on. The entorhinal cortex and cuneus are involved in episodic memory,40, 41 and the inferior temporal gyrus is involved in semantic memory.42 Prior studies suggested that both MDD patients with and without CM demonstrated abnormalities in memory retrieval,43 and our results might indicate a possible neurobiological mechanism for this functional reduction. MDD patients with CM showed a significantly larger volume of the superior temporal gyrus than did MDD patients without CM. The superior temporal gyrus is involved in emotional processing, which is strongly associated with depression.44 Similar to our results, Rottstädt et al revealed a larger GM volume of the superior temporal gyrus in MDD patients than in healthy controls.45 Another study also found superior temporal gyrus volume abnormalities in MDD patients.44 In addition, the posterior superior temporal gyrus is in the primary auditory cortex, which often shows impairment in individuals with CM, particularly those with parental verbal abuse.46, 47
Compared with participants without CM, participants with CM had larger GM volumes in the DMPFC and SMA. The DMPFC and SMA are involved in cognitive control, especially error monitoring.48 Error detection might be a crucial capacity for maltreated individuals because mistakes can result in harsh punishment in an adverse environment.49, 50, 51 Thus, maltreated children often have a highly active error‐monitoring system.48 Similar to our study, another study found that the GM volumes of the DMPFC in maltreated participants were larger than those in nonmaltreated participants.16 The GM volumes of the caudate, posterior lobe of the cerebellum and left lingual gyrus in MDD patients were larger than those in healthy controls. The caudate, especially the ventral caudate, is involved in reward‐related and emotion processing.52 The posterior lobe of the cerebellum and left lingual gyrus are also involved in cognitive and affective processes.9 Abnormal GM volumes of these brain regions have been previously reported in MDD patients.53, 54 These results collectively suggest that abnormalities in brain circuits related to reward and emotion regulation underlie the clinical symptoms observed in patients with MDD.
4.1. Limitations and further considerations
There are several issues that warrant further consideration. First, during the follow‐up stage, we collected data from only part of the MDD patients at baseline, largely because of a large migration of workers in the countryside. However, there was no significant difference in the baseline HAMD scores (P = 0.127) between MDD patients with and without follow‐up scans, indicating unbiased sampling in the follow‐up data. Second, we found shared structural brain alterations during treatment in MDD patients with and without CM. A substantial amount of evidence has revealed significant changes in brain functional neuroimaging in patients with MDD after treatment compared to that at baseline. MDD patients with and without CM have shared or different treatment effects on functional brain characteristics that must be further studied. Finally, psychological therapy might be more effective than drug therapy in MDD patients with a history of CM.7, 8 However, whether there are differences in neuroimaging‐detectable changes between maltreated MDD patients treated with psychological therapy and those treated with antidepressant drug therapy remains to be explored.
CONFLICT OF INTEREST
The authors declare no conflict of interest.
Supporting information
ACKNOWLEDGMENTS
The study was supported by Ministry of Science and Technology of China (2015BAI13B02), the National Natural Science Foundation of China (81671767, 81171286 and 91232714), the National Science Foundation of Beijing Municipality (Z161100004916027) and Science Foundation of Ministry of Education of China (2017XTCX04). The authors sincerely thank all persons who participated in the study and the doctors at the magnetic resonance imaging Section of the Zhumadian Psychiatry Hospital for providing technical assistance.
Lu X‐W, Guo H, Sun J‐R, et al. A shared effect of paroxetine treatment on gray matter volume in depressive patients with and without childhood maltreatment: A voxel‐based morphometry study. CNS Neurosci Ther. 2018;24:1073–1083. 10.1111/cns.13055
Contributor Information
Ming‐Rui Xia, Email: mxia@bnu.edu.cn.
Ling‐Jiang Li, Email: LLJ2920@csu.edu.cn.
REFERENCES
- 1. Kessler RC, Chiu WT, Demler O, Walters EE. Prevalence, severity, and comorbidity of 12‐month DSM‐IV disorders in the national comorbidity survey replication. Arch Gen Psychiatry. 2005;62:617‐627. [DOI] [PMC free article] [PubMed] [Google Scholar]
- 2. Fang XM, Fry DA, Ji K, et al. The burden of child maltreatment in China: a systematic review. Bull World Health Organ. 2015;93:176‐185. [DOI] [PMC free article] [PubMed] [Google Scholar]
- 3. Norman RE, Byambaa M, De R, Butchart A, Scott J. The long‐term health consequences of child physical abuse, emotional abuse, and neglect: a systematic review and meta‐analysis. PLOS Med. 2012;9:1‐31. [DOI] [PMC free article] [PubMed] [Google Scholar]
- 4. Nelson J, Klumparendt A, Doebler P, Ehring T. Childhood maltreatment and characteristics of adult depression: meta‐analysis. Br J Psychiatry. 2017;210:96‐104. [DOI] [PubMed] [Google Scholar]
- 5. Keller MB. Past, present, and future directions for defining optimal treatment outcome in depression: remission and beyond. JAMA. 2003;289:3152‐3160. [DOI] [PubMed] [Google Scholar]
- 6. Miniati M, Rucci P, Benvenuti A, et al. Clinical characteristics and treatment outcome of depression in patients with and without a history of emotional and physical abuse. J Psychiatr Res. 2010;44:302‐309. [DOI] [PMC free article] [PubMed] [Google Scholar]
- 7. Nemeroff CB, Heim CM, Thase ME, et al. Differential responses to psychotherapy versus pharmacotherapy in patients with chronic forms of major depression and childhood trauma. Proc Natl Acad Sci USA. 2003;100:14293‐14296. [DOI] [PMC free article] [PubMed] [Google Scholar]
- 8. Miller S, McTeague LM, Gyurak A, et al. Cognition‐childhood maltreatment interactions in the prediction of antidepressant outcomes in major depressive disorder patients: Results from the iSPOT‐D trial. Depress Anxiety. 2015;32:594‐604. [DOI] [PMC free article] [PubMed] [Google Scholar]
- 9. Minichino A, Bersani FS, Trabucchi G, et al. The role of cerebellum in unipolar and bipolar depression: a review of the main neurobiological findings. Riv Psichiatr. 2014;49:124‐131. [DOI] [PubMed] [Google Scholar]
- 10. Zhang HW, Li L, Wu M, et al. Brain gray matter alterations in first episodes of depression: a meta‐analysis of whole‐brain studies. Neurosci Biobehav Rev. 2016;60:43‐50. [DOI] [PubMed] [Google Scholar]
- 11. Dannlowski U, Stuhrmann A, Beutelmann V, et al. Limbic scars: long‐term consequences of childhood maltreatment revealed by functional and structural magnetic resonance imaging. Biol Psychiatry. 2012;71:286‐293. [DOI] [PubMed] [Google Scholar]
- 12. Lim L. Joaquim Radua, Katya Rubia. Gray matter abnormalities in childhood maltreatment: a voxel‐wise meta‐analysis. Am J Psychiatry. 2014;171:854‐863. [DOI] [PubMed] [Google Scholar]
- 13. Opel N, Redlich R, Zwanzger P, et al. Hippocampal atrophy in major depression: a function of childhood maltreatment rather than diagnosis? Neuropsychopharmacology. 2014;39:2723‐2731. [DOI] [PMC free article] [PubMed] [Google Scholar]
- 14. Vythilingam M, Heim C, Newport J, et al. Childhood trauma associated with smaller hippocampal volume in women with major depression. Am J Psychiatry. 2002;159:2072‐2080. [DOI] [PMC free article] [PubMed] [Google Scholar]
- 15. Gerritsen L, van Velzen L, Schmaal L, et al. Childhood maltreatment modifies the relationship of depression with hippocampal volume. Psychol Med. 2015;45(16):3517‐3526. [DOI] [PubMed] [Google Scholar]
- 16. Chaney A, Carballedo A, Amico F, et al. Effect of childhood maltreatment on brain structure in adult patients with major depressive disorder and healthy participants. J Psychiatry Neurosci. 2014;39:50‐59. [DOI] [PMC free article] [PubMed] [Google Scholar]
- 17. Yang SY, Cheng YQ, Mo Y, et al. Childhood maltreatment is associated with gray matter volume abnormalities in patients with first‐episode depression. Psychiatr Res. 2017;268:27‐34. [DOI] [PubMed] [Google Scholar]
- 18. Liu J, Xu X, Luo Q, et al. Brain grey matter volume alterations associated with antidepressant response in major depressive disorder. Sci Rep. 2017;7:10464. [DOI] [PMC free article] [PubMed] [Google Scholar]
- 19. Joshi SH, Espinoza RT, Pirnia T, et al. Structural plasticity of the hippocampus and amygdala induced by electroconvulsive therapy in major depression. Biol Psychiatry. 2016;79:282‐292. [DOI] [PMC free article] [PubMed] [Google Scholar]
- 20. Bouckaert F, De Winter FL, Emsell L, et al. Grey matter volume increase following electroconvulsive therapy in patients with late life depression: a longitudinal MRI study. J Psychiatry Neurosci. 2016;41:105‐114. [DOI] [PMC free article] [PubMed] [Google Scholar]
- 21. Fang JF, Mao N, Jiang XY, Li XR, Wang B, Wang Q. Functional and anatomical brain abnormalities and effects of antidepressant in major depressive disorder: combined application of voxel‐based morphometry and amplitude of frequency fluctuation in resting state. J Comput Assist Tomogr. 2015;39:766‐773. [DOI] [PubMed] [Google Scholar]
- 22. Areán PA, Raue P, Mackin RS, Kanellopoulos D, McCulloch C, Alexopoulos GS. Problem‐solving therapy and supportive therapy in older adults with major depression and executive dysfunction. Am J Psychiatry. 2010;167:1391‐1398. [DOI] [PMC free article] [PubMed] [Google Scholar]
- 23. Fu WQ, Yao SQ. Initial reliability and validity of childhood truama questinnaire(CTQ‐SF) apllied in chinese college students. Chin J Clin Psychol. 2005;13:40‐42. [Google Scholar]
- 24. Bernstein DP, Fink L, Handelsman L, Foote J, Lovejoy M, Wenzel K. Initial reliability and validity of a new retrospective measure of child abuse and neglect. Am J Psychiatry. 1994;151:1132‐1136. [DOI] [PubMed] [Google Scholar]
- 25. Bernstein DP, Stein JA, Newcomb MD, et al. Development and validation of a brief screening version of the Childhood Trauma Questionnaire. Child Abuse Negl. 2003;27:169‐190. [DOI] [PubMed] [Google Scholar]
- 26. Ashburner J. A fast diffeomorphic image registration algorithm. NeuroImage. 2007;38:95‐113. [DOI] [PubMed] [Google Scholar]
- 27. Pavuluri MN, Passarotti AM, Fitzgerald JM, Wegbreit E, Sweeney JA. Risperidone and divalproex differentially engage the fronto‐striato‐temporal circuitry in pediatric mania: a pharmacological fMRI study. J Am Acad Child Adolesc Psychiatry. 2012;51:157‐170. [DOI] [PMC free article] [PubMed] [Google Scholar]
- 28. Cusi AM, Nazarov A, Holshausen K, Macqueen GM, McKinnon MC. Systematic review of the neural basis of social cognition in patients with mood disorders. J Psychiatry Neurosci. 2012;37:154‐169. [DOI] [PMC free article] [PubMed] [Google Scholar]
- 29. Manji HK, Duman RS. Impairments of neuroplasticity and cellular resilience in severe mood disorders: implications for the development of novel therapeutics. Psychopharmacol Bull. 2001;35(2):5‐49. [PubMed] [Google Scholar]
- 30. Spies M, Knudsen GM, Lanzenberger R, Kasper S. The serotonin transporter in psychiatric disorders: Insights from PET imaging. Lancet Psychiat. 2015;2:743‐755. [DOI] [PubMed] [Google Scholar]
- 31. Knoops AJ, Gerritsen L, van der Graaf Y, Mali WP, Geerlings MI. Basal hypothalamic pituitary adrenal axis activity and hippocampal volumes: the SMART‐Medea study. Biol Psychiatry. 2010;67:1191‐1198. [DOI] [PubMed] [Google Scholar]
- 32. Snyder JS, Soumier A, Brewer M, Pickel J, Cameron HA. Adult hippocampal neurogenesis buffers stress responses and depressive behaviour. Nature. 2011;476:458‐461. [DOI] [PMC free article] [PubMed] [Google Scholar]
- 33. Sheline YI, Wang PW, Gado MH, Csernansky JG, Vannier MW. Hippocampal atrophy in recurrent major depression. Proc Natl Acad Sci USA. 1996;93:3908‐3913. [DOI] [PMC free article] [PubMed] [Google Scholar]
- 34. Videbech P, Ravnkilde B. Hippocampal volume and depression a meta analysis of MRI studies. Am J Psychiatry. 2004;161:1957‐1966. [DOI] [PubMed] [Google Scholar]
- 35. Teicher MH, Anderson CM, Polcari A. Childhood maltreatment is associated with reduced volume in the hippocampal subfields CA3, dentate gyrus, and subiculum. Proc Natl Acad Sci USA. 2012;13:563‐572. [DOI] [PMC free article] [PubMed] [Google Scholar]
- 36. Vermetten E, Vythilingam M, Southwick SM, Charney DS, Bremner JD. Long‐term treatment with paroxetine increases verbal declarative memory and hippocampal volume in posttraumatic stress disorder. Biol Psychiatry. 2003;54:693‐702. [DOI] [PMC free article] [PubMed] [Google Scholar]
- 37. Godlewska BR, Hasselmann H, Igoumenou A, Norbury R, Cowen PJ. Short‐term escitalopram treatment and hippocampal volume. Psychopharmacology. 2014;231:4579‐4581. [DOI] [PMC free article] [PubMed] [Google Scholar]
- 38. Vythilingam M, Vermetten E, Anderson GM, et al. Hippocampal volume, memory, and cortisol status in major depressive disorder: effects of treatment. Biol Psychiatry. 2004;56:101‐112. [DOI] [PubMed] [Google Scholar]
- 39. Frodl T, Jäger M, Smajstrlova I, et al. Effect of hippocampal and amygdala volumes on clinical outcomes in major depression: a 3‐year prospective magnetic resonance imaging study. J Psychiatry Neurosci. 2008;33:423‐430. [PMC free article] [PubMed] [Google Scholar]
- 40. Knöchel VO, Reinke B, Feddern R, et al. Verbal episodic memory deficits in remitted bipolar patients: a combined behavioural and fMRI study. J Affect Disord. 2013;150:430‐440. [DOI] [PubMed] [Google Scholar]
- 41. Lipton PA, Eichenbaum H. Complementary roles of hippocampus and medial entorhinal cortex in episodic memory. Neural Plast. 2008;1–8. [DOI] [PMC free article] [PubMed] [Google Scholar]
- 42. Chan D, Fox NC, Scahill RI, et al. Patterns of temporal lobe atrophy in semantic dementia and alzheimer’s disease. Ann Neurol. 2001;49:433‐442. [PubMed] [Google Scholar]
- 43. Saleh A, Potter GG, McQuoid DR, et al. Effects of early life stress on depression, cognitive performance and brain morphology. Psychol Med. 2017;47:171‐181. [DOI] [PMC free article] [PubMed] [Google Scholar]
- 44. Takahashi T, Yucel M, Lorenzetti V, et al. An MRI study of the superior temporal subregions in patients with current and past major depression. Prog Neuropsychopharmacol Biol Psychiatry. 2010;34:98‐103. [DOI] [PubMed] [Google Scholar]
- 45. Rottstadt F, Han P, Weidner K, et al. Reduced olfactory bulb volume in depression‐a structural moderator analysis. Hum Brain Mapp. 2018;39:2573‐2582. [DOI] [PMC free article] [PubMed] [Google Scholar]
- 46. Teicher MH, Samson JA, Anderson CM, Ohashi K. The effects of childhood maltreatment on brain structure, function and connectivity. Nat Rev Neurosci. 2016;17:652‐666. [DOI] [PubMed] [Google Scholar]
- 47. Tomoda A, Sheu YS, Rabi K, et al. Exposure to parental verbal abuse is associated with increased gray matter volume in superior temporal gyrus. NeuroImage. 2011;1:S280‐S286. [DOI] [PMC free article] [PubMed] [Google Scholar]
- 48. Lim L, Hart H, Mehta MA, et al. Neural correlates of error processing in young people with a history of severe childhood abuse: an fMRI study. Am J Psychiatry. 2015;172:892‐900. [DOI] [PubMed] [Google Scholar]
- 49. Gehring WJ, Goss B, Coles M, David EM, Donchin E. A neural system for error detection and compensation. Psychol Sci. 1993;4:385‐390. [Google Scholar]
- 50. Nachev P, Kennard C, Husain M. Functional role of the supplementary and pre‐supplementary motor areas. Nat Rev Neurosci. 2008;9:856‐869. [DOI] [PubMed] [Google Scholar]
- 51. Lemogne C, Gorwood P, Bergouignan L, Pélissola A, Lehéricy S, Fossati P. Negative affectivity, self‐referential processing and the cortical midline structures. Soc Cogn Affect Neur. 2011;6:426‐433. [DOI] [PMC free article] [PubMed] [Google Scholar]
- 52. Martino AD, Scheres A, Margulies DS, et al. Functional connectivity of human striatum: A resting state fMRI study. Cereb Cortex. 2008;18:2735‐2747. [DOI] [PubMed] [Google Scholar]
- 53. Kim MJ, Hamilton JP, Gotlib IH. Reduced caudate gray matter volume in women with major depressive disorder. Psychiatr Res. 2008;164:114‐122. [DOI] [PMC free article] [PubMed] [Google Scholar]
- 54. Harvey PO, Pruessner J, Czechowska Y, Lepage M. Individual differences in trait anhedonia: a structural and functional magnetic resonance imaging study in non‐clinical subjects. Mol Psychiatry. 2007;12(703):767‐775. [DOI] [PubMed] [Google Scholar]
Associated Data
This section collects any data citations, data availability statements, or supplementary materials included in this article.
Supplementary Materials