Summary
Aims
Oligodendrocytes, especially oligodendrocyte precursor cells, are known to be sensitive to hypoxic and metabolic stresses. Vulnerability of oligodendrocytes is considered a contributing factor to white matter dysfunction. However, little is known about the energy processing characteristics of oligodendrocyte lineage cells under basal and metabolic stress conditions. The aim of this study was to identify the energy requirements and cellular responses of oligodendrocytes at different developmental stages.
Methods
We compared the metabolic stress responses between myelinating oligodendrocytes (OLs) and oligodendrocyte precursor cells (OPCs). Differential regulation of cellular response was also investigated.
Results
We found that, following cerebral ischemia, monocarboxylate transporter 1 (MCT1) expression was upregulated in the peri‐infarct striatum but not in the cortex of the brain. In vitro ischemia models were used to induce oligodendrocyte stress as well. An increase in MCT1 expression was detected in OPCs after a mild oxygen‐glucose deprivation. Double‐labeled immunohistochemical analysis revealed that OPCs and OLs responded differently to metabolic stresses and that the susceptibility to metabolic stresses of OPCs and OLs was associated with their distinct expression profiles of MCT1.
Conclusion
Taken together, this study shows that MCT1 plays a role in the responses of OPCs and OLs to metabolic and ischemic stresses and suggests that redistribution of energy substrates is a determinant in white matter injury.
Keywords: metabolic stress, monocarboxylate transporter 1, oligodendrocyte
1. INTRODUCTION
In the central nervous system (CNS), oligodendrocytes are responsible for myelin production. Oligodendrocytes maximize the conduction velocity of action potentials by forming electrically insulating layers around axons.1 In addition, oligodendrocytes metabolically support the survival of axons.2 Long axonal tracts depend on oligodendrocytes for the demanding metabolic energy needs of rapidly conducting action potentials.3
There are a number of substrate transporters that contribute to the energy exchange within the brain. Glucose is transported across the blood‐brain barrier via glucose transporters (GLUTs). Glucose can be taken up through GLUT1, which is expressed on astrocytes and oligodendrocytes, and GLUT3, which is expressed on neurons. Glucose metabolism via the glycolytic pathway results in two molecules of ATP and one molecule of pyruvate, which is then converted into lactate. Lactate is a highly dynamic metabolite that plays key physiological roles in the CNS. It transports into and out of the cell through monocarboxylate transporters (MCTs). Monocarboxylate transporters (MCTs) have different tissue distributions, correlating with different affinities for the substrate lactate. The high‐affinity isoform MCT2 is expressed on neurons that are highly oxidative and mainly import lactate, while the low‐affinity isoform MCT4 is expressed on astrocytes that can export lactate to other cell types. Interestingly, the intermediate isoform MCT1 is found on oligodendrocytes that facilitate net lactate transport across cell membranes in response to neuronal activity changes. After entering the cell, continued metabolism of lactate into acetyl‐CoA generates 34 molecules of ATP. On the other hand, in oligodendrocytes specifically, it may be critical that lactate is converted to pyruvate. This is because pyruvate is an important intermediary for fatty acid biosynthesis and myelin production.
Recent research on myelin/axon energy coupling reflects the increased awareness of metabolic stresses being a major contributor to neurodegeneration. Metabolic stresses have two major components, oxygen starvation and glucose deprivation. These alone or in combination contribute to neuron/glia damage and death. Metabolic stresses can also be caused by inflammatory injury, which may lead to local hypoxic ischemia. This has been reported in multiple sclerosis (MS) lesions. It is very difficult to pinpoint the cell types and distinct processes that are critical for loss of energy homeostasis because the deprivation of energy occurs in a neuron‐glia (astrocytes and oligodendrocytes) network. Although oligodendrocytes are reportedly sensitive to hypoxic stress, resulting in white matter (WM) dysfunction,4 little is known about the energy processing characteristics of oligodendrocyte lineage cells under basal conditions and metabolic stresses.
The aim of this study was to identify energetic requirements and cellular responses for different developmental stages of oligodendrocytes. We compared myelinating oligodendrocytes (OLs) with oligodendrocyte precursor cells (OPCs) under basal and metabolic stress conditions. Differential regulations of cellular response and lactate processing ability were also investigated.
2. MATERIALS AND METHODS
2.1. Reagents and antibodies
Primary antibodies used in this study include the following: Rabbit polyclonal anti‐MCT1 (sc‐50324, Santa Cruz, Dallas, TX, USA); mouse polyclonal anti‐MCT1 (ab90582, Abcam, Cambridge, MA, USA); goat polyclonal anti‐MBP (sc‐13914, Santa Cruz); mouse monoclonal anti‐NG2 and rabbit polyclonal anti‐NG2 (ab129051, Abcam); rabbit polyclonal anti‐PDGFRα+ (#3164, Cell Signaling, Beverly, MA, USA). MCT1‐transfected 293T cells lysate, mouse heart extract, and rat skeletal muscle extract were used as positive controls, and MCT1 siRNA (sc‐40115, Santa Cruz) was used as knockdown control for the MCT1 antibodies. The secondary antibodies used for immunofluorescence were Alexa Fluor 488, or 594 donkey anti‐mouse, rabbit, or goat IgG (Thermo Fisher scientific, Eugene, OR, USA), and the HRP‐conjugated secondary antibodies used for Western blot analysis were from Thermo Fisher Scientific. For antibody validation, MCT1 knockdown was carried out using Lipofectamine RNAiMAX (Thermo Fisher Scientific) on cells seeded 24 hours prior.
2.2. Animals
All experiments were performed under animal protocols approved by the University of Manitoba Institutional Animal Care and Use Committee. For the in vivo study, all mice were adult male, 12‐14 weeks old, and obtained from Central Animal Care Services at the University of Manitoba. For the in vitro study, timed‐pregnant mice and 1‐day‐old neonatal Sprague Dawley rat pups were obtained from the Central Animal Care Services at the University of Manitoba. Animals were housed under temperature‐controlled conditions with a 12‐hour light/dark cycle and ad libitum access to water and food. All efforts were made to minimize animal suffering and reduce the number of animals used.
2.3. Middle cerebral artery occlusion
Transient focal cerebral ischemia was induced using an intraluminal filament model of middle cerebral artery occlusion (MCAO), as previously described.5 Briefly, mice were anesthetized with isoflurane (1.5%‐2%), and rectal temperature was maintained at 37°C. A 6‐0 silicone‐coated nylon monofilament (Doccol, Sharon, MA, USA) was inserted via the right external carotid artery until it obstructed the MCA, and the common carotid artery was simultaneously ligated for the duration of the ischemic period. Mice with more than 70% flow reduction during the ischemic period were included in this study. For the sham MCAO surgery, vessels were visualized and cleared from connective tissue, but the MCA was not occluded. After surgery, animals were allowed to recover in a warmed chamber before being returned to their home cages.
2.4. Tissue preparation
At 72 hours following reperfusion, mice were anesthetized by isoflurane overdose. Upon cessation of reflexes, mice were transcardially perfused with phosphate‐buffered saline. The brains were dissected immediately after decapitation. Brains were cut into seven equally spaced (2 mm) coronal blocks for Western blot assay. For 2,3,5‐triphenyltetrazolium chloride (TTC) staining, coronal brain tissue slices (2 mm in thickness) were stained for 15 minutes at 37°C with 2% TTC (Sigma, St Louis, MO, USA) in phosphate‐buffered saline (PBS) solution.
2.5. Primary cell culture
Oligodendrocyte precursor cells (OPCs) were obtained postnatal day 1 rats according to the original procedure of McCarthy and de Vellis.6 Briefly, rat pups were sacrificed, and cerebral cortices were dissected and mechanically dissociated. Mixed cultures were then grown in Dulbecco's Modified Eagle's Medium (DMEM, Hyclone, Logan, UT, USA) supplemented with 20% fetal bovine serum (Thermo Fisher Scientific). At 10 days in vitro, flasks containing the cultures were shaken at 220 rpm for 1 hour to remove microglia. The cultures were then shaken at 220 rpm overnight to dislodge the loosely attached OPCs. Oligodendrocyte precursor cells (OPCs) were further purified from astrocytes and microglia by being placed in uncoated tissue culture dishes for 1 hour. The nonadherent cells were collected and cultured in a chemically defined medium containing 4 mmol/L L‐glutamine, 1 mmol/L sodium pyruvate, 0.1% bovine serum albumin (BSA), 50 μg/mL Apo‐transferrin, 5 μg/mL insulin, 30 nmol/L sodium selenite, 10 nmol/L D‐biotin, and 10 nmol/L hydrocortisone. This chemically defined medium was supplemented with 10 ng/mL PDGF‐AA and 10 ng/mL bFGF (PeproTech, Rocky Hill, NJ, USA). Cells were seeded at the density of 5 × 10⁴ cells/cm2 into T‐25 culture flasks or 24‐well plates with 12‐mm‐diameter glass coverslips for experiments. To obtain differentiating OL cultures, OPCs were maintained in the chemically defined medium as above, but supplemented with 5 μg/mL N‐acetyl‐L‐cysteine, 15 nmol/L triiodothyronine, and 10 ng/mL CNTF (PeproTech).
For neurosphere cultures, primary mouse CNS tissue was mechanically dissociated in NeuroCult basal medium with NeuroCult proliferation supplement (StemCell Technologies, Vancouver, BC, Canada) and 20 ng/mL human EGF (PeproTech). Neurospheres were harvested on passage 1 or 2, dissociated into single‐cell suspension, seeded at the density of 5 × 10⁴ cells/cm2 into 24‐well plates with 12‐mm‐diameter glass coverslips, and differentiated in NeuroCult basal medium with NeuroCult differentiation supplement (StemCell Technologies).
2.6. Immunohistochemistry
Samples were fixed with 4% paraformaldehyde for 15 minutes at room temperature. Following fixation, coverslips were washed with PBS, permeabilized for 5 minutes with 0.1% Triton‐X (Sigma), and blocked for 1 hour with 1% BSA in PBST. Samples were incubated with primary antibodies in 1% BSA overnight at 4°C and then incubated with secondary antibodies (Alexa‐488, Alexa‐594; Invitrogen, Carlsbad, CA, USA) at room temperature for 1 hour. All samples were counterstained with Hoechst 33342 and mounted in Fluoromount™ Aqueous Mounting Medium (Sigma). Cells were visualized at a magnification of 63× under a Zeiss Axioimager Z2 microscope (Zeiss Canada, North York, ON, Canada). ROIs were drawn around the cells on each optical section (based on NG2 or PDGFR‐α staining for OPCs and MBP staining for OLs). Then, ImageJ (NIH, Bethesda, MD, USA) was used for particle analysis. For intensity measurements to compare multiple specimens, staining and image acquisition were performed in parallel for the entire set. Identical reagents and processing were used, with identical image acquisition settings and exposure times.
2.7. Western blotting
Protein lysates were prepared, and Western blotting (WB) was performed using our standard protocols.5 Samples were loaded on 10% SDS polyacrylamide gel and then transferred to a polyvinylidene difluoride membrane. Membranes were blocked with 5% (w/v) milk in TBS buffer containing 0.05% Tween‐20 for 1 hour and then incubated with specifying primary antibodies overnight at room temperature. Blots were washed with TBS buffer and then incubated with peroxidase‐labeled secondary antibodies for 2 hours at room temperature. Peroxidase activity was visualized with an Enhanced Chemiluminescent Substrate kit (Perkin‐Elmer, PerkinElmer, Woodbridge, ON, Canada) according to the manufacturer's instructions. The optical density of the specific band was normalized based on the β‐actin. Chemiluminescent signals were captured by autoradiography and were used to assess protein content.
2.8. Transmission electron microscopy (TEM)
Animals were transcardially perfused with 5% glutaraldehyde/4% paraformaldehyde. The brains were then cut into 1‐mm‐thick sections, and the corpus callosum and external capsule were manually dissected out. Corpus callosum samples were fixed for 1 hour in a solution of 2.5% glutaraldehyde that was diluted with 0.1 mol/L Sorensen's buffer. Then, the samples were washed with 5% sucrose solution, which was made in 0.1 mol/L Sorensen's buffer, for 5 minutes and three times. Postfixation was processed by adding 1% OsO4 to the cell samples for 2 hours. After being dehydrated with graded alcohols and methanol, samples were embedded in epoxy resin and then dried in an oven at 60°C for 24 hours. A microtome (Leica, Concord, ON, Canada) was used to obtain thin sections, which were further mounted on copper grids. Finally, 2% uranyl acetate and 1% lead citrate were used to stain the samples. The prepared grids were analyzed with a transmission electron microscope (Philips CM‐10, Hillsboro, OR, USA) at 25°C. G ratios (the ratio of axon diameter to the axon plus myelin sheath diameter) were calculated using the ImageJ software for at least 100 fibers per animal.
2.9. Statistical analysis
All statistical analyses were performed using one‐way ANOVAs and Tukey post hoc tests. Differences were considered statistically significant at P < 0.05.
3. RESULTS
3.1. Profile of demyelination following ischemic injury
The local environment of a focal cerebral ischemia lesion deprives oligodendrocytes of glucose and oxygen. To mimic this, mice were subjected to transient middle cerebral artery (MCA) occlusion. The filament occlusion of the MCA is a well‐established method that elevates metabolic stresses in the moderately ischemic penumbra. This model simulates deficiency of blood flow to the brain seen in ischemia by occluding ~70%‐80% of the blood flow in the MCA. One‐hour occlusion was chosen based on pilot experiments, which was in line with commonly used occlusion time in mice. Following reperfusion for 72 hours, mice were euthanized and then analyzed.
To determine the severity of WM injury after reperfusion, we first assessed the lesions in areas of the brain that were frequently affected during intraluminal MCAO with TTC staining. Triphenyltetrazolium chloride (TTC) is an indicator of mitochondrial viability, and the ipsilateral ischemic hemisphere was identified to have a lack of staining in the cortex and striatum. Representative sections from sham‐operated and MCAO‐induced ischemic brains are presented in Figure 1A. In animals subjected to 1 hour of MCAO, brain infarct regions were observed in the ipsilateral corpus callosum, external capsule, and the surrounding gray matter at 72 hours of reperfusion after ischemia. Tissues within the boundaries of the peri‐infarct striatum were collected. As revealed in Figure 1B, white matter in the controls contained compact bundles of myelinated axons, with well‐defined septae. After MCAO, axons in the corpus callosum were swollen and appeared distorted. The myelinated axons in the MCAO model group were less compact. Vacuoles and myelin debris were apparent, and macrophage‐like cells could be frequently observed. To further study the demyelination after MCAO, the percentage of demyelinated axon (0.8 < G‐ratio < 1) and thick myelinated axon (G‐ratio < 0.8) were quantified with electron microscopy. Middle cerebral artery occlusion (MCAO) remarkably increased the percentage of demyelinated axons, as shown in Figure 1C.
Figure 1.
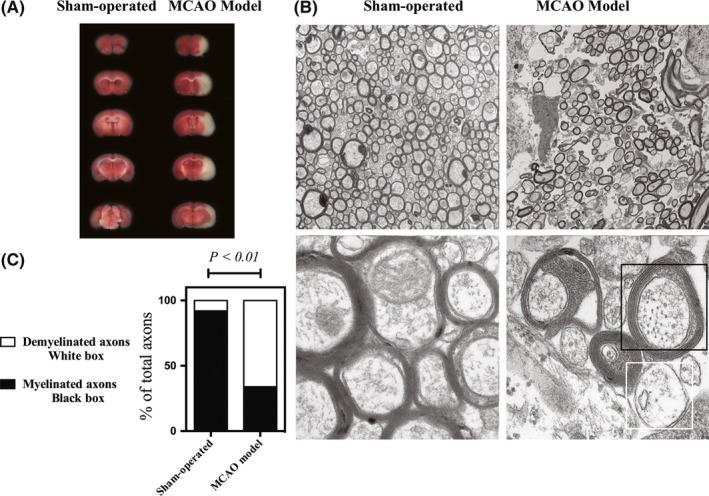
Profile of demyelination following ischemic injury. (A) Representative sections from sham‐operated and middle cerebral artery occlusion (MCAO)‐induced ischemic brains by triphenyltetrazolium chloride (TTC) staining. (B) Electron micrographs of myelinated axons in infarcted corpus callosum. Upper panels: Low magnification EM shows healthy myelinated axons in the control and damaged axons of varying size in the MCAO model. Lower panels: High magnification EM demonstrates ultrastructural details of myelinated axons in both groups. Note that vacuolization and myelin debris can be identified in the MCAO group. (C) The percentage of myelinated axon (black box) or demyelinated axon (white box) were quantified from electron microscopy
3.2. Expression of MCT1 is upregulated in the striatum but not in the cortex following ischemia
We then investigated the expression of MCT1 in the brain following ischemia. Protein samples prepared from the dorsal cortical region were analyzed by Western blotting to determine the levels of MCT1 (Figure 2A). Overall, no alterations of MCT1 expression were seen in the cortical region of the brain (Figure 2C). Levels of MCT1 were significantly higher in the ipsilateral striatum of MCAO animals than in the striatum of sham‐operated animals (Figure 2B,C). MCT1 siRNA (sc‐40115) was used to verify specificity of the MCT1 antibody Santa Cruz (sc‐50324). The MCT1 siRNA blocked the expression of MCT1 protein and the antibody was shown to be specific, yielded 38% and 30% silencing in OPCs and OLs, respectively (Figure 2D).
Figure 2.
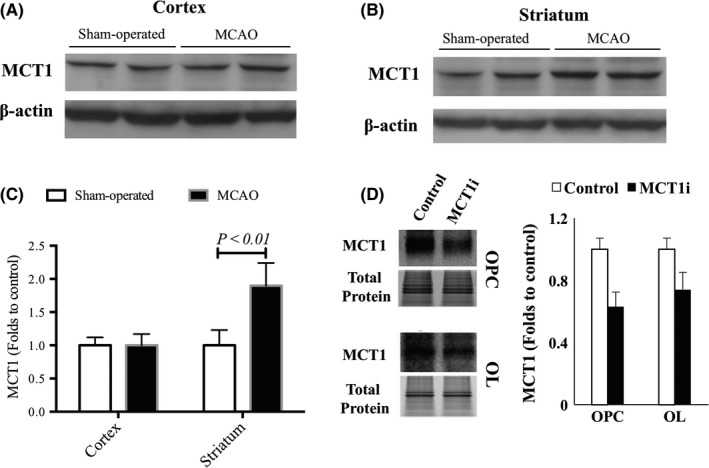
The levels of monocarboxylate transporter 1 (MCT1) are higher in the striatum but not the cortex following cerebral ischemia. (A) Representative immunoblot of MCT1 in sham‐operated and middle cerebral artery occlusion (MCAO) mice, ipsilateral cortex. (B) Representative immunoblot of MCT1 in sham‐operated and MCAO mice, ipsilateral striatum. (C) Quantitative data of MCT1 expression. (D) MCT1 siRNA was used to verify the specificity of MCT1 antibody. n = 6/group. P < 0.01 vs sham‐operated
3.3. Mature oligodendrocytes show reduced sensitivity to metabolic stresses in vitro
Previous studies showed that, in MCAO models, after the initial drop in blood flow, there was a significant increase in metabolic stresses within the peri‐infarct white matter.7 We next examined whether metabolic stresses may lead to differential response patterns in OPCs and OLs. An oligodendrocyte enrichment culture was generated from embryonic mouse neurospheres, and horse serum was used to increase the relative number of differentiated oligodendrocytes. To induce metabolic stresses, mild and severe oxygen‐glucose deprivations (OGD) were used for mimicking ischemic insults. Compared to astrocytes, which were also present in this culture, OLs and OPCs are more vulnerable to OGD as indicated by their decreased cell count after 1.5 hours OGD and 72 hours of reoxygenation (severe OGD) treatment (Figures 3G,4G).
Figure 3.
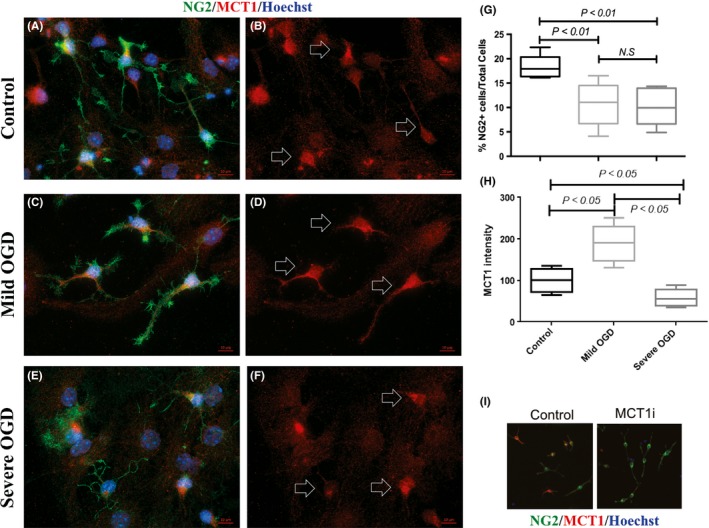
Effect of in vitro metabolic stress induced by oxygen‐glucose deprivations (OGD) on oligodendrocyte precursor cells (OPCs). Panels (A) (C) and E show representative microscopic images of OPCs with NG2 and monocarboxylate transporter 1 (MCT1) double immunofluorescent staining in control, mild OGD, and severe OGD groups, respectively. For a better display of MCT1 staining, Panels (B) (D) and (F) show the MCT1 labeling only. Signature MCT1 patterns are highlighted with arrows. Panel (G) shows the quantitative ratio of NG2+ OPC count to total cell count (mean ± SD). Panel (H) shows the relative intensity of MCT1 in the control, mild OGD, and severe OGD groups. Panel (I) shows the specificity of MCT1 antibody that verifies by MCT1 siRNA knockdown experiment. The experiment was performed in triplicate, and 30~50 images were taken for each coverslip. Scale bar = 10 μm
Figure 4.
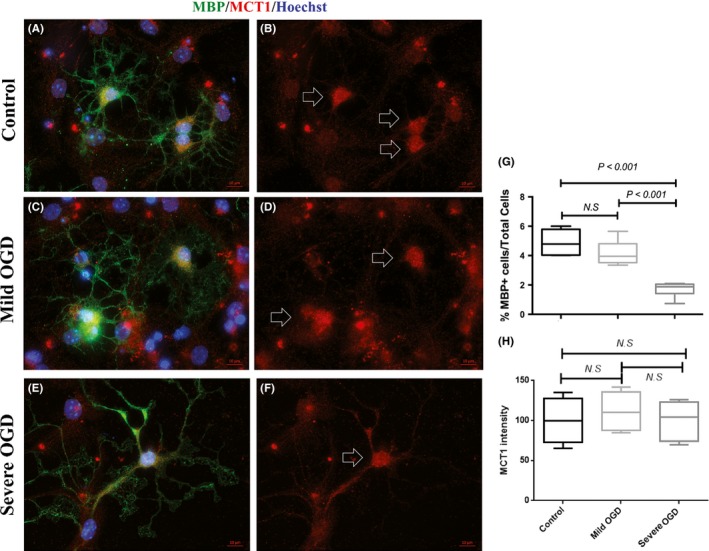
Effect of in vitro metabolic stress induced by oxygen‐glucose deprivations (OGD) on oligodendrocytes (OLs). Panels (A) (C) and (E) show representative microscopic images of OLs with MBP and monocarboxylate transporter 1 (MCT1) double immunofluorescent staining in control, mild OGD, and severe OGD groups, respectively. For a better display of MCT1 staining, Panels (B), (D) and (F) show the MCT1 labeling only. Signature MCT1 patterns are highlighted with arrows. Panel (G) shows the quantitative ratio of MBP+ OL count to total cell count (mean ± SD). Panel (H) shows the relative intensity of MCT1 in the control, mild OGD, and severe OGD groups. The experiment was performed in triplicate, and 30~50 images were taken for each coverslip. Scale bar = 10 μm
In normal culture condition, NG2‐positive OPCs had a polarized shape with a few long processes, while MBP‐positive OLs exhibited a spread‐out shape with multiple long processes (Figure 3A). Compared to the normal control, we found a significant reduction in NG2‐positive OPC count (from ~18% to ~11% of total cell count, Figure 3G) at 72 hours after 1 hour OGD (mild OGD), as well as 1.5 hours OGD (severe OGD, down to ~10% of total cell count, Figure 3G). Morphologically, most of the severe OGD‐treated OPCs retained relatively thinner and fewer processes (Figure 3E). Of the cells that acquired NG2‐positive immunoreactivity, the mild OGD group had significantly higher MCT1 fluorescence intensity when compared to the control group, while the severe OGD group had lower MCT1 fluorescence intensity when compared to the control group (Figure 3H). Moreover, in the OPC culture, MCT1 immunoreactivity existed on both cell processes and cell bodies for the control and mild OGD group (Figure 3B,D), whereas for the severe OGD group, MCT1 immunoreactivity was restricted to the cell bodies and was only visible around the nuclei (Figure 3F). NG2 and MCT1 dual staining were applied to check expression of MCT1 in the present or absent of MCT1 siRNA. In agreement with the previous knockdown result, the MCT1 siRNA blocked the expression of MCT1 protein and the antibody provided by Abcam (ab90582) was shown to be specific (Figure 3I).
The majority of control OLs contained cells with complex, multibranched morphologies, extending outwards in an elaborate network of lacy processes (Figure 4A). The MBP‐positive cells that were treated with both mild and severe OGD were larger than the controls and had multiple branches (Figure 4C,E). However, MBP‐positive cells did not exhibit obvious cell loss after mild OGD (Figure 4C). In contrast, cell count decreased significantly after severe OGD treatment (Figure 4G). The size increase in the OLs was also particularly apparent after severe OGD, as shown by the multiple and longer processes (Figure 4E). No differences in MCT1 immunoreactivity were seen between the three treatment groups (Figure 4H). These results indicate that OPCs are more susceptible to metabolic stress than differentiated OLs.
3.4. MCT1 is elevated in OPCs but not in OLs after OGD
The above results demonstrate that, in the oligodendrocyte enrichment culture, both OPCs and differentiated OLs express MCT1. We conducted another study afterward to further confirm this finding. We used postnatal rat pups to prepare enriched OPCs with a purity of up to 95%. Markers of astrocyte, including glial fibrillary acidic protein (GFAP) and GLAST, were both negative in the OPC culture (data not shown). Using this homogenous population of OPCs, we were able to use WB to test oligodendrocytic MCT1 expression following metabolic stresses. As shown in Figure 5, MCT1 was elevated in OPC cultures at 72 hours after 1‐hour OGD, which was in agreement with our immunostaining result.
Figure 5.
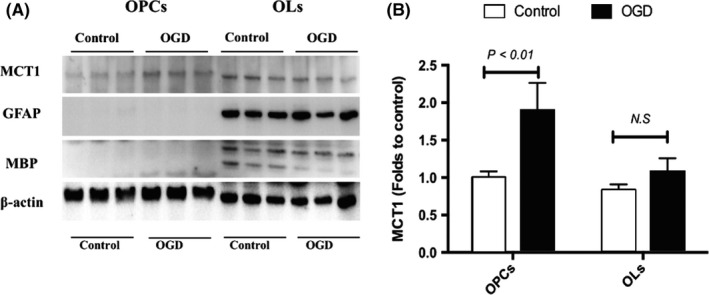
Monocarboxylate transporter 1 (MCT1) is elevated in oligodendrocyte precursor cells (OPCs) but not in oligodendrocytes (OLs) after oxygen‐glucose deprivations (OGD). (A) Representative immunoblot of MCT1, glial fibrillary acidic protein (GFAP), and MBP in control and OGD‐treated OPCs and OLs. (B) Quantitative data of MCT1 expression. The experiment was performed in triplicate, and the values were compared to controls
Isolated OPCs were then further differentiated into OLs. However, it should be noted that although we yielded a high purity of OPCs at initial preparation, astrocytes were still in existence. As differentiation continued, astrocyte contamination became more prominent as shown in the blot where GFAP, an astrocytic marker, was positive in the OL samples. In addition, in our previous immunohistochemistry tests, the commercially available antibody (Abcam, ab90582) generated positive staining in the cell type that was NG2 and MBP negative. MCT1 was present in small, punctate structures in the cytoplasm and at the cell membrane for those NG2/MBP cells. Given the fact that the oligodendrocyte enrichment cultures were derived from embryonic neurospheres, we speculate that those NG2/MBP cells are astrocytes. Our data are consistent with Rekha Hanu et al,8 who reported significant levels of MCT1 expression that mediates the uptake and release of monocarboxylic acids in the astrocyte. MCT1 protein expression in OLs shows an increase trend following OGD, but the increase is not statistically significant. Glial fibrillary acidic protein (GFAP) expression remains unaltered, indicating that astroglial activation and gliosis are not induced in this particular experimental setting.
3.5. Prolonged low‐glucose exposure triggers MCT1 loss in OPCs
To further assess whether metabolic stresses would modulate the subcellular MCT1 distribution in OPC and OLs, we examined the expression of MCT1 by a colocalization study. To maintain OPCs as well as OLs in culture, high glucose (25 mmol/L) and a wide spectrum of growth factors were needed. We induced starvation stress by removing the growth supplements and switching the high‐glucose (25 mmol/L) DMEM culture medium to low‐glucose (5.5 mmol/L) for 6 hours. We focused on the MCT1 within the cell processes because the energy‐activity coupling with the transportation of substrate is primarily through the endfoot membrane. As expected, double‐labeled immunofluorescent staining showed that MCT1 punctate spots on OPC processes (Figure 6A,B) decreased remarkably, but not on OLs processes (Figure 6C,D,E). Oligodendrocyte precursor cell (OPC) processes became thinner after prolonged low‐glucose exposure (Figure 6B).
Figure 6.
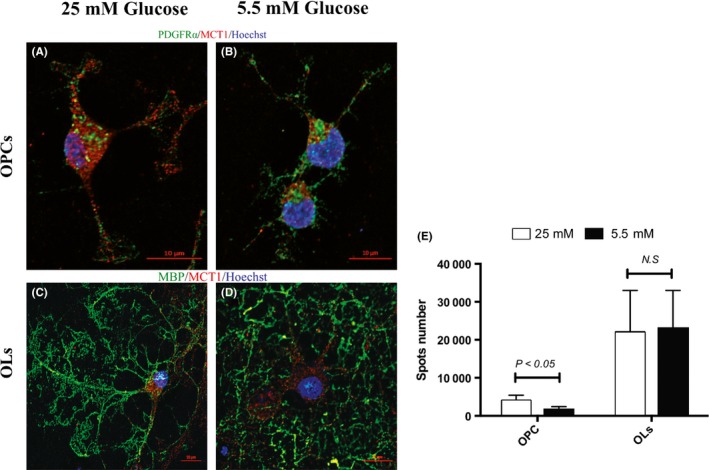
Prolonged low‐glucose exposure triggers monocarboxylate transporter 1 (MCT1) loss in oligodendrocyte precursor cells (OPCs). Panels (A) and (B) show representative microscopic images of OPCs with NG2 and MCT1 double immunofluorescent staining in 25 mmol/L glucose and 5.5 mmol/L glucose conditions. Panels (C) and (D) show representative microscopic images of oligodendrocytes (OLs) with MBP and MCT1 double immunofluorescent staining in 25 mmol/L glucose and 5.5 mmol/L glucose conditions. Panel (E) shows the quantitative MCT1 spot number on processes in each cell stage. The experiment was performed in triplicate, and 30~50 images were taken for each coverslip. Scale bar = 10 μm
4. DISCUSSION
Oligodendrocyte lineage cells rely heavily on MCT1 to import the primary energy metabolite lactate from astrocytes and the blood.9 Transfer of lactate from oligodendrocytes to axons through MCT1 is critical for the survival of axons. In an environment with sufficient glucose levels, inhibiting MCT1 is nontoxic to oligodendrocytes because oligodendrocytes can take up glucose for their metabolic needs.9 However, in a glucose deprivation environment, neurons are completely dependent on lactate as a source of energy, and addition of exogenous lactate could prevent neuron from death in such conditions. Downregulation or blockade of MCT1, which can be seen in patients with amyotrophic lateral sclerosis and in mice expressing mutations of the human SOD1 gene,10, 11 is associated with axon injury and neuronal loss.2, 12 Ischemic conditions such as stroke create stresses on trophic coupling in the peri‐infarct WM within the brain leading to cognitive dysfunction, emotional disorders, as well as sensorimotor deficits. In order to survive an injury, neurons need to reseal the damaged membranes, rearrange the cytoskeletal structures, and activate regrowth programs.13 Synthesis of raw materials, transport, and assembly of axonal components also require high levels of energy consumption. Thus, blocking lactate release from oligodendrocytes is detrimental to neurons, especially in an impaired energy production condition such as stroke.14 An indication of MCT1′s functional importance in the CNS comes from its spatial profile of expression. In contrary to what observed by Rosafio et al,15 our data revealed that, following ischemic stroke, MCT1 is only elevated at specific locations within regions of the peri‐infarct white matter. Our data showed no alteration in MCT1 expression in cortex but increased in striatum. This is likely because striatum contains greater numbers of myelinated axons than the cortex, and MCT1 has been detected in myelin at higher levels.2 Other possibilities such as MCAO methodology and timing may also influence to some extent the outcomes. Rosafio et al used a modified MCAO method that the right common carotid artery (CCA) was permanently ligated, and the reperfusion was through the Circle of Willis. In our model, suture was introduced from external carotid artery (ECA), and CCA was only ligated temporarily during surgery. Because reperfusion was directly through the right CCA, our surgical protocol would produce significantly greater blood flow at initial reperfusion. Moreover, our experiments were 1‐hour occlusion and 72‐hour reperfusion, compared to 30‐minute occlusion and 1 hours /24 hours reperfusion in Rosafio's study. We found that 45 minutes – 1 hour is a critical time for the development of reproducible lesions, and we examined the effects for a longer (72 hours) reperfusion time as MCAO might produce peak but possibly unstable infarct at 24‐48 hours of reperfusion, which might affect the experimental results. Based on this observation, we speculate that redistribution of energy substrates through elevated MCT1 on oligodendrocytes after stroke serves to satisfy increased neuronal energy need.
We applied an oligodendrocyte enrichment culture to study the characteristics of MCT1 in OPCs and OLs. In this type of culture, astrocytes, OPCs, and differentiated OLs are coexisting. Therefore, the possibility of indirect effects from lactate via astrocytes is included. As would be expected for astrocyte‐oligodendrocyte interaction, oligodendrocytes interact closely with neighboring cells. This coculture model provides evidence for astrocyte‐oligodendrocyte energy coupling. For example, the presence of astrocytes could be beneficial. This is because astrocyte is the primary energy store in the brain. It takes up glucose from the blood and then converts it into glycogen for storage. Glycogen is highly enriched in white matter such as the corpus callosum where astrocyte density is high.16 Meanwhile, studies on glycogen phosphorylase inhibitor—DAB showed that, by inhibiting the hydrolysis of glycogen, DAB suppresses lactate release and worsens the outcome in myelin remodeling.17 Therefore, the role of lactate in response to metabolic demand is critical.
In the present study, severe OGD was used to mimic ischemic core, which caused death of both OPCs and OLs as determined by total cell count, while MCT1 intensity remained unchanged in OLs. This suggests that the OLs are at least partially functional after starvation stress. In a previous study, OPCs were reportedly increased in proliferation and differentiation after stroke in the peri‐infarct white matter.18 However, our data showed that OPC cell count was dramatically reduced after mild or severe OGD stimuli. As well, most of the surviving OPCs that were only subjected to mild OGD treatment had a higher MCT1 intensity, and they were closely associated with the other MCT1‐positive cells in the culture, presumably astrocytes. We applied the same mild OGD stimuli to “pure” OPCs and confirmed the finding that MCT1 is upregulated in OPCs. It has been a technical challenge to accurately obtain high‐purity differentiated OLs. Although we used 95% purified OPCs for the differentiation, the NG2+/PDGFRα+ OPCs can also be converted to astrocytes as previously reported in the literature. For this reason, although we did not detect any difference in MCT1 expression in OLs that underwent mild OGD, the possibility of influence from astrocytic MCT1 cannot be excluded.
Transportation of energy substrates via MCT1 can be enhanced by replacement of extracellular glucose with sodium lactate or sodium pyruvate, as would be expected for shifts in substrate usage. As reported, injury to the brain or spinal cord with demyelination usually has an increased concentration of lactate. We subjected the OPC/OC cultures to a prolonged exposure of a reduced glucose concentration, 5.5 mmol/L, and found that MCT1 on OPC processes decreased remarkably, whereas OLs did not show a significant difference. In agreement with our previous data, failure to make a metabolic shift may contribute to OPC damage, thereby negatively impact WM repair.
Other than the metabolically supportive role of oligodendrocytes, research on the correlation between oligodendrocytic MCT1 expression/function and vulnerability is still limited. In the present study, we compared the differential response of OPCs and OLs under basal and metabolic stress conditions. The susceptibility to metabolic stress is associated with a distinct profile of MCT1, suggesting that MCT1 function could play a prime role in the survival of OPCs and OLs in their response to ischemic WM injury. Of note, the responsiveness during metabolic stresses and WM remodeling is complicated. Therefore, additional mechanistic studies are warranted to facilitate the understanding of demyelination.
CONFLICT OF INTEREST
The authors declare no conflict of interest.
ACKNOWLEDGMENTS
This study was supported by the Canadian Institutes of Health Research, Brain Canada, and ALS Canada. The authors wish to thank Vicky Zhang for her assistance in preparing the manuscript.
Zhou P, Guan T, Jiang Z, Namaka M, Huang Q‐J, Kong J‐M. Monocarboxylate transporter 1 and the vulnerability of oligodendrocyte lineage cells to metabolic stresses. CNS Neurosci Ther. 2018;24:126–134. 10.1111/cns.12782
The first two authors contributed equally to this work.
REFERENCES
- 1. Seidl AH. Regulation of conduction time along axons. Neuroscience. 2014;276:126‐134. [DOI] [PMC free article] [PubMed] [Google Scholar]
- 2. Lee Y, Morrison BM, Li Y, et al. Oligodendroglia metabolically support axons and contribute to neurodegeneration. Nature. 2012;487:443‐448. [DOI] [PMC free article] [PubMed] [Google Scholar]
- 3. Saab AS, Tzvetavona ID, Trevisiol A, et al. Oligodendroglial NMDA receptors regulate glucose import and axonal energy metabolism. Neuron. 2016;91:119‐132. [DOI] [PMC free article] [PubMed] [Google Scholar]
- 4. Elitt CM, Rosenberg PA. The challenge of understanding cerebral white matter injury in the premature infant. Neuroscience. 2014;276:216‐238. [DOI] [PMC free article] [PubMed] [Google Scholar]
- 5. Li C, Guan T, Chen X, et al. BNIP3 mediates pre‐myelinating oligodendrocyte cell death in hypoxia and ischemia. J Neurochem. 2013;127:426‐433. [DOI] [PubMed] [Google Scholar]
- 6. McCarthy KD, de Vellis J. Preparation of separate astroglial and oligodendroglial cell cultures from rat cerebral tissue. J Cell Biol. 1980;85:890‐902. [DOI] [PMC free article] [PubMed] [Google Scholar]
- 7. Sairanen T, Karjalainen‐Lindsberg ML, Paetau A, Ijas P, Lindsberg PJ. Apoptosis dominant in the periinfarct area of human ischaemic stroke–a possible target of antiapoptotic treatments. Brain. 2006;129:189‐199. [DOI] [PubMed] [Google Scholar]
- 8. Hanu R, McKenna M, O'Neill A, Resneck WG, Bloch RJ. Monocarboxylic acid transporters, MCT1 and MCT2, in cortical astrocytes in vitro and in vivo. Am J Physiol Cell Physiol. 2000;278:C921‐C930. [DOI] [PubMed] [Google Scholar]
- 9. Rinholm JE, Hamilton NB, Kessaris N, Richardson WD, Bergersen LH, Attwell D. Regulation of oligodendrocyte development and myelination by glucose and lactate. J Neurosci. 2011;31:538‐548. [DOI] [PMC free article] [PubMed] [Google Scholar]
- 10. Morrison BM, Lee Y, Rothstein JD. Oligodendroglia: metabolic supporters of axons. Trends Cell Biol. 2013;23:644‐651. [DOI] [PMC free article] [PubMed] [Google Scholar]
- 11. Philips T, Rothstein JD. Glial cells in amyotrophic lateral sclerosis. Exp Neurol. 2014;262 Pt B:111‐120. [DOI] [PMC free article] [PubMed] [Google Scholar]
- 12. Martinez BA. Lactate‐starved neurons in ALS. Dis Model Mech. 2012;5:711‐712. [DOI] [PMC free article] [PubMed] [Google Scholar]
- 13. Bradke F, Fawcett JW, Spira ME. Assembly of a new growth cone after axotomy: the precursor to axon regeneration. Nat Rev Neurosci. 2012;13:183‐193. [DOI] [PubMed] [Google Scholar]
- 14. Bergersen LH. Lactate transport and signaling in the brain: potential therapeutic targets and roles in body‐brain interaction. J Cereb Blood Flow Metab. 2015;35:176‐185. [DOI] [PMC free article] [PubMed] [Google Scholar]
- 15. Rosafio K, Castillo X, Hirt L, Pellerin L. Cell‐specific modulation of monocarboxylate transporter expression contributes to the metabolic reprograming taking place following cerebral ischemia. Neuroscience. 2016;317:108‐120. [DOI] [PubMed] [Google Scholar]
- 16. Kong J, Shepel PN, Holden CP, Mackiewicz M, Pack AI, Geiger JD. Brain glycogen decreases with increased periods of wakefulness: implications for homeostatic drive to sleep. J Neurosci. 2002;22:5581‐5587. [DOI] [PMC free article] [PubMed] [Google Scholar]
- 17. Ichihara Y, Doi T, Ryu Y, Nagao M, Sawada Y, Ogata T. Oligodendrocyte progenitor cells directly utilize lactate for promoting cell cycling and differentiation. J Cell Physiol 2017;232:986‐995. [DOI] [PMC free article] [PubMed] [Google Scholar]
- 18. Kassis H, Chopp M, Liu XS, Shehadah A, Roberts C, Zhang ZG. Histone deacetylase expression in white matter oligodendrocytes after stroke. Neurochem Int. 2014;77:17‐23. [DOI] [PMC free article] [PubMed] [Google Scholar]


